Article

Hydrogeochemistry, Geothermometry, and Sourcing of High Dissolved Boron, Tungsten, and Chlorine Concentrations in the Trans-Himalayan Hotsprings of Ladakh, India

1
Birbal Sahni Institute of Palaeosciences, 53 University Road, Lucknow 226007, India
2
Institute for Global Environmental Strategies, Hayama 240-0115, Japan
3
CSIR-Indian Institute of Toxicology Research, Vishvigyan Bhawan, 31 Mahatma Gandhi Marg, Lucknow 226001, India
4
School of Environmental Sciences, Jawaharlal Nehru University, New Delhi 110067, India
*
Authors to whom correspondence should be addressed.
Hydrology 2023, 10(6), 118; https://doi.org/10.3390/hydrology10060118
Submission received: 23 March 2023 / Revised: 7 May 2023 / Accepted: 22 May 2023 / Published: 24 May 2023
(This article belongs to the Special Issue Groundwater Decline and Depletion)

Abstract

:
Boron (B) and Tungsten (W) are often found enriched in high-temperature geothermal waters associated with the development of subduction-related mafic to felsic arc magma. However, knowledge about the sourcing and transportation of these elements from such hydrothermal systems is sparse and ambiguous. Being the only active continental collision site in the world, the Trans-Himalaya offers a unique chance to study how continental collision sources the high boron and tungsten concentrations in geothermal fluids. This study investigated the distribution of trace elements, major cations, and anions in three physicochemically distinct hotspring sites in the Ladakh region. The results were integrated with the existing geochemical and isotopic data to address the research problem more effectively. This study exhibits that the extreme concentrations of boron, sodium, chlorine, potassium, and tungsten in the hotspring waters were primarily governed by magmatic fluid inputs. In addition, this study recorded the highest-ever chlorine and boron concentrations for the Trans-Himalayan hotspring waters. The highest-ever boron and chlorine concentrations in the hotspring waters probably represented an increase in magmatic activity in the deeper source zone.

1. Introduction

Among the trace elements, B, Mo, and W are present in trace amounts in the Earth’s surface water under normal conditions [1,2,3,4]. However, in high-temperature hydrothermal waters, their concentrations are significantly higher, especially B and W, which often show extreme enrichments [5,6,7,8,9,10,11,12]. Some studies have investigated the causes of unusually high concentrations of these elements in hydrothermal waters and have concluded that their primary source is rock–water interactions/rock leaching at high temperatures, with little to no contribution from subsurface magmatic activity [5,6,8,9,10,11]. However, these conclusions do not appear to be supported by solid evidence at present, and new direct confirmation is required.
While the mobility of B, Mo, and W might vary depending on the physicochemical makeup of the water, the relative concentrations of these elements in water are generally expected to depend on the prevailing lithologies [3,6,8,11]. For instance, even though Mo and W have chemical properties similar to each other, Mo is more mobile under an oxidized condition, and its solubility increases with an increase in salinity, whereas in a highly reduced sulfidic condition, Mo is easily removed from water by its precipitation in the form of pyrite [3]. Conversely, W is relatively insensitive to redox changes. Rather, it shows increased mobility in a sulfidic environment [3]. In most cases, W is removed from waters by precipitation with Fe and Mn oxyhydroxides [13,14]. Other major factors that have been suggested to affect the extraction, mobility, and concentration of these elements from magma and rocks into geothermal waters include the geothermal reservoir temperature, phase separation into vapor and liquid phases [15], and effect of salinity or Cl content on the partitioning of these elements between melt and liquid phases [16].
The Trans-Himalaya hosts a magmatic belt running along the Indus–Tsangpo Suture Zone (ITSZ), which marks the surface expression of the contact between the Tibetan Plateau of the Asian Plate to the north and the Indian Plate to the south [17]. Geothermal activity is widespread along the magmatic belt [5,6,8,18,19,20,21]. However, comprehensive research on the sourcing and transportation of B, Mo, and W from the Trans-Himalayan hotsprings is rare and only available from the Tibet region [5,6,7,8]. No such research has been completed from the Indian territory of the Trans-Himalaya. Thus, the goal of the present study is to determine the distribution of B, Mo, and W in discharge waters of physicochemically and attitudinally distinct hotspring sites: Panamik in the Nubra Valley, and Chumathang and Puga in the Indus Valley of Ladakh, India to ascertain their source and transportation. To effectively address the issue, we have combined our elemental data with the published geochemical and isotopic data from the geothermal sites, local rivers, meteoric waters, and local volcanic rocks.

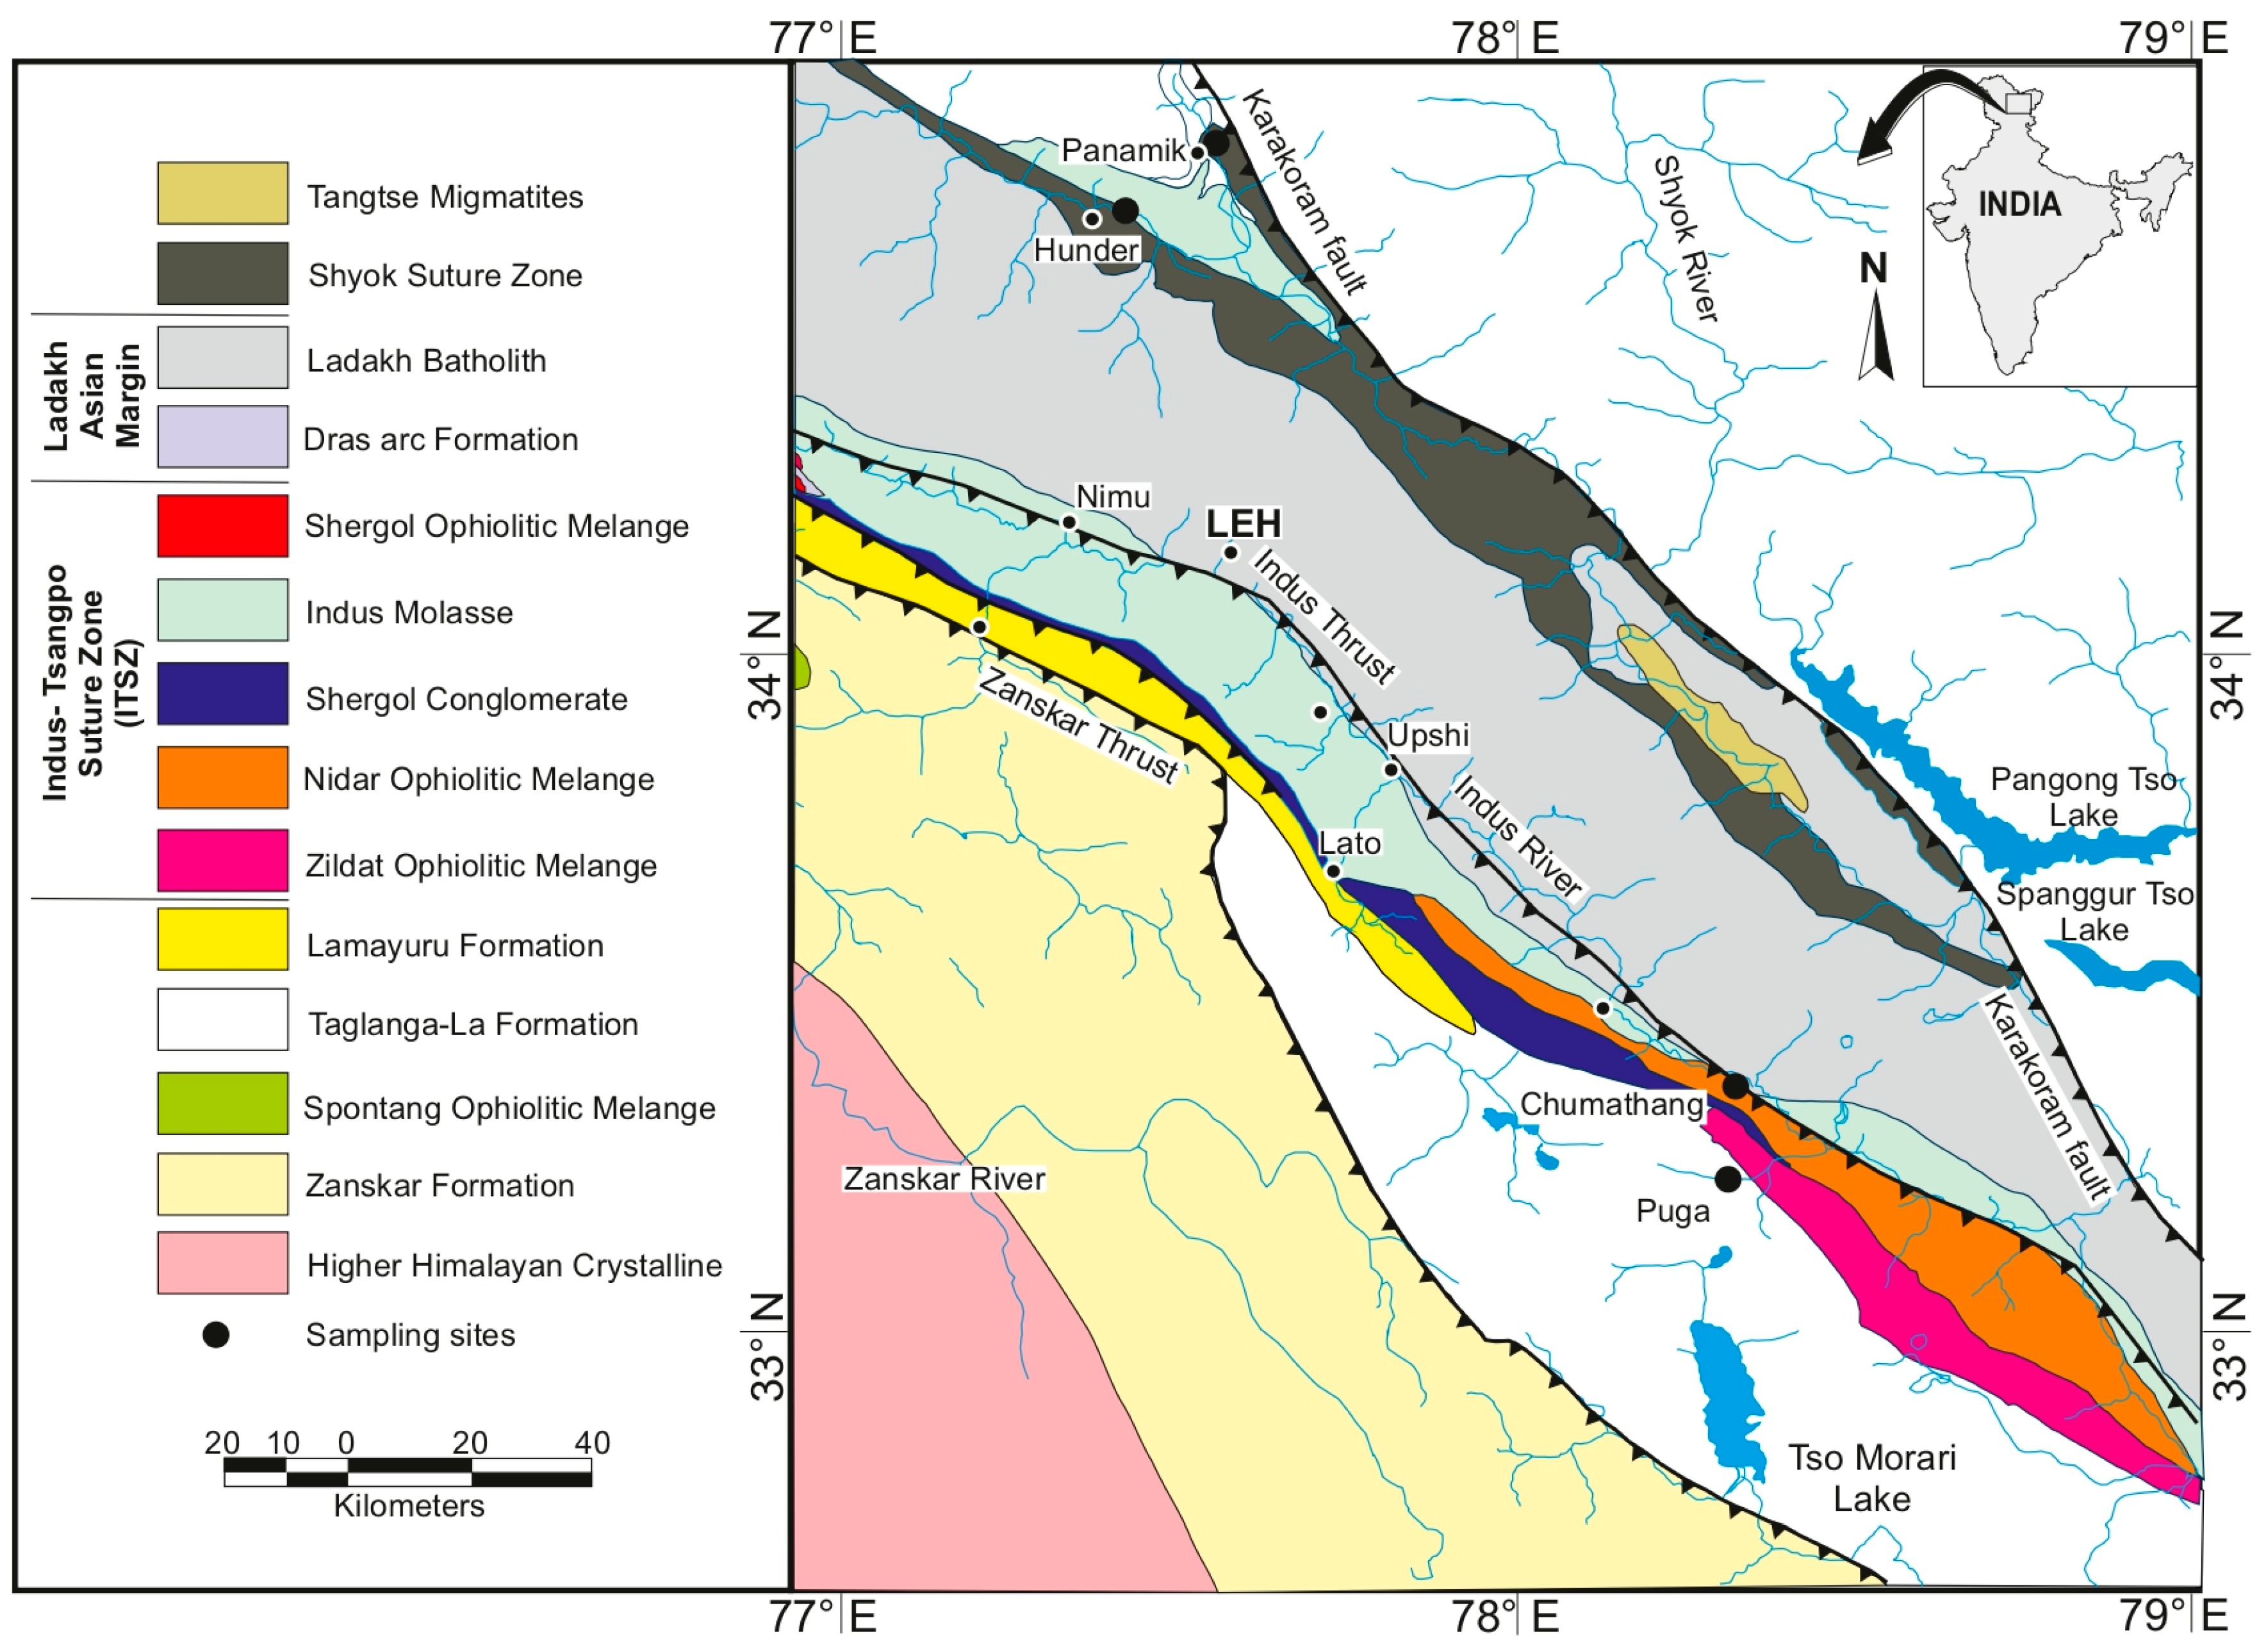
2. Field Sites and Geology

The Indus and the Nubra valleys are two prominent geothermal zones in Ladakh. The Indus Valley has three geothermal fields—Puga, Chumathang, and Gaik that host more than a hundred hotsprings [18,19,21,22]. Chumathang is located 92 km southeast of Upshi towards the Upshi-Hanle Road, and Puga can be reached from Chumathang by traveling another 20 km down the Upshi-Hanle Road and then taking a southwest diversion across the Indus River and traveling an additional 20 km. The Nubra Valley is home to three geothermal sites—Panamik, Pulthang, and Changlung. Panamik is located 26 km north of the Sumur village and can be reached through the road running along the Nubra River. In this study we performed the geochemical investigation on the hotsprings of Panamik (34°31′49.66″ N, 77°32′34.30″ E; altitude = 3209 m amsl), Chumathang (33°21′36.77″ N, 78°19′25.77″ E; altitude = 3993 m amsl), and Puga (33°13′06.27″ N, 78°19′17.44″ E; altitude = 4375 m amsl) geothermal fields (Figure 1).

3. Methodology

3.1. In-Situ Physicochemical Measurements and Water Sample Collection

For the geochemical study, hotspring water samples were collected from 11 sites in Puga (see PUGA series in Table 1), 5 sites in Chumathang (see CHTNG series in Table 1), and 13 sites in Panamik (see PAN series in Table 1). One water sample was also collected from the Shyok River in Hunder village (34°34′19.18″ N, 77°29′37.40″ E; altitude = 3055 m). The pH and temperature were measured by pre-calibrated Systronics Water Analyzer 371. At each site, the water sample was first collected in a new 60 mL sterile polypropylene syringe pre-washed with the same water three times. Then the water was passed into a new 60 mL sterile polypropylene centrifuge tube (Tarsons) through a syringe fitted 0.22 μm filter (Merck). Initial filtered water was used to wash the centrifuge tube thrice before collecting the final sample. These centrifuge tubes containing the filtered water samples were stored in an ice box and transported to BSIP and CSIR-IITR in Lucknow for the analysis work.

3.2. Trace and Major Elements Analysis

Ten mL of the filtered water samples were transferred in polytetrafluoroethylene (PTEF) vials and acidified by adding 100 μL of analytical grade HNO3 (65%, Merck). Afterward, mixed-element reference solutions of (1) 71A, 71B, and 71D multi-element for ICP-MS analysis (trace elements, i.e., Mo, W), and (2) single-elements for ICP-OES analysis (other elements, i.e., B, Na, K, Ca, Mg), were prepared in 1% v/v HNO3. For the preparation of the HNO3 solution and dilution of stock standards, 18.2 MΩcm−1 Milli-Q water was used. One internal standard Rhodium (Rh) and a tune solution were added to all solutions to correct the matrix effects and compensate for possible changes in apparatus function during the ICP-OES measurements. These measurements were conducted by using the quadrupole ICP-MS (Agilent 7700 series) and Agilent 5800 ICP-OES facility at BSIP, Lucknow. The error of replicate analyses was better than 5% for ICP-MS and better than 2% for ICP-OES.

3.3. Ions Analysis

For determination of Cl and SO4 concentrations, the samples were analyzed following USEPA 300.1 A and B method [24], using a 940-Professional IC Vario instrument (Metrohm AG, Herisau, Switzerland) equipped with a conductivity detector at CSIR-IITR, Lucknow. For each run, 20 mL of the filtered sample was injected, and a method was developed for a run time of 30 min for anions. Automatic integration with MagIC Net Software using peak area opted for quantification of ions. Cl and SO4 were measured using standard column- Metrosep A Supp 5 (250/4.0), eluent- 3.2 mM sodium carbonate and 1.0 mM sodium bicarbonate, suppressor solution—50 mM H2SO4, at a flow rate of 0.18 mL/min. The error of replicate analyses was better than 5% for both ions.

4. Results

Aqueous Geochemistry

The pH, temperature, and geochemical composition of the hotspring waters are provided in Table 1. The results show that Panamik, Chumathang, and Puga hotsprings all have unique aqueous geochemistry. Hotspring waters in Puga geothermal field showed a more prominent pH variation (5.60 to 10.24) compared to hotspring waters in Panamik geothermal field (7.96 to 11.20) and the Chumathang geothermal field (7.14 to 8.40). The hotspring waters were found to be significantly enriched in B, Na, K, Cl, Mo, and W when compared to the geochemical composition of the Shyok River and published geochemical data from several Ladakh rivers [23]. In contrast, the hotspring waters showed substantial depletion of Ca and Mg, except in Panamik, which demonstrated Ca, Mg, and K concentrations comparable to that of the Ladakh rivers. These elements can be categorized into two primary groups: (1) B, Na, Cl, K, and W, which exhibited a rise in concentration with the increase in altitude and decrease in average pH; (2) Mo, which showed an increase in concentration with the decrease in altitude and increase in average pH. Elements of one group showed a positive correlation with each other but a negative correlation with elements in another group (Figure 2 and Figure 3).
The reservoir temperature estimated using Na-K-Mg geothermometry (Equation (2), after Giggenbach [25]) for Panamik, Chumathang, and Puga geothermal systems were 172 ± 1 °C, 205 ± 2 °C, and 268 ± 1 °C, respectively (Figure 4). The difference between the reservoir temperature and the discharge water temperature of Panamik, Chumathang, and Puga hotsprings were 104 ± 3 °C, 128 ± 10 °C, and 212 ± 16 °C, respectively. High reservoir temperatures were associated with higher concentrations of B, Na, Cl, K, and W and a lower concentration of Mo in hotspring waters (Figure 2). The reservoir temperature showed a strong negative correlation with Mo but a strong positive correlation with W (Figure 2). The Cl-SO4-HCO3 ternary plot [26] shows that most Puga hotspring waters fall in the mature water zone, Panamik hotspring waters fall in the steam-heated water zone, and Chumathang hotspring waters fall between these two zones (Figure 5).
Plotting δD against δ18O shows that the values of Puga hotspring waters consistently lie on the meteoric water-magmatic water mixing line, the values of Chumathang hotspring waters range from the meteoric water line to meteoric water-magmatic water mixing line, and the values of Panamik hotspring waters lies adjacent to the meteoric water line (Figure 6).

5. Discussion

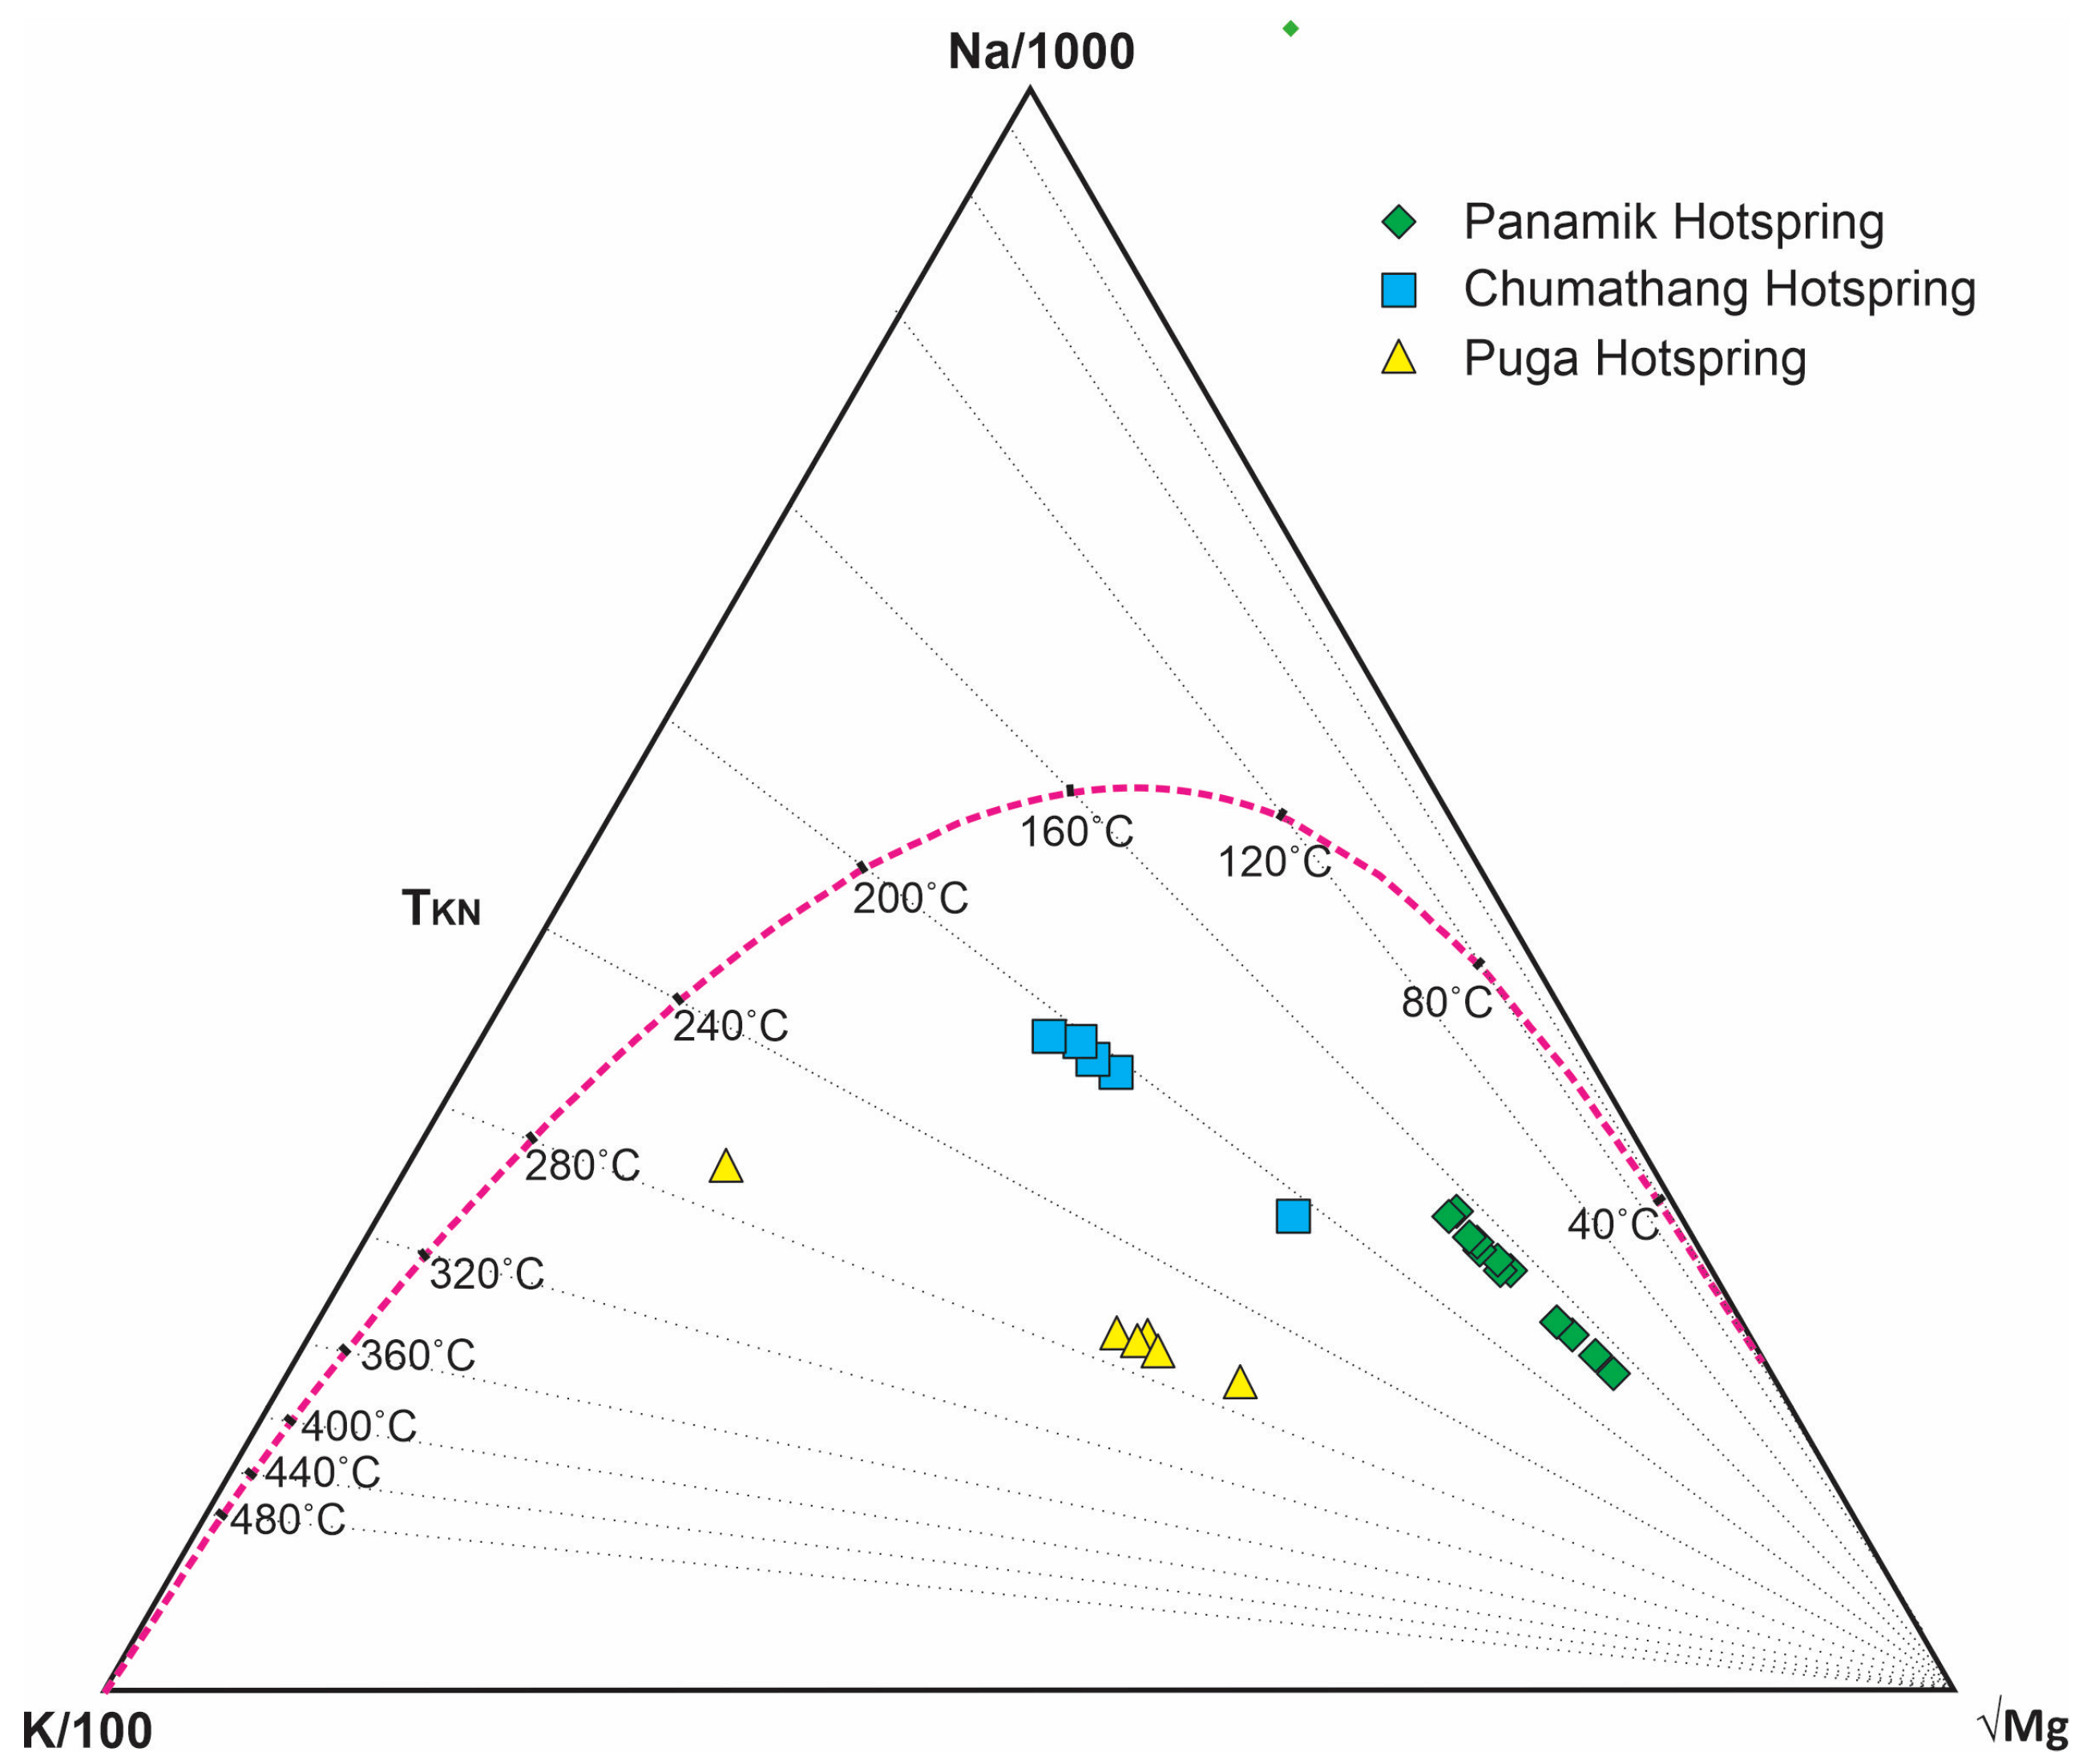
5.1. Reservoir Temperature, Magmatic Water Input, and Rock-Water Interactions

According to Giggenbach [25], the relative content of Na, K, Mg, and Ca in geothermal water in equilibrium with source minerals (albite, chlorite, and feldspar, respectively) at a given temperature is unique and can be used as a method of comparison with observed compositions. He applied these findings to a wide range of geothermal discharges and found two subsystems, (1) Na-K-Mg and (2) K-Mg-Ca, to be very effective in the evaluation of physical and chemical conditions within geothermal systems. Temperature-dependent interactions between the fluids and aluminum silicates are believed to control the first subsystem’s components, and their relative concentrations can thus be predicted as indicators of water–rock equilibrium temperatures. Based on the wide range of observations of geothermal waters, Giggenbach (1986) formulated two equations: (1) that demonstrate a relationship between reservoir temperature and the Na-K content of geothermal discharge; and (2) that demonstrate a relationship between reservoir temperature and K-Mg content of geothermal discharge.
log(K/Na) = 1.75 − (1390/T)
log(K2/Mg) = 13.95 − (4410/T)
In the above equations, Na, K, and Mg denote their concentrations in mgL−1 (ppm). For this study, we used Equation (1) for estimating reservoir temperature since Na and K display a strong correlation with Cl, and the temperature calculated from this equation is consistent across geothermal fields (Figure 3). However, Mg shows a weak correlation with Cl, and the reservoir temperature estimated using Equation (2) shows no consistency.
The reservoir temperatures of Panamik, Chumathang, and Puga geothermal systems estimated by using Na-K-Mg thermometry (Figure 4) are compatible with earlier published records estimated by using other geothermometry and reservoir modeling methods [19,20,22,30,31,32]. The difference between the estimated reservoir temperature (TKN) and the surface discharge water temperature for each geothermal system infers that the reservoir depths are in the following order: Puga > Chumathang > Panamik. Based on the geophysical studies, Azeez and Harinarayana [32] estimated that Puga geothermal system’s reservoir might be situated at around 2–3 km depth beneath the surface, whilst such data is currently unavailable from Chumathang and Panamik geothermal systems. The cooling of the geothermal waters moving upwards from the reservoir represents the conductive heat loss during its interaction with rocks and mixing with meteoric waters. These interactions often lead to a change in the primary chemical composition of geothermal waters.

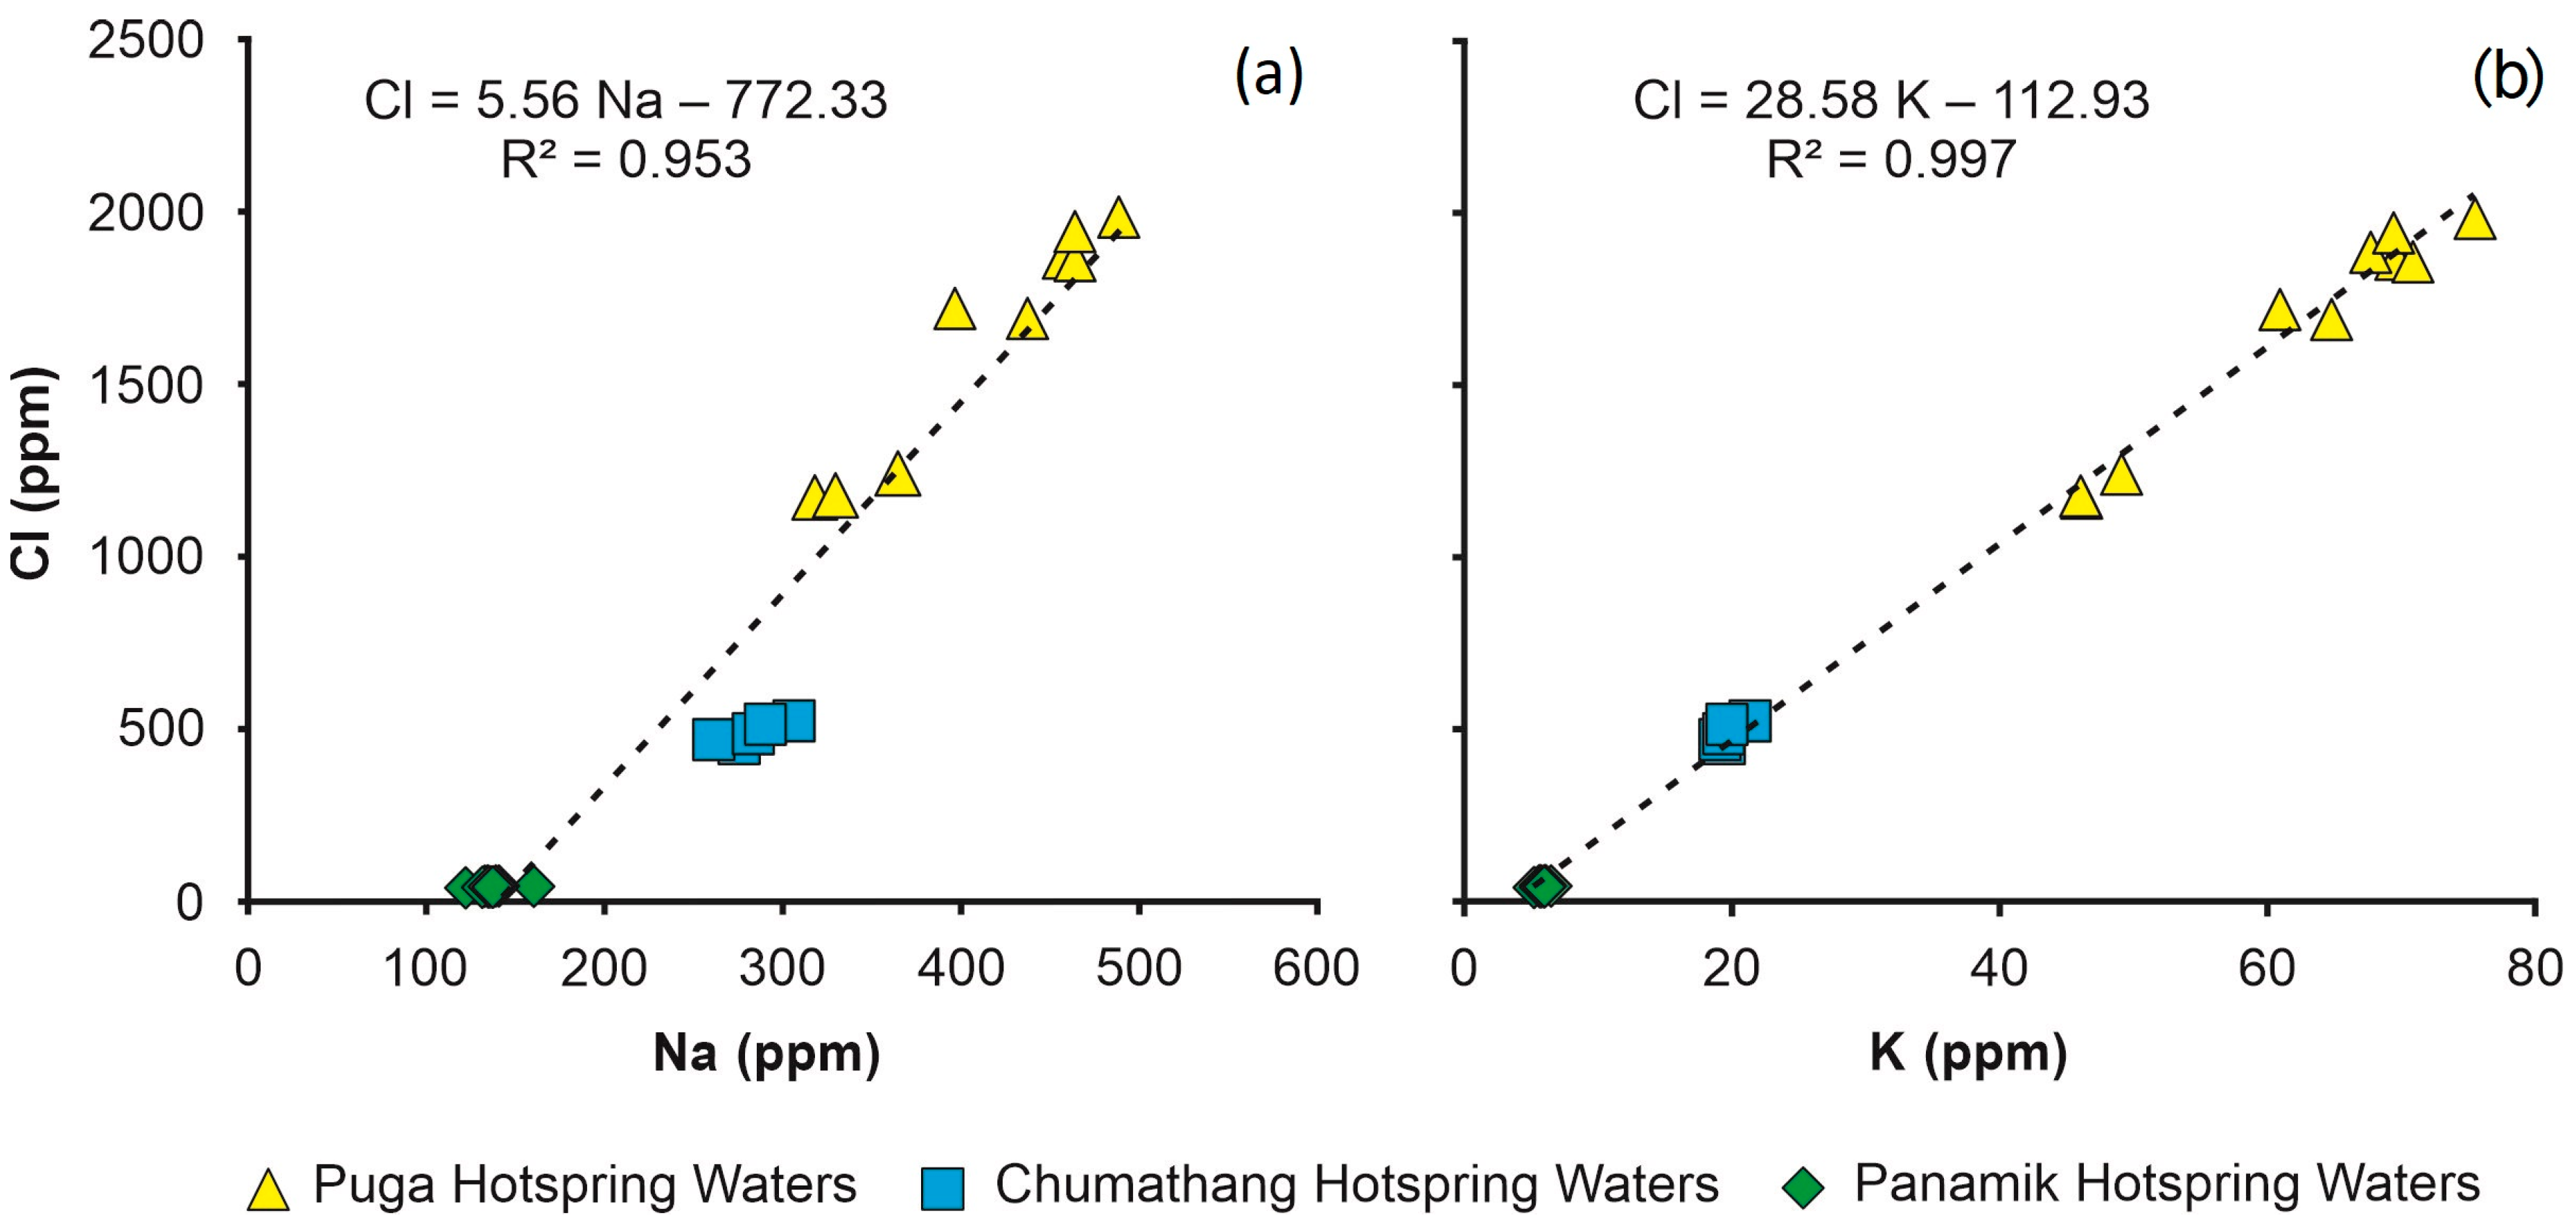
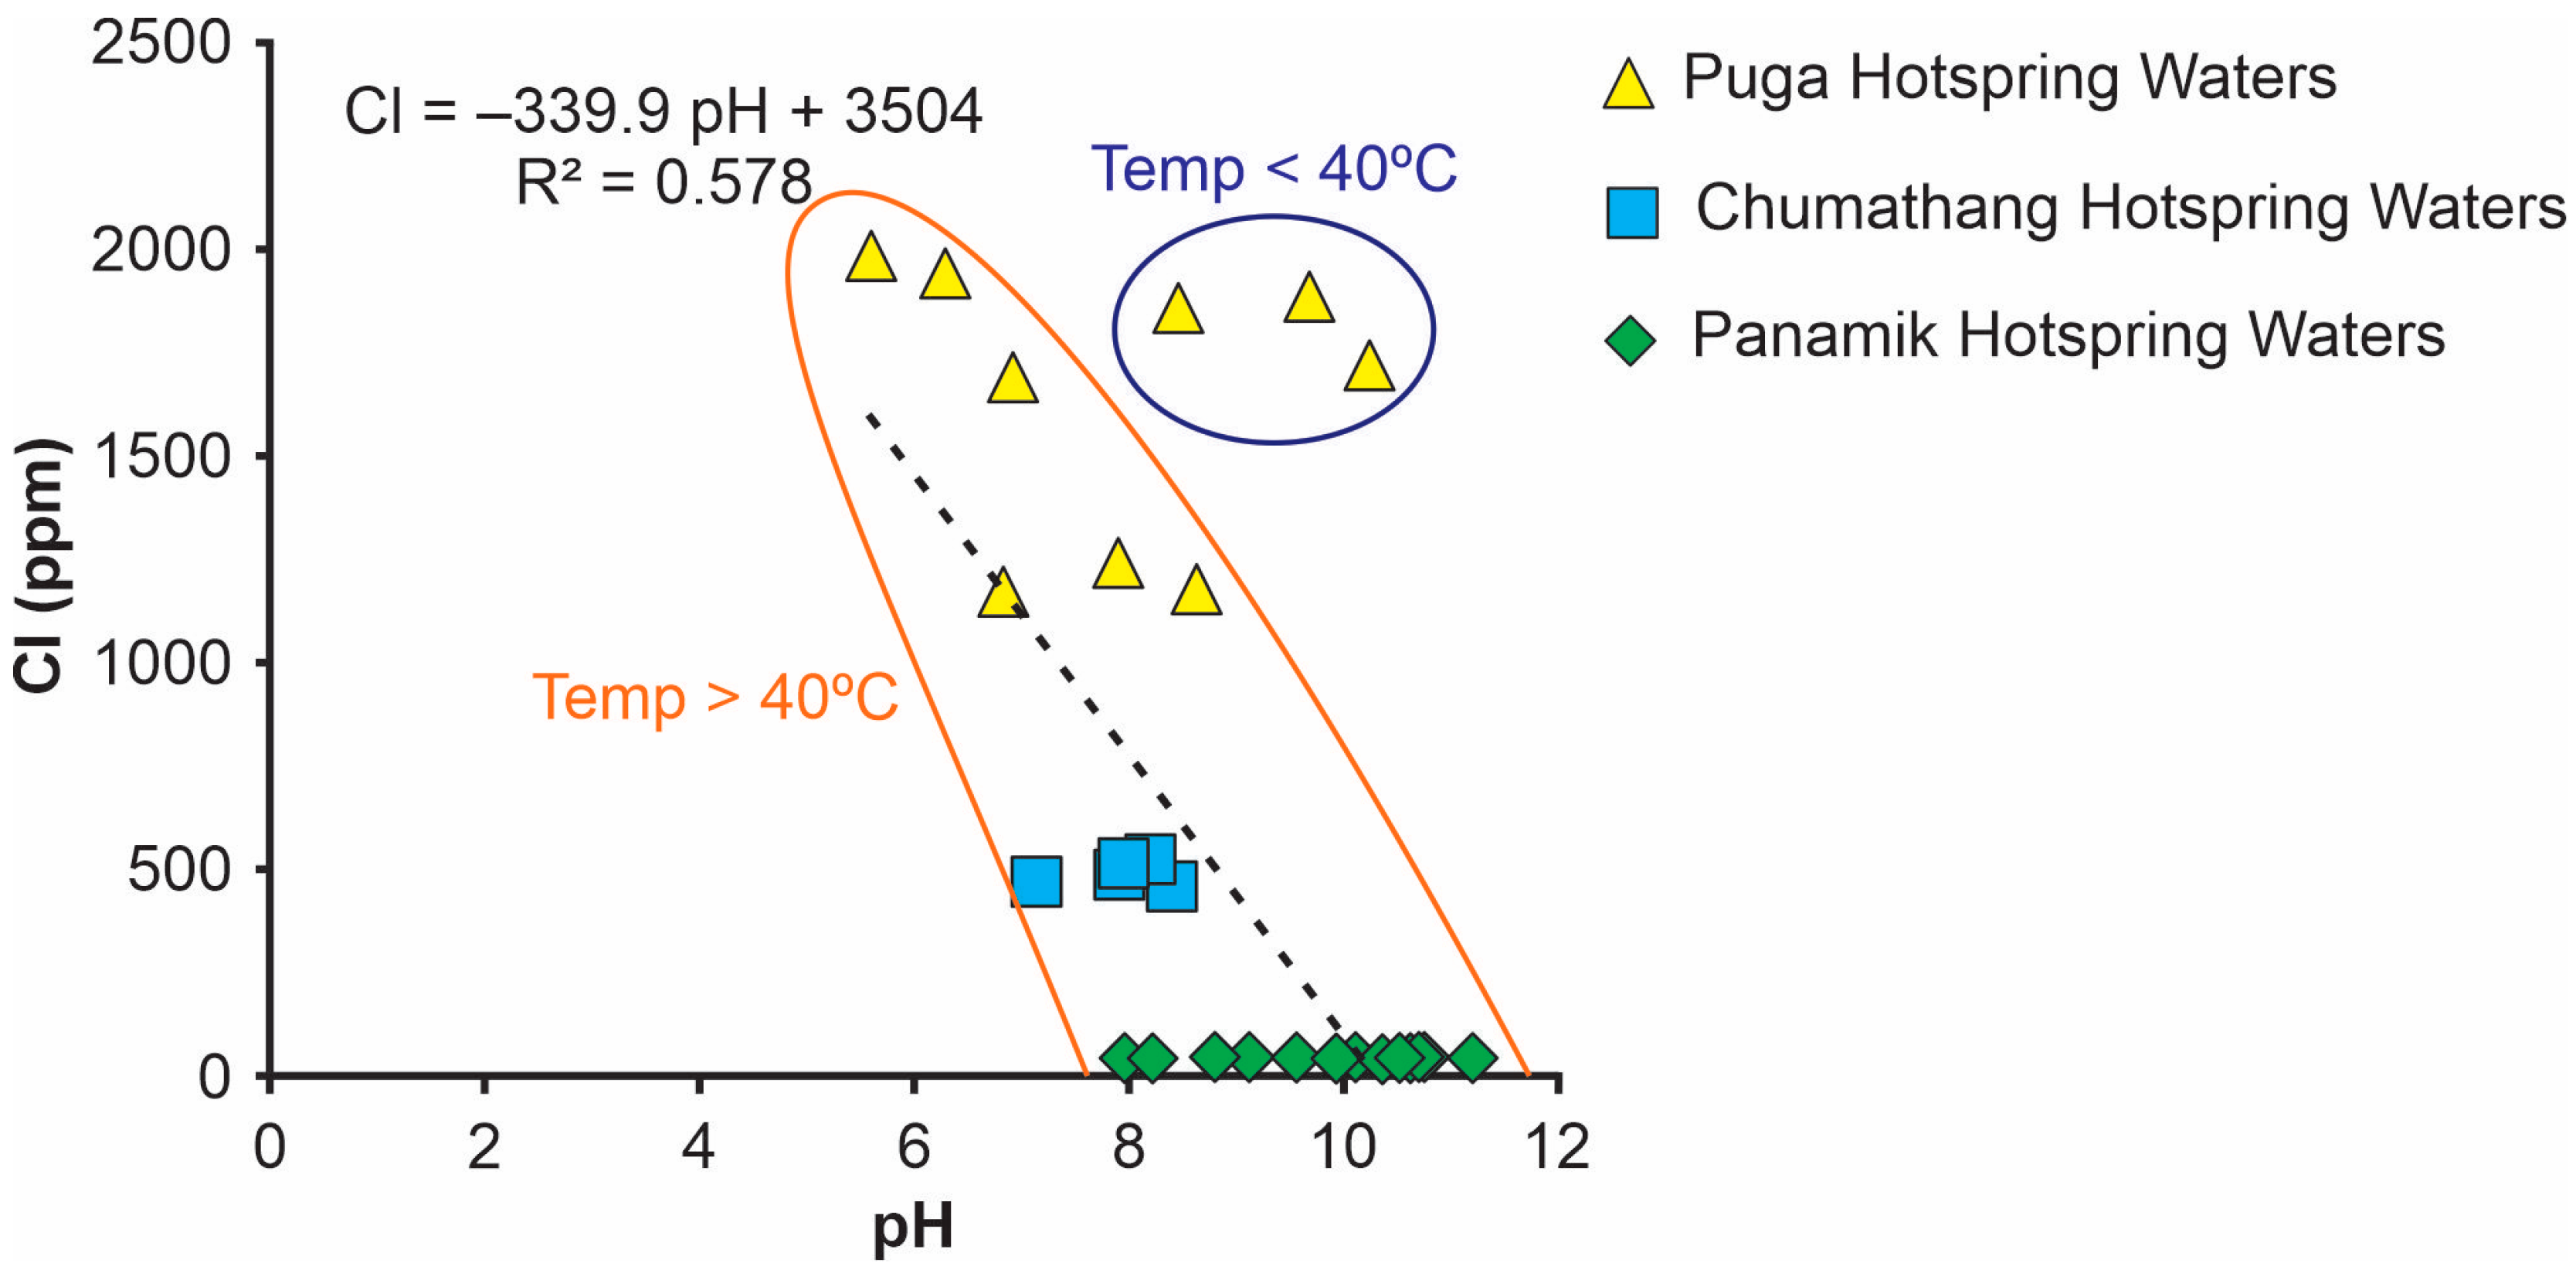
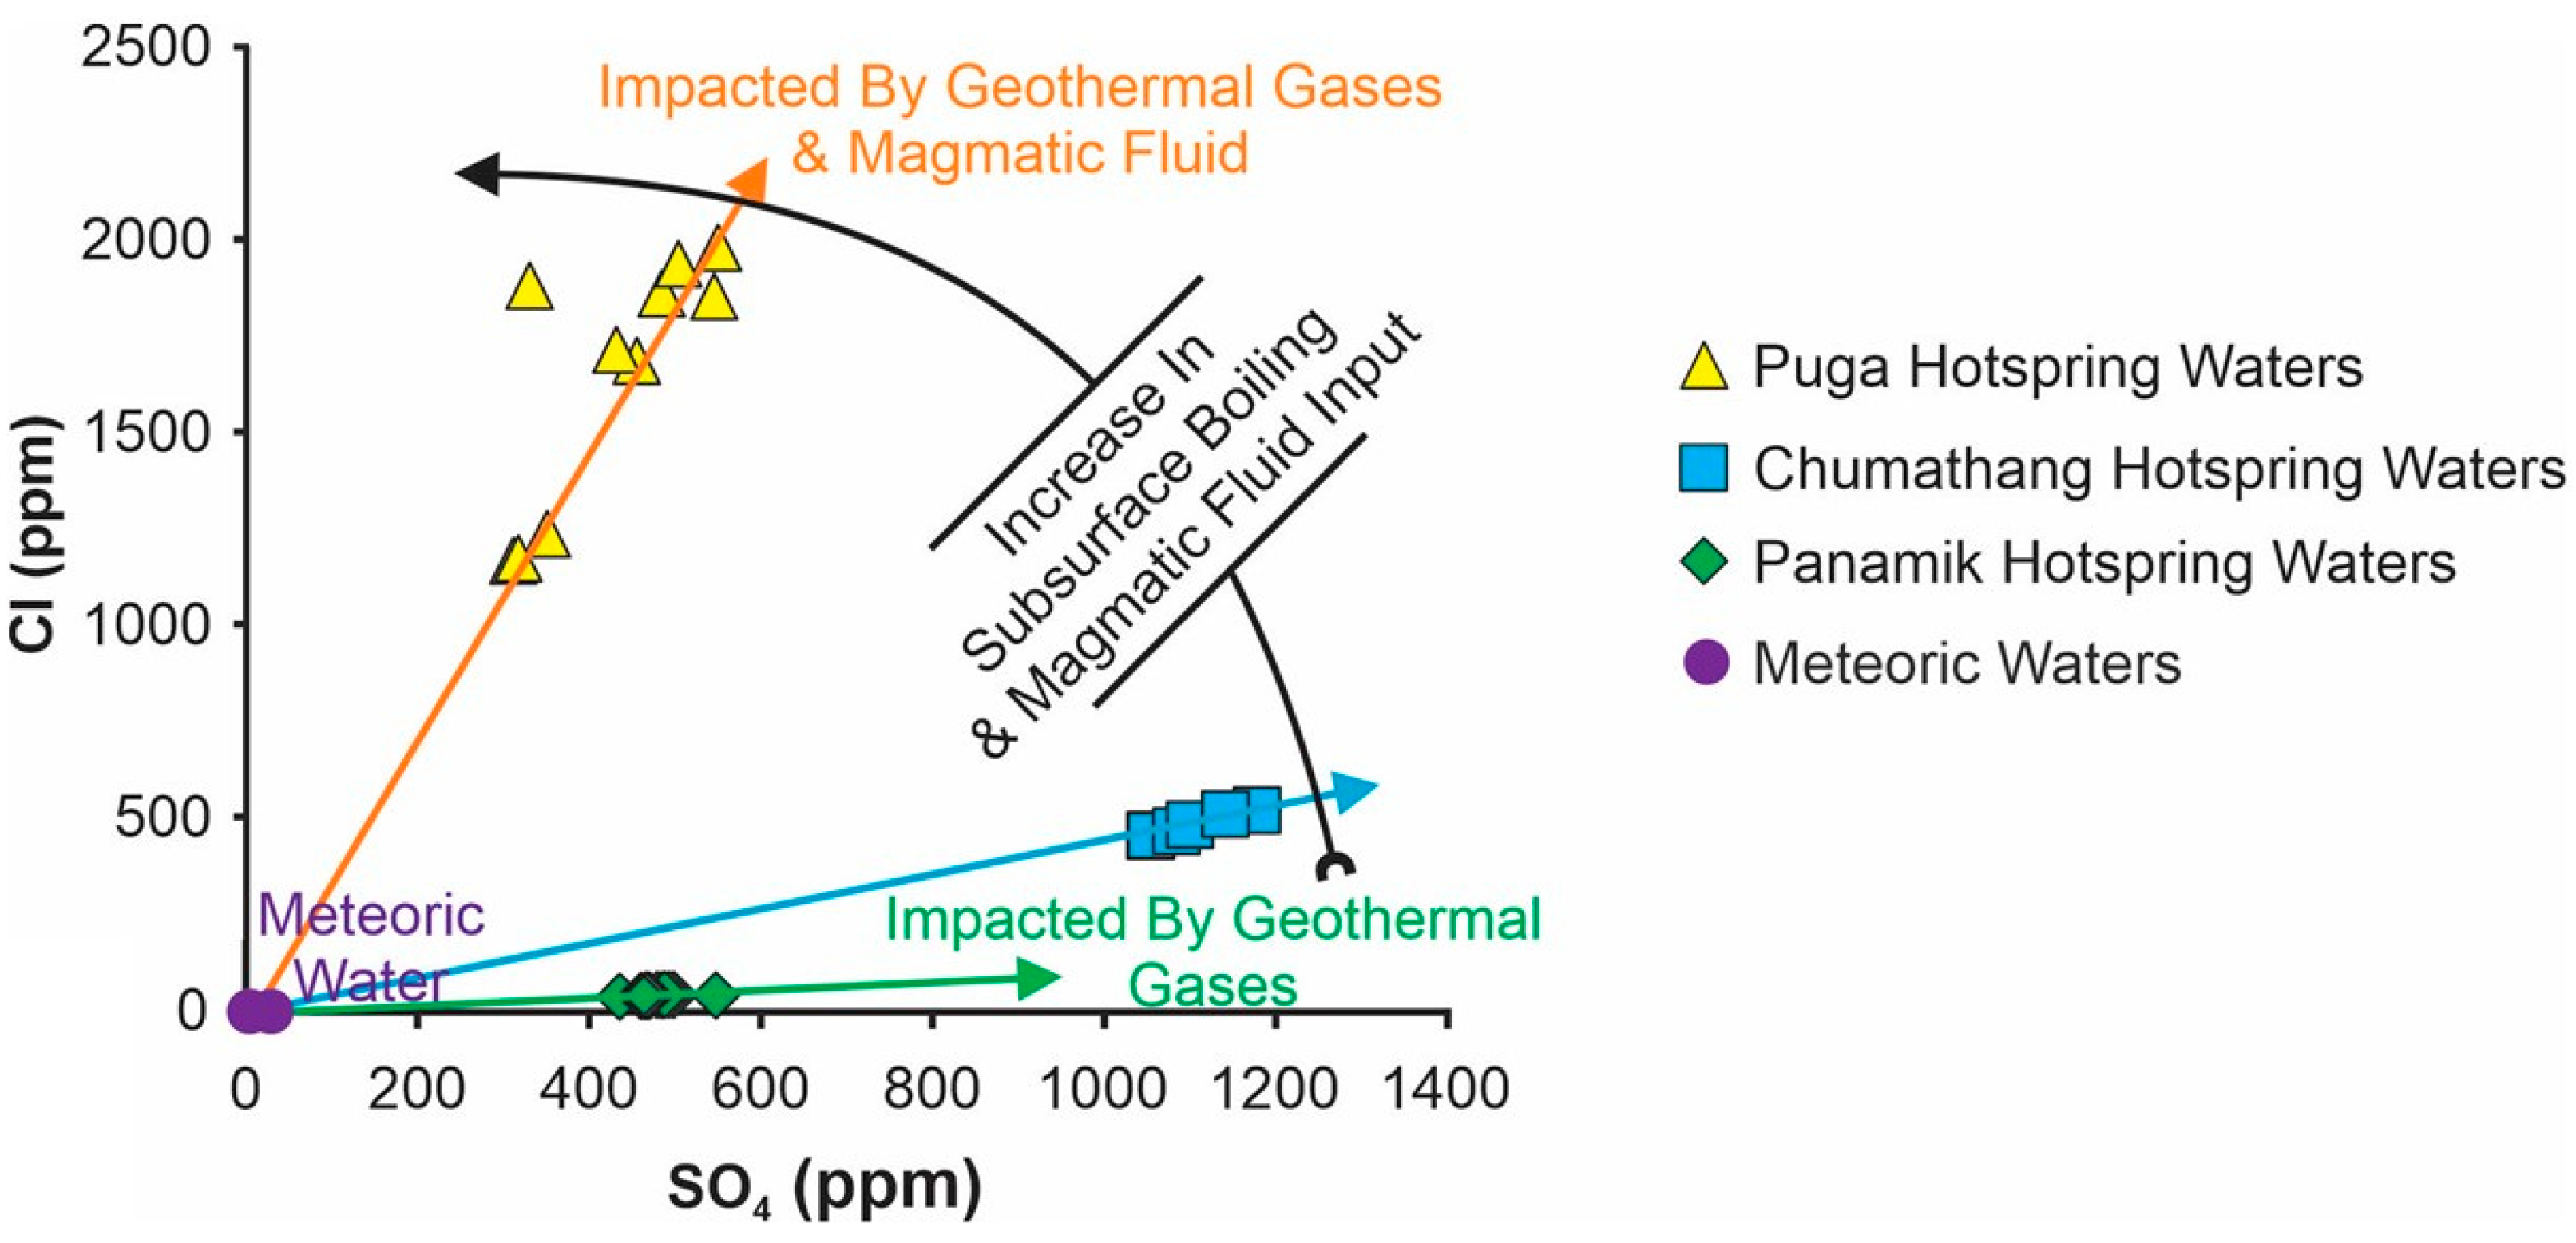
5.2. Sources of Major Anions

Cl is regarded as one of the most conservative elements in the hydrosphere, and it is typically associated with deep geothermal waters in geothermal systems [26,28,33]. Additionally, hydrothermal mineral contributions to geothermal systems are considered to be very low [34], so the significantly higher Cl concentration in Puga geothermal waters suggests a greater contribution from mature/magmatic waters. Accordingly, mature/magmatic waters contribution appeared to be relatively low in Chumathang geothermal waters and minimum in Panamik geothermal waters. The Cl concentration of Puga geothermal waters measured in this study (1653 ± 327 ppm) is about three to four times higher than those recorded in the previous studies [18,20,27]. To our knowledge, this is the highest concentration of Cl in geothermal waters ever recorded in India, Tibet, and most other terrestrial regions [6,19,20,22,23,28,35,36,37,38,39,40]. However, Cl concentration in Chumathang (490 ± 28 ppm) and Panamik geothermal waters (43 ± 2 ppm) are found to be comparable with the published records [18,20,23,27]. This significant drift in the Cl concentration of Puga geothermal waters from the published records is also reflected in the pH, as this study also detected the lowest ever pH (5.6) in the respective geothermal waters when compared to the published records [18,20,23,30]. A statistically moderate negative correlation (R2 = 0.578, P = 0.0000163) between Cl and pH (Figure 7) tentatively corroborates the inference that the acidic magmatic fluid contribution in Puga geothermal waters either has increased over time or represented a random event of increased magmatic activity in the deep source zone. Simultaneously, there has been no significant change in the Cl and pH values of the Chumathang and Panamik geothermal waters compared to the previous records [18,20,23,30], implying that magmatic fluid supplies in these places have not changed much.
According to magmatic studies, high Cl content (~9000 ppm) is generally found associated with subduction-related mafic to felsic arc magma [41]. As the magma rises from the depths, it cools, crystallizes, and changes composition from mafic to felsic, resulting in the release of Cl-enriched vapor with or without Cl-enriched hydrosaline magmatic waters [42]. Furthermore, experimental studies have demonstrated that the Cl content of the evolved magmatic vapor/water tends to increase significantly as melts fractionate towards a more SiO2-rich composition, from basalt to rhyolite [16]. The Cretaceous to Palaeogene basalt-andesite-dacite-rhyolite suites along the northern margin of the Ladakh magmatic arch [43] exhibit the presence of a similar prehistoric volcanic condition suggesting the development of Cl-enriched fluids in the region. In addition, recent evidence of such magmatic activities in the shallow subsurface of the Puga geothermal field has been suggested based on borehole geophysical studies [31,32,44].
Acidic magmatic fluids interact with rocks and alkaline-meteoric waters to produce Cl-rich neutral to alkaline-geothermal waters, which also result in the transformation and removal of magmatic sulfur species such as sulfide or sulfate [28]. These interactions can significantly alter the other chemical components, including trace elements of geothermal waters depending upon the duration of interaction, type of rocks, amount of fluid, and fluid partitioning between the liquid and vapor [11,15,16]. The formation of HCO3 reflects the interaction of CO2-rich geothermal waters with rocks. More of this interaction leads to more enrichment of HCO3 in geothermal waters. Accordingly, relatively higher Cl and HCO3 enrichment in Puga geothermal waters suggest a prolonged water–rock interaction, in other words, a longer flow path of the geothermal waters from the deep source region to the surface discharge point. As per the Cl and HCO3 concentrations, this rock–water interaction was relatively lower in Chumathang geothermal system and minimum in Panamik geothermal system (Figure 5). The Cl-SO4-HCO3 plot (Figure 5) also shows that in contrast to Puga geothermal, the shallower reservoirs in Chumathang and Panamik geothermal systems received less input of magmatic water, which may account for the relatively lower rock-water interaction in these regions.

5.3. Sources of Major Cations

The releasing amount of alkali metals from the contact rock also depends upon their ionic size [45] and temperature [46], i.e., the relative release of the alkali metals from contact rocks increases with the decreasing ionic radius (K > Na) and increasing temperature. The average Na/K ratios in the hotspring waters of Panamik ~ 23, Chumathang ~ 14, and Puga ~ 6.8, which all are significantly higher than the average value recorded from the Ladakh rivers ~ 2.8 corroborate the Bos [45] findings. The distinctly different Na/K ratios in the three geothermal systems can be attributed to either the differences in contact rock composition or a variation in the ratio of liquid and vapor phase sourcing. The Na/K ratios in the Ladakh volcanic range from 1.4 to 20 [47,48], among which the highest Na/K ratio (20) is recorded from the Nidar ophiolite complex associated with Indus Suture Zone, relatively close to Puga and Chumathang geothermal sites, whereas volcanic rocks from the Shyok suture zone, relatively close to Panamik hotspring waters show a Na/K around 3.7. Therefore, the contact rock composition seems an unlikely reason for distinctly different Na/K in the three geothermal systems. An experimental study by Orville [46] demonstrated that the proportion of K compared to Na+K in the vapor phase decreases with decreasing temperature and vice-versa. Thus, it is likely that compared to the liquid phase, a higher vapor phase contribution would have led to an overall decrease in Na and K concentration but an increase in Na/K ratios from Puga to Chumathang to Panamik geothermal systems.
In Panamik, Chumathang, and Puga hotspring waters, the Ca and Mg concentrations were relatively lower compared to the average Ca (<7.8 ppm) and Mg (<0.8 ppm) in the rivers of the Ladakh region [23]. This decrease in Ca and Mg concentrations could be a result of the early deposition of these elements in the form of Ca- and Mg-rich alteration products, such as amphibolite, biotite, chlorite, anhydrite, and fluorite [49]. The Ca and Mg concentration deficit from the average value of the Ladakh rivers suggests that the formation of Ca- and Mg-rich alteration products were most probably highest in Chumathang geothermal system and minimum in Panamik geothermal system. In addition, such Ca-Mg-depleted and Na-Cl-SO4-rich geothermal waters can be produced by the mixing of Na-Cl-SO4-HCO3-rich geothermal waters with Ca-Mg-Cl-rich ground waters [50]. During the mixing, HCO3-rich water removed most of Ca and Mg at a high-temperature evaporation process via the precipitation of carbonate minerals. This is supported by the occurrence of travertine deposits close to the active and relict Chumathang hotspring sites along the bank of the Indus River in an area of about 1 km2 [18]. The lowering of Ca and Mg concentrations due to their carbonate precipitation limits the formation and precipitation of Ca and Mg sulfate minerals, leading to an enrichment of SO4 in the discharging thermal waters, as is evident in Chumathang hotspring waters (Table 1 and Figure 8).

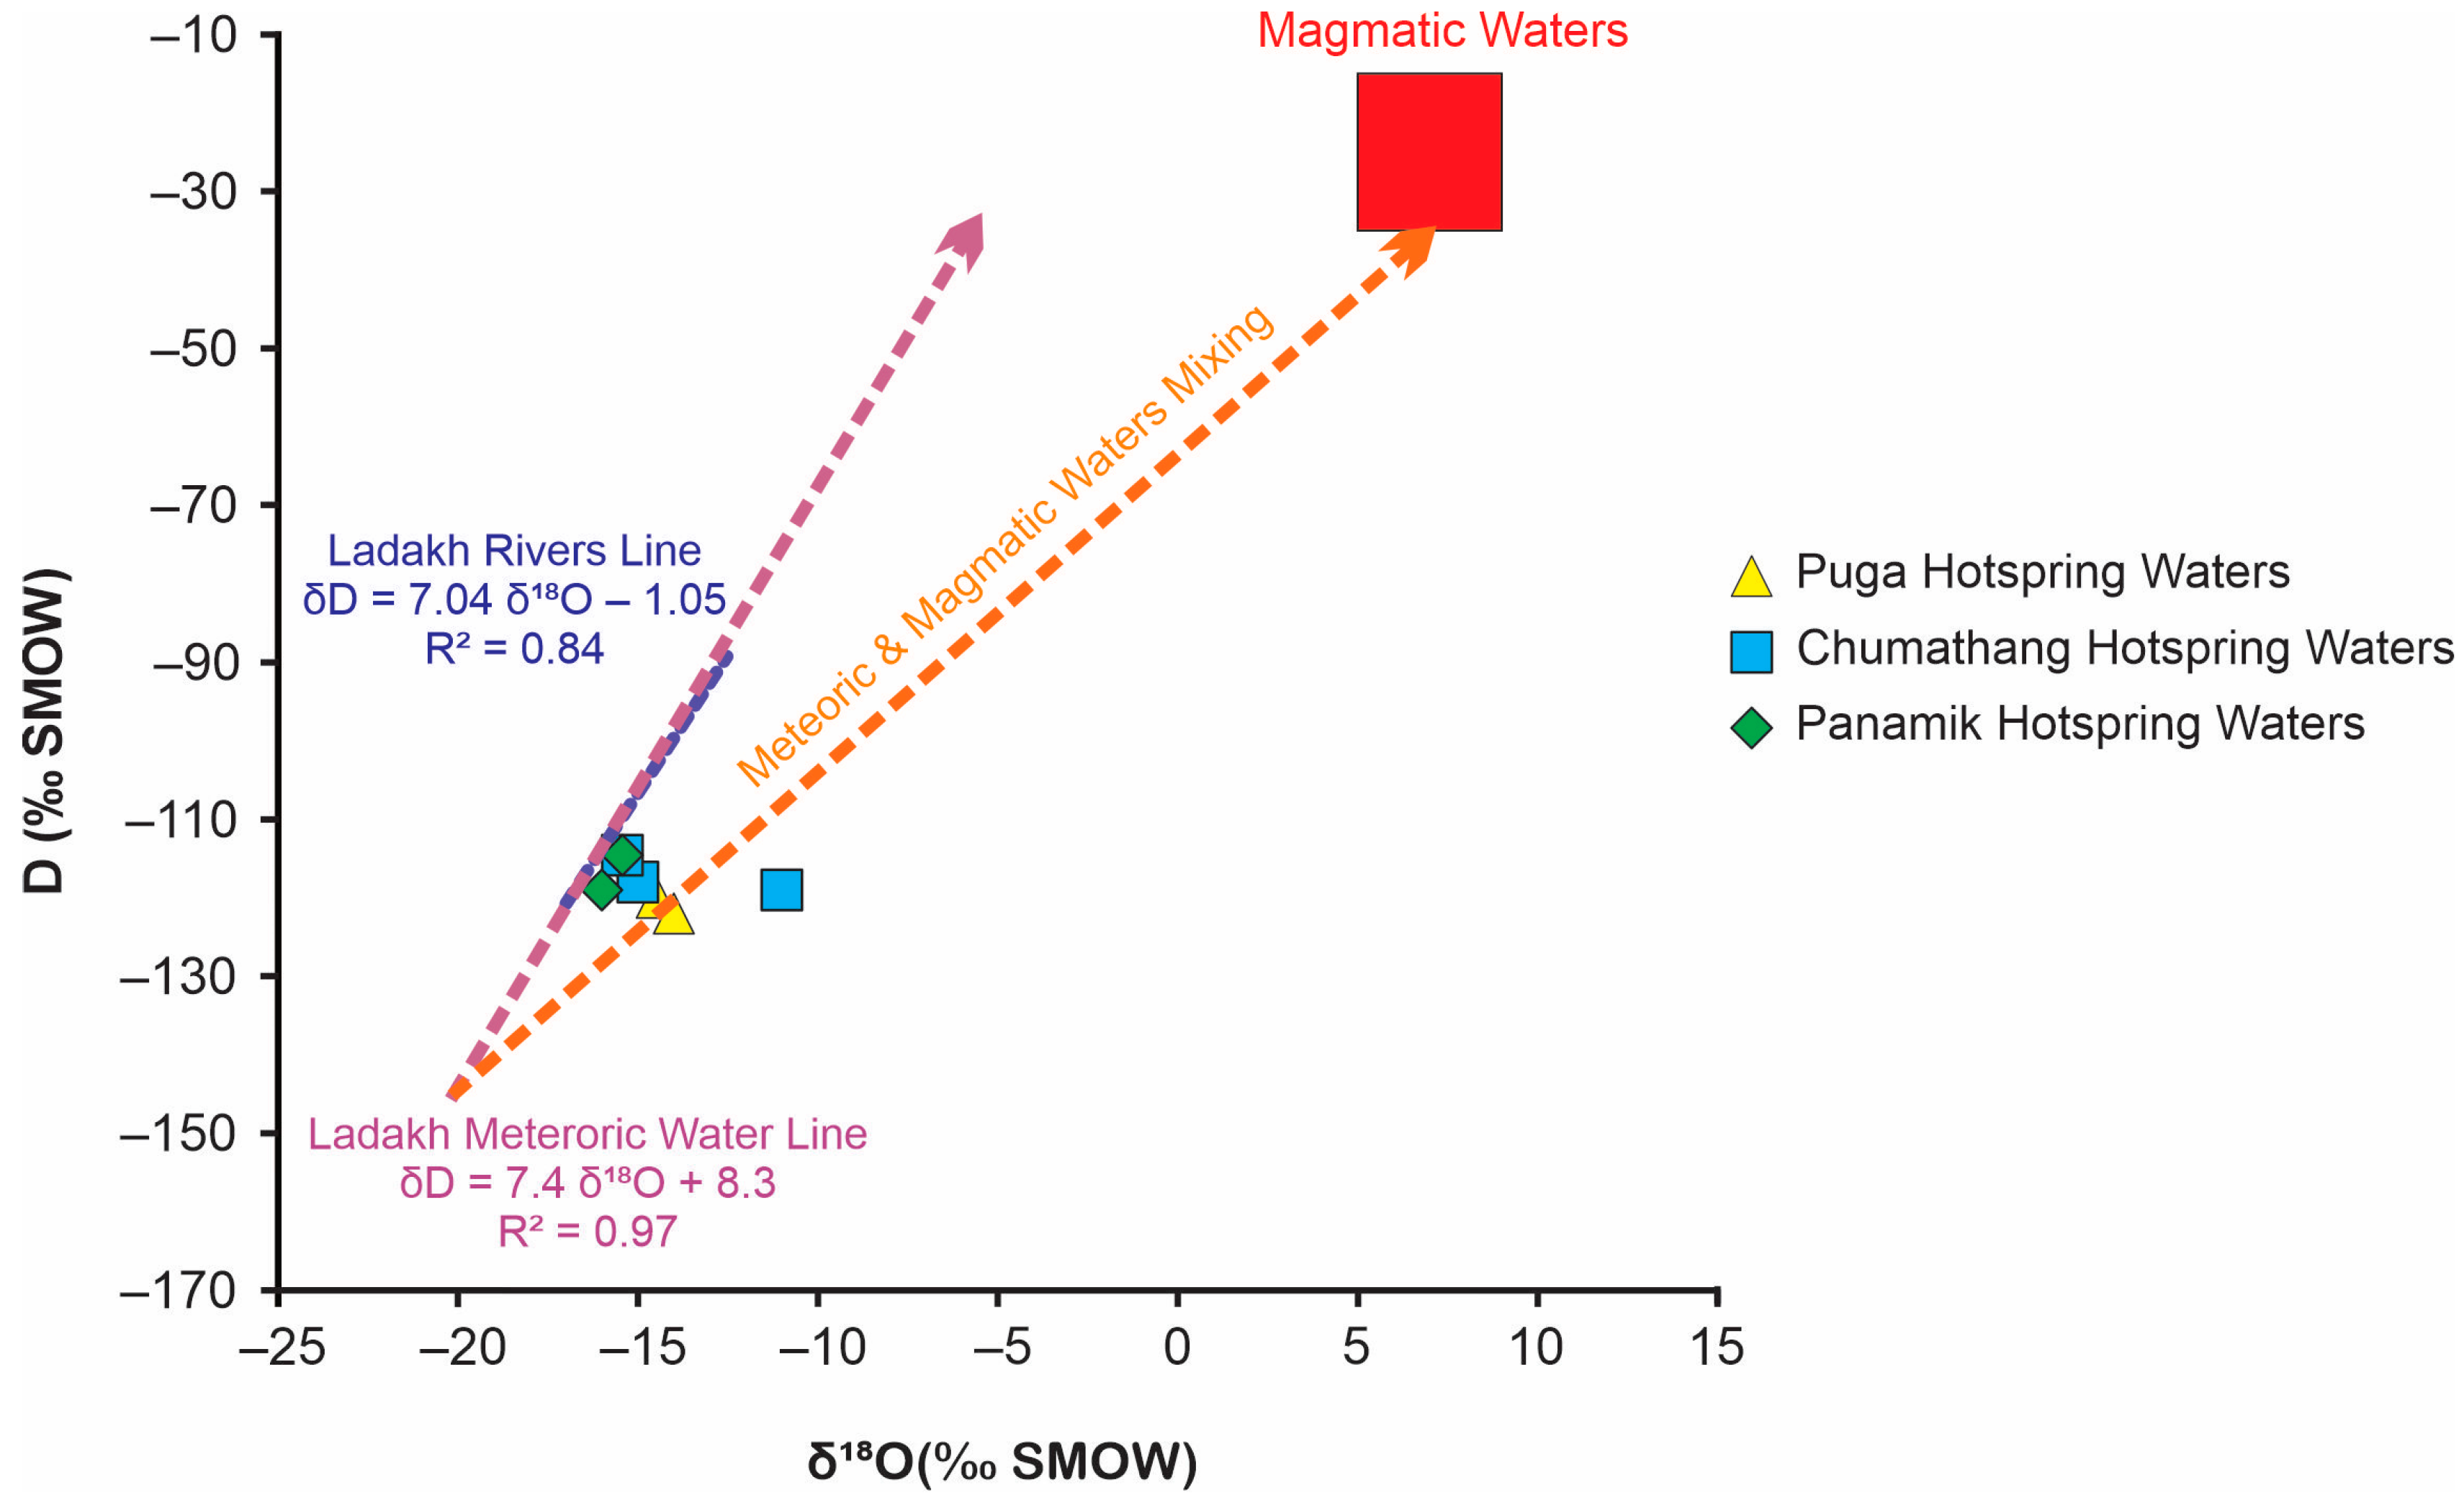
5.4. Meteoric Versus Magmatic Water Sourcing through δD–δ18O Plot

In the terrestrial environment, variations in δD and δ18O are mainly caused by isotopic fractionation during the phase transitions between vapor, liquid, and ice in the atmosphere, at the surface of the Earth, and in the upper portions of the crust [51]. In phase transition processes, oxygen and hydrogen are fractionated in similar ways at different magnitudes [51]. Craig [52] demonstrated that H and O stable isotopes in meteoric waters are positively and strongly correlated. However, the correlation slope between the H and O isotope of meteoric waters may vary spatially with the conditions of evaporation, vapor transport, and precipitation and is therefore applied to understand the hydrological and climatic processes [53,54,55,56]. The H and O isotopic composition of meteoric and river waters of Ladakh [20,27,29] also show a strong correlation and fall closely on the same regression line (slope) (Figure 6). This shows that in the Ladakh region, the interaction of meteoric and river waters with rocks, as well as fluctuations in their dissolved ionic content and pH, have no substantial effect on the δD-δ18O slope. A large variation in isotopic values of Ladakh’s meteoric waters and river waters along the overlapping lines (Figure 6) could be a result of the isotopic effects associated with water evaporation along their flow paths in extremely arid conditions and/or by the isotopic mass exchange between snowpacks and meltwaters over the sourcing glaciers [56].
The δD-δ18O values (Figure 6) of Chumathang and Puga hotspring waters [18,20,31] fall on the meteoric waters–magmatic waters mixing line, which has a completely different slope (regression line). The meteoric waters–magmatic water mixing line intercepts that meteoric/river water line at a value very close to that recorded for higher altitude glacier melts (δD < −150, δ18O < −20) in the same region [8,31]. This suggests that one end member or source of water in the hotsprings was higher altitude glacier melts. The placement of the hotsprings waters δD-δ18O values on the mixing line close to the higher altitude glacier melts values (interception point) relative to the magmatic water values [26] infer that the large fraction of the hotspring waters were composed of higher altitude glacier melts and magmatic waters contributed minor but a significant fraction. The δD-δ18O value of Panamik hotsprings mostly falls on or adjacent to meteoric/river waters lines, inferring almost negligible inputs of magmatic waters. Since the δD-δ18O values of Puga hotspring waters more consistently fall on the meteoric waters–magmatic waters mixing line than Chumathang hotspring waters, quantitatively input of magmatic water in Puga can be considered higher relative to Chumathang. These inferences of magmatic water inputs are found in close agreement with the major ions and trace elements concentrations of Panamik, Chumathang and Puga hotspring waters (see Section 5.2, Section 5.3 and Section 5.6).

5.5. Phase Separation

Based on the extensive studies of Yellowstone geothermal water geochemistry Havig, Kuether, Gangidine, Schroeder, and Hamilton [15] demonstrated that the subsurface geothermal processes, i.e., subsurface boiling and phase separation that plays a key role in shaping the chemical composition of discharging water, can be identified by their pH, Cl, and SO4 composition. In our study, Puga hotspring waters demonstrated a pH ranging from slightly acidic to alkaline with SO4/Cl ratio varying from 0.18 to 0.29, which points to a phase separation-dominated geothermal system having high subsurface boiling (Figure 8). The hotspring waters of Chumathang showed circum-neutral to alkaline and SO4/Cl ratios from 2.22 to 2.31, which indicates a re-mixing of vapor and liquid phase of a phase separation-dominated geothermal system having moderate subsurface boiling (Figure 8). In Panamik, the hotspring waters’ alkaline nature and the SO4/Cl ratios from 10.76 to 12.65 indicate that the respective geothermal system had minimum phase separation and underwent minimal subsurface boiling (Figure 8).

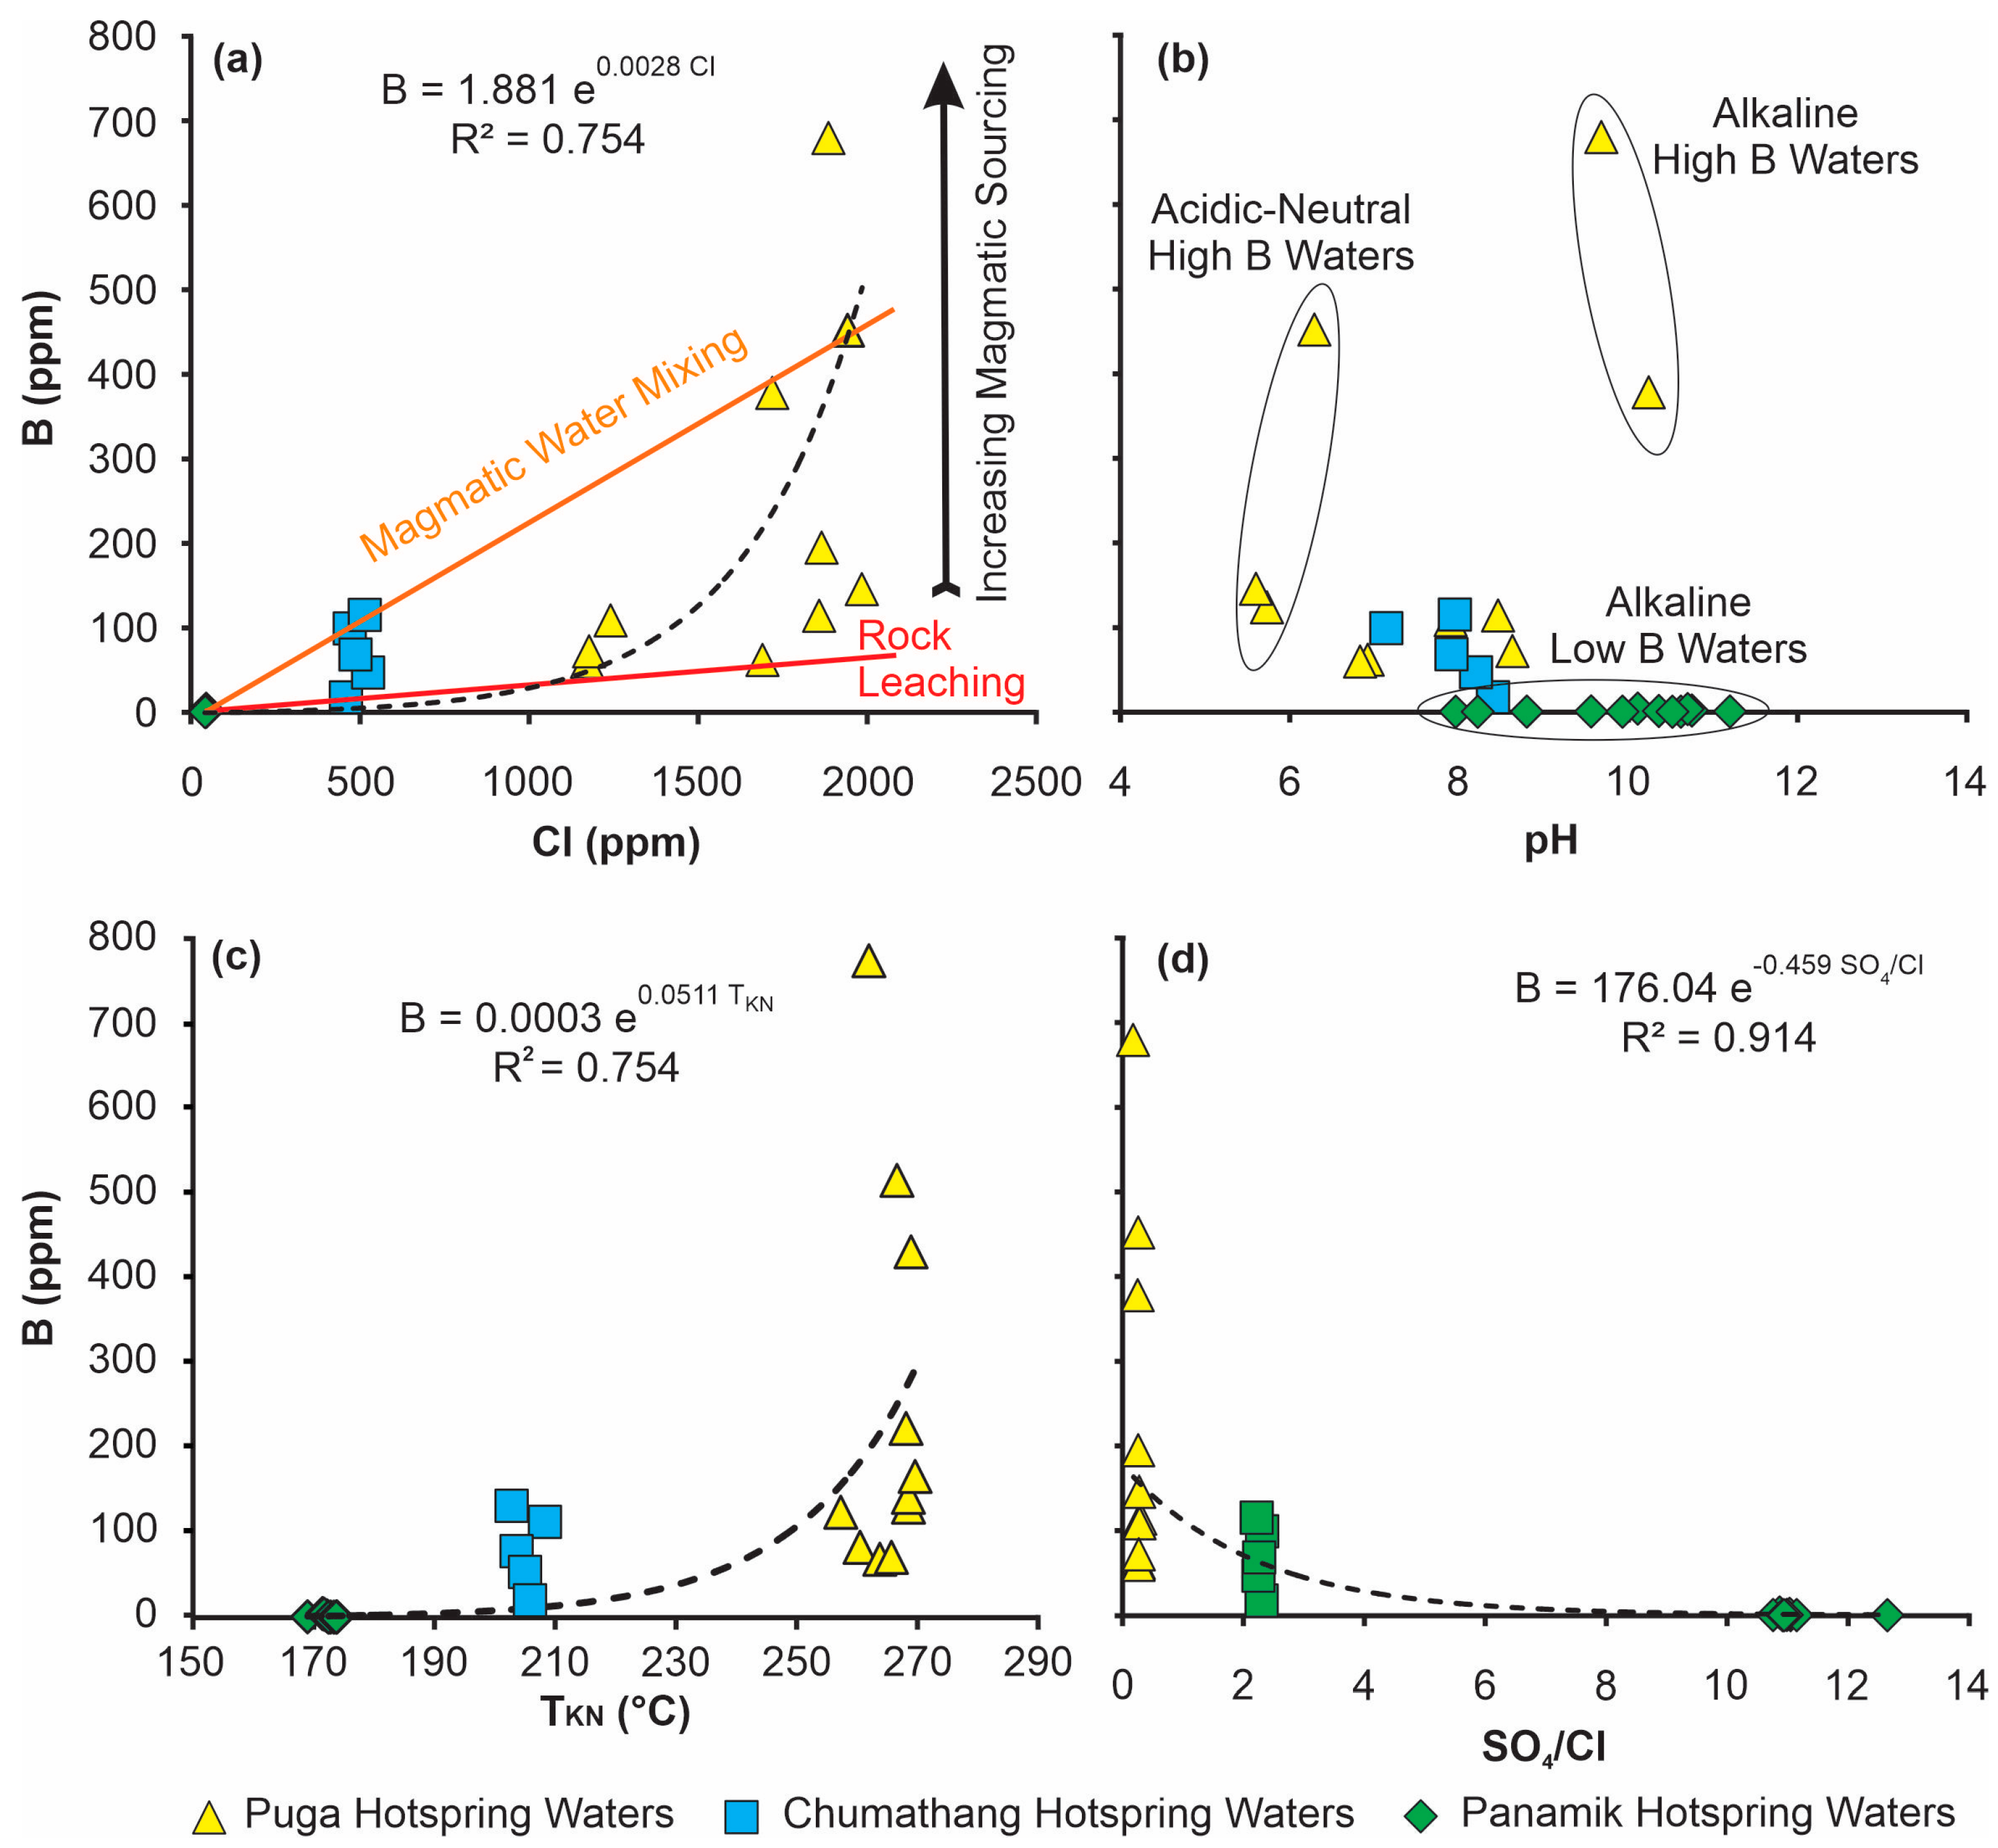
5.6. Sourcing of Elevated B and W Concentrations in the Hydrothermal Waters of Ladakh

5.6.1. Trace Elements
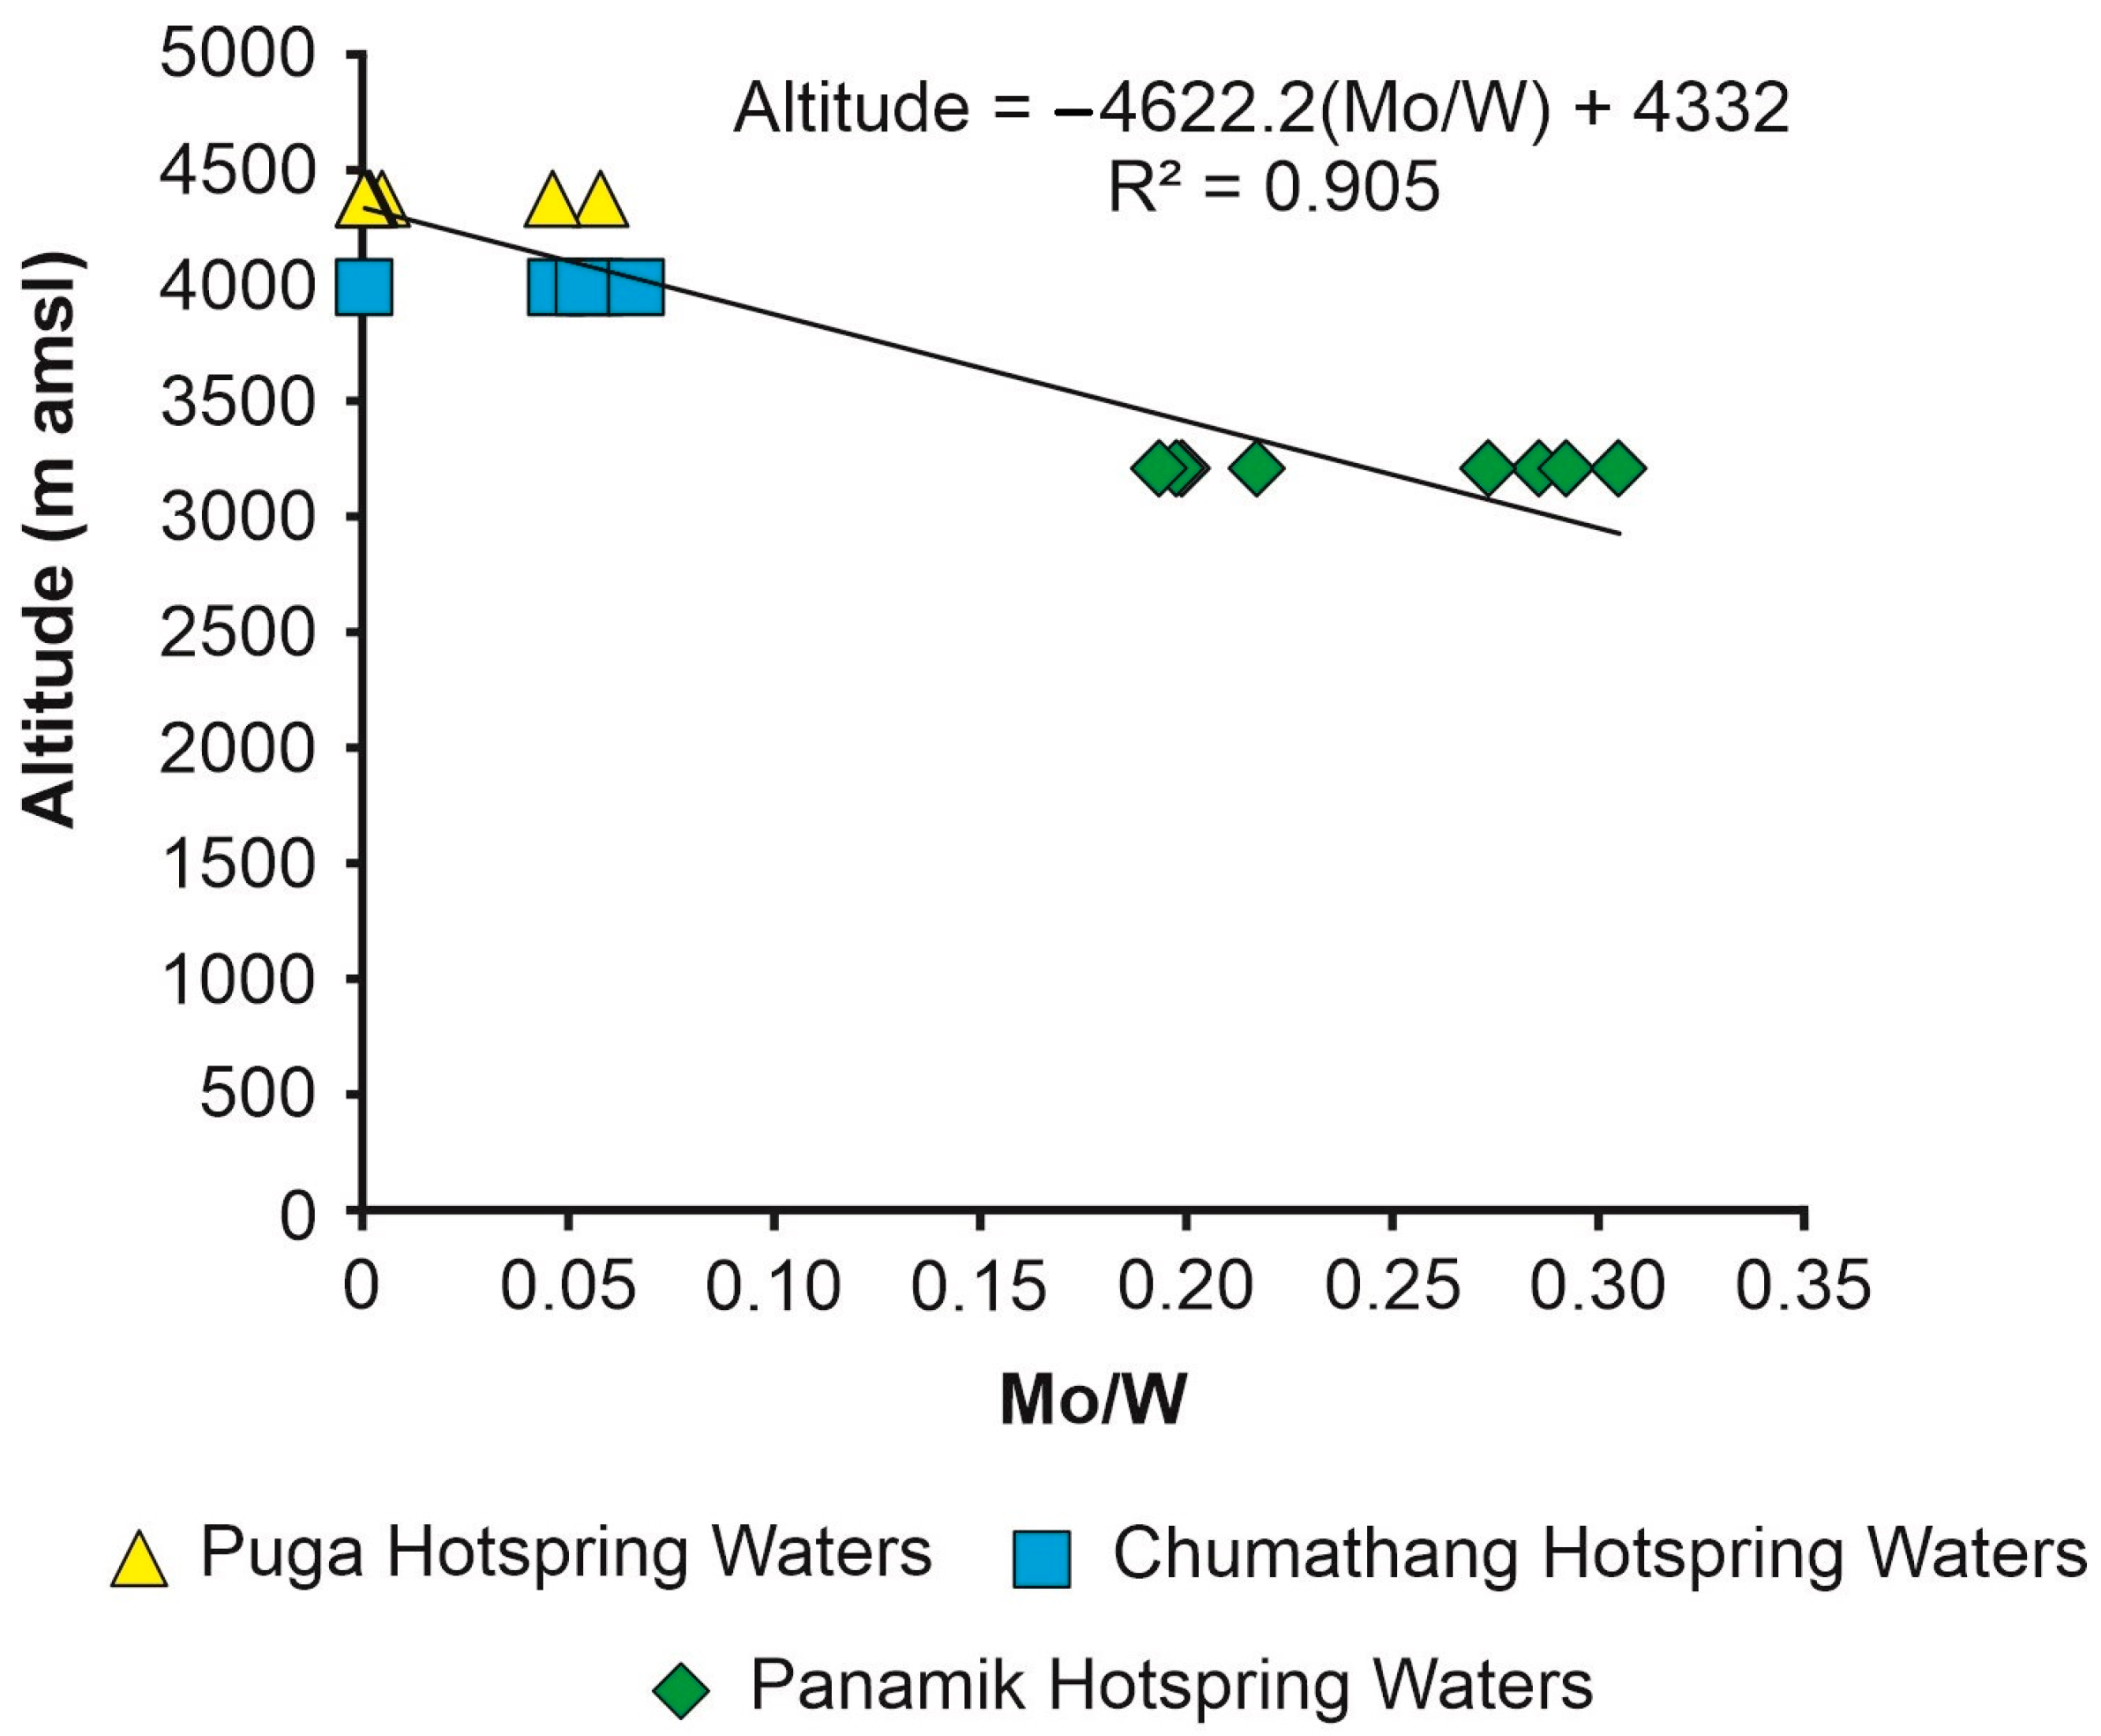
Compared to the Shyok River, the B, Mo, and W concentrations in Panamik, Chumathang, and Puga geothermal waters were up to 680, 280, and 13 times higher, respectively (Table 1). This enrichment of B and W is consistent with one of the highest global concentrations recorded from the geothermal waters in the Tibet region [5,7], Iceland [11], and Yellowstone National Park geothermal waters [38]. These elemental enrichments in Panamik, Chumathang, and Puga hotspring waters are found to be well correlated with the Cl content and reservoir temperature (Figure 2c,d and Figure 9a). More specifically, B and W show a positive correlation with Cl and reservoir temperature, whereas Mo shows a negative correlation with Cl and reservoir temperature (Figure 2c and Figure 9a). This indicates that B and W acted as Cl complexed elements and Mo acted as sulfide complexed elements [16,57,58], and their solubility and transport in the three geothermal systems were directly influenced by the reservoir temperature and fugacity. The concentration of B and W in the geothermal waters increased, whereas the concentration of Mo decreased with an increase in reservoir temperature (Figure 2b,e and Figure 9c). This implies that either B and W solubilization from contact rocks or their intake through volcanic gases increased in conjunction with the increase in reservoir temperature.

Sources of Mo and W

Mo and W belong to the same transition metal group (IV) and have similar atomic radii. Therefore, they are expected to show similar chemical characteristics [3,59]. In the oxygenated surface water condition, both Mo and W occur as conservative elements, mostly in the form of hexavalent oxyanions, and show a Mo/W ratio greater than one [3,11,60,61], which is generally in proportion to the composition of common volcanic and sedimentary rocks [60] as well as the average composition of the upper continental crust [62]. However, this study exhibit that dissolved W in Panamik, Chumathang, and Puga hotspring waters exceeded greatly relative to dissolved Mo, giving a Mo/W ratio as low as 0.00043. This non-stochiometric composition of Mo and W in the geothermal waters discharge is consistent with published records of sulfide-rich geothermal systems [5,11,36] and can be explained by the fact that Mo in a sulfide-rich geothermal system is readily removed from the solution by formation of insoluble molybdenite (MoS2) and/or thiomolybdate ions (MoOβS4−β2−, β = 0–4) conversely tungstenite (WS2) and/or thiotungstate ions (WOβS4−β2−, β = 0–4) formed from W have a higher solubility [5,61]. The Mo/W ratios and Mo content of the hotspring waters in the three sites demonstrated a strong negative correlation with the respective reservoir temperatures (Figure 2e,f). This suggests that the high reservoir temperature in Puga geothermal system was associated with high inputs of volcanic H2S input, which efficiently removed Mo from the reservoir water [63,64]. This scavenging Mo was lowest in the Panamik geothermal system, which is evident from the relatively high concentration of Mo in its hotspring waters (Table 1 and Figure 10). In addition, a good correlation between the average Mo/W ratios of the three geothermal waters and their altitudinal position (Figure 10), i.e., lower altitude is associated with higher Mo/W ratio and vice-versa, suggesting that dissolved Mo content in the geothermal waters was also governed by oxygen fugacity of the geothermal system [63]. For example, higher oxygen fugacity at the lower altitude in Panamik would have enhanced the Mo transport in the dissolved form by oxidizing the scavenging agent sulfides into sulfates which has no demonstrated influence on scavenging Mo from the dissolved phase. Contrary to this, at the higher altitude in the Puga region, oxygen fugacity would have been relatively lower to keep enough Mo in the dissolved phase.
This study shows that the reservoir temperature of the elemental composition of Panamik, Chumathang, and Puga hotspring waters is directly influenced by their reservoir temperature. Therefore, increasing destabilization and increasing solubilization of Mo and W-containing minerals with increasing temperature during the interaction between reservoir water and host rock appears to be a likely source of these elements. In addition, a strong positive correlation of W with Cl (Figure 2c) suggests that the magmatic fluid/brine from the deeper primary neutralization zone would also have contributed substantial W in the hotspring waters of Puga and Chumathang. Such deep sourcing of W appears to be lesser or almost negligible in Panamik hotspring waters, as is evident from its K concentration comparable to the river waters of Ladakh. In addition, the reductive dissolution of Fe and Mn oxyhydroxide particles in a highly reducing Puga geothermal system would also have added to the enrichment of dissolved W. This contribution would have been minimum in Panamik geothermal system due to a better oxygen fugacity.
According to geochemical studies of geothermal deposits, the primary source of enhanced W in hydrothermal areas are griesenisation and skarnisation alteration of granitic rocks by hydrothermal fluids at high temperature (160 °C to 560 °C), high pressure, reduced, and moderate to low salinity subsurface condition [65,66]. During this process, mica and feldspar undergo decomposition, which results in the dissolution of W and Mo-containing minerals that are generally stable at normal temperature and pressure conditions. An experimental study by Manning and Henderson [67] demonstrated that under hydrothermal conditions increase in Cl concentration can enhance the partitioning of W into the fluid phase by forming a W-Cl-complex (such as WOCl4 and WCl6). In this study, a strong positive correlation between Cl and W (Figure 2c) also implies that in addition to the temperature, W in Panamik, Chumathang, and Puga geothermal systems was probably extracted and transported under the influence of Cl-rich conditions. A strong negative correlation between Mo and Cl (Figure 2d) infers that extraction and transportation of Mo were not influenced by high Cl content but by H2S gas coevolved with Cl from magmatic activities in shallow crustal melt zone. Thus, along with increasing Cl, an increase in H2S would have led to proportional precipitation of Mo from the hydrothermal water resulting in a strong negative correlation of Mo with Cl and W. The simultaneous actions of these processes also result in precipitation and re-dissolution of W minerals commonly characterized by wolframite (commonly associated with greisenisation) and scheelite (commonly associated with skarnification) in individual minerals [65]. Geochemical modeling studies suggest that the solubilities of these minerals are predominantly influenced by temperature and pH conditions [68]. Scheelite solubility, for instance, is often much higher than that of ferberite and hubnerite (minerals of the wolframite series) at an acidic to moderately alkaline pH, and it increases with increasing temperature but declines with increasing pH [68]. In a more alkaline condition, scheelite solubility decreases with increasing pH, while feberite solubility rises as temperature rises. The different proportions of these minerals in the contact rocks of the geothermal water flow path may therefore cause spatial heterogeneity in the Mo and W content of hotspring water, as has been seen in this study.

Source of B

Compared to the B concentrations in the Shyok River (0.2 ppm), Panamik hotspring waters showed a comparable concentration (0.5 to 4.3 ppm), whereas Puga (60 to 679 ppm) and Chumathang (17 to 115 ppm) hotspring waters demonstrated an extreme enrichment of B. These B concentrations in Chumathang and Puga hotspring waters are significantly higher than the earlier records from the same geothermal field [18,31,69]. Also, according to the best of our knowledge, the B concentration in the Puga geothermal waters (679 ppm) is so far the highest recorded value from any hotspring waters around the world [6,7,8,10,11,28,35,36,38,40,70,71]. Before this, the highest concentration of 581 ppm was reported from neutral/alkaline hotspring waters of the Muoluojian geothermal field in Tibet at an altitude of 4800 amsl [7]. The exact reason for the higher B concentration recorded in this study relative to the previous records is not known. However, we offer two possible hypotheses to explain this inconsistency. First, the sampling for the previous studies was conducted in July-August of 1973 [18] and 2016 [62] and sampling for the present study was conducted in September 2021. Thus, one possibility is that the amount of groundwater replenishment by higher altitude glacier melting from July–August to September decreases substantially, making the hydrothermally pumped water less diluted (more concentrated in magmatic fluid inputs) in B along with other cations and anions in the hotspring waters. The validity of this hypothesis can be tested by time series analysis of hydrothermal waters during the summer season. The second possibility is that magmatic activity in the subsurface of Puga would have randomly increased during the period we conducted our sampling or has increased over time from previous records.
The B-pH plot (Figure 9b) from this study shows three possible end members of B sourcing: (1) acidic high B system, (2) alkaline low B system, and (3) alkaline high B system (Figure 9b). Both the acidic high B and alkaline high boron end members were exclusively detected in Puga geothermal field. As the acidic high B was linked to a high discharge temperature, it most likely came directly from a deep geothermal system that had little contact with the very alkaline near-surface cold water. In contrast, the alkaline high B end member was linked to a relatively low temperature, suggesting that it was derived from the mixing of acidic high boron waters with cold and highly alkaline near-surface groundwater. According to a similar study in Tibet [7], acidic high B hotspring waters in Trans-Himalaya are typically found to be associated with Ca-Na-SO4-Cl rich waters, which may be formed by mixing of steam-heated water and neutral Cl-rich water, whereas alkaline B rich hotspring waters are generally associated with Na-HCO3-Cl rich waters. The close reservoir temperature (Na-K-Mg geothermometry) for acidic high B and alkaline high B hotspring waters implies that these waters evolved from deep hydrothermal fluids in equilibrium with Na-K [7]. Alkaline low B hotspring waters are generally rock-heated groundwater with negligible inputs from magmatic fluids. The presence of all three types of water in Puga is a manifestation of phase separation and a variable degree of magmatic water inputs (negligible to relatively high). In addition, intense phase separation in Puga due to high subsurface boiling (Figure 8) would have generated liquid phase-dominated and vapor phase-dominated hotspring outlets with different pH and chemistry. Since the partitioning of elements in liquid and vapor phases are largely different, hotspring waters in such areas often result in three chemically distinct compositions [15]. (1) The liquid phase dominated hotsprings, enriched in Cl and elements transported in Cl-complexed forms such as W and B. (2) The vapor phase dominated hotsprings, enriched in H2S and CO2, and elements transported in SO4/HCO3/sulfide-complexed form such as Mo, Ca, and Mg. (3) A mix of the two phases with intermediate enrichment of Cl, H2S, HCO3, and SO4 with variable Na, K, W, B, and Mo enrichments. In addition, the interaction of three types of waters of distinctly different pH and temperature with contact rocks releases ions in different proportions, which further adds to the ionic difference among the three types of hotspring waters.
Since B is a soluble and relatively conservative element, host-rock leaching is generally considered the main source of B in geothermal [7,72,73,74]. However, it has been argued that in a geothermal system, extreme enrichment of B in discharge waters cannot be explained simply by the rock-water interaction. Rather, magmatic sourcing could be the most probable candidate for such extreme enrichment [6,7,8]. This study shows that B concentrations in the hotspring waters are exponentially correlated with the reservoir temperature and Cl concentration, i.e., an increase in reservoir temperature and Cl concentration results in an exponential increase in B concentration and vice-versa (Figure 9a,c). It must be noted that the high B concentrations in the hotspring waters were only associated with the reservoir temperature ranging above 200 °C. As the δ18O-δD plot (Figure 6), Cl-SO4-HCO3 ternary plot (Figure 5), and Cl-SO4 plot (Figure 8) for Panamik, Chumathang, and Puga geothermal waters strongly indicate that Puga and Chumathang waters (having reservoir temperature > 200 °C) have magmatic water/brine inputs. This indicates that the high content of B in Puga and Chumathang geothermal systems was most likely sourced from magmatic water/brine. In addition, this study shows that B concentration was higher at a lower SO4/Cl ratio and vice versa (Figure 9d). The lower SO4/Cl in Puga geothermal system, which represented a relatively higher liquid phase (perhaps Cl-dominated magmatic water) fraction compared to the vapor phase (SO4-dominated) fraction, was mostly found to be associated with the high B concentration. As the liquid phase inputs decreased in Chumathang geothermal system and reached almost negligible in Panamik geothermal system, the B concentration decreased accordingly. This further support the idea that B was primarily enriched in the liquid (brine) phase that emanated from the magmatic activity zone.
B in the Trans-Himalayas is mostly found enriched in the widespread leucogranites in the form of tourmaline [9,75]. Several studies have examined the chemical and B isotopic compositions of tourmaline from Trans-Himalayan leucogranites [9,75,76,77,78,79,80]. Cheng, Zhang, Liu, Yang, Zhou, Horn, Weyer and Holtz [9] demonstrated the δ11B values in the leucogranite-associated tourmaline of the Trans-Himalayas generally peak in two distinct ranges, one between −7 and −8‰ in the early-stage tourmaline and the second between −12 and −15‰ in the late-stage tourmaline. The published B isotope data from Puga hotspring waters are found consistently around −13‰ [69], which overlaps the late-stage tourmaline δ11B range. Therefore, one possibility is that B in the Puga hotspring waters was derived from the dissolution of the tourmaline minerals at high-temperature conditions without any significant isotopic fractionation or from the B-rich fluid exsolved from melt/magma. However, it is believed that tourmaline is resistant to secondary hydrothermal activity due to its low diffusion rates of elements within the mineral structure [81,82]. Hence, the most plausible source of B seems to be the exsolution of B-rich fluid from magma, i.e., acidic high B end member, which had a δ11B value equivalent to late-stage tourmaline.

6. Conclusions

In this study, the Cl-SO4-HCO3 ternary plot and the δD-δ18O plot reveal a distinguishable signal of magmatic water input in the hotspring waters at Puga and Chumathang, whereas negligible magmatic waters inputs in Panamik hotsprings which were primarily steam heated. The significantly higher Cl concentration in Puga geothermal waters suggests a greater contribution from mature/magmatic waters. Accordingly, mature /magmatic water contribution appeared to be relatively lower in the Chumathang geothermal waters and, at a minimum, in the Panamik geothermal waters. This study found that Cl concentrations in Puga hotspring waters (1653 ± 327 ppm) were about three to four times greater than those recorded in previous studies. We believe that this is the highest concentration of Cl in geothermal waters ever recorded in the Indian, Tibetan, and most other terrestrial regions, while Cl concentrations in Chumathang (490 ± 28 ppm) and Panamik (43 ± 2 ppm) hotspring waters were comparable to published records. In addition to this significant drift in Cl concentration, our study also detected the lowest-ever pH (5.6) in the respective geothermal waters from Puga. These findings collectively imply that either the acidic magmatic fluid contribution in Puga geothermal field has grown over time or enhanced magmatic activity in the deep source zone was associated with a random event or decreased replenishment of groundwater in the area from higher altitude glacier melt would have decreased the freshwater dilution of magmatic fluid inputs. A long term-time series study would be needed to understand this shift in magmatic fluid activity in the Puga geothermal field.
This study shows that the ratios of dissolved W to dissolved Mo in the waters of Panamik, Chumathang, and Puga hotsprings were as low as 0.00043. This non-stochiometric composition of Mo and W in the hotspring waters can be explained by the fact that Mo in sulfide-rich geothermal systems is readily removed from the solution by the formation of insoluble molybdenite and/or thiomolybdate ions, whereas tungstenite and/or thiotungstate ions formed from W are more soluble. The relatively high concentration of Mo in the Panamik hotspring waters infers its lower scavenging, probably due to a better-ventilated condition. This is corroborated by a strong correlation between the average Mo/W ratios and the corresponding altitudinal position, i.e., that lower altitude was linked to a higher Mo/W ratio and vice versa, indicating that the oxygen fugacity of the geothermal system also acted as a key control on the dissolved Mo content.
This study demonstrates a direct relationship between reservoir temperature and the constituent composition of the hotspring waters in Panamik, Chumathang, and Puga. Therefore, it appears that one potential source of these elements is the rising instability and increasing solubilization of B, Mo, and W-containing minerals with increasing temperature during the interaction between reservoir water and host rock. However, the extreme concentrations of B and W in association with extreme Cl concentrations in Puga and Chumathang hotspring waters, which based on the δ18O-δD data, are evident to contain magmatic water inputs, unambiguously suggest that B and W in the respective waters were mainly contributed by magmatic water/brine inputs, as simple high-temperature rock-water interactions are unlikely to lead to such an extreme enrichment of B and W.

Author Contributions

Conceptualization, A.H.A.; methodology, A.H.A.; formal analysis, A.H.A., A.S., G.P.G., S.P. and I.C.R.; investigation, A.H.A. and V.K.S.; resources, A.H.A., V.K.S., P.K. and S.P.; data curation, A.H.A. and M.A.A.; writing—original draft preparation, A.H.A. and V.K.S.; writing—review and editing, A.H.A., V.K.S., M.S., P.K., A.S., S.P., G.P.G., I.C.R., M.A.A. and A.R.; visualization, A.H.A., V.K.S. and M.A.A. All authors have read and agreed to the published version of the manuscript.

Funding

This research received no external funding.

Data Availability Statement

All the data supporting the results are provided in the article itself.

Acknowledgments

We are thankful to the Director, BSIP, for sanctioning funds to support our study. As always, in the laboratory work, Archana Sonker was a tremendous help. We are incredibly grateful to Dorjay Namgial, our field guide from Leh, for his enthusiastic participation in our field studies by assisting us in getting to the sites, collecting samples, and doing in-situ measurements. Funding for this study was provided by BSIP. The BSIP contribution number for this MS is BSIP/RDCC/Publication no 30/2022-2023.

Conflicts of Interest

The authors declare no conflict of interest.

References

  1. van der Sloot, H.A.; Hoede, D.; Wijkstra, J.; Duinker, J.C.; Nolting, R.F. Anionic species of V, As, Se, Mo, Sb, Te and W in the Scheldt and Rhine estuaries and the Southern Bight (North Sea). Estuar. Coast. Shelf Sci. 1985, 21, 633–651. [Google Scholar] [CrossRef]
  2. Johannesson, K.H.; Lyons, W.B.; Graham, E.Y.; Welch, K.A. Oxyanion concentrations in eastern Sierra Nevada rivers–3. Boron, molybdenum, vanadium, and tungsten. Aquat. Geochem. 2000, 6, 19–46. [Google Scholar] [CrossRef]
  3. Mohajerin, T.J.; Helz, G.R.; Johannesson, K.H. Tungsten–molybdenum fractionation in estuarine environments. Geochim. et Cosmochim. Acta 2016, 177, 105–119. [Google Scholar] [CrossRef]
  4. Johannesson, K.H.; Tang, J. Conservative behavior of arsenic and other oxyanion-forming trace elements in an oxic groundwater flow system. J. Hydrol. 2009, 378, 13–28. [Google Scholar] [CrossRef]
  5. Guo, Q.; Li, Y.; Luo, L. Tungsten from typical magmatic hydrothermal systems in China and its environmental transport. Sci. Total Environ. 2019, 657, 1523–1534. [Google Scholar] [CrossRef] [PubMed]
  6. Liu, M.; Guo, Q.; Wu, G.; Guo, W.; She, W.; Yan, W. Boron geochemistry of the geothermal waters from two typical hydrothermal systems in Southern Tibet (China): Daggyai and Quzhuomu. Geothermics 2019, 82, 190–202. [Google Scholar] [CrossRef]
  7. Liu, M.; Guo, Q.; Luo, L.; He, T. Environmental impacts of geothermal waters with extremely high boron concentrations: Insight from a case study in Tibet, China. J. Volcanol. Geotherm. Res. 2020, 397, 106887. [Google Scholar] [CrossRef]
  8. Zhang, W.; Tan, H.; Zhang, Y.; Wei, H.; Dong, T. Boron geochemistry from some typical Tibetan hydrothermal systems: Origin and isotopic fractionation. Appl. Geochem. 2015, 63, 436–445. [Google Scholar] [CrossRef]
  9. Cheng, L.; Zhang, C.; Liu, X.; Yang, X.; Zhou, Y.; Horn, I.; Weyer, S.; Holtz, F. Significant boron isotopic fractionation in the magmatic evolution of Himalayan leucogranite recorded in multiple generations of tourmaline. Chem. Geol. 2021, 571, 120194. [Google Scholar] [CrossRef]
  10. Stefánsson, A.; Arnórsson, S. The geochemistry of As, Mo, Sb, and W in natural geothermal waters, Iceland. In Proceedings of the World Geothermal Congress, Antalya, Turkey, 24–29 April 2005; pp. 24–29. [Google Scholar]
  11. Arnórsson, S.; Óskarsson, N. Molybdenum and tungsten in volcanic rocks and in surface and <100 °C ground waters in Iceland. Geochim. Cosmochim. Acta 2007, 71, 284–304. [Google Scholar] [CrossRef]
  12. McCleskey, R.B.; Nordstrom, D.K.; Susong, D.D.; Ball, J.W.; Taylor, H.E. Source and fate of inorganic solutes in the Gibbon River, Yellowstone National Park, Wyoming, USA. II. Trace element chemistry. J. Volcanol. Geotherm. Res. 2010, 196, 139–155. [Google Scholar] [CrossRef]
  13. Kashiwabara, T.; Kubo, S.; Tanaka, M.; Senda, R.; Iizuka, T.; Tanimizu, M.; Takahashi, Y. Stable isotope fractionation of tungsten during adsorption on Fe and Mn (oxyhydr) oxides. Geochim. Cosmochim. Acta 2017, 204, 52–67. [Google Scholar] [CrossRef]
  14. Kashiwabara, T.; Takahashi, Y.; Marcus, M.A.; Uruga, T.; Tanida, H.; Terada, Y.; Usui, A. Tungsten species in natural ferromanganese oxides related to its different behavior from molybdenum in oxic ocean. Geochim. Cosmochim. Acta 2013, 106, 364–378. [Google Scholar] [CrossRef]
  15. Havig, J.R.; Kuether, J.E.; Gangidine, A.J.; Schroeder, S.; Hamilton, T.L. Hot Spring Microbial Community Elemental Composition: Hot Spring and Soil Inputs, and the Transition from Biocumulus to Siliceous Sinter. Astrobiology 2021, 21, 1526–1546. [Google Scholar] [CrossRef] [PubMed]
  16. Iveson, A.A.; Webster, J.D.; Rowe, M.C.; Neill, O.K. Fluid-melt trace-element partitioning behaviour between evolved melts and aqueous fluids: Experimental constraints on the magmatic-hydrothermal transport of metals. Chem. Geol. 2019, 516, 18–41. [Google Scholar] [CrossRef]
  17. Honegger, K.; Dietrich, V.; Frank, W.; Gansser, A.; Thöni, M.; Trommsdorff, V. Magmatism and metamorphism in the Ladakh Himalayas (the Indus-Tsangpo suture zone). Earth Planet. Sci. Lett. 1982, 60, 253–292. [Google Scholar] [CrossRef]
  18. Thussu, J.L. Geothermal Energy Resources of India; Geological Survey of India: Kolkata, India, 2002.
  19. Craig, J.; Absar, A.; Bhat, G.; Cadel, G.; Hafiz, M.; Hakhoo, N.; Kashkari, R.; Moore, J.; Ricchiuto, T.E.; Thurow, J.; et al. Hot springs and the geothermal energy potential of Jammu & Kashmir State, N.W. Himalaya, India. Earth-Sci. Rev. 2013, 126, 156–177. [Google Scholar] [CrossRef]
  20. Tiwari, S.K.; Rai, S.K.; Bartarya, S.K.; Gupta, A.K.; Negi, M. Stable isotopes (δ13CDIC, δD, δ18O) and geochemical characteristics of geothermal springs of Ladakh and Himachal (India): Evidence for CO2 discharge in northwest Himalaya. Geothermics 2016, 64, 314–330. [Google Scholar] [CrossRef]
  21. Shankar, R.; Padhi, R.N.; Arora, C.L.; Thussu, J.L.; Dua, K.J.S. Geothermal exploration of the Puga and Chumathang geothermal fields, Ladakh, India. In Proceedings of the 2nd United Nations Symposium on the Development and Use of Geothermal Resources, San Francisco, CA, USA, 20–29 May 1975; pp. 245–258. [Google Scholar]
  22. Das, P.; Maya, K.; Padmalal, D. Hydrogeochemistry of the Indian thermal springs: Current status. Earth-Sci. Rev. 2022, 224, 103890. [Google Scholar] [CrossRef]
  23. Tiwari, A.K.; Singh, A.K.; Phartiyal, B.; Sharma, A. Hydrogeochemical characteristics of the Indus river water system. Chem. Ecol. 2021, 37, 780–808. [Google Scholar] [CrossRef]
  24. Hautman, D.P.; Munch, D.J. Method 300.1 Determination of Inorganic Anions in Drinking Water by Ion Chromatography; US Environmental Protection Agency: Cincinnati, OH, USA, 1997.
  25. Giggenbach, W. Graphical techniques for the evaluation of water/rock equilibration conditions by use of Na, K, Mg and Ca contents of discharge waters. In Proceedings of 8th New Zealand Geothermal Workshop, 21–23 January 1986; pp. 37–44. Available online: https://www.geothermal-energy.org/pdf/IGAstandard/NZGW/1986/Giggenbach.pdf (accessed on 22 March 2023).
  26. Giggenbach, W.F. Geothermal solute equilibria. derivation of Na-K-Mg-Ca geoindicators. Geochim. Cosmochim. Acta 1988, 52, 2749–2765. [Google Scholar] [CrossRef]
  27. Sharma, A.; Kumar, K.; Laskar, A.; Singh, S.K.; Mehta, P. Oxygen, deuterium, and strontium isotope characteristics of the Indus River water system. Geomorphology 2017, 284, 5–16. [Google Scholar] [CrossRef]
  28. Lone, S.A.; Jeelani, G.; Deshpande, R.D.; Mukherjee, A. Stable isotope (δ18O and δD) dynamics of precipitation in a high altitude Himalayan cold desert and its surroundings in Indus river basin, Ladakh. Atmos. Res. 2019, 221, 46–57. [Google Scholar] [CrossRef]
  29. Giggenbach, W.F.; Soto, R.C. Isotopic and chemical composition of water and steam discharges from volcanic-magmatic-hydrothermal systems of the Guanacaste Geothermal Province, Costa Rica. Appl. Geochem. 1992, 7, 309–332. [Google Scholar] [CrossRef]
  30. Saxena, V.; D’Amore, F. Aquifer chemistry of the Puga and Chumatang high temperature geothermal systems in India. J. Volcanol. Geotherm. Res. 1984, 21, 333–346. [Google Scholar] [CrossRef]
  31. Absar, A.; Kumar, V.; Bajpai, I.; Sinha, A.; Kapoor, A. Reservoir modeling of Puga geothermal system, Ladakh, Jammu and Kashmir. Geol. Surv. India Spec. Publ. 1996, 45, 69–74. [Google Scholar]
  32. Azeez, K.A.; Harinarayana, T. Magnetotelluric evidence of potential geothermal resource in Puga, Ladakh, NW Himalaya. Curr. Sci. 2007, 93, 323–329. [Google Scholar]
  33. Bernard, R.; Taran, Y.; Pennisi, M.; Tello, E.; Ramirez, A. Chloride and Boron behavior in fluids of Los Humeros geothermal field (Mexico): A model based on the existence of deep acid brine. Appl. Geochem. 2011, 26, 2064–2073. [Google Scholar] [CrossRef]
  34. Reyes, A.; Trompetter, W. Hydrothermal water–rock interaction and the redistribution of Li, B and Cl in the Taupo Volcanic Zone, New Zealand. Chem. Geol. 2012, 314, 96–112. [Google Scholar] [CrossRef]
  35. Palmer, M.; Sturchio, N. The boron isotope systematics of the Yellowstone National Park (Wyoming) hydrothermal system: A reconnaissance. Geochim. Cosmochim. Acta 1990, 54, 2811–2815. [Google Scholar] [CrossRef]
  36. Kishida, K.; Sohrin, Y.; Okamura, K.; Ishibashi, J.-i. Tungsten enriched in submarine hydrothermal fluids. Earth Planet. Sci. Lett. 2004, 222, 819–827. [Google Scholar] [CrossRef]
  37. Smith, D.J.; Jenkin, G.; Naden, J.; Boyce, A.; Petterson, M.; Toba, T.; Darling, W.; Taylor, H.; Millar, I. Anomalous alkaline sulphate fluids produced in a magmatic hydrothermal system—Savo, Solomon Islands. Chem. Geol. 2010, 275, 35–49. [Google Scholar] [CrossRef]
  38. Nordstrom, D.K.; McCleskey, R.B.; Ball, J.W. Sulfur geochemistry of hydrothermal waters in Yellowstone National Park: IV Acid–sulfate waters. Appl. Geochem. 2009, 24, 191–207. [Google Scholar] [CrossRef]
  39. Guo, Q.; Wang, Y.; Liu, W. O, H, and Sr isotope evidences of mixing processes in two geothermal fluid reservoirs at Yangbajing, Tibet, China. Environ. Earth Sci. 2009, 59, 1589–1597. [Google Scholar] [CrossRef]
  40. Guo, L.; Wang, G.; Sheng, Y.; Sun, X.; Shi, Z.; Xu, Q.; Mu, W. Temperature governs the distribution of hot spring microbial community in three hydrothermal fields, Eastern Tibetan Plateau Geothermal Belt, Western China. Sci. Total Environ. 2020, 720, 137574. [Google Scholar] [CrossRef]
  41. Aiuppa, A.; Baker, D.; Webster, J. Halogens in volcanic systems. Chem. Geol. 2009, 263, 1–18. [Google Scholar] [CrossRef]
  42. Webster, J.D.; Vetere, F.; Botcharnikov, R.E.; Goldoff, B.; McBirney, A.; Doherty, A.L. Experimental and modeled chlorine solubilities in aluminosilicate melts at 1 to 7000 bars and 700 to 1250 °C: Applications to magmas of Augustine Volcano, Alaska. Am. Mineral. 2015, 100, 522–535. [Google Scholar] [CrossRef]
  43. Lakhan, N.; Singh, A.K.; Singh, B.; Premi, K.; Oinam, G. Evolution of Late Cretaceous to Palaeogene basalt–andesite–dacite–rhyolite volcanic suites along the northern margin of the Ladakh magmatic arc, NW Himalaya, India. J. Earth Syst. Sci. 2020, 129, 1–23. [Google Scholar] [CrossRef]
  44. Harinarayana, T.; Abdul Azeez, K.K.; Murthy, D.N.; Veeraswamy, K.; Eknath Rao, S.P.; Manoj, C.; Naganjaneyulu, K. Exploration of geothermal structure in Puga geothermal field, Ladakh Himalayas, India by magnetotelluric studies. J. Appl. Geophys. 2006, 58, 280–295. [Google Scholar] [CrossRef]
  45. Bos, A. Hydrothermal Element Distributions at High Temperatures: An Experimental Study on the Partitioning of Major and Trace Elements between Phlogopite, Haplogranitic Melt and Vapour; Faculteit Aardwetenschappen: Utrecht, The Netherlands, 1990. [Google Scholar]
  46. Orville, P.M. Alkali ion exchange between vapor and feldspar phases. Am. J. Sci. 1963, 261, 201–237. [Google Scholar] [CrossRef]
  47. Ahmad, T.; Thakur, V.C.; Islam, R.; Mukherjee, P.K. Geochemistry and geodynamic implications of magmatic rocks from the Trans-Himalayan arc. Geochem. J. 1998, 32, 383–404. [Google Scholar] [CrossRef]
  48. Lakhan, N.; Singh, A.K.; Akhtar, S.; Singh, B.P. Geochemical characteristics and petrogenesis of magmatic rocks of the Shyok suture zone, NW Ladakh Himalaya, India. Arab. J. Geosci. 2022, 15, 1–23. [Google Scholar] [CrossRef]
  49. Giggenbach, W.; Gonfiantini, R.; Jangi, B.; Truesdell, A. Isotopic and chemical composition of Parbati valley geothermal discharges, north-west Himalaya, India. Geothermics 1983, 12, 199–222. [Google Scholar] [CrossRef]
  50. Li, J.; Lowenstein, T.K.; Blackburn, I.R. Responses of evaporite mineralogy to inflow water sources and climate during the past 100 ky in Death Valley, California. Geol. Soc. Am. Bull. 1997, 109, 1361–1371. [Google Scholar] [CrossRef]
  51. Hoefs, J. Stable Isotope Geochemistry; Springer Nature: Berlin/Heidelberg, Germany, 2021. [Google Scholar]
  52. Craig, H. Isotopic variations in meteoric waters. Science 1961, 133, 1702–1703. [Google Scholar] [CrossRef]
  53. Schotterer, U.; Fröhlich, K.; Gäggeler, H.; Sandjordj, S.; Stichler, W. Isotope records from Mongolian and Alpine ice cores as climate indicators. In Climatic Change at High Elevation Sites; Springer: Berlin/Heidelberg, Germany, 1997; pp. 287–298. [Google Scholar]
  54. Angert, A.; Lee, J.-E.; Yakir, D. Seasonal variations in the isotopic composition of near-surface water vapour in the eastern Mediterranean. Tellus B Chem. Phys. Meteorol. 2008, 60, 674–684. [Google Scholar] [CrossRef]
  55. Dansgaard, W.; Clausen, H.B.; Gundestrup, N.; Johnsen, S.J.; Rygner, C. Dating and Climatic Interpretation of Two Deep Greenland Ice Cores. In Greenland Ice Core: Geophysics, Geochemistry, and the Environment; American Geophysical Union: Washington, DC, USA, 1985; pp. 71–76. [Google Scholar] [CrossRef]
  56. Zhou, S.; Nakawo, M.; Hashimoto, S.; Sakai, A. The effect of refreezing on the isotopic composition of melting snowpack. Hydrol. Process. 2008, 22, 873–882. [Google Scholar] [CrossRef]
  57. Heinrich, C.A.; Günther, D.; Audétat, A.; Ulrich, T.; Frischknecht, R. Metal fractionation between magmatic brine and vapor, determined by microanalysis of fluid inclusions. Geology 1999, 27, 755. [Google Scholar] [CrossRef]
  58. Williams-Jones, A.E.; Heinrich, C.A. 100th Anniversary Special Paper: Vapor Transport of Metals and the Formation of Magmatic-Hydrothermal Ore Deposits. Econ. Geol. 2005, 100, 1287–1312. [Google Scholar] [CrossRef]
  59. Shannon, R. Revised effective ionic radii and systematic studies of interatomic distances in halides and chalcogenides. Acta Crystallogr. Sect. A 1976, 32, 751–767. [Google Scholar] [CrossRef]
  60. Koutsospyros, A.; Braida, W.; Christodoulatos, C.; Dermatas, D.; Strigul, N. A review of tungsten: From environmental obscurity to scrutiny. J. Hazard. Mater. 2006, 136, 1–19. [Google Scholar] [CrossRef]
  61. Mohajerin, T.J.; Helz, G.R.; White, C.D.; Johannesson, K.H. Tungsten speciation in sulfidic waters: Determination of thiotungstate formation constants and modeling their distribution in natural waters. Geochim. Cosmochim. Acta 2014, 144, 157–172. [Google Scholar] [CrossRef]
  62. Rudnick, R.L.; Gao, S. Composition of the Continental Crust. In Treatise on Geochemistry; Holland, H.D., Turekian, K.K., Eds.; Pergamon: Oxford, UK, 2003; pp. 1–64. [Google Scholar] [CrossRef]
  63. Candela, P.A. Controls on ore metal ratios in granite-related ore systems: An experimental and computational approach. Earth Environ. Sci. Trans. R. Soc. Edinb. 1992, 83, 317–326. [Google Scholar]
  64. Candela, P.A.; Bouton, S.L. The influence of oxygen fugacity on tungsten and molybdenum partitioning between silicate melts and ilmenite. Econ. Geol. 1990, 85, 633–640. [Google Scholar] [CrossRef]
  65. Zhang, Y.; Gao, J.-F.; Ma, D.; Pan, J. The role of hydrothermal alteration in tungsten mineralization at the Dahutang tungsten deposit, South China. Ore Geol. Rev. 2018, 95, 1008–1027. [Google Scholar] [CrossRef]
  66. Wang, X.-S.; Williams-Jones, A.E.; Hu, R.-Z.; Shang, L.-B.; Bi, X.-W. The role of fluorine in granite-related hydrothermal tungsten ore genesis: Results of experiments and modeling. Geochim. Cosmochim. Acta 2021, 292, 170–187. [Google Scholar] [CrossRef]
  67. Manning, D.A.C.; Henderson, P. The behaviour of tungsten in granitic melt-vapour systems. Contrib. Mineral. Petrol. 1984, 86, 286–293. [Google Scholar] [CrossRef]
  68. Liu, X.; Xiao, C.; Wang, Y. The relative solubilities of wolframite and scheelite in hydrothermal fluids: Insights from thermodynamic modeling. Chem. Geol. 2021, 584, 120488. [Google Scholar] [CrossRef]
  69. Steller, L.H.; Nakamura, E.; Ota, T.; Sakaguchi, C.; Sharma, M.; Van Kranendonk, M.J. Boron isotopes in the Puga geothermal system, India, and their implications for the habitat of early life. Astrobiology 2019, 19, 1459–1473. [Google Scholar] [CrossRef]
  70. Cinti, D.; Pizzino, L.; Voltattorni, N.; Quattrocchi, F.; Walia, V. Geochemistry of thermal waters along fault segments in the Beas and Parvati valleys (north-west Himalaya, Himachal Pradesh) and in the Sohna town (Haryana), India. Geochem. J. 2009, 43, 65–76. [Google Scholar] [CrossRef]
  71. Valentino, G.M.; Stanzione, D. Source processes of the thermal waters from the Phlegraean Fields (Naples, Italy) by means of the study of selected minor and trace elements distribution. Chem. Geol. 2003, 194, 245–274. [Google Scholar] [CrossRef]
  72. Aggarwal, J.K.; Palmer, M.R.; Bullen, T.D.; Arnórsson, S.; Ragnarsdóttir, K.V. The boron isotope systematics of Icelandic geothermal waters: 1. Meteoric water charged systems. Geochim. Cosmochim. Acta 2000, 64, 579–585. [Google Scholar] [CrossRef]
  73. Millot, R.; Hegan, A.; Négrel, P. Geothermal waters from the Taupo Volcanic Zone, New Zealand: Li, B and Sr isotopes characterization. Appl. Geochem. 2012, 27, 677–688. [Google Scholar] [CrossRef]
  74. Battistel, M.; Hurwitz, S.; Evans, W.C.; Barbieri, M. The chemistry and isotopic composition of waters in the low-enthalpy geothermal system of Cimino-Vico Volcanic District, Italy. J. Volcanol. Geotherm. Res. 2016, 328, 222–229. [Google Scholar] [CrossRef]
  75. Chaussidon, M.; Albarède, F. Secular boron isotope variations in the continental crust: An ion microprobe study. Earth Planet. Sci. Lett. 1992, 108, 229–241. [Google Scholar] [CrossRef]
  76. Zhao, Z.; Yang, X.; Lu, Y.; Zhang, Z.; Chen, S.; Sun, C.; Hou, Q.; Wang, Y.; Li, S. Geochemistry and boron isotope compositions of tourmalines from the granite-greisen-quartz vein system in Dayishan pluton, Southern China: Implications for potential mineralization. Am. Mineral. 2022, 107, 495–508. [Google Scholar] [CrossRef]
  77. Yang, S.-Y.; Jiang, S.-Y.; Palmer, M.R. Chemical and boron isotopic compositions of tourmaline from the Nyalam leucogranites, South Tibetan Himalaya: Implication for their formation from B-rich melt to hydrothermal fluids. Chem. Geol. 2015, 419, 102–113. [Google Scholar] [CrossRef]
  78. Gou, G.-N.; Wang, Q.; Wyman, D.A.; Xia, X.-P.; Wei, G.-J.; Guo, H.-F. In situ boron isotopic analyses of tourmalines from Neogene magmatic rocks in the northern and southern margins of Tibet: Evidence for melting of continental crust and sediment recycling. Solid Earth Sci. 2017, 2, 43–54. [Google Scholar] [CrossRef]
  79. Hu, G.; Zeng, L.; Gao, L.-E.; Liu, Q.; Chen, H.; Guo, Y. Diverse magma sources for the Himalayan leucogranites: Evidence from B-Sr-Nd isotopes. Lithos 2018, 314–315, 88–99. [Google Scholar] [CrossRef]
  80. Zhou, Q.; Li, W.; Wang, G.; Liu, Z.; Lai, Y.; Huang, J.; Yan, G.; Zhang, Q. Chemical and boron isotopic composition of tourmaline from the Conadong leucogranite-pegmatite system in South Tibet. Lithos 2019, 326–327, 529–539. [Google Scholar] [CrossRef]
  81. Marschall, H.R.; Jiang, S.-Y. Tourmaline Isotopes: No Element Left Behind. Elements 2011, 7, 313–319. [Google Scholar] [CrossRef]
  82. van Hinsberg, V.J.; Henry, D.J.; Marschall, H.R. Tourmaline: An ideal indicator of its host environment. Can. Mineral. 2011, 49, 1–16. [Google Scholar] [CrossRef]
Figure 1. The generalized geological map of Ladakh shows the location of Panamik, Chumathang, and Puga hotsprings and Shyok river sites (after Tiwari, Rai, Bartarya, Gupta and Negi [20]).
Hydrology 10 00118 g001
Figure 2. The cross plots of (a) W vs. Mo, (b) W vs. TKN, (c) Cl vs. W, (d) Cl vs. Mo, (e) TKN vs. Mo, and (f) TKN vs. Mo/W with their respective R2 values and regression equations. The Pearson coefficient for each regression equation is found to be <0.05.
Hydrology 10 00118 g002
Figure 3. The cross plots of (a) Cl vs. Na and (b) Cl vs. K with their respective R2 values and regression equations. The Pearson coefficient for each regression equation is found to be <0.05.
Hydrology 10 00118 g003
Figure 4. The Na-K-Mg geothermometry ternary plot (after Giggenbach [25]) shows estimated reservoir temperatures for Panamik, Chumathang, and Puga geothermal systems.
Hydrology 10 00118 g004
Figure 5. The Cl-SO4-HCO3 ternary plot (after Giggenbach [26]) shows the predominant origin of the hotspring waters.
Hydrology 10 00118 g005
Figure 6. The δD vs. δ18O plot of data from Panamik, Chumathang, and Puga hotspring waters [18,20,27], Ladakh’s meteoric waters [28], river waters [27], and magmatic waters [29], showing meteoric and magmatic water inputs the hotspring waters. The Pearson coefficient for each regression equation is found to be <0.05.
Hydrology 10 00118 g006
Figure 7. The Cl vs. pH plot shows a significant negative correlation between the two parameters for the hotspring waters having temperature > 40 °C. The Pearson coefficient for the regression equation is found to be <0.05.
Hydrology 10 00118 g007
Figure 8. The Cl vs. SO4 plot shows the influence of subsurface boiling and the contribution of liquid and vapor phases (after Havig, Kuether, Gangidine, Schroeder, and Hamilton [15]) in the hotspring waters.
Hydrology 10 00118 g008
Figure 9. The cross plots of (a) B vs. Cl showing B sourcing from rock-leaching and magmatic waters, (b) B vs. pH showing three possible end members of B, (c) B vs. TKN showing the influence of reservoir temperature and B enrichment, (d) B vs. SO4/Cl. The Pearson coefficient for each regression equation is found to be <0.05.
Hydrology 10 00118 g009
Figure 10. The altitude vs. Mo/W plot shows the possible influence of fugacity on Mo/W ratios. The Pearson coefficient for the regression equation is found to be <0.05.
Hydrology 10 00118 g010
Table 1. The result of temperature, pH, Mo, W, B, Na, K, Ca, Mg, Cl, and SO4 are from Puga hotspring sites (PUGA series), Chumathang hotspring sites (CHTNG series), Panamik hotspring sites (PAN series), and Shyok River. The HCO3 data for Puga, Chumathang, and Panamik hotspring waters are acquired from Tiwari, Rai, Bartarya, Gupta and Negi [20]. The average geochemical data from the rivers in Ladakh (Ladakh Rivers Average b) are obtained from Tiwari, Singh, Phartiyal, and Sharma [23].
Sample IDpHTempMoWBNaKCaMgClSO4HCO3
(°C)μg/L (ppb)mg/L (ppm)
PUGA-1.16.9258.001.22255.2862.07437.3264.798.820.811690.48455.54817 ᵃ
PUGA-1.210.2436.800.46266.30378.03396.6060.937.750.741719.34431.78
PUGA-1.3n.a.38.400.38282.43194.91457.4669.597.860.881865.25484.45
PUGA-1.48.4657.800.23278.53114.32463.9970.862.910.061858.02545.72
PUGA-2.15.7363.400.17228.11123.99448.3968.5210.241.02n.a.n.a.
PUGA-2.26.8358.100.23123.1459.90318.0046.119.300.811171.56311.75
PUGA-2.37.9045.400.19153.88108.84364.6149.109.640.921241.15350.78
PUGA-2.48.6338.500.10119.5072.28329.6046.049.110.881177.54317.56
PUGA-2.59.687.000.28193.97679.62476.4667.719.061.301885.59330.73
PUGA-36.2964.900.12217.19452.17463.9369.4210.281.521942.04504.06
PUGA-45.6079.200.12265.73145.85488.5275.518.080.921984.26550.11
CHTNG-18.4064.607.39127.8117.81275.5119.421.580.04458.271054.29365 ᵃ
CHTNG-28.2068.506.53141.3747.18306.3521.351.800.07523.801177.89
CHTNG-37.1484.107.10125.9599.39261.3019.092.170.20469.631084.36
CHTNG-47.9184.305.50116.9268.54283.4519.381.620.05486.581099.82
CHTNG-57.9582.806.06112.85115.40290.2819.621.390.07514.031141.02
PAN-1.19.1270.608.4839.33n.a.n.a.n.a.n.a.n.a.44.94479.01237 ᵃ
PAN-1.210.6270.708.28124.770.67134.735.7811.970.2442.55470.09
PAN-1.39.5670.707.7739.130.94160.296.4811.540.1044.21483.96
PAN-1.410.1169.009.0441.664.31132.805.5911.420.1044.80488.00
PAN-1.510.3668.008.7043.741.49122.085.2111.680.1739.91435.66
PAN-1.610.7565.2010.0851.222.06140.735.9910.990.0845.19498.52
PAN-1.710.7063.009.4948.033.74134.375.6810.220.1045.38493.16
PAN-1.89.9367.708.1037.450.67131.425.6510.320.0841.56463.34
PAN-1.98.8066.909.5949.570.76139.016.0810.740.1845.35487.90
PAN-5.111.2065.5012.7844.750.92136.025.9412.460.1042.84470.66
PAN-5.210.5267.6013.6149.820.55135.175.7812.920.0843.30547.66
PAN-5.37.9672.3012.0441.210.60137.425.9613.090.0942.78467.00
PAN-5.48.2274.4011.7138.400.55137.295.9911.880.1642.05460.05
Shyok River10.2517.501.08<0.0000.2115.334.2222.9811.20n.a.n.a.n.a.
Ladakh Rivers Average b7.62n.a.n.a.n.a.n.a.5.131.9621.574.303.0014.3082.19
a denotes data acquired from Tiwari, Rai, Bartarya, Gupta and Negi [20]; b denotes data acquired from Tiwari, Singh, Phartiyal and Sharma [23]; and n.a. denotes data not available.
Disclaimer/Publisher’s Note: The statements, opinions and data contained in all publications are solely those of the individual author(s) and contributor(s) and not of MDPI and/or the editor(s). MDPI and/or the editor(s) disclaim responsibility for any injury to people or property resulting from any ideas, methods, instructions or products referred to in the content.

