Article

Observed Changes in Rainfall and Characteristics of Extreme Events in Côte d’Ivoire (West Africa)

by
Daouda Konate
1,
Sacre Regis Didi
2,3,4,
Kouakou Bernard Dje
1,
Arona Diedhiou
3,5,*,
Kouakou Lazare Kouassi
4,
Bamory Kamagate
6,
Jean-Emmanuel Paturel
1,2,7,
Houebagnon Saint Jean-Patrick Coulibaly
2,3,
Claude Alain Koffi Kouadio
2,3 and
Talnan Jean Honoré Coulibaly
2
1
Direction de la Météorologie Nationale à la Société d’Exploitation et de Développement Aéroportuaire, Aéronautique et Météorologie (SODEXAM-DMN), 15 BP 990 Abidjan, Côte d’Ivoire
2
Laboratory of Geosciences and Environmental Sciences (SGE), University Nangui Abrogoua (UNA), 02 BP 801 Abidjan, Côte d’Ivoire
3
African Centre of Excellence on Climate Change, Biodiversity and Sustainable Development/University Felix Houphouet-Boigny (UFHB), 22 BP 463 Abidjan, Côte d’Ivoire
4
Laboratory of Environmental Sciences and Technologies, UFR Environment, University Jean Lorougnon Guédé, BP 150 Daloa, Côte d’Ivoire
5
Institute of Environmental Geosciences (IGE), University of Grenoble Alpes, IRD, CNRS, Grenoble INP, F-38000 Grenoble, France
6
University of Man, BP V 20 Man, Côte d’Ivoire
7
University of Montpellier, IRD, HSM, F-34000 Montpellier, France
*
Author to whom correspondence should be addressed.
Hydrology 2023, 10(5), 104; https://doi.org/10.3390/hydrology10050104
Submission received: 30 January 2023 / Revised: 20 April 2023 / Accepted: 23 April 2023 / Published: 30 April 2023
(This article belongs to the Special Issue Trends and Variations in Hydroclimatic Variables)

Abstract

:
This study evaluates how the characteristics of daily rainfall and extreme events in Côte d’Ivoire changed during 1961–2015 using the rain gauge observation network of the National Meteorological Service (SODEXAM). The results indicate that the northern and southern parts of Cote d’Ivoire experienced a change from a wet to a dry period, with cut-offs in 1982 and 1983, respectively. In the northern part, this dry period was marked by a decrease in rainfall intensity, the length of wet spells, and the contribution of heavy and extreme rainfall, as well as an increase in the number of rainy days and a decrease in the length of dry spells. Over the southern part, this dry period was marked by an increase in the maximum length of dry spells associated with an increase in the maximum 1-day and 5-day precipitation events. The western part of Côte d’Ivoire experienced a late cut-off from the wet to dry period in 2000; the dry period was associated with a decrease in the number of rainy days, rainfall intensities, and maximum length of wet spells. Changes in the central part of Cote d’Ivoire presented high variability, and trends were less marked, even though a cut-off from a wet to dry period was detected in 1991. This study shows that Côte d’Ivoire, which is located in a subhumid and humid region and has an economy dependent on agriculture (especially cash crops, which comprise 60% of the GDP), is experiencing dry spells that are increasing in frequency and length. Combined with deforestation to increase production, this situation could lead to desertification and compromise the sustainable development goals of the country. The contribution of heavy rainfall was found to increase during the last 15 years, increasing the overall risk of floods, especially in urban areas where city authorities and populations are not prepared, thereby threatening infrastructure and human security.

1. Introduction

Côte d’Ivoire, like the rest of West Africa, is experiencing significant spatial and temporal variations in rainfall patterns, with consequences for its socio-economic activities. Indeed, nearly 2000 people in the Ivorian city of Agboville (located in southern area) struggled to find drinking water during the rainy season of 27 July 2007, after sewage-filled flood waters poisoned wells that were the sole source of water for the inhabitants [6]. In the northwest part of Côte d’Ivoire during the same year, most of the roads and bridges around Odienné (the regional capital) were unusable due to heavy rains in September 2007. In Abidjan (the Southern part), a dozen people, including women and children, were confirmed dead, and extensive damage was recorded, including homes destroyed after the heavy rains of June 2010, leading to landslides in some slum areas. However, analysis of historical observations indicates that between 1996 to 2015, the country recorded 118 deaths during rainy seasons [7]. It is estimated that there were about 30 floods throughout the country during last decade (2000–2015), with an average of three (03) floods per year [8,9,10,11]).
During the last 30 years, several studies on climate change in Côte d’Ivoire have focused on the mean and total rainfall [1,2,3], while a few recent studies have explored the evolution of extreme rainfall events [4]. The greatest threat that could emerge from climate change is the amplification of these extremes [5]. Moreover, in recent decades, Africa and Côte d’Ivoire have experienced tremendous damage due to climate extremes. Droughts, floods, famines, diseases, and migrations with loss of life are some of the issues faced by rural and urban inhabitants due to these climate extremes.
However, very few studies have focused on analyzing the spatial and temporal evolution of high-impact events at the scale of Côte d’Ivoire. [12] analyzed the average values and number of rainy days from 47 rainfall stations in Côte d’Ivoire over the period of 1950–1999, highlighting an overall increase in rainfall over the period of 1950–1969, followed by a decrease from 1970 to 1999. Based on data from 44 rainfall stations in Côte d’Ivoire, [8] analyzed the extreme daily rainfall over the period 1942–2002 and found no clear change in either the mean or variance of rainfall. In the southern part and most of the main cities of the country, studies based on reanalysis and satellite products have shown that rainfall has varied considerably during the last decades [4,13,14,15].
It is, therefore, essential to the analyze and quantify the degree to which precipitation has changed or led to extreme rainfall events using the rain gauge observation network of the National Meteorological Service of Côte d’Ivoire (SODEXAM) so that strategies can be developed to reduce the vulnerability of populations and key sectors such as agriculture, energy, and infrastructure. The aim of this paper is to study the evolution of total precipitation and extremes in Côte d’Ivoire through a statistical analysis of daily rainfall measured over the last 55 years (1961–2015) by synoptic stations distributed in the four major climatic zones. This analysis complements the previous studies carried out by [8,12] using recent observations and adding the evolution of extreme rainfall events, as well as their spatial distribution and frequency in the main climatic regions, to the calculation of trends. This manuscript is structured as follows: Section 2 describes the data and methodology. Section 3 presents the results, followed by the discussion in Section 4. Finally, Section 4 offers concluding remarks.

2. Materials and Methods

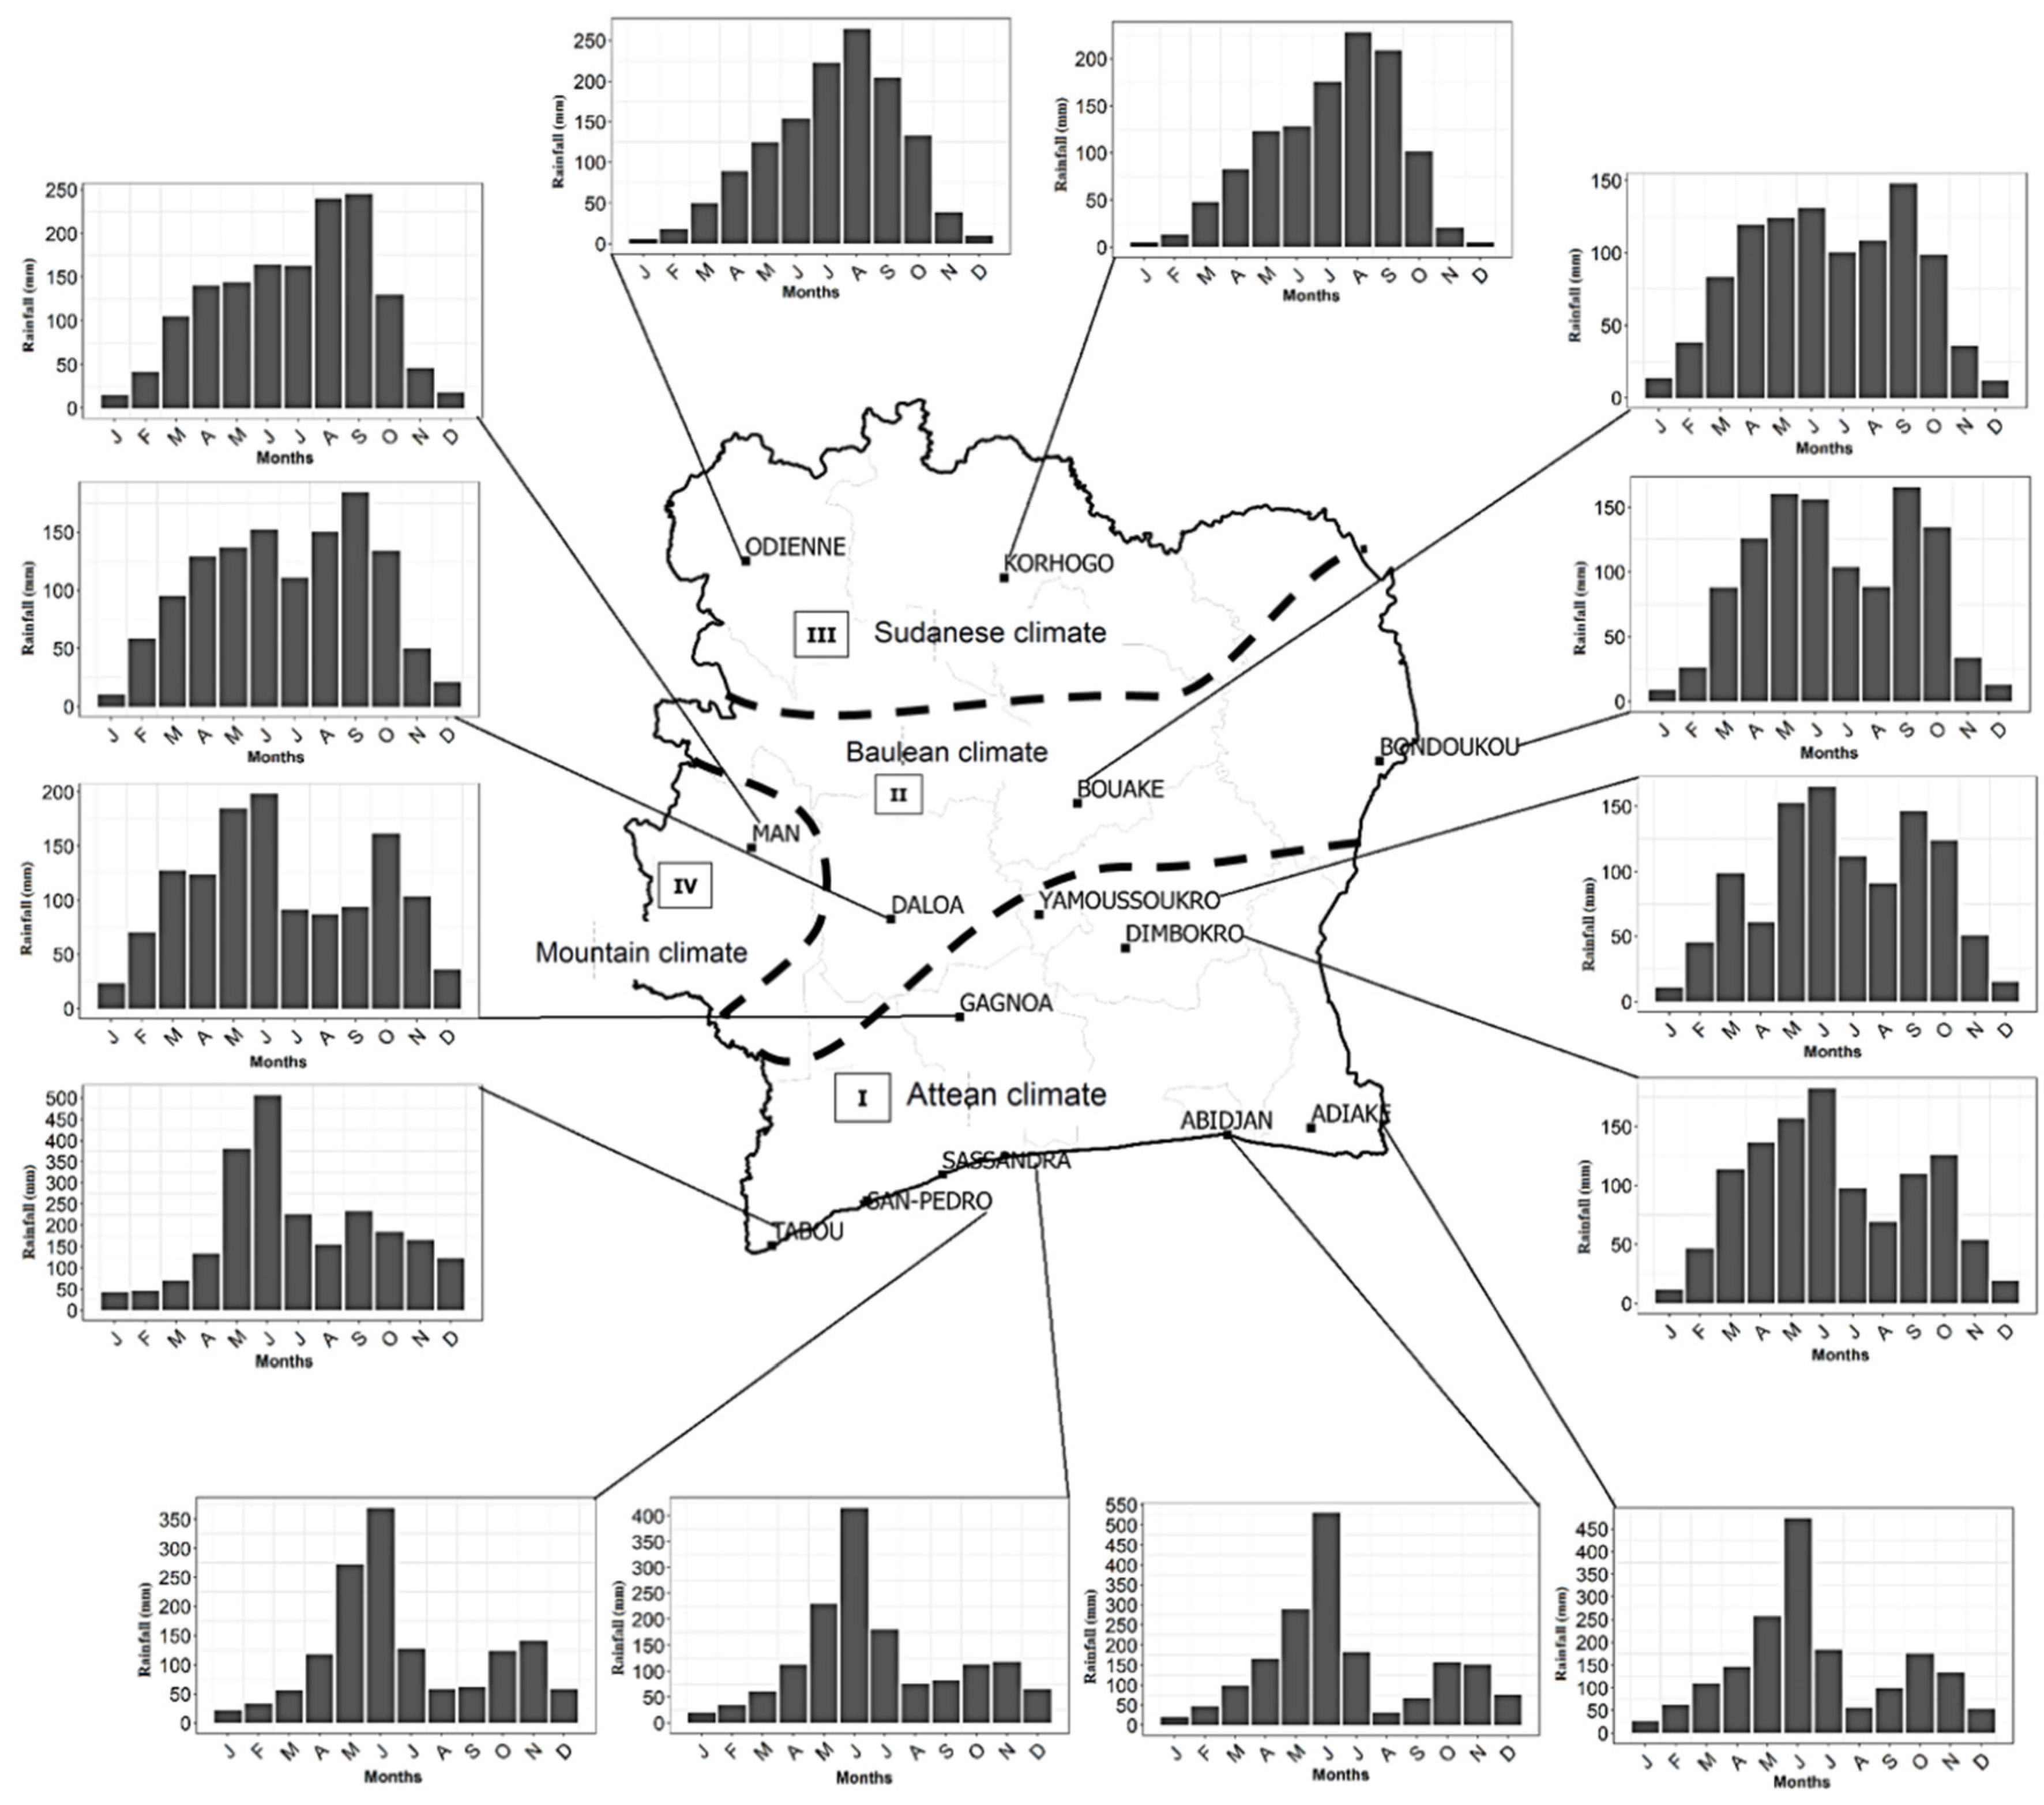
2.1. Description of the Data and Stations Used

In this study, we selected all synoptic stations from the National Meteorological Service of Côte d’Ivoire (SODEXAM) for which homogenized daily rainfall time series are available and adjusted over a sufficiently long study period (1961–2015).
These stations include 14 widely spaced synoptic stations located throughout the country (Figure 1), with more than 40 years of rainfall observations on average (Table 1). These data were used to analyze long-term rainfall variations and, more specifically, their extremes, as well as their frequency and intensity, over the entirety of Côte d’Ivoire.
Figure 1 presents the monthly cumulative rainfall during the relevant climatological periods for the different stations used in this study. At the two stations located in the northern part of Côte d’Ivoire (Odienné and Korhogo), a uni-modal regime can be observed, featuring a mean rainy season lasting from May to October with maxima in July–August at Odienné (250 mm) and August–September at Korhogo (200 mm). In the western region, at the Man synoptic station, the rainy season ranges from May to October, with the maximum recorded in August and September (>200 mm). In the central region, which is a transition zone between the northern and southern areas containing the synoptic stations of Bouaké, Daloa, and Bondoukou, the rainy season has a bimodal pattern, showing two major rainy seasons from March to June with the first maximum in May–June, a short dry season in July to August, a second rainy season from September to November (with the second maximum in October to November), and a dry season in December, January, and February. In the southern part (Gagnoa, Yamoussoukro, Dimbokro, Tabou, San-Pedro, Sassandra, Abidjan, and Adiaké), a bimodal regime is also noted. This regime is similar to that of the central part but with higher rainfall maxima (more than 350 mm) in the first rainy season; in the central area, the monthly average maxima are below 200 mm. Notably, over the central part, the average maxima during the two rainy seasons are of the same magnitude, while over the southern part, the monthly average rainfall maxima are higher during the first rainy season (more than 350 mm) than during the second rainy season (less than 200 mm).

2.2. Methodology

2.2.1. Rainfall Indices

The indices used here to characterize the frequency, intensity, and duration of climate extremes were defined by World Meteorological Organization [16,17] as part of the CC/CLIVAR Expert Team on Climate Change Detection, Monitoring, and Indices (ETCCDMI). These indices are presented in Table 2.

2.2.2. Trend Detection Methods

The best-fit linear trend is often used to analyze the temporal change of a time series. Therefore, in addition to the computation of the best-fit linear trend, we also computed an estimator of the slope based on Kendall’s rank correlation. This method was proposed by [18] and has been applied in several extreme climate studies (see [4,13,19,20,21]. The estimator is the median of the slopes obtained from all joining pairs of points in the series, and the confidence interval is calculated from the tabulated values [10,22]. The existence of a trend is deemed statistically significant at a p-value lower than or equal to 5%, equivalent to a 95% confidence level. We used the best-fit linear trend as previously described by [23,24], who applied this model to data series measured at a station and spatially aggregated data to perform a trend analysis of rainfall [25]. In this study, a trend analysis was performed for all indices both at the station and based on averaged observed data in the region.

2.2.3. Regionalization of Stations via the Climate Zone Method

In order to carry out a comparative study of the spatial and temporal variability of the total and extreme precipitation indices calculated over Côte d’Ivoire, we used the regionalization of stations based on climate zones, as established by [26], to estimate the climate change in each region (Figure 1). Consequently, the stations located along the coast and a little further in the center (Abidjan, Adiake, Sassandra, San-Pedro, Tabou, Dimbokro, Gagnoa, and Yamoussoukro) were considered to belong to a so-called Attean climate. The synoptic stations of Daloa, Bouake, and Bondoukou were grouped under the Baulean climate. The stations of Korhogo and Odienné in the northern part of the country were representative of a Sudanese climate. Finally, the station of Man, located in the western part of the country and far from the other stations, was considered to belong to a mountain climate.

2.2.4. Break Detection and Reduced Centered Index Method

This section focuses on the changes in annual precipitation caused by temporal variability (PRCPTOT) calculated in each climate zone according to the zones presented in Section 2.2.3. To detect breaks in rainfall patterns, the segmentation procedure used by [27] and the Pettitt test [28] were applied to the annual precipitation in each climate zone over the period of 1961–2015. These segmentations were obtained at a 0.05 level of significance using the Scheffe test, and these breaks were also confirmed by a Pettitt test. The reduced centered rainfall index is the ratio of the deviation from the interannual mean to the standard deviation of annual rainfall [29]. This index allowed us to observe interannual variability and periods of deficits and excess in rainfall series covering the period of 1961–2015.

2.2.5. Frequency Distribution in Extreme Precipitation Indices by Climate Zone

In this section, the time series of data in each climate zone were subdivided into two non-overlapping subperiods according to the methodology used by [30] comparing periods before and after the break. These subperiods were selected based on the results obtained in the previous section (Section 2.2.4) for the temporal variability of annual precipitation (PRCPTOT) in each climate zone. The frequency distribution function or bell curve for each period was then fitted to a Gamma distribution probability density, and comparison of these two probability densities enabled a visual examination of the possibility of a trend or change in a skewed distribution, such as the frequency of total rainfall and extreme events [31,32].

3. Results

3.1. Temporal Variability of Indices at Each Synoptic Station

The results of the trend analysis of total and extreme rainfall at the 14 synoptic stations of Côte d’Ivoire are qualitatively displayed in Table 3, with dark red indicating a significant decreasing trend and dark blue indicating a significant increasing trend over the period, according to the corresponding stations. In addition, light red and light blue indicate a non-significant decrease or increase in the indices, respectively, over the study periods of the different stations.
At the stations of Korhogo and Odienné (northern part), we observed a global decrease in all the calculated indices except for RR1, which recorded an increase at the two stations that was significant only for the station of Korhogo. The decrease observed in the other indices was significant at Odienné station, while at Korhogo, significance was noted for the intensity of rainfall and number of days with heavy rainfall (SDII, R10, and R20 mm).
In the central part, changes at the stations of Gagnoa, Yamoussoukro, and Daloa were not significant. However, there was a trend toward an overall increase in PRCPTOT, SDII, R20 mm, R95 P, R99 P, and RX1 DAY. Significant increases in SDII, RX1 DAY, and RX5 DAY (intensity and extreme rainfall events) were only observed at the station of Gagnoa.
At Bouaké station, we observed a significant decrease in all indices, except for CDD, CWD, and R99 P, which presented a non-significant decrease, and RR1, which presented a non-significant increase. At Bondoukou station, a non-significant increase in SDII, CDD, and R20 mm was noted, while the other indices showed a non-significant decrease, except for CWD, which decreased significantly. At Dimbokro station, a non-significant increase in CDD and RX1 DAY was noted, while PRCPTOT and CWD decreased significantly. The other indices presented a non-significant decreasing trend.
In the western part, in the so-called mountain climatic zone, a significant decrease in all indices except for R99 P and RX1 DAY was found at Man station.
In the southern part of Côte d’Ivoire, the stations of Abidjan and nearby Adiaké showed the same decreasing trends for all indices except for CDD, which presented a non-significant increase. These decreases were significant for all indices (except R99P and RX1DAY) at Adiaké station, while at Abidjan station, this significant decrease was noted only for the annual total and extreme daily precipitation (PRCPTOT, RX1 DAY, and RX5 DAY).
The station of San-Pedro showed a non-significant increase in PRCPTOT, SDII, R10, and R20 mm and a non-significant decrease in the other indices, except for CWD, which presented a significant decrease.
All changes at Tabou station were not significant; however, a non-significant increase in R95 p, R99 P, and RX1 DAY was noted, while other indices showed a non-significant decrease.
At Sassandra station, a significant decrease was noted in the annual total precipitation (PRCPTOT), the intensity (SDII), the extreme (RX1 DAY, RX5 DAY, R95 P, and R99 P), and the number of days with heavy rainfall (R20 mm). However, this station presented a non-significant increase in RR1, CDD, and R10 mm.

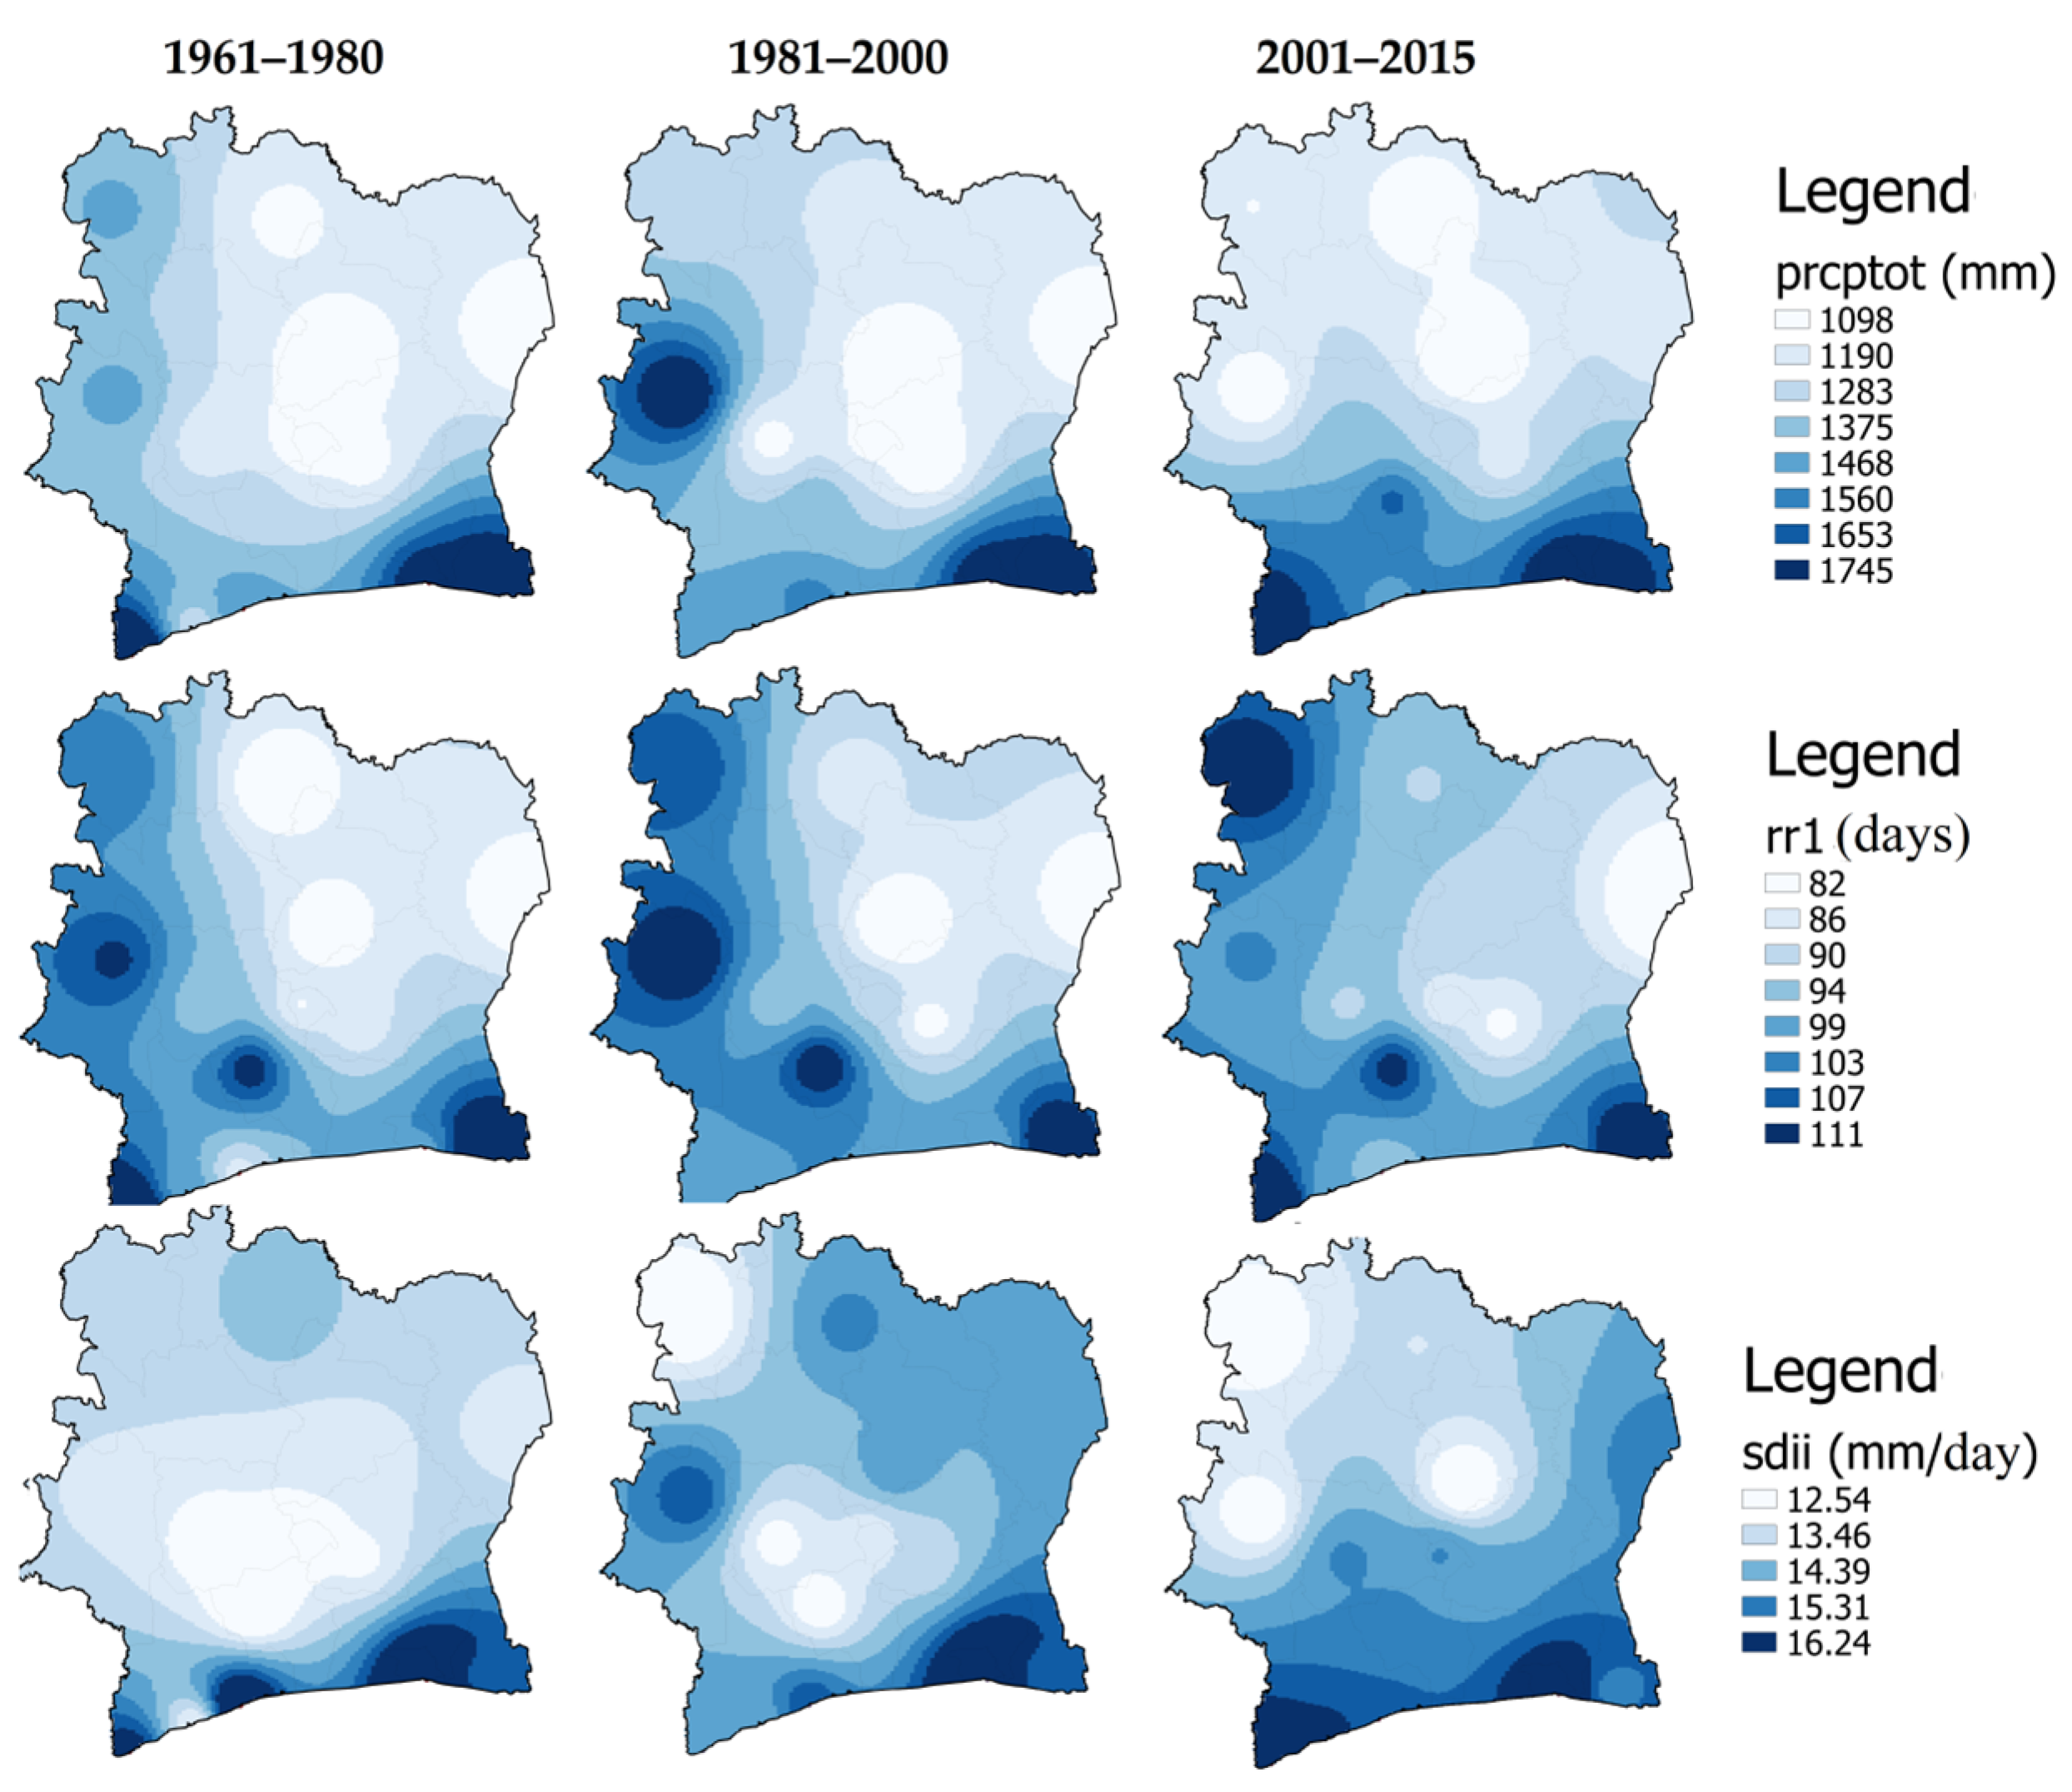
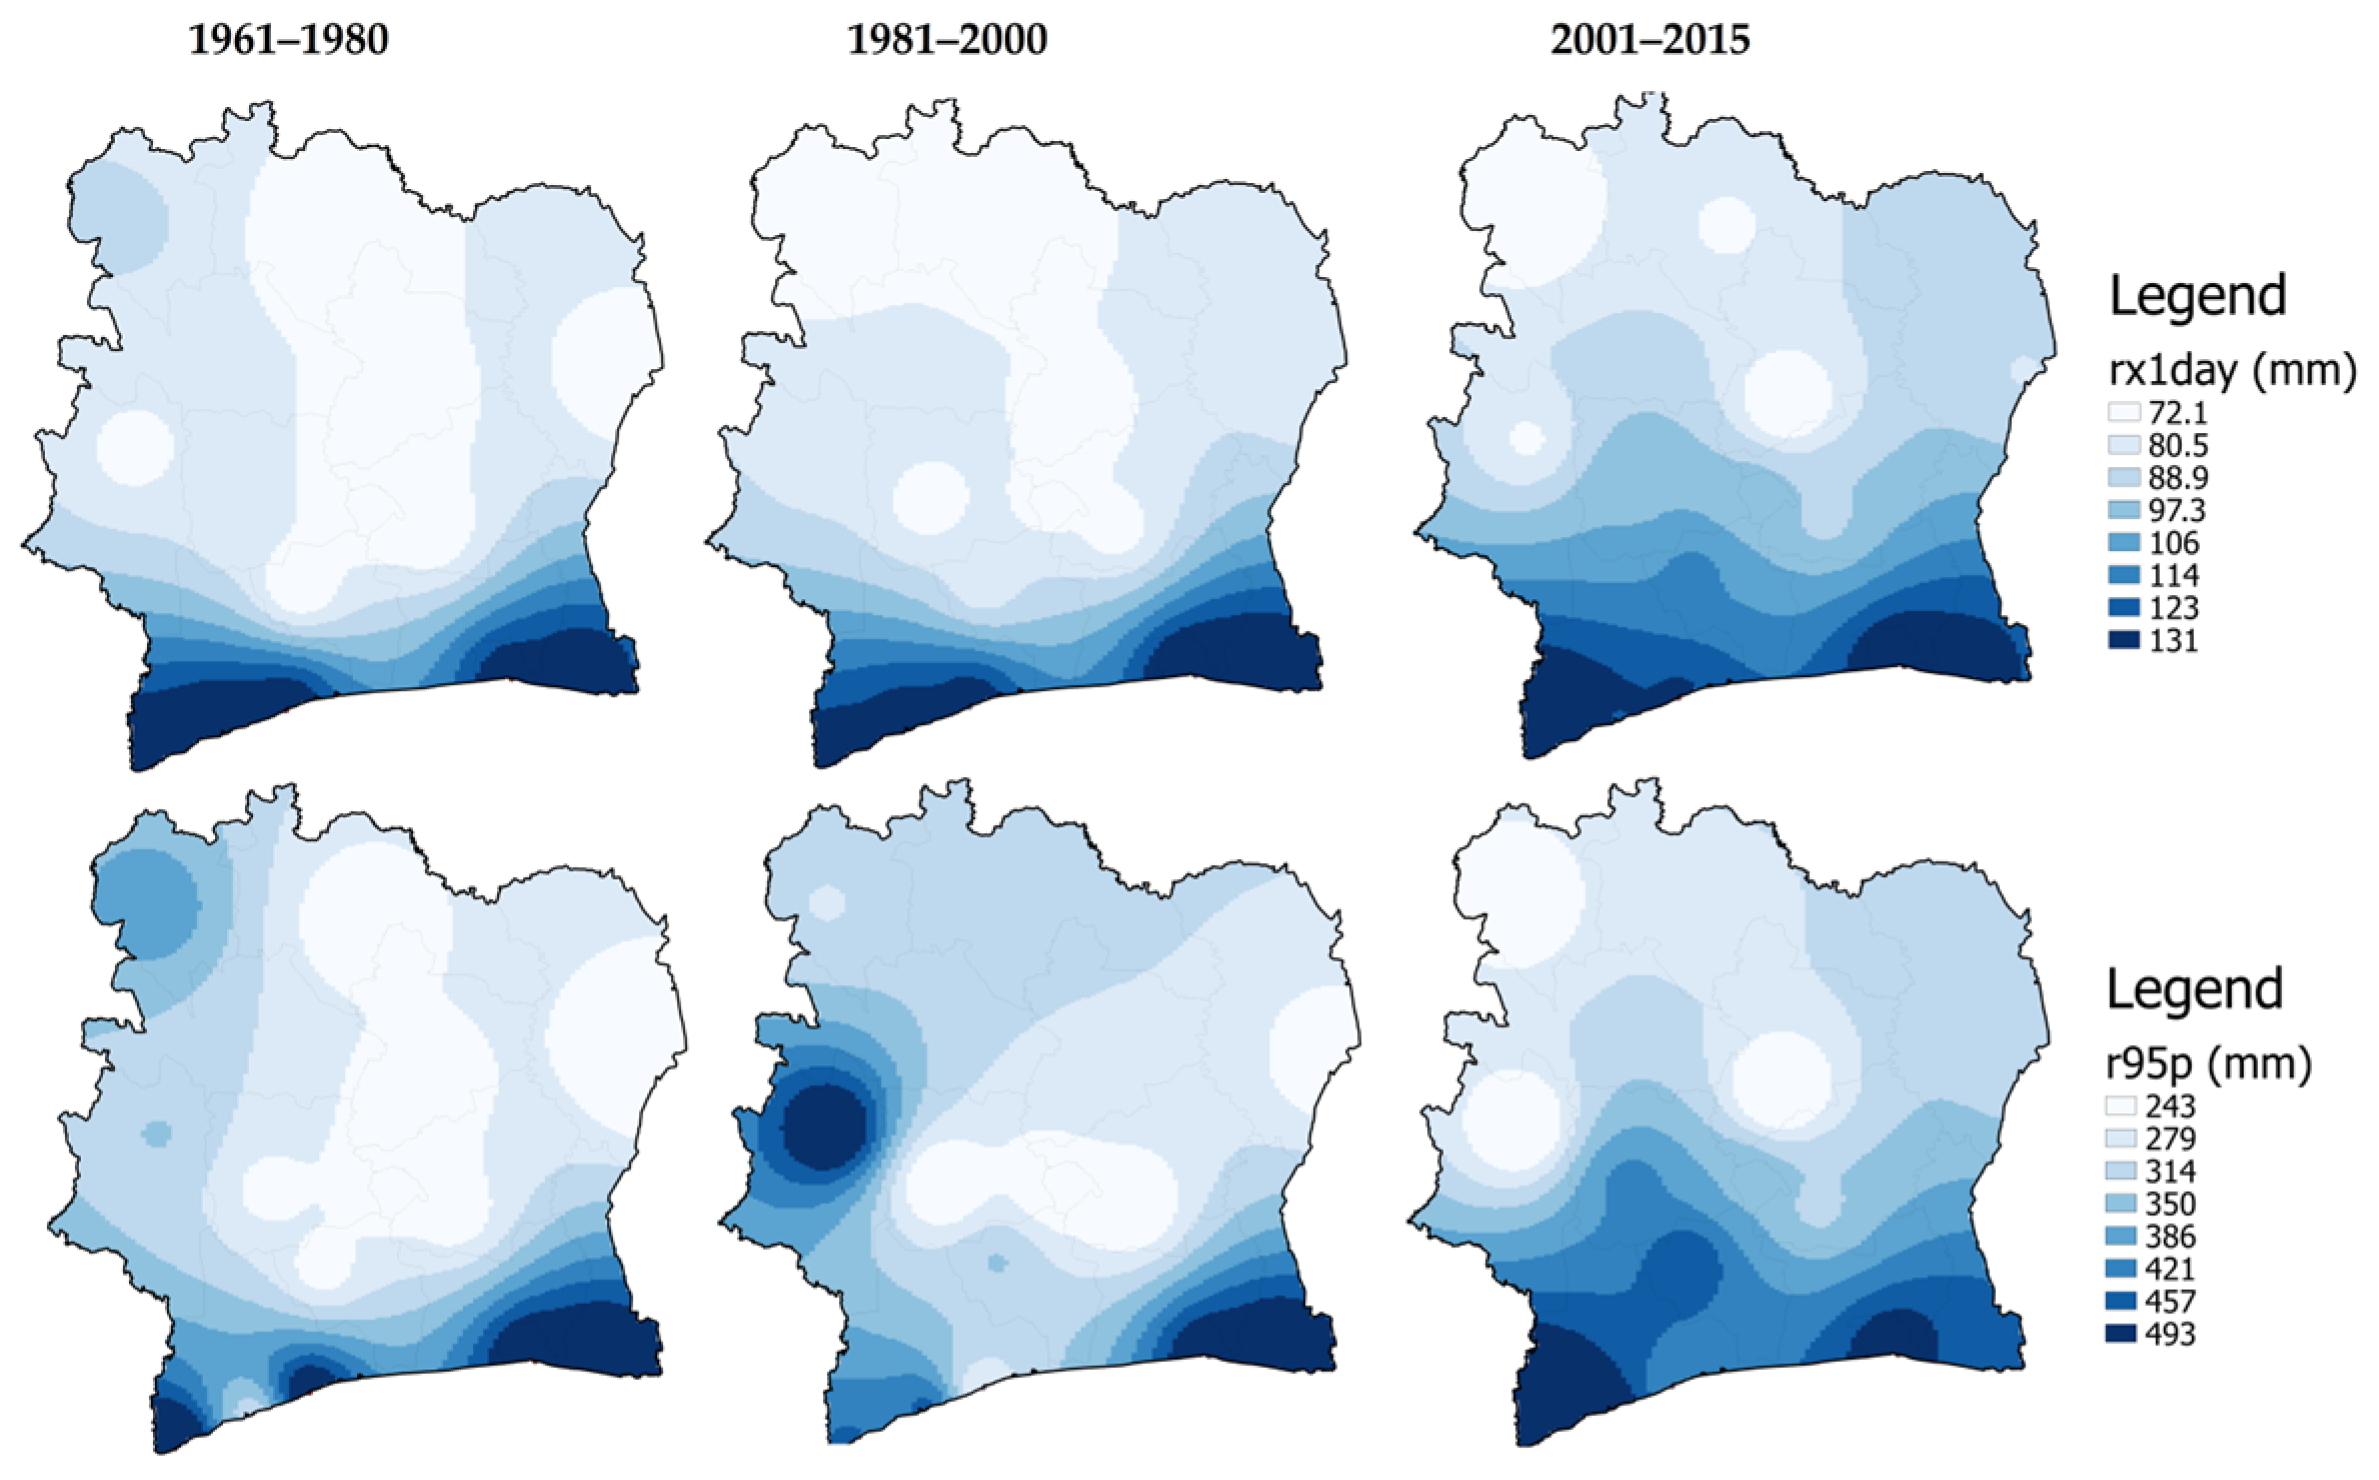
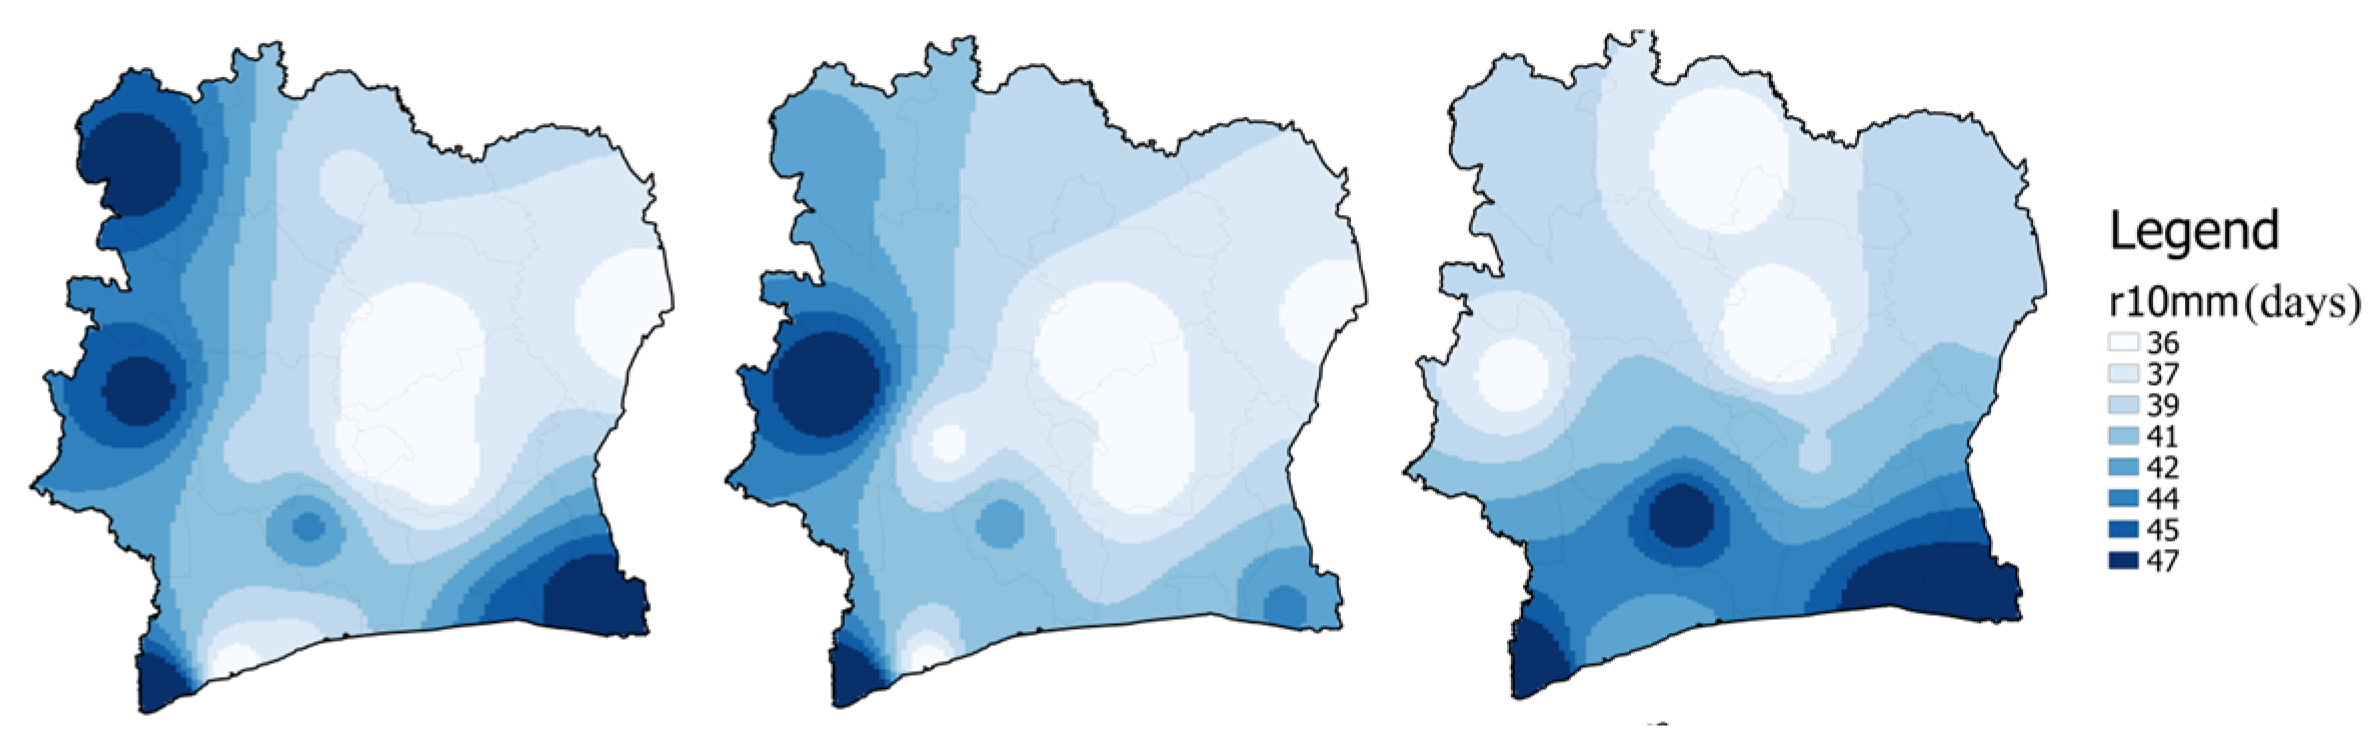
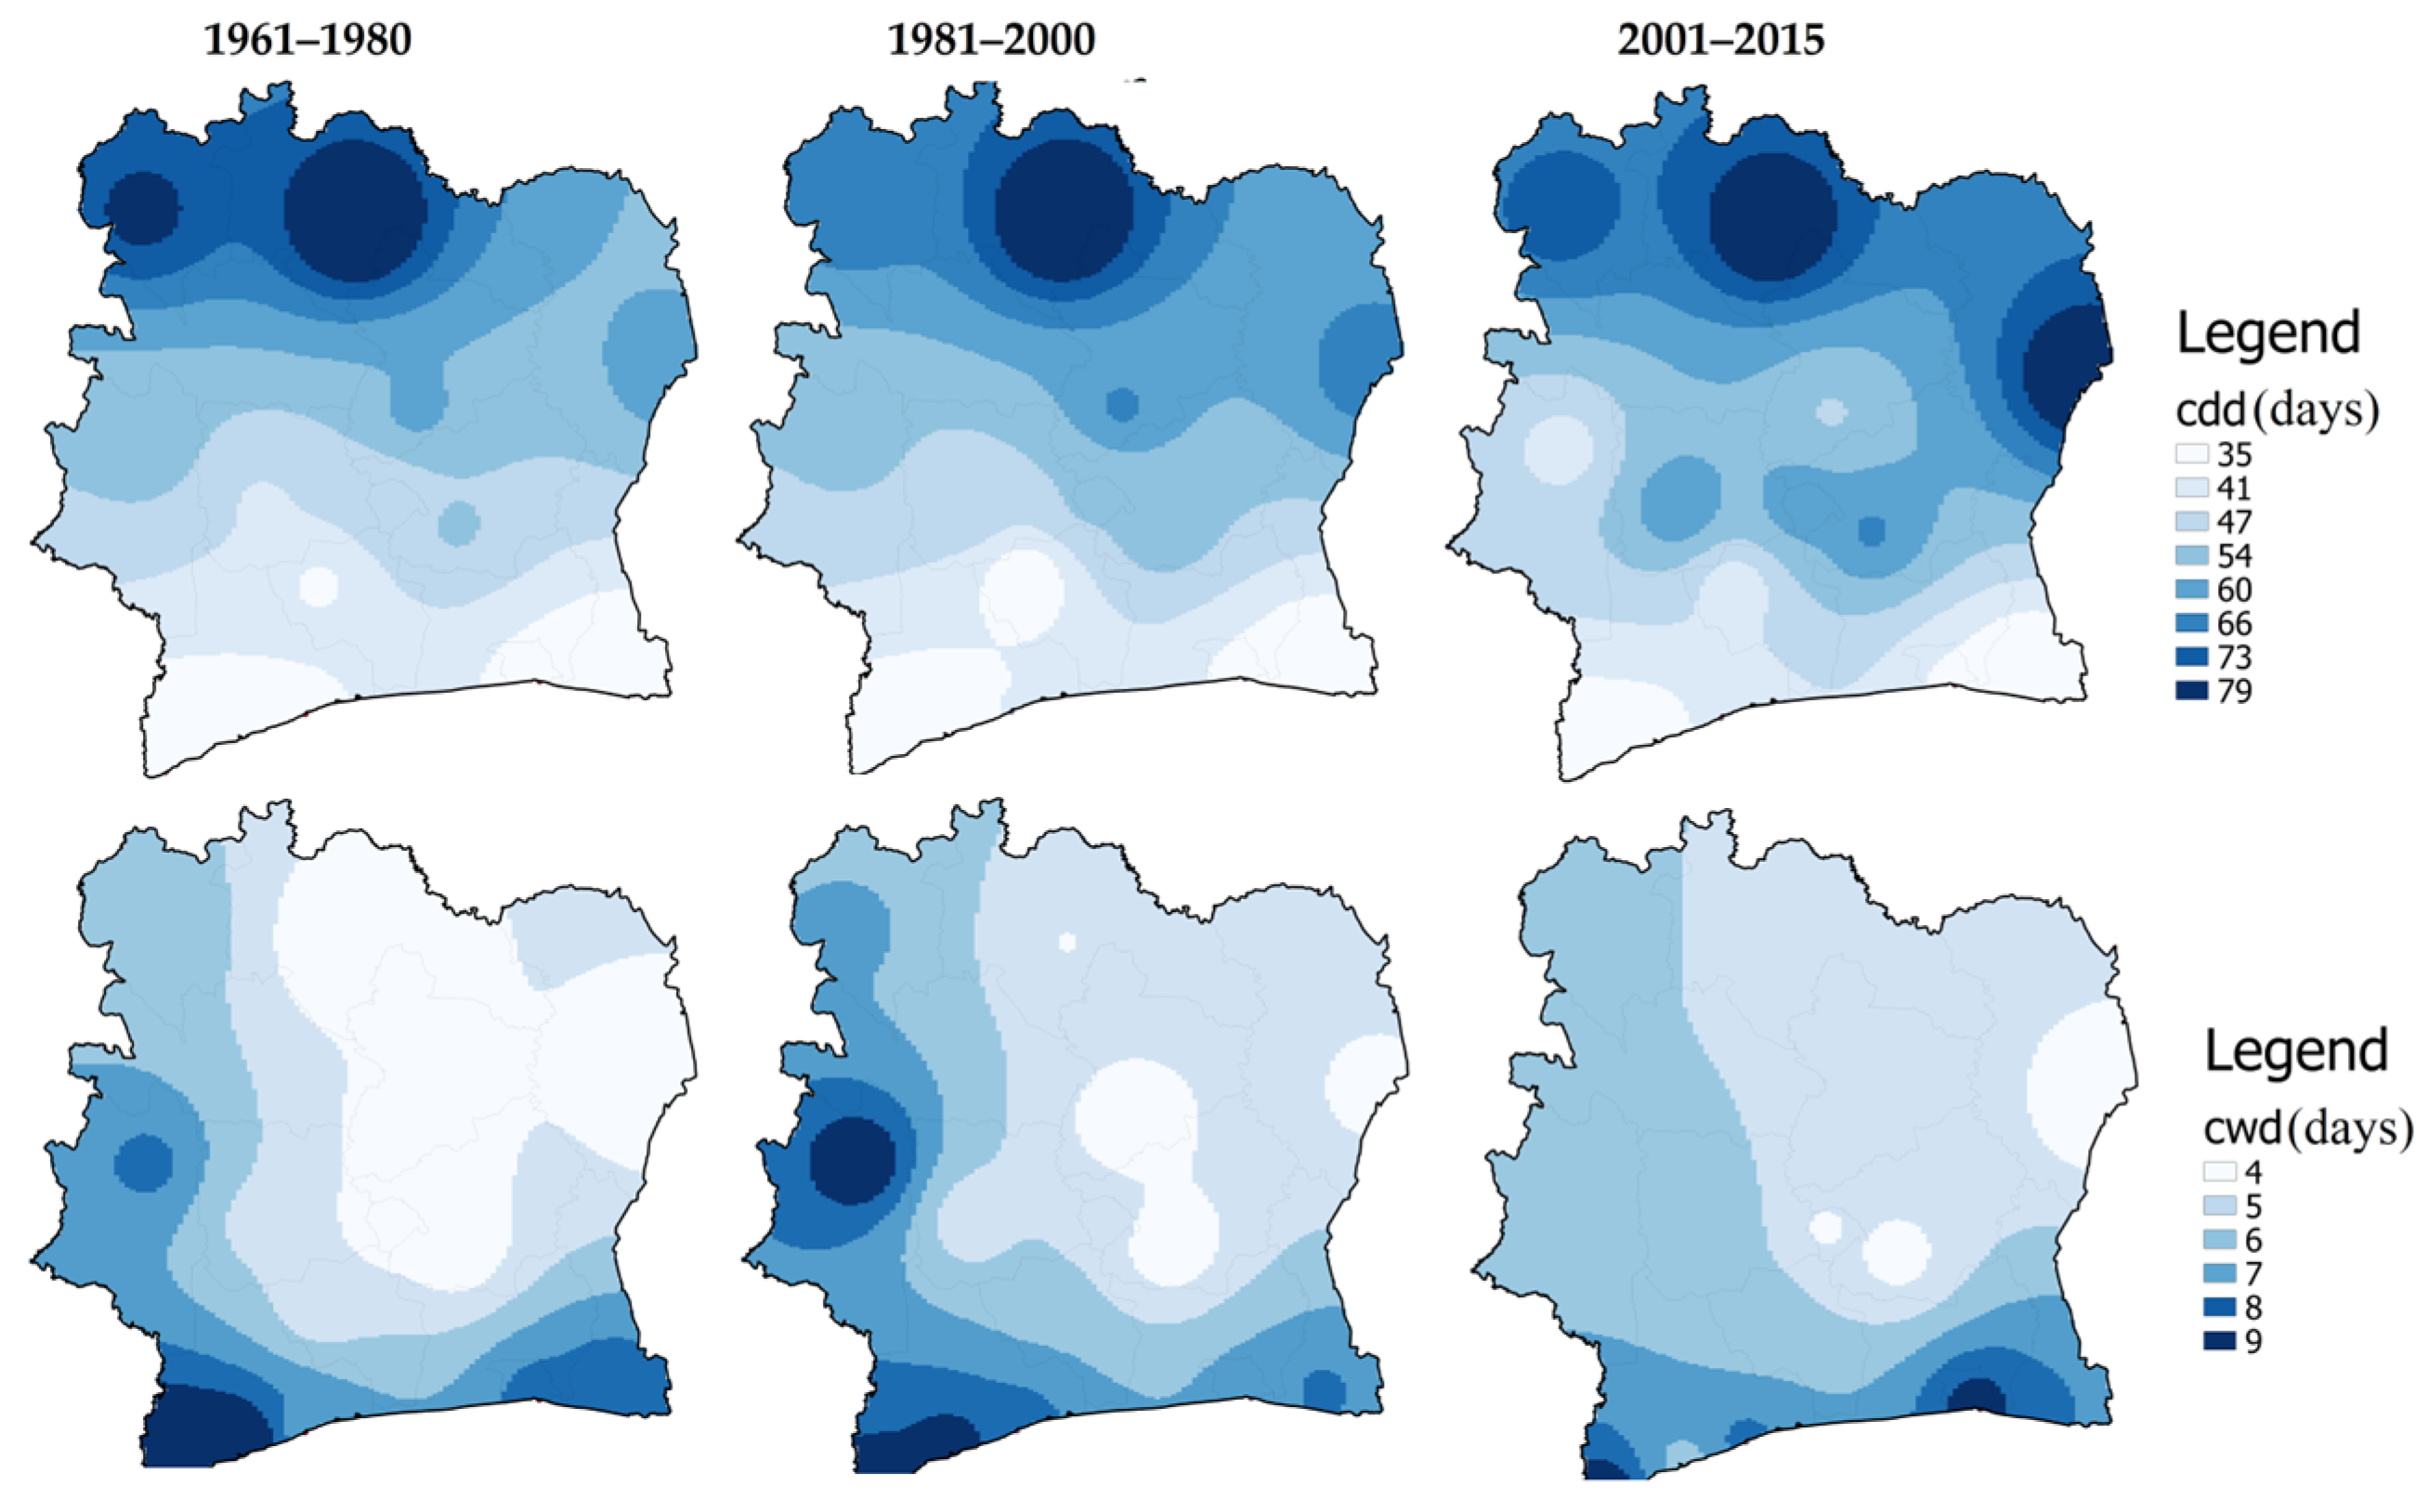
3.2. Changes in the Spatial Variability

In this section, the spatial evolution of the total and extreme rainfall indices was studied over three main periods: 1961–1980, 1981–2000, and 2001–2015. Considering the difficulties in collecting data after 2015, we decided to split the data into two periods of 20 years and a later period of 15 years. The choice of subdividing into 20 years was motivated by the fact that it would be easier to compare our results with those of previous studies in these same periods from satellite-estimated rainfall or reanalysis [4,33,34].
Figure 2 shows the maps of the annual total precipitation (top row), the number of rainy days per year (middle row), and the intensity of rainfall (bottom row) for the three subperiods of 1961–1980, 1981–2000, and 2001–2015.
Considering annual precipitation, the 1961–1980 period was wetter in the south along the coast and on the western side of the country, with cumulative rainfall ranging in the south from 1600 to 1700 mm/year, with maxima in the extreme southwest and southeast, to 1300–1400 mm along the western side. The rest of the country, particularly the center and the north, had lower rainfall values ranging from 1000 to 1300 mm, with persistent minima in the center. The spatial patterns during the second and recent periods (1981–2000 and 2001–2015, respectively) were quite similar, with higher rainfall in the south and western side of the country. However, the western side presented an increase in 1981–2000, mainly in its central part (up to 1600 mm), and a decrease in 2002–2015, mainly in its northern part, with minima in its central part (less to 1000 mm). The southern region instead presented a pronounced overall decrease during these two periods in its central and western parts.
The maps of the number of rainy days (RR1) showed the same pattern as PRCPTOT, with maxima ranging from 94 to 107 days in 1961–1980 over the western side and southern region of the country, respectively, while the other part had a weaker number of rainy days (80–90 days). Overall, there was an increase in the number of rainy days in the whole country during the two following periods (up to 15 days in the western area and southern region), except over the northeastern side, where no change was found. Notably, the number of rainy days generally increased over the northern part of the country (5 to 8 days), while the total annual rainfall PRCPTOT decreased with time during the three periods.
The maps of rainfall intensity (SDII) showed a completely different pattern, with higher values over the south (14–18 mm/day in 1961–1980) and weaker values in the center and the north (10–14 mm/day). During the two following periods, the values of SDII did not significantly change over the south. An increase in SDII was first noted on the eastern side in 1981–2000, covering a larger zone westward (13–15 mm/day), and in the recent period 2000–2015, a northward extension from the south of the area of high SDII values was observed. The central part of Côte d’Ivoire, as well as the eastern and northern parts showing a decrease in total rainfall and a weak change in the number of rainy days, also presented rainfall intensities that notably increased.
Figure 3 shows the spatial distribution of the maximum 1-day precipitation (RX1 DAY) and intense rainfall (R95 P) indices and number of days with rainfall greater than 10 mm over the three study periods. It can be observed that the RX1 DAY index shows notable values (>130 mm) in the south, particularly along the coast during the first and second periods. On the other hand, gradual extension can be observed from the south to the center during the last period. Here, the pattern of R95 P is similar to that of RX1 DAY; the only difference is that the western side experienced intense rainy days (>400 mm) during the second period. Regarding the number of rainy days with a threshold of R10 mm, the west, northwest, and southern zones had the highest values of R10 mm (exceeding 45 days) during the first period. During the second period, a slight decrease in R10 mm was noted throughout the whole country, while during the last period, an increase was mainly observed in the southern zone extending northward.
Figure 4 shows the spatial variability in the maximum duration of consecutive dry days (CDD) and wet days (CWD) over the study periods. Between the first and the following periods, CDD increased in length (up to 3–8 days) and propagated southward, especially during the last period. CWD presents high values in consecutive days of rain, mainly in the western side (5–7 days) and southern side (7–8 days) of the country. During the first two periods, an increase was observed on the western side (up to 8–9 days), while a slight decrease was noted on the southern side (2–3 days). In the most recent period (2001–2015), a decrease in the length of wet spells was noted in the west and southwest parts of the country, while an increase was observed in the southeast.

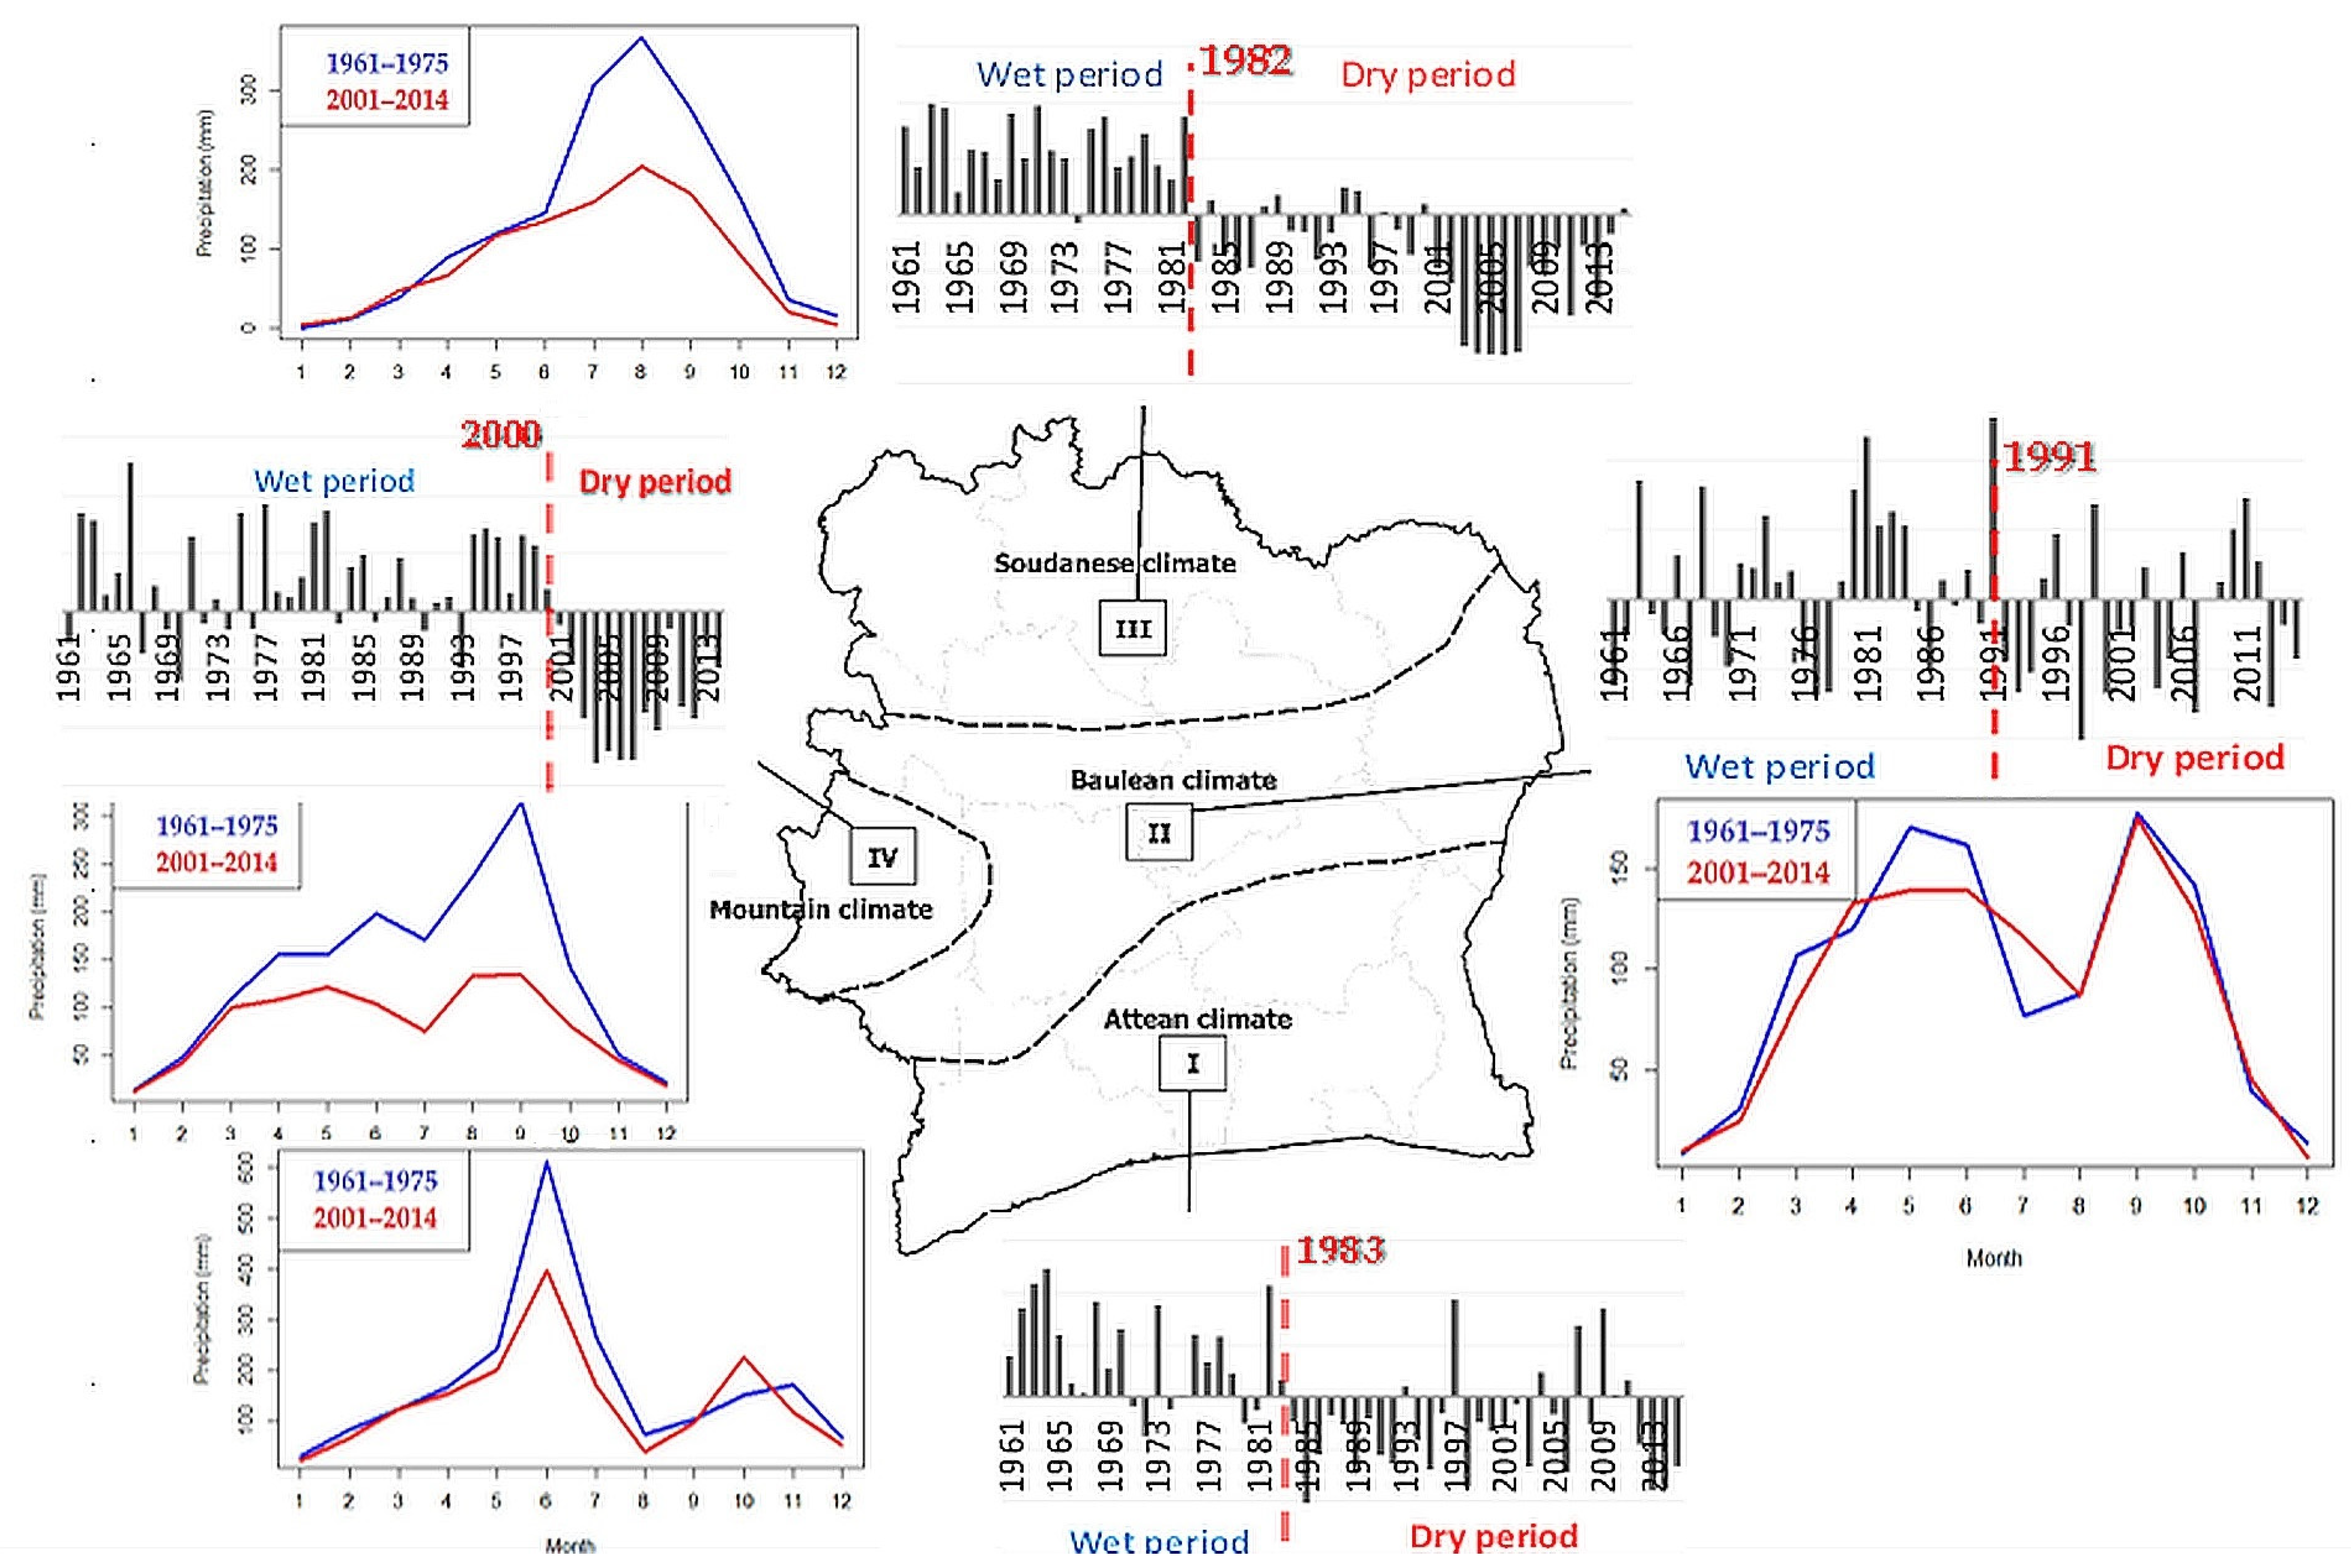
3.3. Interannual Variability and Changes in Annual Cycle per Climate Zone

Figure 5 shows the interannual variability of the total annual rainfall (PRCPTOT) in each climate zone to detect breaks in rainfall time series and changes in the monthly evolution of the annual precipitation by period following break detection.
In the northern part of Cote d’Ivoire (Soudanese climate), a break was found in 1982. Here, the first period between 1961 and 1982 was associated with more rainfall (wet period), while the second period from 1983 to 2015 was associated with less rainfall (dry period). The figure on change in the annual cycle shows a rainfall deficit (more than 100 mm) between the dry and wet periods during the peak of the rainy season (August).
In the western part of Cote d’Ivoire (Mountain climate), a break was found in 2000 separating two distinct periods: a wet period between 1961 and 2000 and a dry period after 2001. During the dry period, the month of September (the month of maximum rainfall in the rainy season) experienced a strong rainfall deficit (more than 200 mm) compared to the first period.
In the central part of the country (Baulean climate), while the time series presented high interannual variability with the wet period succeeding the dry period, a break was detected in 1991. On average, there was a slight decrease in annual rainfall in 1991. A comparison of the annual cycles between the periods before and after the break indicates that this decrease in rainfall after 1991 can be explained by a decrease in precipitation in the first rainy season during the months of maximum rainfall (April–May–June).
In the southern parts of Cote d’Ivoire (Attean climate), a break was found in 1983, separating the wet period (1961–1983) and dry period (1984–2015). Analysis of the annual cycle revealed that this decrease in rainfall was mainly associated with weaker rainfall during all months of the first rainy season.

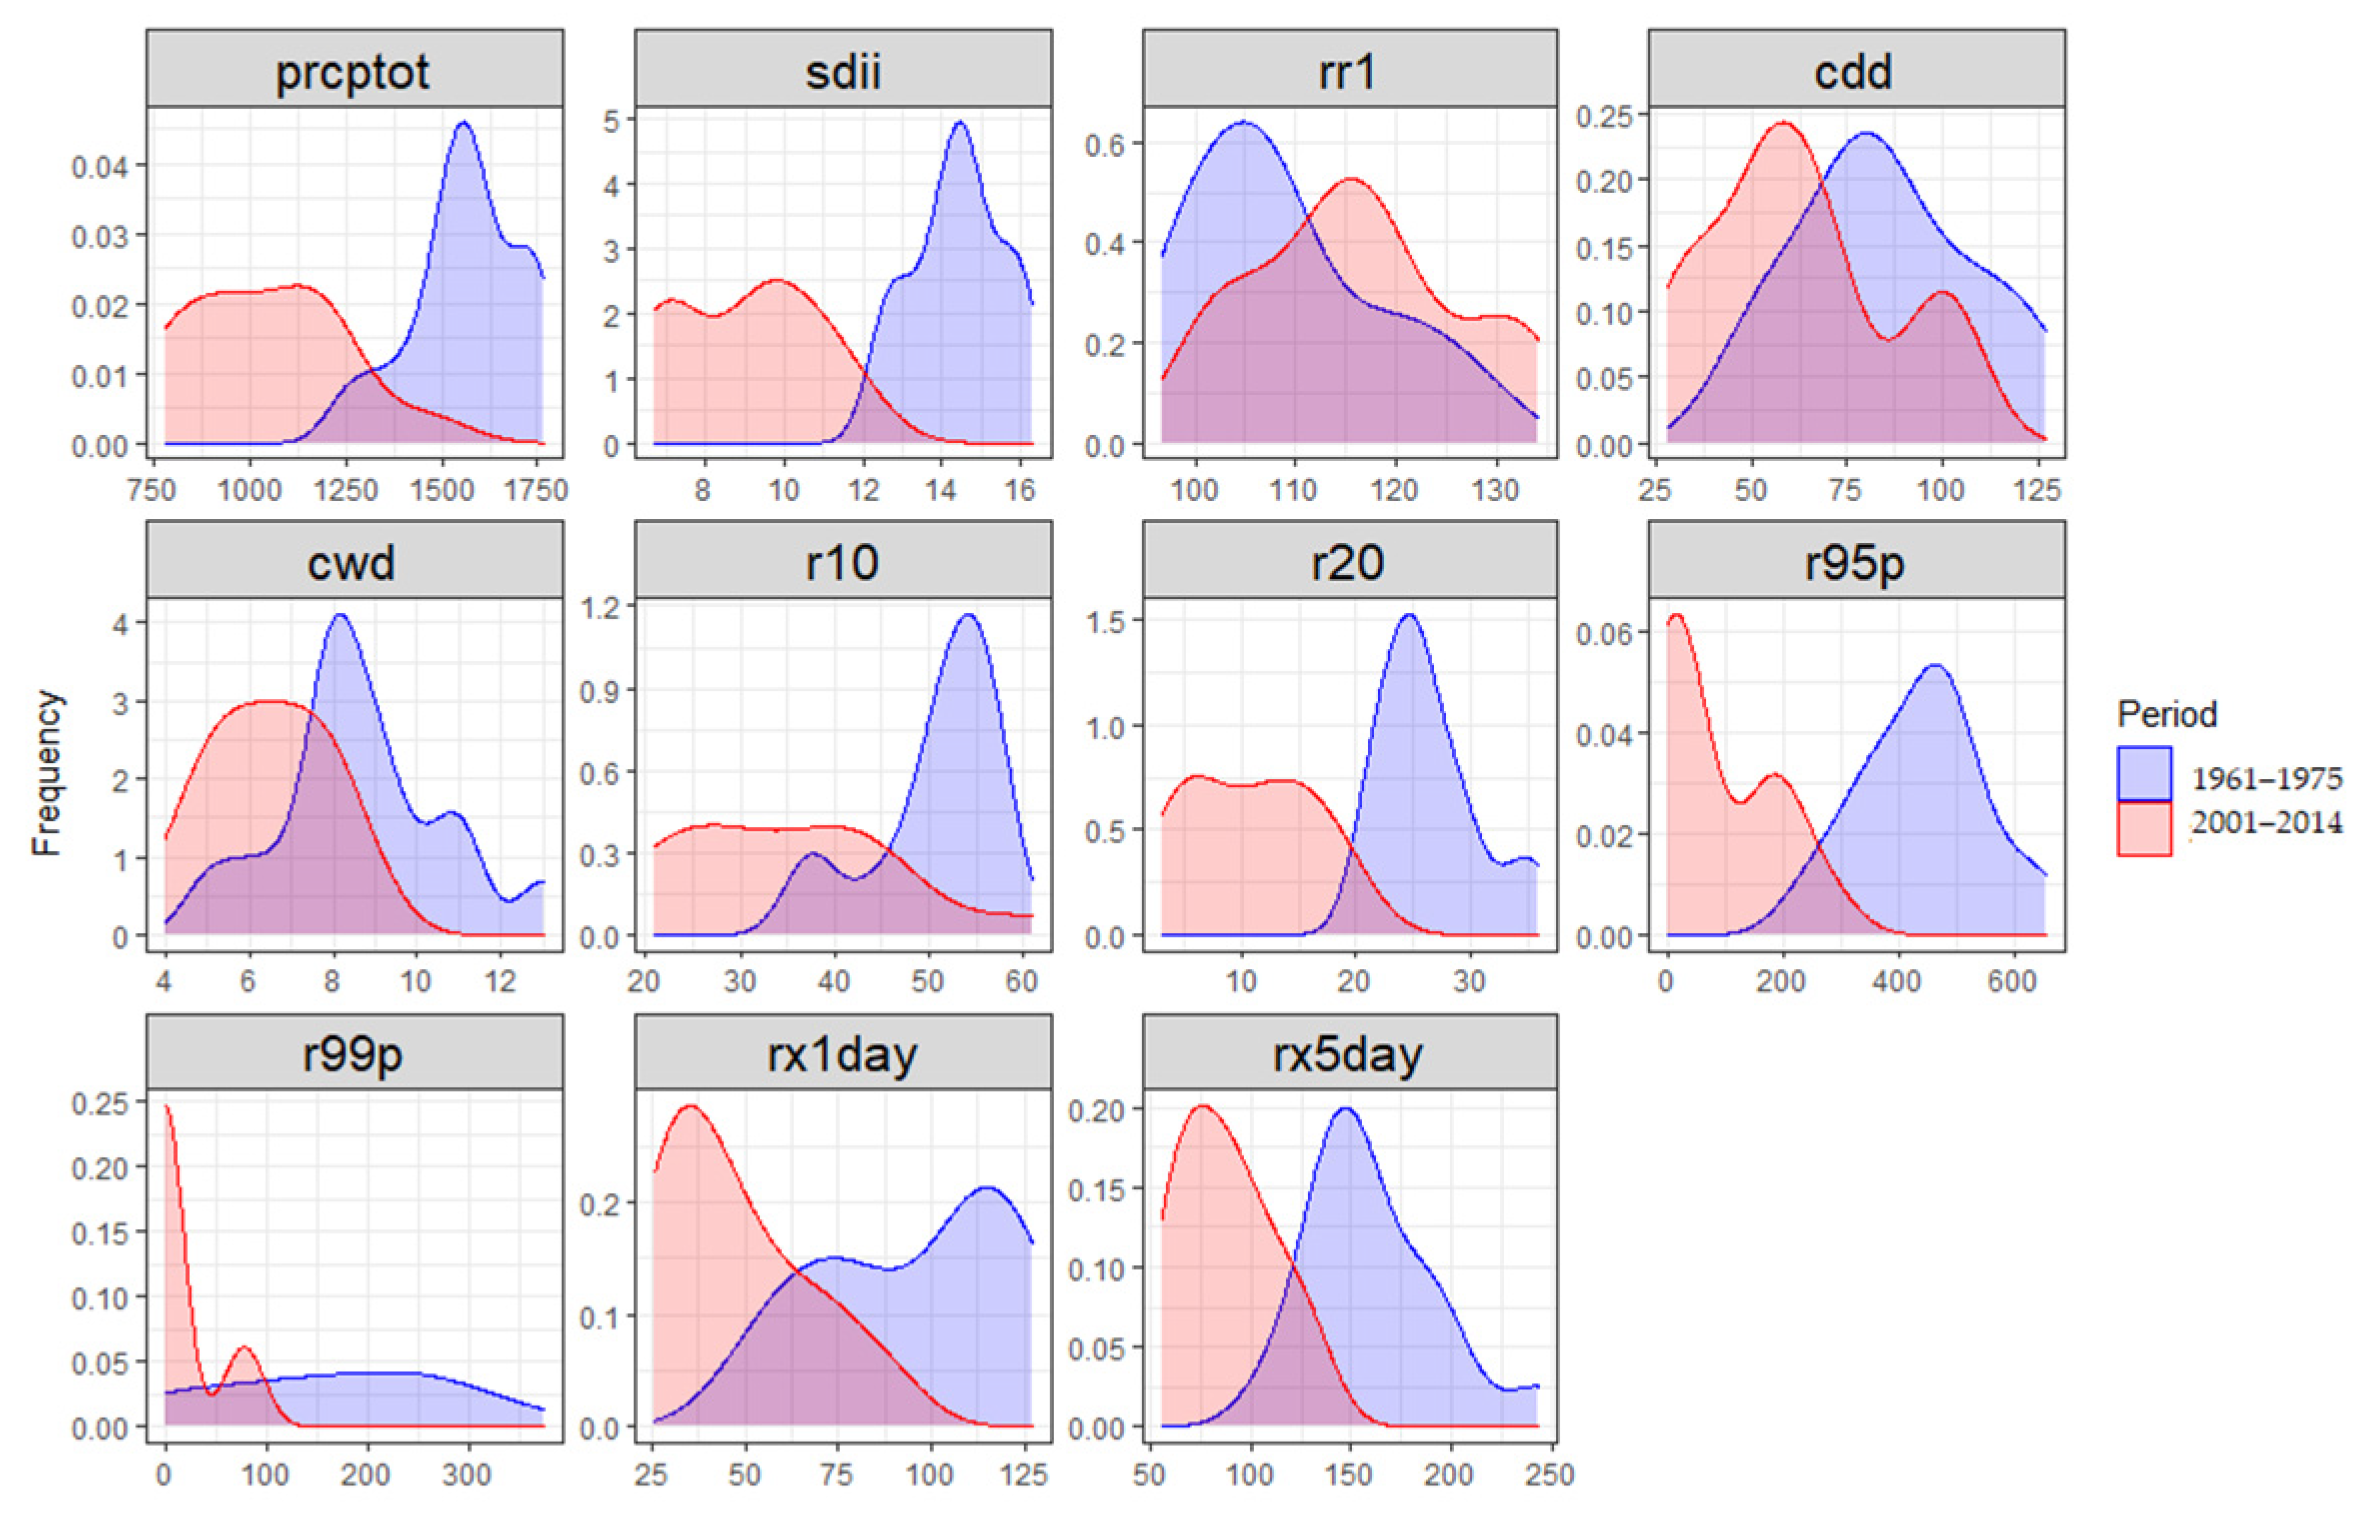
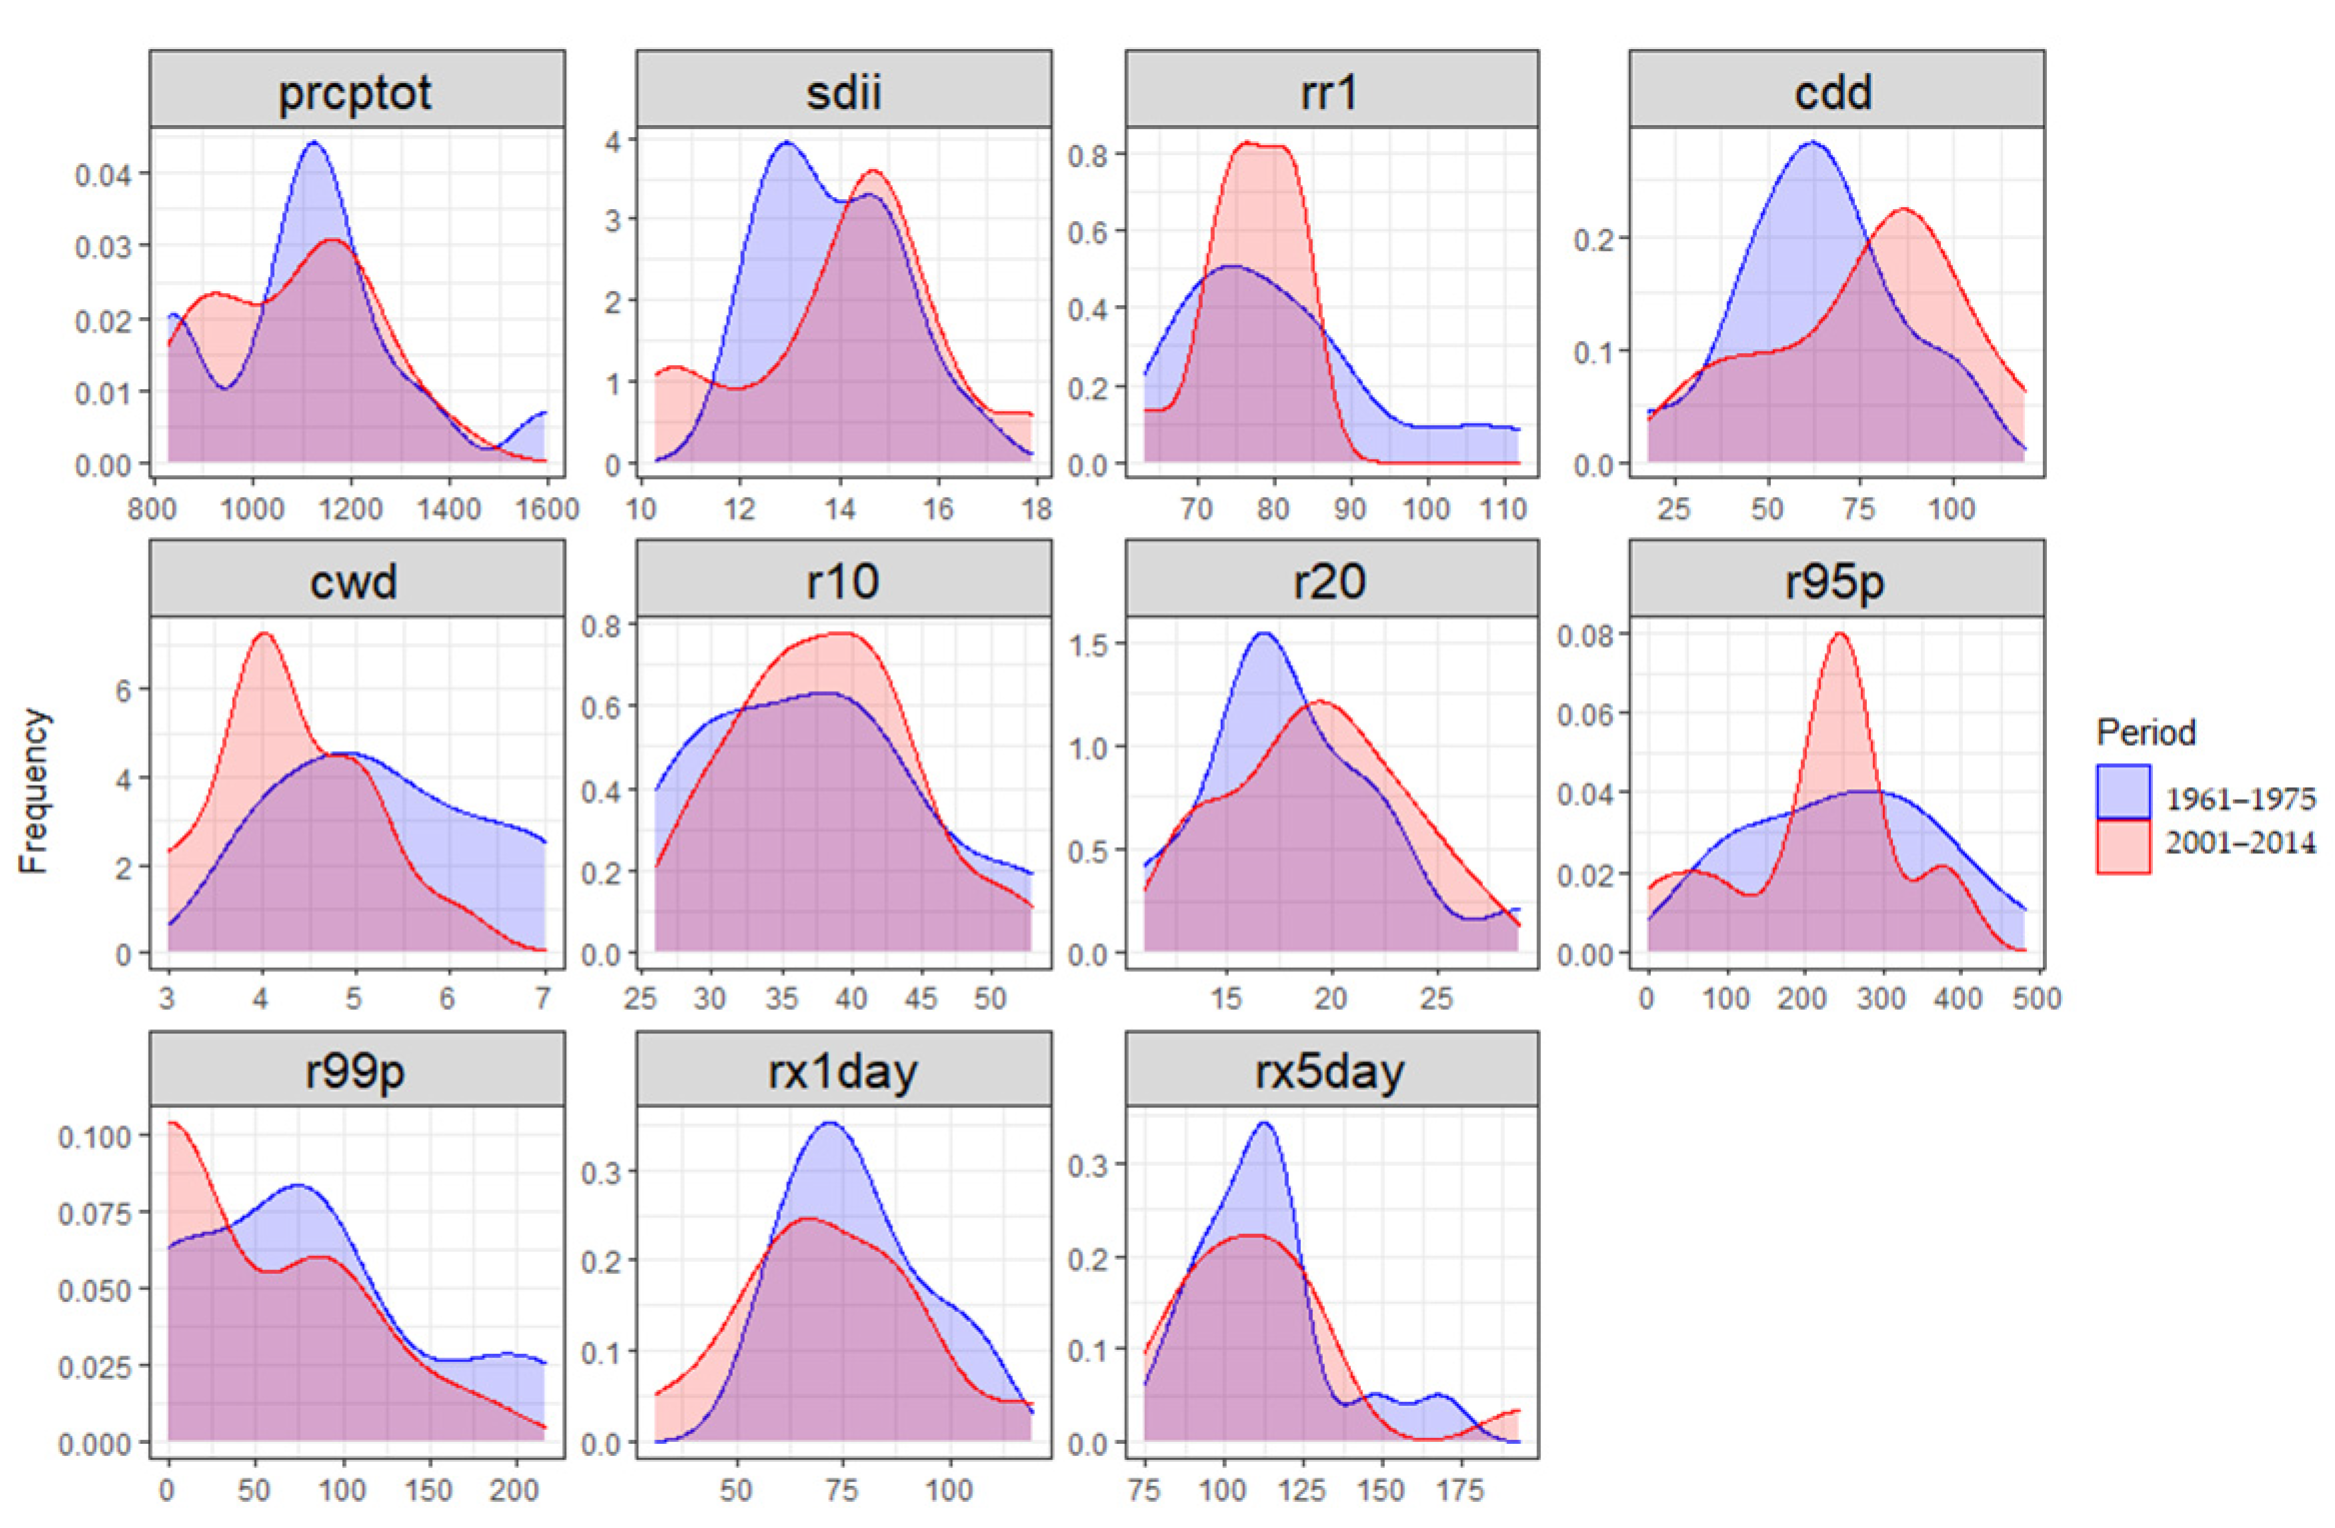
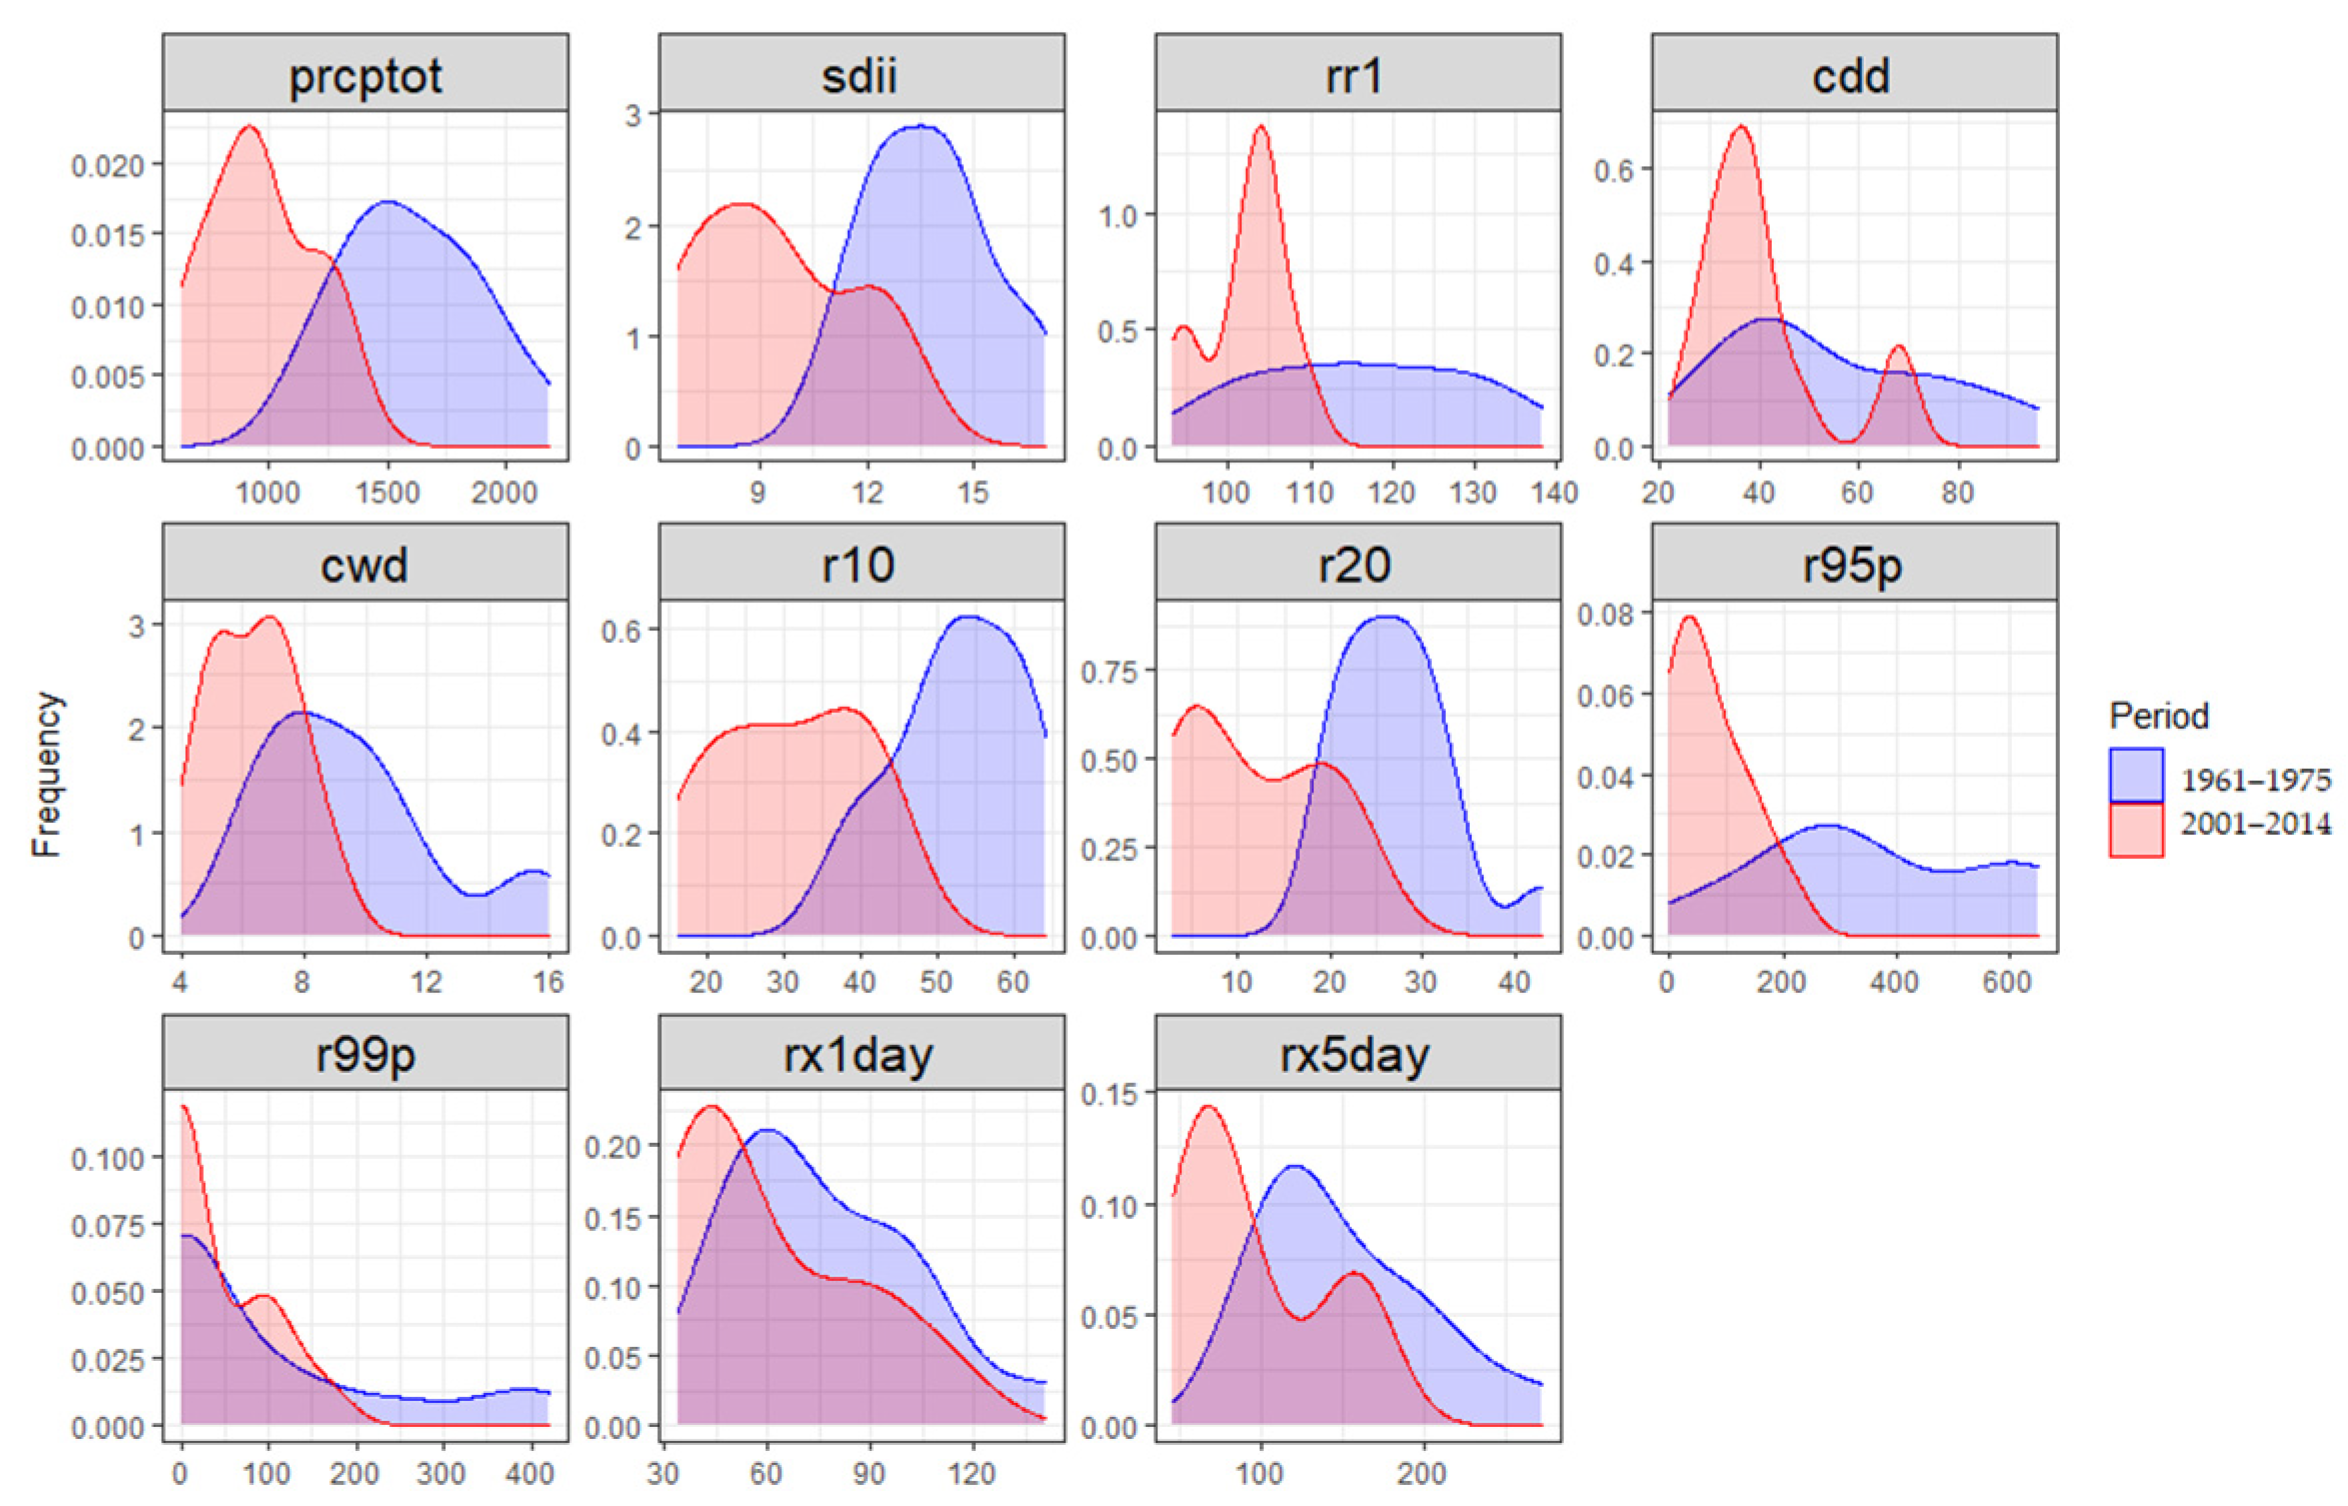
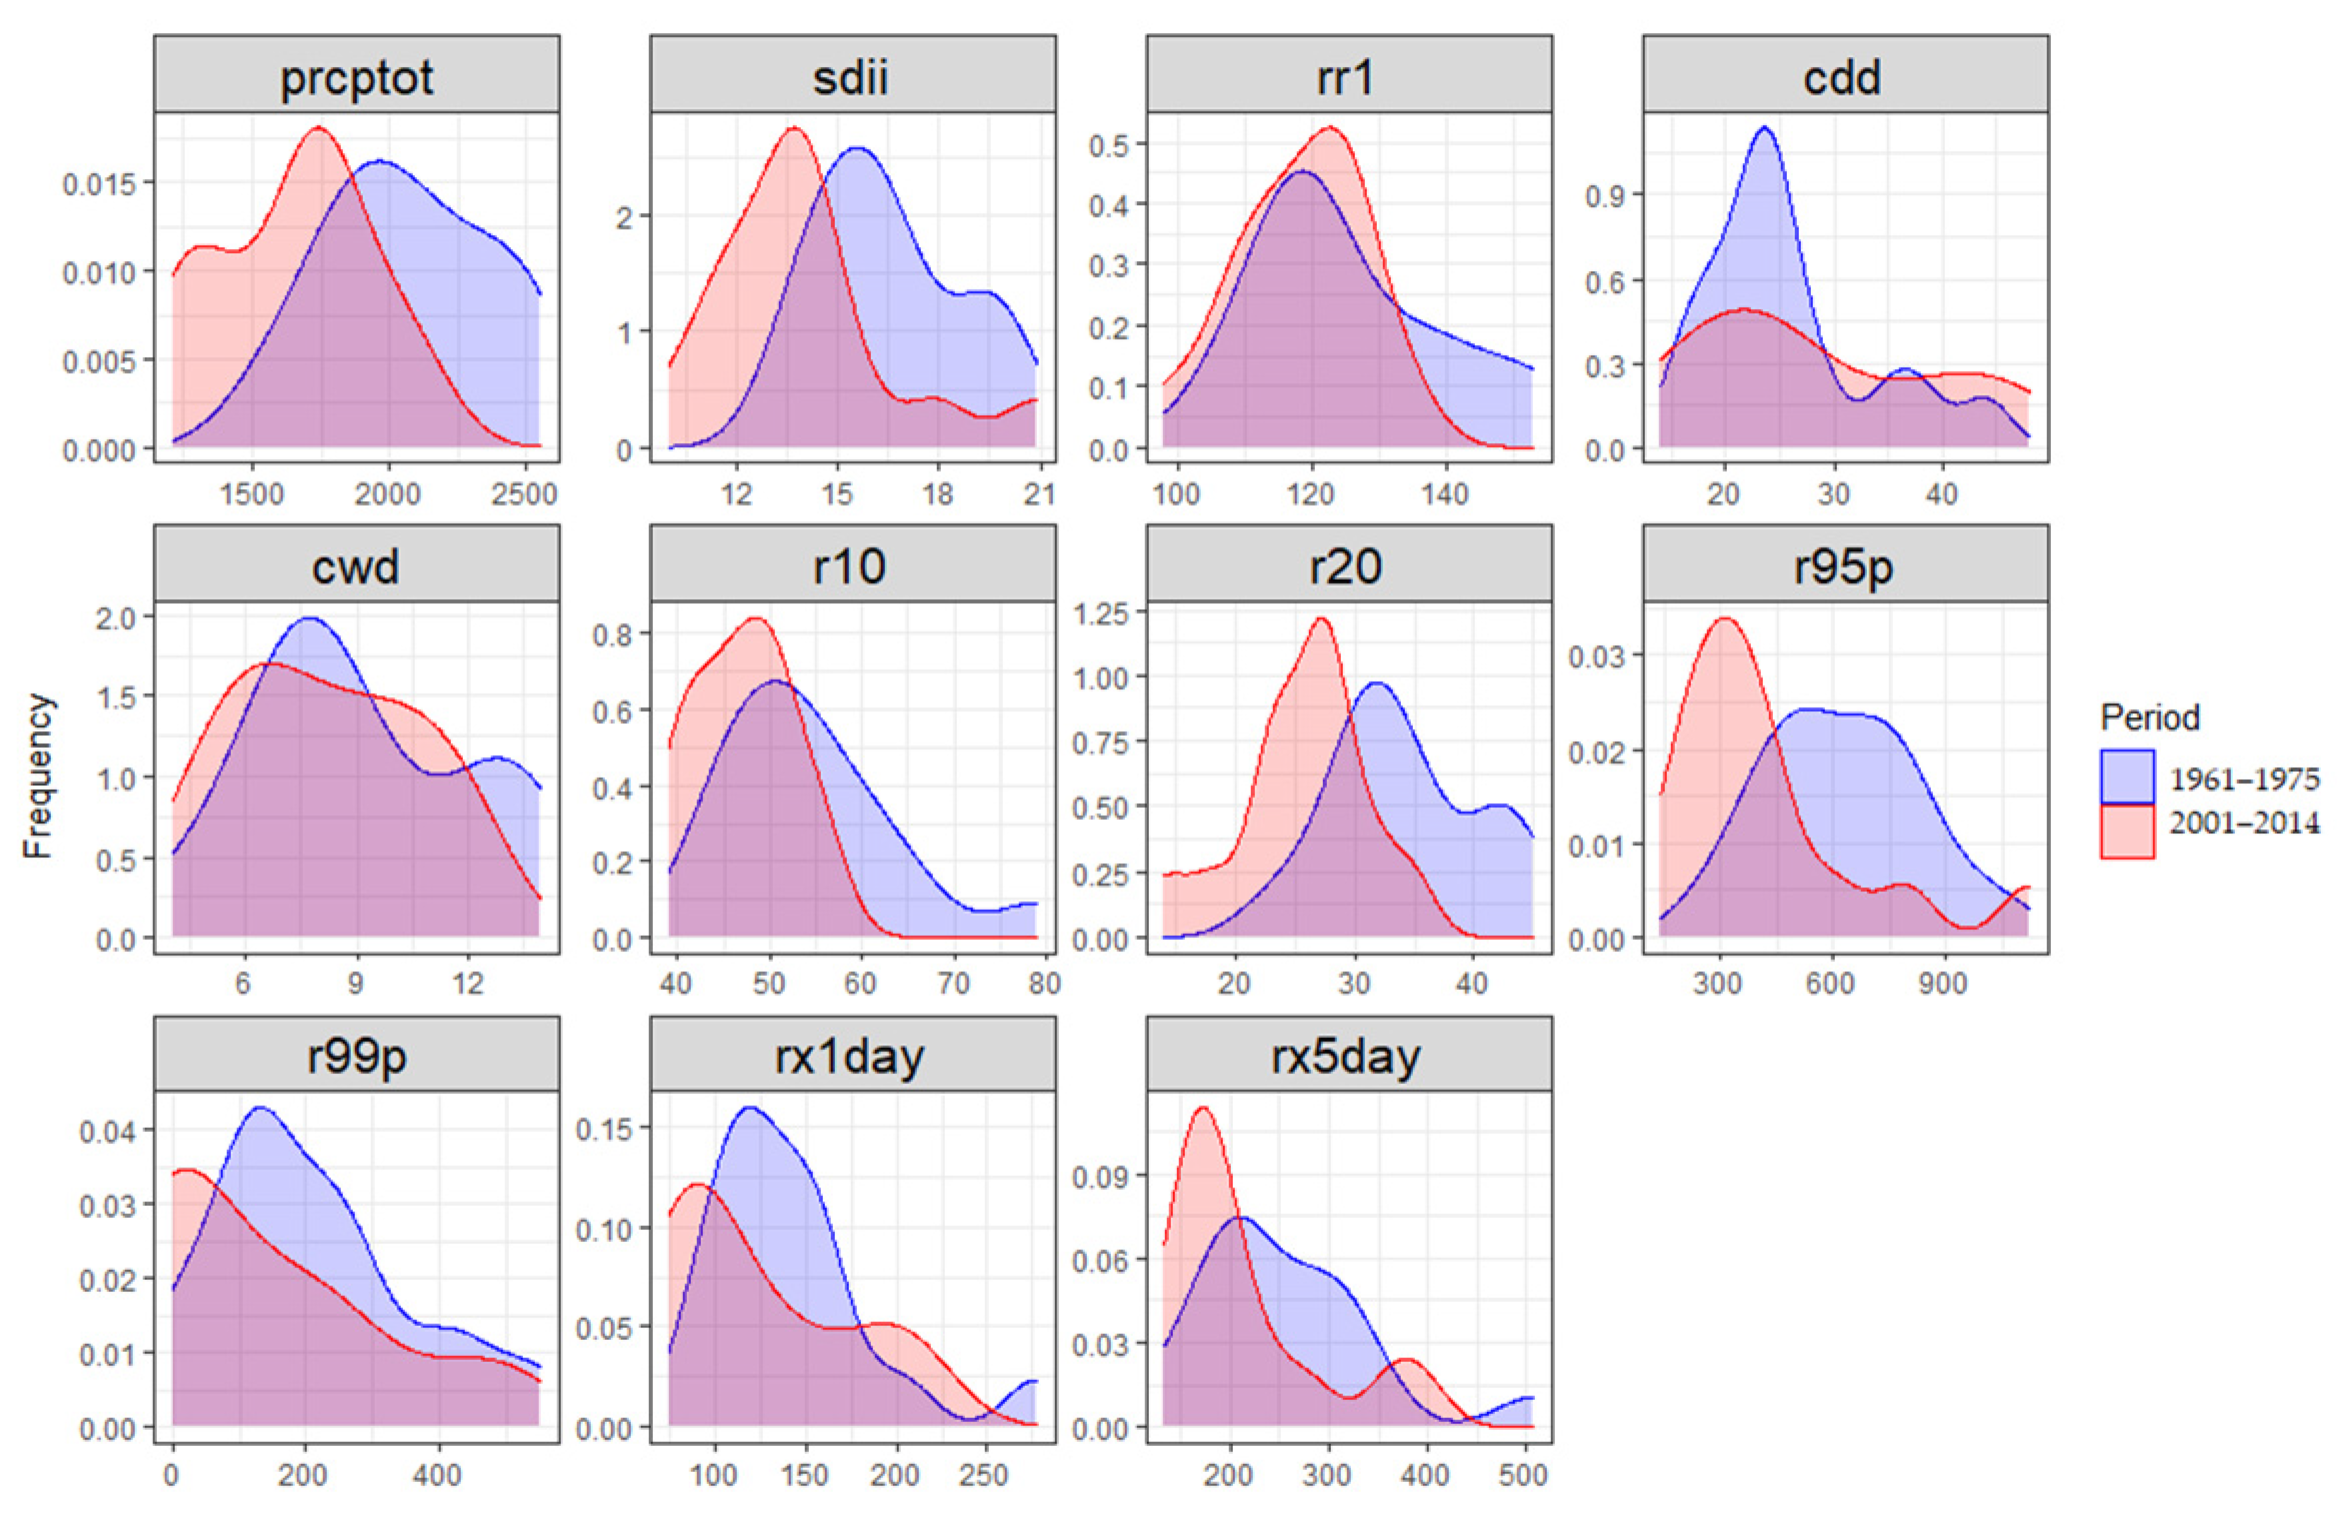
3.4. Changes in the Frequency Distribution of Total Rainfall and Extreme Indices

The results of the previous section show that during the last 45 years, Côte d’Ivoire experienced a climate change from wet to dry periods with a clear break in 1982 for the northern part, in 1982 for the southern part, in 1991 for the central part, and in 2000 for the mountain climate in the west.
In this section, to perform a comparative study and understand how the frequency distribution of total rainfall and extreme indices have changed, we selected the same subperiods for all climate zones, with 1961–1975 selected for the wet period and 2001–2014 for the dry period.
Figure 6, Figure 7, Figure 8 and Figure 9 show the change in the frequency distribution of the precipitation indices (PRCPTOT, SDII, RR1, CWD, R10 mm, R20 mm, R95 p, R99 p, Rx1 day, and Rx5 days) for the northern, southern, central, and western parts of Côte d’Ivoire, respectively.
In the northern part, Figure 6 shows that the decrease in total rainfall during the 2001–2014 period (PRCPTOT average maxima from 1500 mm in the wet period to 1000 mm in the dry period) was associated with a decrease in rainfall intensity (SDII maxima from 14.5 to 10 mm/day), a decrease in the length of wet spells (CWD maxima from 8 to 6–7 days), a decrease in the contribution of heavy rainfall (R95 and R99 p), a decrease in extreme rainfall (Rx1 day and Rx5 days), and a decrease in the number of days with heavy rainfall (R10 and R20 mm) along with an increase in the number of rainy days (RR1 average maxima from 105 days to 115 days) and a decrease in the length of dry spells (CDD average maxima from 87 days to 68 days).
In the central part of the country (Baulean climate, Figure 7), where high interannual variability is observed, changes in rainfall between the periods of 1961–1975 and 2001–2014 were mainly associated with an increase in the maximum length of dry spells (CDD, with average maxima from 67 days during the wet period to 85 days in the dry period) and a decrease in the maximum length of wet spells (CWD, average maxima from 5–6 days to 4 days). In addition, we observed an increase in the length of intense rainy days (R20mm, maxima from 25 days to 20 days), as well as the maximum rainfall over 5 days (Rx5 days, on average, from 175 to about 180 mm).
In the western part of Côte d’Ivoire (Mountain climate, Figure 8), the decrease in annual total rainfall observed during the last period (average maxima from 1500 mm during the wet period to 1000 mm in the dry period) was associated with a decrease in rainy days (RR1 average maxima from 120–130 to 100–105 days in the recent period), rainfall intensities (SDII average maxima to 13–14 to 7.5–8 mm/day), number of days with heavy rain (R10 mm maxima from 55 days to 40 days and R20 mm), maximum length of wet spells (CWD), and heavy and extreme rainfall (R95 p average maxima from 300 mm to 50 mm, R99 p, Rx1 day, and Rx5 days).
In the southern part (Attean climate, Figure 9), the decrease in annual rainfall during the recent period (PRCPTOT average maxima from 2000 to 1750 mm) was mainly associated with a decrease in rainfall intensities (SDII maxima from 16 to 14,5 mm/day), the number of days with heavy rainfall (R20 mm average maxima from 32.5 to 27.5 days), and the contribution of heavy rainfall (R955p maxima from 600–900 to 300 mm, R99 p). In addition, there was an increase observed in the length of intense rainy days with the maximum rainfall over 1 day (Rx1 day maxima from 200 to 250 mm), as well as the maximum rainfall over 5 days (Rx5 days, on average, from 350 to about 400 mm).

4. Conclusions

This study on the evolution of rainfall extremes was based on 14 synoptic stations distributed over different geographical areas of Côte d’Ivoire with at least 40 years of records. In each climatic region, statistical tests to assess trends and detect breaks were used to assess changes in the evolution of extremes before and after the identified break years [35,36,37]. However, results in the northern region of Côte d’Ivoire showed that this area experienced a change starting in 1982, characterized by a long dry period followed, in recent years, by a slightly wetter period alongside an increase in the number of rainy days (RR1) associated with lower-intensity events (SDII) than those in the past. This return of rainfall in the Sahelian zone has been observed by various authors [3,4,38,39,40]. This return of rains has led to strong agricultural performance in recent decades (2000–2014) according to [41,42,43,44].
The center and south of the country showed substantially identical results in terms of both the intensity and frequency of intense rainfall during the second period (2001–2014), which was dominated by a dry period. These two regions showed an increase in the extreme values of intense rainfall (Rx5 day, R95 p), the number of rainy days (RR1), and intense rainy days (R10 mm and R20 mm) over the most recent period. These results indicate that, despite the overall decrease in rainfall during the most recent period (2001–2014), the intense rainfall in these areas has become stronger but less frequent, with very high risks of flooding. Thus, the south of the country has experienced an increase in flooding over the past three decades [8,45], with an average of 10 casualties each year according to [7,9,10]. On the other hand, these two regions also showed an increase in extreme values of the drought index (CDD) in line with the work of the [46], which showed that the south forest in its agricultural diversity experienced an increase in drought episodes with a considerable impact on cash crops. This increase in droughts was accompanied by a temperature increase of 0.5 °C in Côte d’Ivoire between 1981 and 2010 with maxima recorded in the south of the central-eastern region of the country.
The climate of the Mountain region, located in the west of the country, experienced a decrease in rainfall and most of the indices, except for the number of rainy days, very intense rainfall periods (R99 P), and dry episodes. This decrease in rainfall and increase in rainy days and intense rainfall in this area could be a product of the strong presence of mountains, which play an important role in the quantity, intensity, spatial distribution, and duration of precipitation [47]. The overall decrease in precipitation observed for all indices could be the result of a decrease in forest area, which is the primary regulator of the spatial and temporal variability in precipitation [48]. Indeed, deforestation has been observed since 1946 (see [49]. Moreover, the work of REDD+ [50] shows that the forest cover in this part of the country has decreased significantly from 1986 to 2015. However, the country’s forest cover has continued to decrease, from 7,850,864 hectares in 1986 to 5,094,452 hectares in 2000 and 3,401,146 hectares in 2015. The loss of forest cover was estimated at 2,756,412 hectares between 1986 and 2000 and 1,693,306 hectares between 2000 and 2015.
Overall, climate change was detected in the evolution of extreme rainfall in the central and south areas of the country. The increase in flooding observed in recent decades in urban centers and some rural areas of Côte d’Ivoire could be attributed to a change in the evolution of extreme values of intense rainfall.

Author Contributions

D.K., S.R.D. and A.D. performed the design/conceptualization of the paper. D.K. and S.R.D. processed the data. D.K., S.R.D. and A.D. wrote the first draft. All the authors analyzed and discussed the results and contributed to the drafting and revisions of the manuscript. All authors have read and agreed to the published version of the manuscript.

Funding

The research leading to this publication was co-funded by IRD (Institut de Recherche pour le Développement; France) grant number “UMR IGE Imputation 252RA5” and by the SUSTAIDAM project co-funded by the Agence National de la Recherche (ANR, France; Contract n° 400914/00) implemented in the frame of the Belmont Forum collaborative actions on transdisciplinary research for pathways to sustainability.

Data Availability Statement

Data are available upon request at Société d’Exploitation et de Développement Aéroportuaire, Aéronautique et Météorologique (SODEXAM); web site: https://www.sodexam.com/, accessed on 29 January 2023.

Acknowledgments

The authors would like to thank SODEXAM, the Centre National de Calcul de Côte d’Ivoire (National Computing Center), and the Joint International Laboratory LMI NEXUS for their support.

Conflicts of Interest

The authors declare no conflict of interest regarding the publication of this paper.

References

  1. Paturel, J.E.; Servat, E.; Kouame, B.; Boyer, J.F. Manifestation de la sécheresse en Afrique de l’Ouest non sahélienne, cas de la Côte d’Ivoire, du Togo et du Benin. Bull. Sécheresse 1995, 6, 95–102. [Google Scholar]
  2. Paturel, J.E.; Servat, E.; Delattre, M.O. Analyse de séries pluviométriques de longue durée en Afrique de l’Ouest et centrale non sahélienne dans un contexte de variabilité climatique. J. Des Sci. Hydrol. 1998, 43, 937–945. [Google Scholar] [CrossRef]
  3. Noufe, D. Changements Hydroclimatiques et Transformations de L’agriculture: L’exemple des Paysanneries de l’Est de la Côte d’Ivoire. Ph.D. Thesis, Géographie de l’Université de Paris 1, Pantheon-Sorbonne, France, 2011; 375p. [Google Scholar]
  4. Sacré Regis, M.D.; Mouhamed, L.; Kouakou, K.; Adeline, B.; Arona, D.; Houebagnon Saint, J.C.; Obahoundje, S.; Issiaka, S. Using the CHIRPS Dataset to Investigate Historical Changes in Precipitation Extremes in West Africa. Climate 2020, 8, 84. [Google Scholar] [CrossRef]
  5. IPCC. Managing the Risks of Extreme Events and Disasters to Advance Climate Change Adaptation. In A Special Report of Working Groups I and II of the Intergovernmental Panel on Climate Change; Field, C.B., Barros, V., Stocker, T.F., Qin, D., Dokken, D.J., Ebi, K.L., Mastrandrea, M.D., Mach, K.J., Plattner, G.-K., Allen, S.K., et al., Eds.; Cambridge University Press: Cambridge, UK; New York, NY, USA, 2012; 582p. [Google Scholar]
  6. OCHA. Natural Disaster Bulletin. In Bulletin N°8; OCHA-Geneve: Geneva, Switzerland, 2007; pp. 1–10. [Google Scholar]
  7. Ado, J.P.; Rey, J. Urbanisation et logement décents face aux risques météorologiques en Afrique: Le cas d’Abidjan. In Centre for Affordable Housing Finance in Africa Edition; 2020; 12p, Available online: https://housingfinanceafrica.org/fr/documents/urbanisation-et-logement-decents-face-aux-risques-meteorologiques-en-afrique-le-cas-dabidjan/ (accessed on 29 January 2023).
  8. Goula, B.T.A.; Soro, E.G.; Kouassi, W.; Srohourou, B. Tendances et ruptures au niveau des pluies journalières extrêmes en Côte d’Ivoire (Afrique de l’Ouest). Hydrol. Sci. J. 2012, 57, 1067–1080. [Google Scholar] [CrossRef] [Green Version]
  9. ONPC. Inondations En Côte d’Ivoire. In Edité par l’Office National de La Protection Civile/Département Des Opérations Sécuritaires; ONPC: Abidjan, Côte d’Ivoire, 2014; 7p. [Google Scholar]
  10. Konate, L.; Kouadio, B.H.; Djè, B.K.; Ake, G.E.; Guessan, V.H.N. Caractérisation des pluies journalières intenses et récurrences des inondations: Apport des totaux glissants trois (3) jours à la détermination d ’ une quantité seuil d ’ inondation (District d ’ Abidjan au Sud-Est de la Côte d’Ivoire). Int. J. Innov. Appl. Stud. 2016, 17, 990–1003. [Google Scholar]
  11. UNISDR. Profil de risque de catastrophe en Côte d ’Ivoire (CIMA Resea). Centre International Pour le Monitoring Environnemental Via Magliotto 2; UNISDR: Savona, Italy, 2018; 24p. [Google Scholar]
  12. Brou, Y.T. Climat, mutations socio-économiques et paysages en Côte d’Ivoire. In Mémoire de Synthèse des Activités Scientifiques; Habilitation à Diriger des Recherches, Université des Sciences et Technologies de Lille: Villeneuve-d’Ascq, France, 2005; 212p. [Google Scholar]
  13. Paeth, H.; Born, K.; Podzun, R.; Jacob, D. Regional dynamical downscaling over West Africa: Model evaluation and comparison of wet and dry years. Meteorol. Z. 2005, 14, 349–367. [Google Scholar] [CrossRef]
  14. Diawara, A.; Yoroba, F.; Kouadio, K.Y.; Kouassi, K.B.; Assamoi, E.M.; Diedhiou, A.; Assamoi, P. Climate Variability in the Sudano-Guinean Transition Area and Its Impact on Vegetation: The Case of the Lamto Region in Côte D’Ivoire. Adv. Meteorol. 2014, 2014, 831414. [Google Scholar] [CrossRef] [Green Version]
  15. Bichet, A.; Diedhiou, A. Less frequent and more intense rainfall along the coast of the Gulf of Guinea in West and Central Africa (1981-2014). Clim. Res. 2018, 76, 191–201. [Google Scholar] [CrossRef] [Green Version]
  16. OMM. Guide des Pratiques Climatologiques (OMM-N°100); OMM: Geneva, Switzerland, 2011; p. 152. [Google Scholar]
  17. OMM. Directives de l’OMM Pour le Calcul des Normales Climatiques (OMM-N° 1189); OMM: Genève, Suisse, 2017; 28p. [Google Scholar]
  18. Şen, P.K. Estimates of the regression coefficient based on Kendall’s tau. J. Am. Stat. Assoc. 1968, 63, 1379–1389. [Google Scholar] [CrossRef]
  19. Tarhule, A. Damaging Rainfall and Flooding: The Other Sahel Hazards. Clim. Chang. 2005, 72, 355–377. [Google Scholar] [CrossRef]
  20. Boko, M.I.; Niang, A.; Nyong, C.; Vogel, A.; Githeko, M.; Medany, B.; Osman-Elasha, R.T. Africa. In Climate Change (2007): Impacts, Adaptation and Vulnerability. Contribution of Working Group II to the Fourth Assessment Report of the Intergovernmental Panel on Climate Change; Parry, M.L., Canziani, O.F., Palutikof, J.P., van der Linden, P.J., Hanson, C.E., Eds.; Cambridge University Press: Cambridge, UK, 2007; pp. 433–467. [Google Scholar]
  21. Şen, Z. Innovative Trend Analyses. In Innovative Trend Methodologies in Science and Engineering; Springer International Publishing: New York, NY, USA, 2017; 52p. [Google Scholar]
  22. Nicholson, E.; Selato, C. The influence of la nina on african rainfall. Int. J. Climatol. 2000, 20, 1761–1776. [Google Scholar] [CrossRef]
  23. Kuya, E.K. Precipitation and Temperatures Extremes in East Africa in Past and Future Climate. Master’s Thesis, Meteorology and Oceanography Department of Geosciences, University of OSLO, Oslo, Norvège, 2016; 83p. [Google Scholar]
  24. Parishkura, D. Évaluation de Méthodes de Mise à L’échelle Statistique: Reconstruction des Extrêmes et de la Variabilité du Régime de Mousson au Sahel. Master’s Thesis, l’Université Du Québec, Montreal, QU, Canada, 2009; 128p. [Google Scholar]
  25. Malherbe, L.; Beauchamp, M.; Bourdin, A.; Auvage, S. Analyse de Tendances Nationales En Matière de Qualité de l’air; Direction Générale de l’Énergie et du Climat/Ministère de l’Ecologie, du Développement durable et de l’Energie: Lille, France, 2017; 111p. [Google Scholar]
  26. Goula, A.; Tie, B.I.; Konan, B.; Brou, Y.A.O.T.; Fadika, V.; Srohourou, B. Estimation des pluies exceptionnelles journalières en zone tropicale: Cas de la Côte d’Ivoire par comparaison des lois lognormale et de Gumbel. Hydrol. Sci. J. 2007, 52, 49–67. [Google Scholar]
  27. Hubert, P.; Servat, E.; Paturel, J.E.; Kouame, B.; Bendjoudi, H.; Carbonel, J.P.; Lubes-Niel, H. La procédure de segmentation, dix ans après. Publi. IAHS 1998, 252, 267–273. [Google Scholar]
  28. Pettitt, A.N. A Non-Parametric Approach to the Change-Point Problem. Appl. Stat. 1979, 28, 126–135. [Google Scholar] [CrossRef]
  29. Nicholson, S.E. Sub-Sahara rainfall in the years 1976–1980: Evidence of continued drought. Mon. Weather Rev. 1983, 111, 1646–1654. [Google Scholar] [CrossRef]
  30. Diatta, S.; Diedhiou, C.; Dione, D.; Sambou, S. Spatial Variation and Trend of Extreme Precipitation in West Africa and Teleconnections with Remote Indices. Atmosphere 2020, 11, 999. [Google Scholar] [CrossRef]
  31. Easterling, D.R.; Meehl, G.A.; Parmesan, C.; Changnon, S.A.; Karl, T.R.; Mearns, L.O. Climate Extremes: Observations, Modeling, and Impacts VOL 289 SCIENCE. Science 2000, 5487, 2068–2074. [Google Scholar] [CrossRef] [PubMed] [Green Version]
  32. Groisman, P.; Karl, T.R.; Easterling, D.R.; Knight, R.W.; Jamason, P.F.; Hennessy, K.J.; Suppiah, R.; Page, C.M.; Wibig, J.; Fortuniak, K.; et al. Changes in the Probability of Heavy Precipitation: Important Indicators of Climatic Change. Clim. Chang. 1999, 42, 243–283. [Google Scholar] [CrossRef]
  33. Obahoundje, S.; Diedhiou, A.; Kouassi, K.L.; Ta, M.Y.; Mortey, E.M.; Roudier, P.; Kouame, D.G.M. Analysis of hydroclimatic trends and variability and their impacts on hydropower generation in two river basins in Côte d’Ivoire (West Africa) during 1981–2017. Environ. Res. Commun. 2022, 4, 065001. [Google Scholar] [CrossRef]
  34. Kouadio, K.; Konare, A.; Diawara, A.; Dje, B.K.; Ajayi, V.O.; Diedhiou, A. Assessment of Regional Climate Models over Côte D’Ivoire and Analysis of Future Projections over West Africa. Atmos. Clim. Sci. 2015, 5, 63–81. [Google Scholar]
  35. Carlier, E.; Jamal, E.K. Impact of Global Warming on Relationship of Precipitation: A Case Study of Toronto, Canada. Open J. Mod. Hydrol. 2016, 6, 62683. [Google Scholar] [CrossRef] [Green Version]
  36. Soro, G.É.; Dao, A.; Fadika, V.; Goula Bi, T.A.; Srohorou, B. Estimation Des Pluies Journalières Extrêmes Supérieures à Un Seuil En Climat Tropical: Cas de La Côte d’Ivoire. Géographie Phys. Environ. 2016, 10, 211–227. [Google Scholar] [CrossRef]
  37. Atif, B.M.; Atif, A.; Ijaz, S.; Mehmood, R.; Mahmood, S.A.; Jafer, G.; Shafique, K.; Ghalib, A.K.; Waheed, R. Flood Frequency Analysis of Chenab River for Predicting Peak Flows during Late Monsoon Period. Adv. Remote Sens. 2019, 8, 1–29. [Google Scholar]
  38. Lebel, T.; Ali, A. Recent trends in the Central and Western Sahel rainfall regime (1990–2007). J. Hydrol. 2009, 375, 52–64. [Google Scholar] [CrossRef]
  39. Panthou, G. Analyse Des Extrêmes Pluviométriques En Afrique de l’Ouest et de Leur Évolution Au Cours Des 60 Dernières Années. Ph.D. Thesis, l’Université de Grenoble, Grenoble, France, 2013; 235p. [Google Scholar]
  40. Descroix, L.; Niang, D.A.; Panthou, G.; Bodian, A.; Sane, Y.; Dacosta, H.; Abdou, M.M.; Vandervaere, J.-P.; Quantin, G. Evolution récente de la pluviométrie en Afrique de l’Ouest à travers deux régions. Climatologie 2015, 12, 25–43. [Google Scholar] [CrossRef] [Green Version]
  41. Dugué, P.; Koné, F.R.; Koné, G. Gestion des ressources naturelles et évolution des systèmes de production agricoles des savanes de Côte d ’ Ivoire: Conséquences pour l’élaboration des politiques agricoles. In Savanes africaines: Des Espaces en Mutation, des Acteurs Face à de Nouveaux Défis; Jamin, J.Y., Seiny Boukar, L., Floret, C., Eds.; Actes du Colloque: Garoua, Cameroun, 2002. [Google Scholar]
  42. BM (Banque Mondiale). Situation Économique en Côte D’ivoire; BM (Banque Mondiale): Washington, DC, USA, 2015; 72p. [Google Scholar]
  43. MINAGRI; FAO. Recensement Des Exploitants et Exploitations Agricoles 2015/2016. In Synthèse des Volumes du Recensement des Exploitants et Exploitations Agricoles (REEA) 2015/2016; CountrySTAT: Abidjan, Côte d’Ivoire, 2017; 54p. [Google Scholar]
  44. Ruf, F.; Kone, S.; Bebo, B. Le boom de l’anacarde en Côte d’Ivoire: Transition écologique et sociale des systèmes à base de coton et de cacao. Cah. Agric. 2019, 21, 12. [Google Scholar] [CrossRef]
  45. Di Baldassarre, G.; Montanari, A.; Lins, H.; Koutsoyiannis, D.; Brandimarte, L.; Blöschl, G. Flood fatalities in Africa: From diagnosis to mitigation. Geophys. Res. Lett. 2010, 37, L22402. [Google Scholar] [CrossRef] [Green Version]
  46. UNDP. Etude de Vulnérabilité du Secteur Agricole face aux Changements Climatiques En Côte d ’Ivoire; UNDP: New York, NY, USA, 2013; 105p.
  47. Diba, I.; Didi, S.R.; Obahoundje, S.; Camara, M. Investigating precipitation extremes over West Africa using two regional climate models from 1981 to 2010. Int. J. Innov. Appl. Stud. 2022, 35, 412–424. [Google Scholar]
  48. Descroix, L.; Barrios, J.L.; et Solis, R. Influence de la forêt sur la pluviométrie. In La Sierra Madre Occidentale, un Château d’eau Menacé; IRD Edition: Paris, France, 2001; p. 239. [Google Scholar]
  49. Mouton, J.A. Riziculture et déforestation dans la région de Man, cote d’ivoire. L’agronomie Trop. 1959, XIV, 8. [Google Scholar]
  50. REDD+. Données forestières de base pour la REDD+ en Côte d’Ivoire: Cartographie de la Dynamique Forestière de 1986 à 2015; REDD+: Geneva, Switzerland, 2017; 32p. [Google Scholar]
Figure 1. Monthly distribution of rainfall within the different climates zones of Côte d’Ivoire (I and II refer to Attean and Baulean climates located respectively in southern and central parts, and III and IV refer to Sudanese and Mountain climates located respectively in northern and western parts of Côte d’Ivoire).
Hydrology 10 00104 g001
Figure 2. Spatial variability of annual cumulative precipitation (PRCPTOT on the top row), number of rainy days (RR1 on the middle row), and rainfall intensity per day averaged over the year (SDII on the bottom row) for the periods of 1961–1980 (left column), 1981–2000 (middle column), and 2001–2015 (right column).
Hydrology 10 00104 g002
Figure 3. Spatial variability of 1-day maximum annual precipitation (RX1 DAY on the top row), intense rainfall (R95 P on the middle row), and rainy days with a 10 mm threshold (R10 mm on the bottom row) for the periods of 1961–1980 (bottom column) for the periods of 1961–1980 (left column), 1981–2000 (middle column), and 2001–2015 (right column).
Hydrology 10 00104 g003aHydrology 10 00104 g003b
Figure 4. Spatial variability of consecutive dry days (CDD on the top row) and consecutive wet days (CWD on the bottom row) for the periods of 1961–1980 (left column), 1981–2000 (middle column), and 2001–2015 (right column).
Hydrology 10 00104 g004
Figure 5. Break detection and reduced centered index in annual precipitation (PRCPTOT) from 1961 to 2015 in each climate area. The annual cycles in the subperiods before (1961–1975) and after (2001–2014) the break are plotted in blue and red, respectively.
Hydrology 10 00104 g005
Figure 6. Frequency distribution of indices in the northern part of Côte d’Ivoire (Sudanese climate).
Hydrology 10 00104 g006
Figure 7. Frequency distribution of indices in the central part of Côte d’Ivoire (Baulean climate).
Hydrology 10 00104 g007
Figure 8. Frequency distribution of indices in the western part of Côte d’Ivoire (Mountain climate).
Hydrology 10 00104 g008
Figure 9. Frequency distribution of indices in the southern part of Côte d’Ivoire (Attean climate).
Hydrology 10 00104 g009
Table 1. Spatial coordinates (latitudes, longitudes, and altitudes) of the synoptic stations used in this study.
NameLatitudeLongitudeAltitude (m)Date
Abidjan aero5°15′0″3°55′59.88″111961–2015
Adiake5°17′60″3°17′59″401961–2015
Bondoukou8°0′0″2°46′60″3711961–2015
Bouake (aero)7°43′59.88″5°4′0.119″3761961–2013
Dimbokro6°39′0″4°42′0″921961–2015
Gagnoa6°7′59.88″5°57′0″2141961–2015
Korhogo aero9°25′0.12″5°37′0.1″3821971–2015
Man-aero7°24′0″7°31′012″3401961–2014
Odienne9°32′23.59″7°33′53.15″4341961–2015
Sassandra4°57′0″6°4′59.88″661961–2013
Tabou4°25′0.12″7°22′0.119″101961–2013
San-Pedro4°45′0″6°39′0″311977–2013
Yamoussoukro6°54′0″5°20′59.999″2121975–2015
Daloa-aero6°52′0.12″6°28′0.12″2761967–2015
Table 2. Summary of rainfall indices used in this study.
IndexDescription NameDefinitionUnits
PRCPTOTAnnual total precipitationAnnual total precipitation (RR) during wet days
(RR ≥ 1 mm)
mm
RR1MMNumber of wet daysAnnual count of days when RR is ≥1 mmdays
RX1 DAYMaximum 1-day rainfallMaximum total rainfall on a rainy daymm
RX5 DAYMaximum 5-day rainfallMaximum total rainfall on a rainy daymm
R10 MMVery heavy rainfall daysAnnual count of days when RR is ≥10 mmdays
R20 MMVery heavy rainfall daysAnnual count of days when RR is ≥20 mmdays
CDDConsecutive dry daysMaximum number of consecutive dry daysdays
CWDConsecutive wet daysMaximum number of consecutive wet daysdays
SDIISimple daily intensity indexAverage rainfall from wet daysmm/day
R95 PVery wet daysAnnual total precipitation when RR is ≥the 95th percentile of 1982–2014mm
R99 PExtremely wet daysAnnual total precipitation when RR is ≥the 99th percentile of 1982–2014mm
Table 3. Significance trends (at the 5% threshold) for each index and all stations (dark red/light = negative trend significant/non-significant; dark blue/light = positive trend significant/non-significant).
STATIONSINDICES
PRCPTOT (mm)SDII (mm/day)RR1 (days)CDD (days)CWD (days)R10 mm (days)R20 mm (days)R95 P (mm)R99 P (mm)Rx1-Day (mm)Rx5-Day (mm)
Korhogo
Odienné
Sudanese climate
Gagnoa
Yamoussoukro
Daloa
Bouaké
Bondoukou
Dimbokro
Baulean climate
Man
Mountain climate
Abidjan
Adiaké
San-Pedro
Tabou
Sassandra
Attean climate
Disclaimer/Publisher’s Note: The statements, opinions and data contained in all publications are solely those of the individual author(s) and contributor(s) and not of MDPI and/or the editor(s). MDPI and/or the editor(s) disclaim responsibility for any injury to people or property resulting from any ideas, methods, instructions or products referred to in the content.

