Next Issue
Volume 10, June
Previous Issue
Volume 10, April


Hydrology, Volume 10, Issue 5 (May 2023) – 15 articles

Cover Story (view full-size image): 
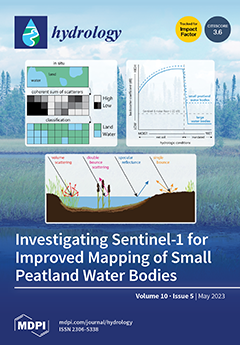
The mixed pixel problem is a well-known remote sensing issue, which extends to peatland surface water mapping. We have observed that the small water bodies found in peatlands are often omitted from surface water classifications, even with sufficient spatial resolution. We hypothesised that these water bodies must have a unique relationship with backscatter, as compared to larger water bodies. We found that small peatland water bodies are omitted due to the high backscatter intensity of water bodies with emergent vegetation, and the mixed pixel problem, leading to overinflated coherent sums for processed pixels. We observed that small peatland water bodies, even those that appeared open, had consistently higher VV and VH Sentinel-1 backscatter intensity than larger water bodies, which were typically below the Sentinel-1 noise floor of -22 dB. View this paper
  • Issues are regarded as officially published after their release is announced to the table of contents alert mailing list.
  • You may sign up for e-mail alerts to receive table of contents of newly released issues.
  • PDF is the official format for papers published in both, html and pdf forms. To view the papers in pdf format, click on the "PDF Full-text" link, and use the free Adobe Reader to open them.
Order results
Result details
Section
Select all
Export citation of selected articles as:
14 pages, 1844 KiB  
Article
Infiltrated Pits: Using Regional Groundwater Data to Estimate Methane Emissions from Pit Latrines
by Olivia Reddy, Mostaquimur Rahman, Anisha Nijhawan, Maria Pregnolato and Guy Howard
Hydrology 2023, 10(5), 114; https://doi.org/10.3390/hydrology10050114 - 19 May 2023
Cited by 1 | Viewed by 2013
Abstract
On-site sanitation systems (OSS), such as pit latrines, are an important source of methane (CH4), with emissions increasing when they are wet, and this occurs when anaerobic conditions dominate. This paper presents the development of a model, which uses seasonal changes [...] Read more.
On-site sanitation systems (OSS), such as pit latrines, are an important source of methane (CH4), with emissions increasing when they are wet, and this occurs when anaerobic conditions dominate. This paper presents the development of a model, which uses seasonal changes in groundwater to account for the fluctuating inundation of pit latrines, and, therefore, the associated CH4 emissions from varying degrees of anerobic conditions are examined. Given that observed timeseries of groundwater table depth at high enough spatial and temporal resolutions are often difficult to obtain in low- and middle-income countries (LMICs), inverse distance weighted (IDW) interpolation is used to generate values for a whole region, which is then used, alongside average pit latrine depth, to determine areas of pit latrine inundation. Outcomes are further informed with open-source contextual data, covering population, urban/rural split, and sanitation facility data, before using methodologies from the Intergovernmental Panel on Climate Change (IPCC) to generate CH4 emissions data. As a case study, we use data from Senegal to illustrate how this model works. Results show total CH4 emissions for the month of January to be ~1.69 kt CH4. We have also discussed the potential use of satellite remote sensing data in regions where access to historical groundwater data is limited. Understanding when the pit conditions are most likely to change could lead to incentives for better management strategies, as well as a reduction in CH4 production. Full article
Show Figures

Figure 1

16 pages, 9249 KiB  
Article
Validating the Quality of Volunteered Geographic Information (VGI) for Flood Modeling of Hurricane Harvey in Houston, Texas
by T. Edwin Chow, Joyce Chien and Kimberly Meitzen
Hydrology 2023, 10(5), 113; https://doi.org/10.3390/hydrology10050113 - 17 May 2023
Cited by 2 | Viewed by 1606
Abstract
The primary objective of this study was to examine the quality of volunteered geographic information (VGI) data for flood mapping of Hurricane Harvey. As a crowdsourcing platform, the U-Flood project mapped flooded streets in the Houston metro area. This research examines the following: [...] Read more.
The primary objective of this study was to examine the quality of volunteered geographic information (VGI) data for flood mapping of Hurricane Harvey. As a crowdsourcing platform, the U-Flood project mapped flooded streets in the Houston metro area. This research examines the following: (1) If there are any significant differences in water depth (WD) among the hydraulic and hydrologic (H&H) model, the Federal Emergency Management Agency (FEMA) reference floodplain map, and the VGI? (2) Are there any significant differences in the inundated areas between the floodplain modeled by the VGI and hydraulic simulation? This study used HEC-RAS to simulate flood inundation maps and validated the results with high water marks (HWM) and the FEMA-modeled floodplain after Hurricane Harvey. The statistical results showed that there were significant differences in the WD, the inundated road count, and the length inside/outside of HEC-RAS-modeled floodplain. The results also showed that a less consistent decreasing trend between the U-Flood data and the modeled floodplain over time and space. This study empirically evaluated the data quality of the VGI based on observed and modeled data in flood monitoring. The findings from this study fill the gaps in the literature by assessing the uncertainty and data quality of VGI, providing insights into using supplementary data in flood mapping research. Full article
(This article belongs to the Special Issue Flood Inundation Mapping in Hydrological Systems)
Show Figures

Figure 1

5 pages, 180 KiB  
Editorial
Modern Developments in Flood Modelling
by Aristoteles Tegos, Alexandros Ziogas and Vasilis Bellos
Hydrology 2023, 10(5), 112; https://doi.org/10.3390/hydrology10050112 - 15 May 2023
Viewed by 1388
Abstract
Flood modelling is among the most challenging scientific task because it covers a wide area of complex physical phenomena associated with highly uncertain and non-linear processes where the development of physically interpretive solutions usually suffers from the lack of recorded data [...] Full article
(This article belongs to the Special Issue Modern Developments in Flood Modelling)
12 pages, 4670 KiB  
Article
Extending the Design Life of the Palm Jumeirah Revetment Considering Climate Change Effects
by Khaled Elkersh, Serter Atabay, Abdullah Gokhan Yilmaz, Yomna Morad and Nour Nouar
Hydrology 2023, 10(5), 111; https://doi.org/10.3390/hydrology10050111 - 13 May 2023
Viewed by 2652
Abstract
This paper presents potential upgrades to the Palm Jumeirah Island’s outer revetment to extend its design life for 50 years, considering the sea level rise (SLR) associated with climate change. The paper proposes several upgrade options to ensure that the hydraulic stability and [...] Read more.
This paper presents potential upgrades to the Palm Jumeirah Island’s outer revetment to extend its design life for 50 years, considering the sea level rise (SLR) associated with climate change. The paper proposes several upgrade options to ensure that the hydraulic stability and wave overtopping discharges of the Palm Jumeirah revetment comply with the recommended design criteria based on industry guidelines. The performance of the existing revetment, in terms of the hydraulic stability and wave overtopping discharge criteria, is assessed using design wave heights (1- and 100-year events) extracted from an extreme wave analysis study on the Dubai coast. The results show that, based on the new design conditions, the existing structure should be upgraded to meet the armor stability criteria and recommended overtopping discharge values. Three different upgrade solutions are designed and analyzed to satisfy the required hydraulic stability and overtopping conditions. The suggested upgrade options are an extra armor layer, a flat berm, and a submerged breakwater offshore. The proposed upgrade solutions are preliminary designs that would require verification in terms of their geotechnical stability and physical model testing to evaluate their performance. Full article
(This article belongs to the Special Issue Climate Change Effects on Coastal Management)
Show Figures

Figure 1

23 pages, 3687 KiB  
Article
Predicting Optical Water Quality Indicators from Remote Sensing Using Machine Learning Algorithms in Tropical Highlands of Ethiopia
by Elias S. Leggesse, Fasikaw A. Zimale, Dagnenet Sultan, Temesgen Enku, Raghavan Srinivasan and Seifu A. Tilahun
Hydrology 2023, 10(5), 110; https://doi.org/10.3390/hydrology10050110 - 11 May 2023
Cited by 12 | Viewed by 2735
Abstract
Water quality degradation of freshwater bodies is a concern worldwide, particularly in Africa, where data are scarce and standard water quality monitoring is expensive. This study explored the use of remote sensing imagery and machine learning (ML) algorithms as an alternative to standard [...] Read more.
Water quality degradation of freshwater bodies is a concern worldwide, particularly in Africa, where data are scarce and standard water quality monitoring is expensive. This study explored the use of remote sensing imagery and machine learning (ML) algorithms as an alternative to standard field measuring for monitoring water quality in large and remote areas constrained by logistics and finance. Six machine learning (ML) algorithms integrated with Landsat 8 imagery were evaluated for their accuracy in predicting three optically active water quality indicators observed monthly in the period from August 2016 to April 2022: turbidity (TUR), total dissolved solids (TDS) and Chlorophyll a (Chl-a). The six ML algorithms studied were the artificial neural network (ANN), support vector machine regression (SVM), random forest regression (RF), XGBoost regression (XGB), AdaBoost regression (AB), and gradient boosting regression (GB) algorithms. XGB performed best at predicting Chl-a, with an R2 of 0.78, Nash–Sutcliffe efficiency (NSE) of 0.78, mean absolute relative error (MARE) of 0.082 and root mean squared error (RMSE) of 9.79 µg/L. RF performed best at predicting TDS (with an R2 of 0.79, NSE of 0.80, MARE of 0.082, and RMSE of 12.30 mg/L) and TUR (with an R2 of 0.80, NSE of 0.81, and MARE of 0.072 and RMSE of 7.82 NTU). The main challenges were data size, sampling frequency, and sampling resolution. To overcome the data limitation, we used a K-fold cross validation technique that could obtain the most out of the limited data to build a robust model. Furthermore, we also employed stratified sampling techniques to improve the ML modeling for turbidity. Thus, this study shows the possibility of monitoring water quality in large freshwater bodies with limited observed data using remote sensing integrated with ML algorithms, potentially enhancing decision making. Full article
Show Figures

Figure 1

13 pages, 2983 KiB  
Article
Are the Regional Precipitation and Temperature Series Correlated? Case Study from Dobrogea, Romania
by Alina Bărbulescu and Florin Postolache
Hydrology 2023, 10(5), 109; https://doi.org/10.3390/hydrology10050109 - 11 May 2023
Cited by 1 | Viewed by 1485
Abstract
In the context of climate change, this article tries to answer the question of whether a correlation exists between the precipitation and temperature series at a regional scale in Dobrogea, Romania. Six sets of time series are used for this aim, each of [...] Read more.
In the context of climate change, this article tries to answer the question of whether a correlation exists between the precipitation and temperature series at a regional scale in Dobrogea, Romania. Six sets of time series are used for this aim, each of them containing ten series—precipitation and temperatures—recorded at the same period at the same hydro-meteorological stations. The existence of a monotonic trend was first assessed for each individual series. Then, the Regional time series (RTS) (one for a set of series) were built and the Mann–Kendall test was employed to test the existence of a monotonic trend for RTSs. In an affirmative case, Sen’s method was employed to determine the slope of the linear trend. Finally, nonparametric trend tests were utilized to verify if there was a correlation between the six RTSs. This study resulted in the fact that the only RTS presenting an increasing trend was that of minimum temperatures, and there was a weak correlation between the RTS of minimum precipitations and maximum temperatures. Full article
(This article belongs to the Special Issue Stochastic and Deterministic Modelling of Hydrologic Variables)
Show Figures

Figure 1

19 pages, 12134 KiB  
Article
Reservoir Ice Conditions from Multi-Sensor Remote Sensing and ERA5-Land: The Manicouagan Hydroelectric Reservoir Case Study
by Gabriela Llanet Siles and Robert Leconte
Hydrology 2023, 10(5), 108; https://doi.org/10.3390/hydrology10050108 - 11 May 2023
Cited by 1 | Viewed by 1428
Abstract
Reservoir ice can have an important impact on the watershed scale and influence hydraulic operations. On the other hand, hydropower generation can also impact the ice regime. In this study, multi-source satellite and ERA5-land data are used to evaluate ice conditions. Specifically, ice-controlling [...] Read more.
Reservoir ice can have an important impact on the watershed scale and influence hydraulic operations. On the other hand, hydropower generation can also impact the ice regime. In this study, multi-source satellite and ERA5-land data are used to evaluate ice conditions. Specifically, ice-controlling variables (temperature, water levels), ice regime (cover/deformation, thickness) and their interrelations are assessed for a 5-year period from 2017 to 2021. The methodology is applied to the Manicouagan reservoir, one of the largest hydropower reservoirs in Quebec, Canada. The satellite-based land surface temperatures (LSTs) suggest that winter 2021 was the hottest one. Overall, MODIS and Landsat LSTs agree with the ERA5-land temperatures. Ice backscatter from Sentinel-1 indicates that, in general, the reservoir is completely covered by ice from January to March. A correlation of 0.6 and 0.8 is observed between C- and Ku-band Synthetic Aperture Radar (SAR) signal and ice thickness, respectively. Important ice changes inferred from Differential Interferometric SAR (D-InSAR) occur approximately at the position where the largest ERA5-land ice thickness differences are observed. Winter water levels are also evaluated using satellite altimetric data to verify their influence on the ice dynamics. They show a decreasing tendency as the winter advances. Full article
Show Figures

Figure 1

17 pages, 3656 KiB  
Article
Fuzzy Analytical Solution of Horizontal Diffusion Equation into the Vadose Zone
by Christos Tzimopoulos, Nikiforos Samarinas, Basil Papadopoulos and Christos Evangelides
Hydrology 2023, 10(5), 107; https://doi.org/10.3390/hydrology10050107 - 08 May 2023
Viewed by 2117
Abstract
The process of how soil moisture profiles evolve into the soil and reach the root zone could be estimated by solving the appropriate strong nonlinear Richards’ equation. The nonlinearity of the equation occurs because diffusivity D is generally an exponential function of water [...] Read more.
The process of how soil moisture profiles evolve into the soil and reach the root zone could be estimated by solving the appropriate strong nonlinear Richards’ equation. The nonlinearity of the equation occurs because diffusivity D is generally an exponential function of water content. In this work, the boundary conditions of the physical problem are considered fuzzy for various reasons (e.g., machine impression, human errors, etc.), and the overall problem is encountered with a new approximate fuzzy analytical solution, leading to a system of crisp boundary value problems. According to the results, the proposed fuzzy analytical solution is in close agreement with Philip’s semi-analytical method, which is used as a reference solution, after testing 12 different types of soils. Additionally, possibility theory is applied, enabling the decision-makers to take meaningful actions and gain knowledge of various soil and hydraulic properties (e.g., sorptivity, infiltration, etc.) for rational and productive engineering studies (e.g., irrigation systems). Full article
(This article belongs to the Topic Groundwater Pollution Control and Groundwater Management)
Show Figures

Figure 1

16 pages, 5161 KiB  
Article
Regional Analysis of Tracer Tests in the Karstic Basin of the Gacka River (Croatian Dinaric Karst)
by Andrej Stroj, Maja Briški, Jasmina Lukač Reberski and Tihomir Frangen
Hydrology 2023, 10(5), 106; https://doi.org/10.3390/hydrology10050106 - 08 May 2023
Viewed by 1451
Abstract
Tracer testing is the only method in karst hydrogeology that can definitively determine whether a particular site belongs to a watershed of a particular karst spring. Therefore, it is an essential technique for delineating groundwater basins in karst areas. The availability of tracer [...] Read more.
Tracer testing is the only method in karst hydrogeology that can definitively determine whether a particular site belongs to a watershed of a particular karst spring. Therefore, it is an essential technique for delineating groundwater basins in karst areas. The availability of tracer test results is often limited due to the complicated and relatively expensive application of this approach, especially for large regional watersheds. The Croatian part of the Dinaric karst region extends for several hundred kilometers along the Adriatic coast and consists almost entirely of highly karstified carbonate rocks. The groundwater basins in these areas almost never match the surface morphology of the terrain. In practice, all available results of previous surveys are often used to define watersheds, regardless of the methodology and age of their implementation. This is also true for the earlier delineations of the Gacka River watershed, a regional karst basin in the Croatian Dinaric karst. However, tracer testing methods, especially the accuracy of tracer determination and monitoring, have improved significantly during this time. In order to assess the reliability of past tracing results in this significant karst basin, we reviewed reports of previous tracer tests. More recent tests, in particular the most recent multitracer injection test with continuous tracer detection on the major springs, produced high-quality data that allowed us to assess the reliability of the findings from prior research. A number of large karst springs with partially overlapping subcatchments feed the Gacka River. After discarding unreliable tracing data, we reevaluated the subcatchments of the main springs as well as the characteristics of the regional groundwater flow patterns throughout the basin, which is particularly important for water quality protection measures of the springs. The Gacka River basin is used as a case study to emphasize the importance of thoroughly assessing the reliability of previous tracing data before using them in regional analyses. Full article
(This article belongs to the Special Issue Hydro-Geology of Karst Areas)
Show Figures

Figure 1

25 pages, 5667 KiB  
Article
Examination of Measured to Predicted Hydraulic Properties for Low Impact Development Substrates
by Satbir Guram and Rashid Bashir
Hydrology 2023, 10(5), 105; https://doi.org/10.3390/hydrology10050105 - 08 May 2023
Viewed by 1959
Abstract
To counter the impacts of climate change and urbanization, engineers have developed ingenious solutions to reduce flooding and capture stormwater contaminants through the use of Low Impact Developments (LIDs). The soil is generally considered to be completely saturated when designing for the LIDs. [...] Read more.
To counter the impacts of climate change and urbanization, engineers have developed ingenious solutions to reduce flooding and capture stormwater contaminants through the use of Low Impact Developments (LIDs). The soil is generally considered to be completely saturated when designing for the LIDs. However, this may not always be an accurate or realistic approach, as the soil could be variably unsaturated leading to inaccurate designs. To analyse the flow under variably unsaturated conditions, Richards’ equation can be used. To solve the Richards’ equation, two nonlinear hydraulic properties, namely soil water characteristic curve (SWCC) and the unsaturated hydraulic conductivity function are required. Laboratory and field measurements of unsaturated hydraulic properties are cumbersome, expensive and time- consuming. Pedotransfer functions (PTFs) estimate soil hydraulic properties using routinely measured soil properties. This paper presents a comparison between the direct measurement obtained through experimental procedures and the use of PTFs to estimate soil hydraulic properties for two green roof and three bioretention soil medias. Comparison between the measured and estimated soil hydraulic properties was accomplished using two different approaches. Statistical analyses and visual comparisons were used to compare the measured and estimated soil hydraulic properties. Additionally, numerical modelling to predict the water balance at the ground surface was conducted using the measured and estimated soil hydraulic properties. In some instances, the use of predicted hydraulic properties resulted in overestimation of the cumulative net infiltration of as much as 60 % for the green roof substrate, but was considered negligible for the bioretention substrate. Design performance criteria for green roof and bioretention facilities were examined using the measured and estimated soil hydraulic properties under extreme precipitation analysis. Results indicate that there is a high level of uncertainty when using PTFs for LID materials. A percent difference between the measured and predicted properties for the green roof peak time delay under a 2-year storm can be as much as 300%. For the bioretention design criteria of a 25-year storm, the surface runoff was overestimated by 14.7 cm and by 100% for the ponding time percent difference. Full article
(This article belongs to the Special Issue Green Infrastructure and Advances in Urban Hydrology)
Show Figures

Figure 1

15 pages, 7210 KiB  
Article
Observed Changes in Rainfall and Characteristics of Extreme Events in Côte d’Ivoire (West Africa)
by Daouda Konate, Sacre Regis Didi, Kouakou Bernard Dje, Arona Diedhiou, Kouakou Lazare Kouassi, Bamory Kamagate, Jean-Emmanuel Paturel, Houebagnon Saint Jean-Patrick Coulibaly, Claude Alain Koffi Kouadio and Talnan Jean Honoré Coulibaly
Hydrology 2023, 10(5), 104; https://doi.org/10.3390/hydrology10050104 - 30 Apr 2023
Cited by 2 | Viewed by 1886
Abstract
This study evaluates how the characteristics of daily rainfall and extreme events in Côte d’Ivoire changed during 1961–2015 using the rain gauge observation network of the National Meteorological Service (SODEXAM). The results indicate that the northern and southern parts of Cote d’Ivoire experienced [...] Read more.
This study evaluates how the characteristics of daily rainfall and extreme events in Côte d’Ivoire changed during 1961–2015 using the rain gauge observation network of the National Meteorological Service (SODEXAM). The results indicate that the northern and southern parts of Cote d’Ivoire experienced a change from a wet to a dry period, with cut-offs in 1982 and 1983, respectively. In the northern part, this dry period was marked by a decrease in rainfall intensity, the length of wet spells, and the contribution of heavy and extreme rainfall, as well as an increase in the number of rainy days and a decrease in the length of dry spells. Over the southern part, this dry period was marked by an increase in the maximum length of dry spells associated with an increase in the maximum 1-day and 5-day precipitation events. The western part of Côte d’Ivoire experienced a late cut-off from the wet to dry period in 2000; the dry period was associated with a decrease in the number of rainy days, rainfall intensities, and maximum length of wet spells. Changes in the central part of Cote d’Ivoire presented high variability, and trends were less marked, even though a cut-off from a wet to dry period was detected in 1991. This study shows that Côte d’Ivoire, which is located in a subhumid and humid region and has an economy dependent on agriculture (especially cash crops, which comprise 60% of the GDP), is experiencing dry spells that are increasing in frequency and length. Combined with deforestation to increase production, this situation could lead to desertification and compromise the sustainable development goals of the country. The contribution of heavy rainfall was found to increase during the last 15 years, increasing the overall risk of floods, especially in urban areas where city authorities and populations are not prepared, thereby threatening infrastructure and human security. Full article
(This article belongs to the Special Issue Trends and Variations in Hydroclimatic Variables)
Show Figures

Figure 1

44 pages, 147237 KiB  
Article
CoastFLOOD: A High-Resolution Model for the Simulation of Coastal Inundation Due to Storm Surges
by Christos Makris, Zisis Mallios, Yannis Androulidakis and Yannis Krestenitis
Hydrology 2023, 10(5), 103; https://doi.org/10.3390/hydrology10050103 - 30 Apr 2023
Cited by 4 | Viewed by 2200
Abstract
Storm surges due to severe weather events threaten low-land littoral areas by increasing the risk of seawater inundation of coastal floodplains. In this paper, we present recent developments of a numerical modelling system for coastal inundation induced by sea level elevation due to [...] Read more.
Storm surges due to severe weather events threaten low-land littoral areas by increasing the risk of seawater inundation of coastal floodplains. In this paper, we present recent developments of a numerical modelling system for coastal inundation induced by sea level elevation due to storm surges enhanced by astronomical tides. The proposed numerical code (CoastFLOOD) performs high-resolution (5 m × 5 m) raster-based, storage-cell modelling of coastal inundation by Manning-type equations in decoupled 2-D formulation at local-scale (20 km × 20 km) lowland littoral floodplains. It is fed either by outputs of either regional-scale storm surge simulations or satellite altimetry data for the sea level anomaly. The presented case studies refer to model applications at 10 selected coastal sites of the Ionian Sea (east-central Mediterranean Sea). The implemented regular Cartesian grids (up to 5 m) are based on Digital Elevation/Surface Models (DEM/DSM) of the Hellenic Cadastre. New updated features of the model are discussed herein concerning the detailed surveying of terrain roughness and bottom friction, the expansion of Dirichlet boundary conditions for coastal currents (besides sea level), and the enhancement of wet/dry cell techniques for flood front propagation over steep water slopes. Verification of the model is performed by comparisons against satellite ocean color observations (Sentinel-2 images) and estimated flooded areas by the Normalized Difference Water Index (NDWI). The qualitative comparisons are acceptable, i.e., the modelled flooded areas contain all wet area estimations by NDWI. CoastFLOOD results are also compared to a simplified, static level, “bathtub” inundation approach with hydraulic connectivity revealing very good agreement (goodness-of-fit > 0.95). Furthermore, we show that proper treatment of bottom roughness referring to realistic Land Cover datasets provides more realistic estimations of the maximum flood extent timeframe. Full article
(This article belongs to the Special Issue Modern Developments in Flood Modelling)
Show Figures

Figure 1

16 pages, 3051 KiB  
Article
Investigating the Use of Sentinel-1 for Improved Mapping of Small Peatland Water Bodies: Towards Wildfire Susceptibility Monitoring in Canada’s Boreal Forest
by Samantha Schultz, Koreen Millard, Samantha Darling and René Chénier
Hydrology 2023, 10(5), 102; https://doi.org/10.3390/hydrology10050102 - 27 Apr 2023
Cited by 1 | Viewed by 2114
Abstract
Peatlands provide vital ecosystem and carbon services, and Canada is home to a significant peatland carbon stock. Global climate warming trends are expected to lead to increased carbon release from peatlands, as a consequence of drought and wildfire. Monitoring hydrologic regimes is a [...] Read more.
Peatlands provide vital ecosystem and carbon services, and Canada is home to a significant peatland carbon stock. Global climate warming trends are expected to lead to increased carbon release from peatlands, as a consequence of drought and wildfire. Monitoring hydrologic regimes is a key in understanding the impacts of warming, including monitoring changes in small and temporally variable water bodies in peatlands. Global surface water mapping has been implemented, but the spatial and temporal scales of the resulting data products prevent the effective monitoring of peatland water bodies, which are small and prone to rapid hydrologic changes. One hurdle in the quest to improve remote-sensing-derived global surface water map quality is the omission of small and temporally variable water bodies. This research investigated the reasons for small peatland water body omission as a preparatory step for surface water mapping, using Sentinel-1 SAR data and image classification methods. It was found that Sentinel-1 backscatter signatures for small peatland water bodies differ from large water bodies, due in part to differing physical characteristics such as waves and emergent vegetation, and limitations in detectable feature sizes as a result of SAR image processing and resolution. The characterization of small peatland water body backscatter provides a theoretical basis for the development of SAR-based surface water mapping methods with high accuracy for our purposes of wildfire susceptibility monitoring in peatlands. This study discusses the implications of small peatland water body omission from surface water maps on carbon, climate, and hydrologic models. Full article
Show Figures

Figure 1

28 pages, 6221 KiB  
Article
Sensitivity of the Penman–Monteith Reference Evapotranspiration Equation to Meteorological Variables for Puerto Rico
by Michelle Irizarry-Ortiz and Eric W. Harmsen
Hydrology 2023, 10(5), 101; https://doi.org/10.3390/hydrology10050101 - 25 Apr 2023
Cited by 1 | Viewed by 2016
Abstract
Spatiotemporal variations in reference evapotranspiration (ETo) are sensitive to the meteorological data used in its estimation. The sensitivity of the ASCE standardized ETo equation to meteorological variables from GOES-PRWEB dataset was evaluated for the island of Puerto Rico. Island [...] Read more.
Spatiotemporal variations in reference evapotranspiration (ETo) are sensitive to the meteorological data used in its estimation. The sensitivity of the ASCE standardized ETo equation to meteorological variables from GOES-PRWEB dataset was evaluated for the island of Puerto Rico. Island wide, ETo is most sensitive to daily mean relative humidity (RHmean), followed by solar radiation, daily maximum (Tmax) and minimum (Tmin) air temperatures, and wind speed with average absolute relative sensitivity coefficients (SCs) of 0.98, 0.57, 0.50, 0.27, and 0.12, respectively. The derived SCs guided the prioritization of bias correction of meteorological data for ETo estimation from two downscaled climate models (CNRM and CESM). The SCs were applied to evaluate how meteorological variables contribute to model errors and projected future changes in ETo from 1985–2005 to 2040–2060 at irrigated farms in the south. Both models project a 5.6% average increase in annual ETo due to projected increases in Tmax and Tmin and a decrease in RHmean. Despite ETo being most sensitive to relative changes in RHmean, the contributions from RHmean, Tmax, and Tmin to future changes in ETo are similar. CESM projects increases in ETo in March, November, and December, increasing the potential for crop water stress. Study limitations are discussed. Full article
(This article belongs to the Topic Hydrology and Water Resources in Agriculture and Ecology)
Show Figures

Figure 1

22 pages, 6378 KiB  
Article
Determining the Optimal Aquifer Exploitation under Artificial Recharge using the Combination of Numerical Models and Particle Swarm Optimization
by Rahimeh Maghsoudi, Saman Javadi, Mojtaba Shourian and Golmar Golmohammadi
Hydrology 2023, 10(5), 100; https://doi.org/10.3390/hydrology10050100 - 25 Apr 2023
Cited by 1 | Viewed by 1938
Abstract
Determining optimal exploitation from aquifers is always a major challenge, especially for aquifers facing a drop in their groundwater level. In aquifers with artificial recharge, more complex algorithms are required to determine the optimal exploitation amount. Therefore, in this study, the optimal amount [...] Read more.
Determining optimal exploitation from aquifers is always a major challenge, especially for aquifers facing a drop in their groundwater level. In aquifers with artificial recharge, more complex algorithms are required to determine the optimal exploitation amount. Therefore, in this study, the optimal amount of harvest from the exploitation wells has been determined using a combined simulation–optimization model considering the artificial recharge in Yasouj aquifer in Iran. The model is based on a combination of MODFLOW code and gene expression programming (GEP) simulator tool to simulate the aquifer and particle swarm optimization (PSO) to maximize the total exploitation from the aquifer. The simulation results showed that the artificial recharge was ineffective in maximum exploitation from the aquifer. As a result, considering several constraints, including the maximum pumping rate from the aquifer and the permissible drop in the groundwater level, the maximum exploitation from the aquifer was defined as the objective function. The optimization results showed that the optimal exploitation rate is equal to 8.84 million cubic meters (MCM) per year, and only 74% of the water from artificial recharge can be used based on this amount. Additionally, the most appropriate locations to exploit this amount of water are the northwest and east of the aquifer. According to the findings, it is suggested to ban exploitation from the central and southern parts of the aquifer due to the low groundwater level. The results of the sensitivity analysis show that the reduction in the maximum exploitation rate along with a 50% drop in the groundwater level play an effective role in decreasing the optimal exploitation amount. Full article
(This article belongs to the Special Issue Groundwater Decline and Depletion)
Show Figures

Figure 1

Previous Issue
Next Issue
Back to TopTop