Article

Assessing the Impacts of Land Use and Land Cover Changes on the Water Quality of River Hooghly, West Bengal, India: A Case Study

1
Department of Civil Engineering, North Eastern Regional Institute of Science and Technology, Nirjuli 791109, India
2
Department of Agricultural Engineering, North Eastern Regional Institute of Science and Technology, Nirjuli 791109, India
3
Department of Civil Engineering, Elitte College of Engineering, MAKA University of Technology, Kolkata 700113, India
4
Department of Civil Engineering, University of Nevada, Las Vegas, NV 89154, USA
*
Authors to whom correspondence should be addressed.
Hydrology 2023, 10(3), 71; https://doi.org/10.3390/hydrology10030071
Submission received: 27 February 2023 / Revised: 13 March 2023 / Accepted: 20 March 2023 / Published: 22 March 2023

Abstract

:
Rivers are crucial components of human civilization, as they provide water for domestic, agricultural, and industrial use. Additionally, they transport domestic and industrial waste to the sea. The Ganga River is a major river in India, originating from Gangotri in the north, flowing through five provinces, and discharging into the Bay of Bengal. This study examined the impact of land use and land cover changes (LULC) on water quality along the River Hooghly in India. The research involved collecting water samples from different locations and analyzing them in the laboratory to estimate various parameters. The findings indicate that the expansion of built-up and agricultural lands is causing a reduction in tree cover and water bodies, leading to deteriorating water quality. The study highlights the need for sustainable land use practices and improved water management to preserve the river’s ecosystem and maintain water quality. Specifically, the study identified localities in the vicinity of Dakshineshwar, Shibpur, and Garden Reach as particularly vulnerable to water quality deterioration due to LULC changes and population growth. The study’s results provide valuable insights for policymakers and stakeholders in implementing strategies to address the challenges posed by land use changes and population growth.

1. Introduction

Land use and land cover (LULC) change has a significant impact on rivers, affecting the amount and quality of water that flows through them. Changes in land use patterns such as deforestation, urbanization, and agricultural intensification can alter the natural balance of water flow in river systems, leading to increased sedimentation, erosion, and runoff, which can degrade water quality and reduce the amount of water available for river flow. LULC changes can also have harmful impacts on aquatic life and human health by altering the temperature, pH, and nutrient levels of the water. Additionally, these changes can increase the risk of flooding and droughts. Therefore, it is crucial to consider the impacts of LULC changes on rivers when planning and managing land use to ensure sustainable and healthy river ecosystems [1,2,3].
The Hooghly River provides a constant water supply to the nearby regions for domestic, agricultural, industrial, and transportation purposes [4]. However, the river water gets severely polluted during monsoon and post-monsoon periods, which is a significant concern [5]. The cause of this problem can be attributed to changes in LULC due to urbanization, agricultural intensification, and demographic shifts. These changes have a direct impact on the water quality of the Hooghly River, especially in the vicinity of Kolkata. The alteration in water quality and the increase in sediment load can disturb the water supply for various uses, including domestic. Therefore, a study is required to understand the relationship between LULC changes, demographic shifts, and water quality in the Hooghly River. Such a study would help in devising strategies to mitigate the adverse effects of LULC changes and demographic shifts on the water quality of the Hooghly River.
The significance of this study goes beyond the local region of the Hooghly River and has implications for an international standard. Water pollution caused by changes in LULC and demographic shifts is a global problem that affects water bodies worldwide. By understanding the relationship between LULC changes, demographic shifts, and water quality in the Hooghly River, the findings can be extrapolated to other regions facing similar challenges. This study can provide insights and solutions to other parts of the world that are dealing with similar issues related to water quality, making it a valuable contribution to the global scientific community. Moreover, the study can also help in formulating policies and guidelines to prevent and mitigate water pollution, which can have a far-reaching impact on improving the quality of life for people globally. Thus, this study has significant international significance as it can help in addressing the problem of water pollution caused by LULC changes and demographic shifts in various parts of the world.
An extensive literature survey from available sources indicates several past contributions in relevant study areas. Over-exploitation of natural resources due to rapid industrialization and other man-made activities, including improper waste disposal, has led to significant and progressive degradation of water quality throughout the river Hooghly [6]. The assessment of LULC and water quality in the study area has been conducted by numerous researchers through field-based analysis [7,8,9], theoretical and/or statistical modeling [10,11], and design and future prediction recommendations [12,13]. Similar studies for other Indian rivers are also evidenced [14,15]. Since the southern deltaic portion of the river Hooghly is located close to the Bay of Bengal, intrusion of saltwater is common and its occurrence alters the characteristics of sediment and riverbed materials [16,17,18,19,20,21,22]. Several studies have investigated the impact of land use and land cover (LULC) changes on hydrological responses and urban floods in Iraq. Mustafa et al. [23] analyzed extreme rainfall events and their effects on flash floods in the Erbil-Kurdistan region. Furthermore, Mustafa and Szydłowski [24] found that an increase in built-up areas and a decrease in agricultural land resulted in a significant increase in peak discharge and runoff volume in the same basin. Noori et al. [25] estimated rainfall distribution in the Duhok sub-basin using the IDW method and identified optimal parameters for spatial interpolation. Quraishi and Negm [26] reported that urban growth in the same basin led to larger surface runoff volumes in urban areas. These studies offer valuable insights into hydrological events in the region and can assist in the development of effective flood management strategies.
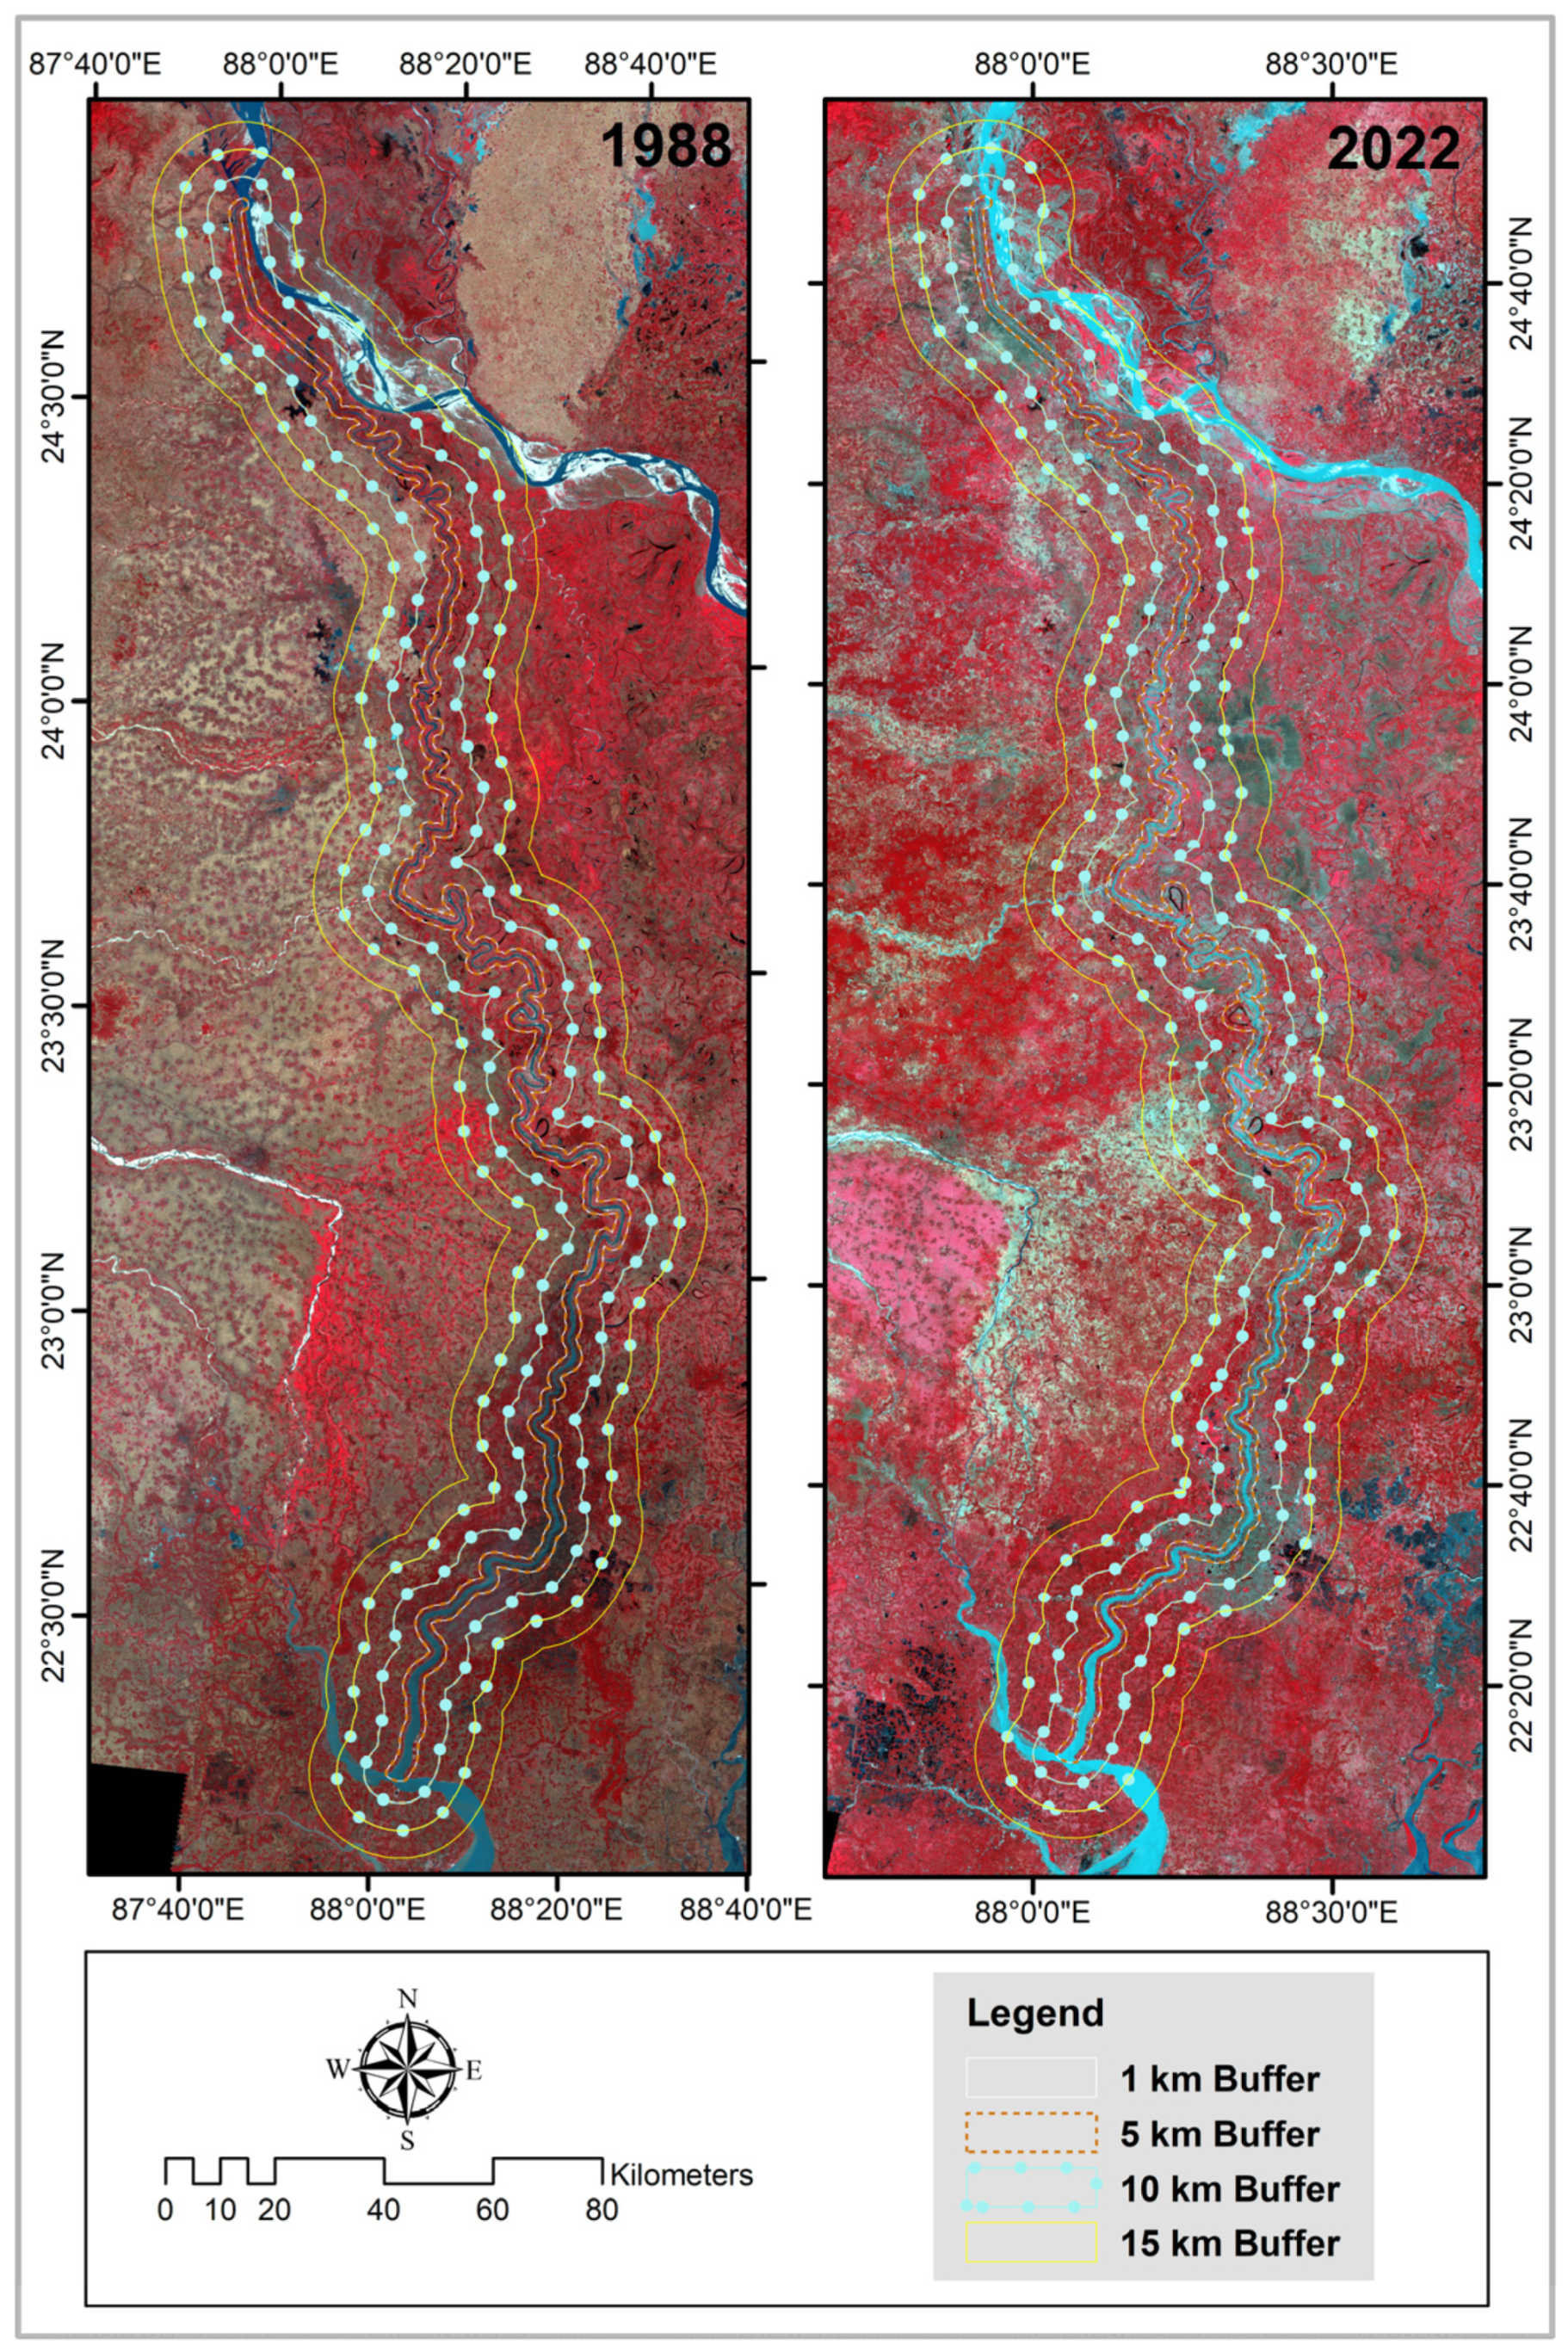
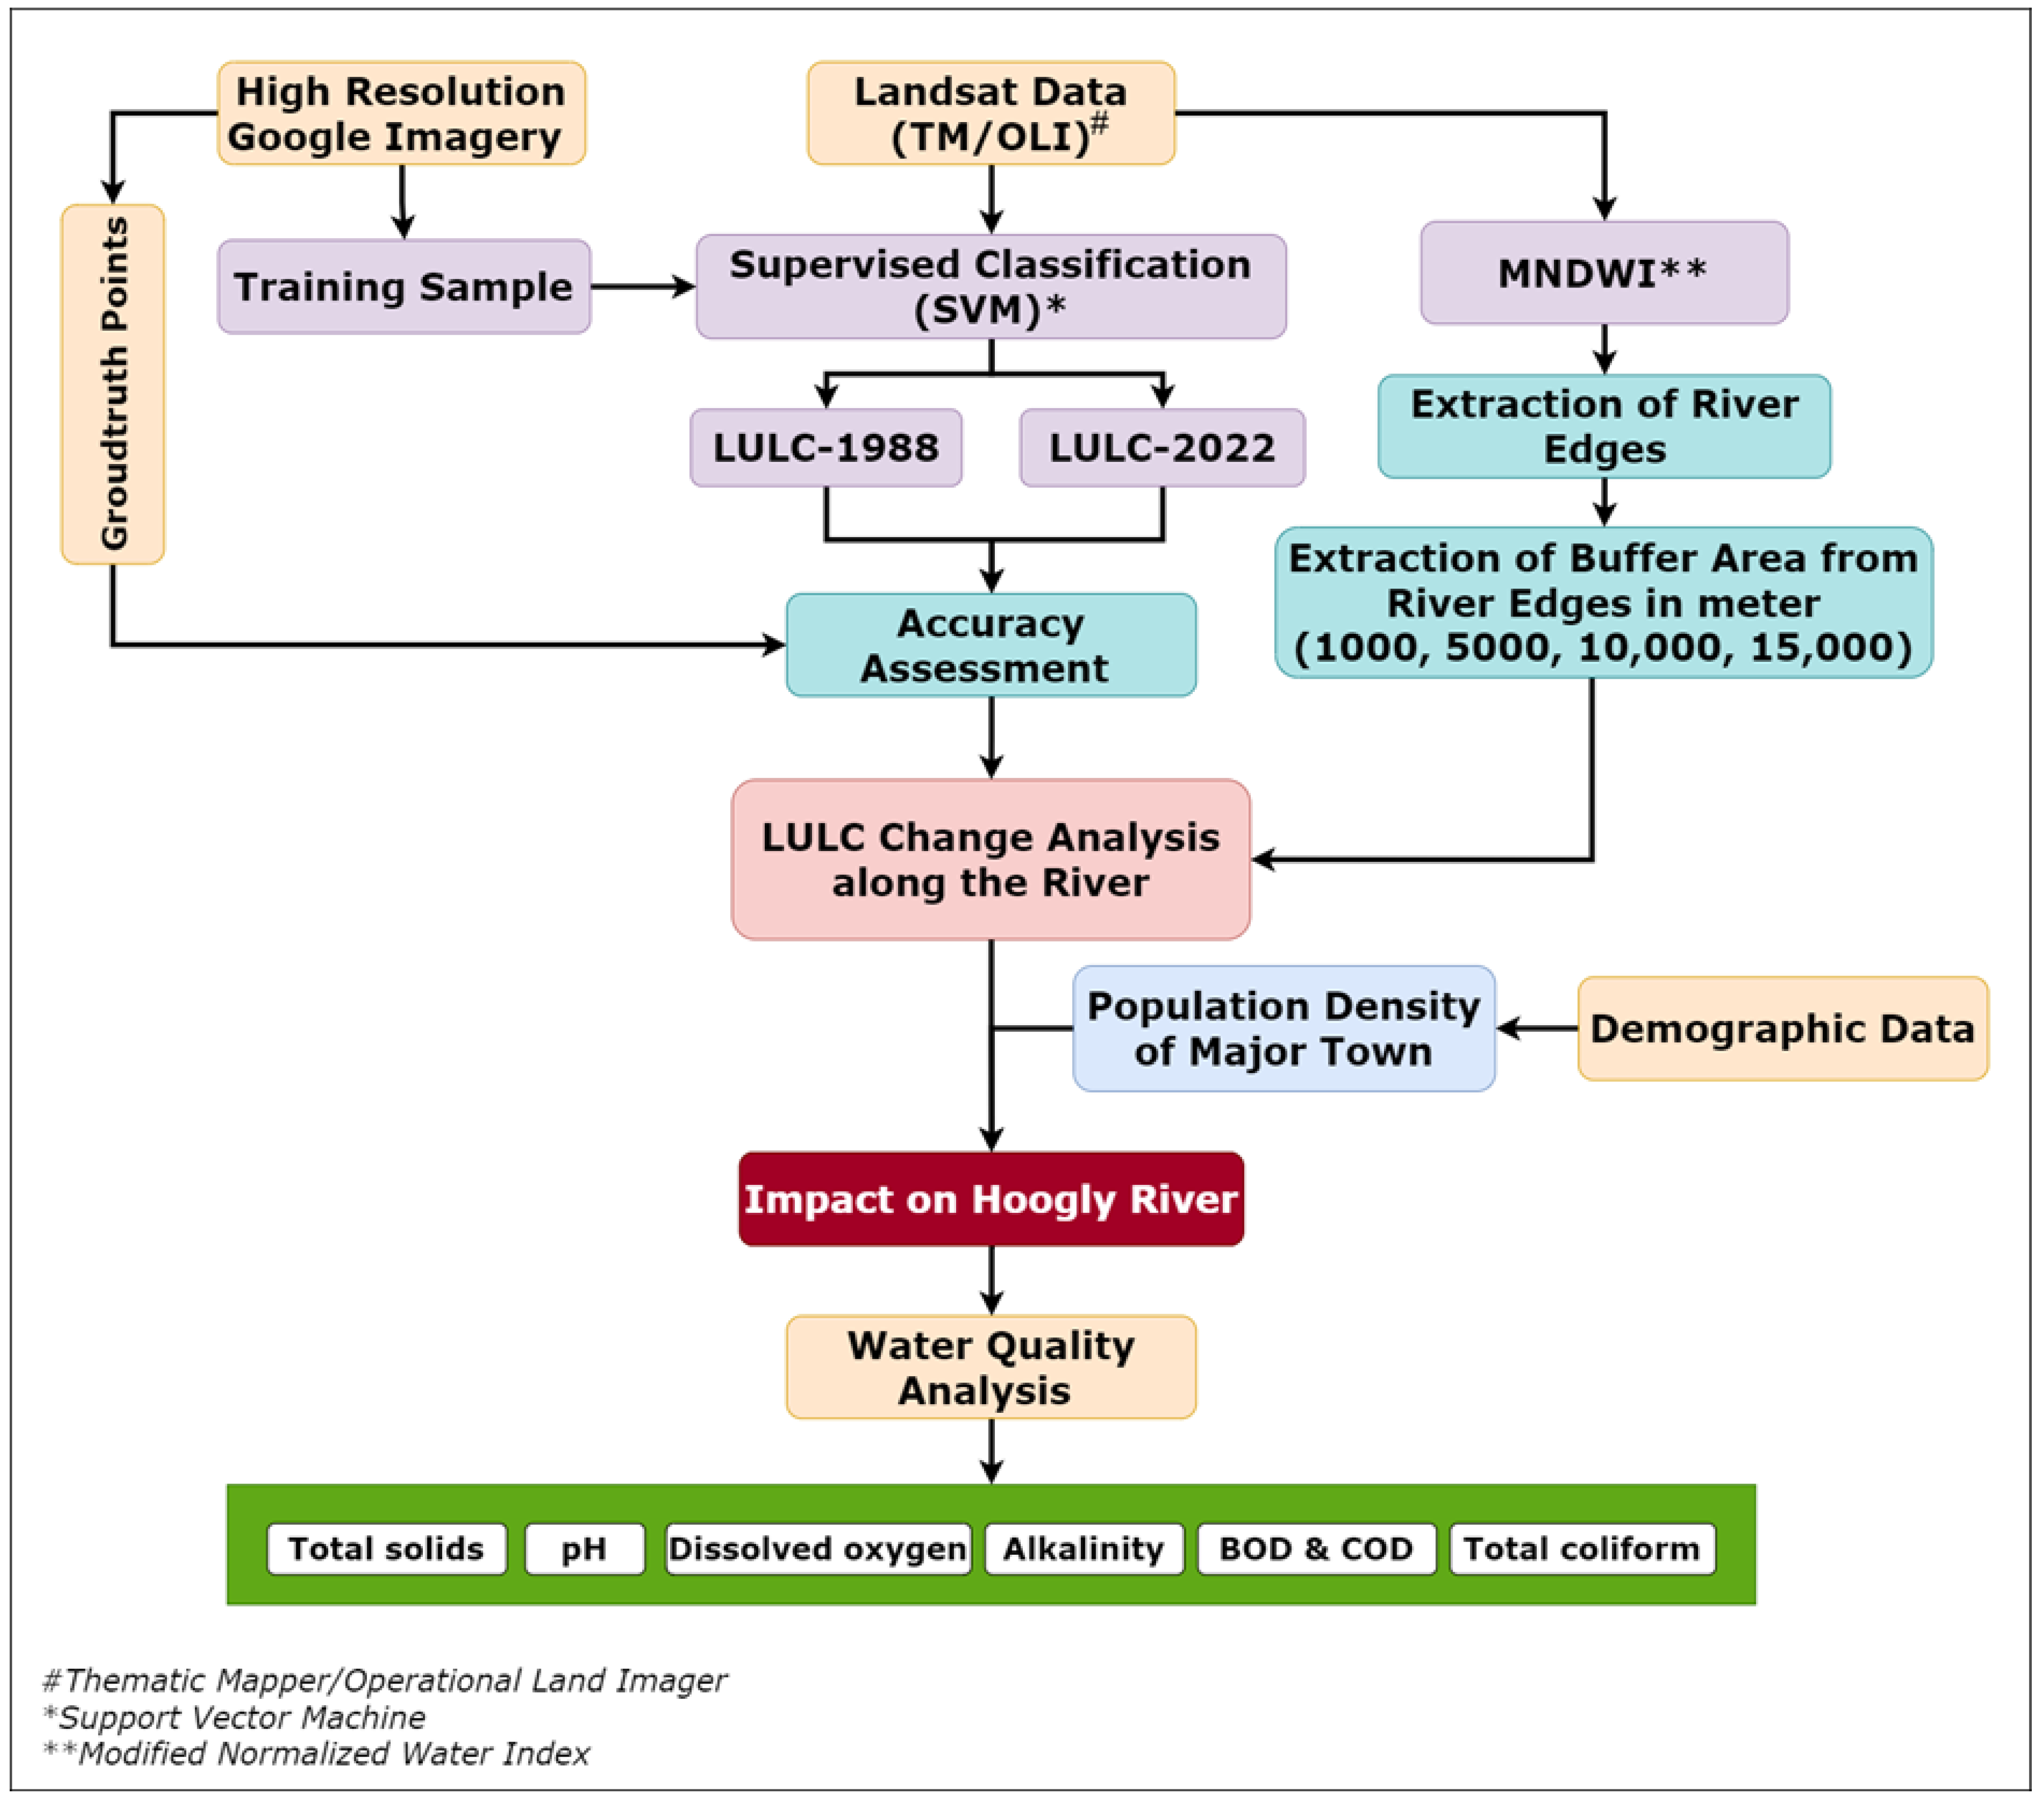
Despite the fact that extensive work has been undertaken in recent years on the water characteristics of the river Hooghly, as indicated by the literature review above, there is still plenty of scope for in-depth and precise systematic investigation. The current research aims to address the need for further investigation into the water characteristics of the Hooghly River by utilizing GIS and remote sensing techniques to observe changes in LULC, followed by a field-based assessment. Specifically, the research seeks to examine modifications in LULC along the river, analyze demographic alterations in the river’s vicinity, and evaluate water quality at designated sites. By achieving these objectives, the study aims to provide valuable insights into the impact of LULC and demography on water quality in the Hooghly River.

2. Materials and Method

2.1. Study Area

There are numerous rivers in India primarily classified as Himalayan, Deccan, and coastal from the viewpoint of origin [27,28]. The river Ganges is Himalayan, originating from the Gangotri Glacier in form of river Bhagirathi, which joins the river Alaknanda to initiate the river Ganges. Having a total length of 2725 km, the river flows through northern and eastern India towards the south and east directions through the provinces of Uttarakhand, Uttar Pradesh, Bihar, Jharkhand, and West Bengal. Half of the river flow is diverted through a tributary canal (Farakka) at the Murshidabad district in West Bengal to join the river Hooghly, while the remaining portion enters Bangladesh in the name of Padma [29]. The river Hooghly flows towards the deltaic regions of West Bengal and ultimately discharges to the Bay of Bengal [30]. The major cities located on the western and eastern banks of the river Hooghly are, respectively, Bandel, Chandannagar, Srirampur, Rishra, Uttarpara, Howrah, etc., and Barrackpur, Titagarh, Kamarhati, Agarpara, Baranagar, Kolkata, etc. Sketches portraying more details of the rivers Ganges and Hooghly are given in Figure 1.

2.2. Satellite Images Acquisition

In this study, Landsat-5 thematic mapper (TM) and Landsat-8 operational land imager (OLI) data were used to prepare the LULC layer. The study used two-time frames, 1988 and 2022, to analyze LULC changes. The dataset was obtained from the Google Earth Engine (GEE) platform. The Landsat TM and OLI data have a spatial resolution of 30 m and include visible, near-infrared (NIR), and short-wave infrared (SWIR) bands, which were primarily used to prepare the LULC. Further details about the dataset used are provided in Table 1.

2.3. Preparation of LULC

LULC map of the study area was prepared on the GEE cloud-based platform. GEE enables access to all the freely available satellite datasets, including Landsat-5 TM and Landsat-OLI. Collection 2, Level-2, and Tier 1 data were chosen since they were pre-processed with a good RMSE error (less than 12 m) with minimum cloud cover and converted to surface reflectance [31]. A total of five scenes were required to cover the study area. All five scenes were mosaiced to get a uniform dataset for an area and clipped with our area of interest (AOI). The clipped dataset was then used to prepare the LULC layer. The clipped mosaic of Landsat-5 TM and Landsat-8 OLI is shown in Figure 2. The supervised classification was performed with a machine learning classifier (support vector machine) in the GEE platform. The support vector machine (SVM) works on the principle of the hyperplane, which is generated by the support vectors, and it can classify the dataset based on that hyperplane [32,33]. SVM works well with non-linear problems such as the classification of satellite data [34]. It can project the dataset into the higher dimension to classify it more accurately with the help of a kernel [35]. In this study, radial basis function (RBF) was chosen for dimensionality enhancement. To make an accurate classification of satellite data, it is necessary to acquire a good-quality training sample. The training sample was prepared in the GEE platform itself with appropriate labels. The description of the LULC classes used in this study is given in Table 2.

2.4. Accuracy Assessment of LULC

Validation of the LULC was carried out by performing an accuracy assessment using a cross-tabulation matrix [36]. To generate the cross-tabulation matrix and perform an accuracy assessment, the collection of ground truth points was required. The ground truth points were collected from the partial field survey, high-resolution Google Earth images, and FCC Landsat data. The total geographical area for which the LULC was prepared was 11,756.07 sq. km, and 480 ground truth points were selected for the specified area to carry out the accuracy assessment of LULC. The number of ground truth points required for the assessment was calculated using the formula mentioned in Equation (1) [37]. User’s accuracy, producer’s accuracy, overall accuracy, and kappa coefficient were calculated to observe the accuracy.
N = Z 2 ( p ) ( q ) E 2
where p is the expected percentage accuracy, set at 95%; q is the complement of p, which is equal to (100 − p). The allowable error is denoted by E, with a value of 0.05. Z represents the standard normal deviation for the 95% two-sided confidence level, which is 1.96. Based on these values, the required sample size was calculated to be 475, which was then rounded up to 480.

2.5. Extraction of River Edges

River edges are defined by the left and right banks of the river. The river edges were required to generate the buffer zone from the river, which is extracted from the Landsat-5 Tm dataset of 1988 with the help of the modified normalized difference water index (MNDWI). MNDWI was introduced by Xu [38] and it can effectively be used for the extraction of water features. The formula of MNDWI is given in Equation (2).
MNDWI = (Green − SWIR)/(Green + SWIR)

2.6. Buffer Zones of the River

The extracted river edges were converted into polygons within the ArcGIS environment. In this study, four buffer zones were considered to investigate the change in LULC patterns, such as 1 km, 5 km, 10 km, and 15 km. Buffer zones were considered from the river edges of 1988 and the same buffer zones were considered for 2022. These different buffer zones were used to calculate the LULC changes for both time frames.

2.7. Sampling and Analyses

Collecting water samples from a river is a crucial step in testing the quality of water. To ensure accurate results, water samples were collected following the guidelines provided by ASTM [39]. The sampling locations were chosen based on a preliminary analysis of land use and land cover (LULC) changes to identify areas at a high risk of having poor water quality in and around Kolkata and nearby areas. Six locations were strategically chosen to capture any variations in water quality parameters along the stretch of the River Hooghly (Table 3). Sampling was conducted on a bright, sunny day, and important information, including the date, was carefully noted for accuracy. The grab sampling method was employed to collect all samples from the river water surface near the center of the river cross-section, using a boat. Each 100 L sample was collected in clean containers that were thoroughly rinsed several times with water from the sampling location to ensure uncontaminated samples. The samples were then carefully stored in a cool and dry place to maintain their integrity during transport to the environmental laboratory of Elitte College of Engineering, Sodepur, Kolkata, India for testing. A total of seven parameters were tested, including pH, TDS, alkalinity, dissolved oxygen, BOD, COD, and total coliform. The test parameters and their specifications are presented in Table 4. For comparison of present water quality with past water quality, datasets from 2000 and 2008 were acquired from the central pollution control board [40].

2.8. Adopted Methodology

To achieve this goal, a detailed methodology was developed, which is presented in the flowchart diagram in Figure 3. The specific study area is depicted in Figure 3. Water samples were collected from the designated locations and subjected to laboratory testing to determine various parameters, as outlined in Table 1 and Table 2. By examining the results of these tests, we can gain a better understanding of the relationship between LULC, demography, and water quality in the Hooghly River.

3. Results and Discussion

3.1. Land Use and Land Cover of Buffer Zones of Hoogly River

LULC of different buffer zones (1 km, 5 km, 10 km, and 15 km) were prepared using the SVM classifier. Four LULC classes were considered for preparing LULC of the study area, i.e., Waterbody, Built-up, Tree cover, and Agriculture. The accuracy assessment of the LULC layers are presented in Table 5 and Table 6. The overall accuracy of 1988 and 2022 was estimated as 91% and 92%, with a kappa coefficient of 0.85 and 0.87, respectively.

3.2. LULC Change Analysis

The area near Hoogly River is dominated by agricultural activities since earlier days. It can be seen in the 1988 dataset that agricultural land occupied 56.7% of the total area (11,324 km2) from river edges to 15 km buffer area and it increased to 67% of the area (13,360.1 km2) in 2022. On the other hand, the built-up area of the study region also increased (almost doubled) in the timeframe from 1988 to 2022. It was observed that the built-up area occupied 7.7% of the area in 1988, which increased by 14.6% in 2022. The drastic increment in these LULC classes (Agriculture and Built-up) impacted largely upon tree cover and water bodies. It was estimated that the tree cover area and waterbody were decreased by a significant amount. The LULC map generated using GEE of the study area for 1988 and 2022 is shown in Figure 4.
LULC area under different buffer zones for both the time frames (1988 and 2022) are plotted with a line graph and presented in Figure 5. It can be observed that the agriculture and built-up area increase in all the buffer zones from 1988 to 2022, whereas tree cover and waterbody decrease in all the buffer zones within the specified time frame. The increase in built-up area with a decrease in wetland and tree cover results in the generation of more sewage and overland flow, which may degrade surface water quality by carrying harmful chemicals into the river. Further, an increase in agricultural activity to satisfy the supply of food demand of the increasing population may also increase chemical discharge into the surface water. Moreover, it is also observed that the buffer zone of 10 to 15 km is facing more disturbances due to an increase in built-up and agriculture activity by reducing the tree cover and water bodies.

3.3. Population Density

Population density can have a significant impact on LULC, eventually influencing the water quality of locations, particularly in areas where water resources are limited. An increase in population density leads to an increase in water pollution. This can originate from industrial and agricultural activities, as well as human waste and litter [47]. Secondly, an increase in population density also leads to the overuse of water resources, eventually dropping the water levels and affecting the quality of the remaining water [48]. Further, there is a greater need for sewage and wastewater treatment facilities with increasing population density. If these facilities are not properly maintained or are overloaded, they can release untreated or partially treated wastewater into nearby water sources [49]. Lastly, an increase in population density results in habitat loss, disturbance of biodiversity, and ecological imbalance, leading to various forms of pollution that can harm the quality of water. Therefore, it is important to carefully manage and monitor water resources in densely populated areas to ensure that water quality remains high and that aquatic ecosystems and human health are not put at risk [50]. In the study area, the population density of selected localities were found to be exponentially increasing (Figure 6), threatening the environment. The results validate the LULC change analysis. Moreover, the water quality of the river passing through these locations was also found to be deteriorating.

3.4. Water Quality Assessment

The results of the assessment indicate that the pH and alkalinity of the water at Garden Reach in 2022 are the highest among the six locations studied (Figure 7 and Figure 8). Furthermore, both parameters have been observed to increase over time. This increase could be attributed to agricultural activities such as irrigation and the use of fertilizers, which lead to a rise in the concentration of dissolved salts in surface water bodies, subsequently causing an increase in pH and alkalinity [51]. Figure 9 shows a drastic increase in TDS for the year 2022 when compared to 2000 and 2008. Serampore has one of the most densely populated areas, with a sharp increase in built-up areas and a decrease in tree covers and wetlands, this can be one of the prime reasons for showing the highest TDS in the sampling location. Further, Dakshineshwar and Uluberia also have a significant rise in TDS levels compared to the past time frame. The variation of dissolved oxygen is not significant in the localities, as shown in Figure 10.
BOD is directly correlated with changes in LULC as well as population. Dakshineshwar, Shibpur, and Uluberia show a significant level of BOD (Figure 11), resulting from an increase in overland flow from stormwater due to an increase in the imperviousness of the locality, whereas Serampore shows a significant level of COD (Figure 12), which can lead to a matter of concern in the future. This may relate to the presence of an industrial area upstream of Serampore. Total coliform is also an important indicator of water quality parameters. In this study, it is found that the Shibpur and Serampur have high levels of Total coliform, which sharply increased in 2022 when compared with the past (Figure 13). The increase in total coliform can result from an increase in population that leads to an increase in settlements, which influences the overland flow into the river.
In summary, it is observed that LULC and an increase in population can have significant impacts on the flow of surface water and its quality, depending on the specific changes and the natural processes involved.

4. Conclusions

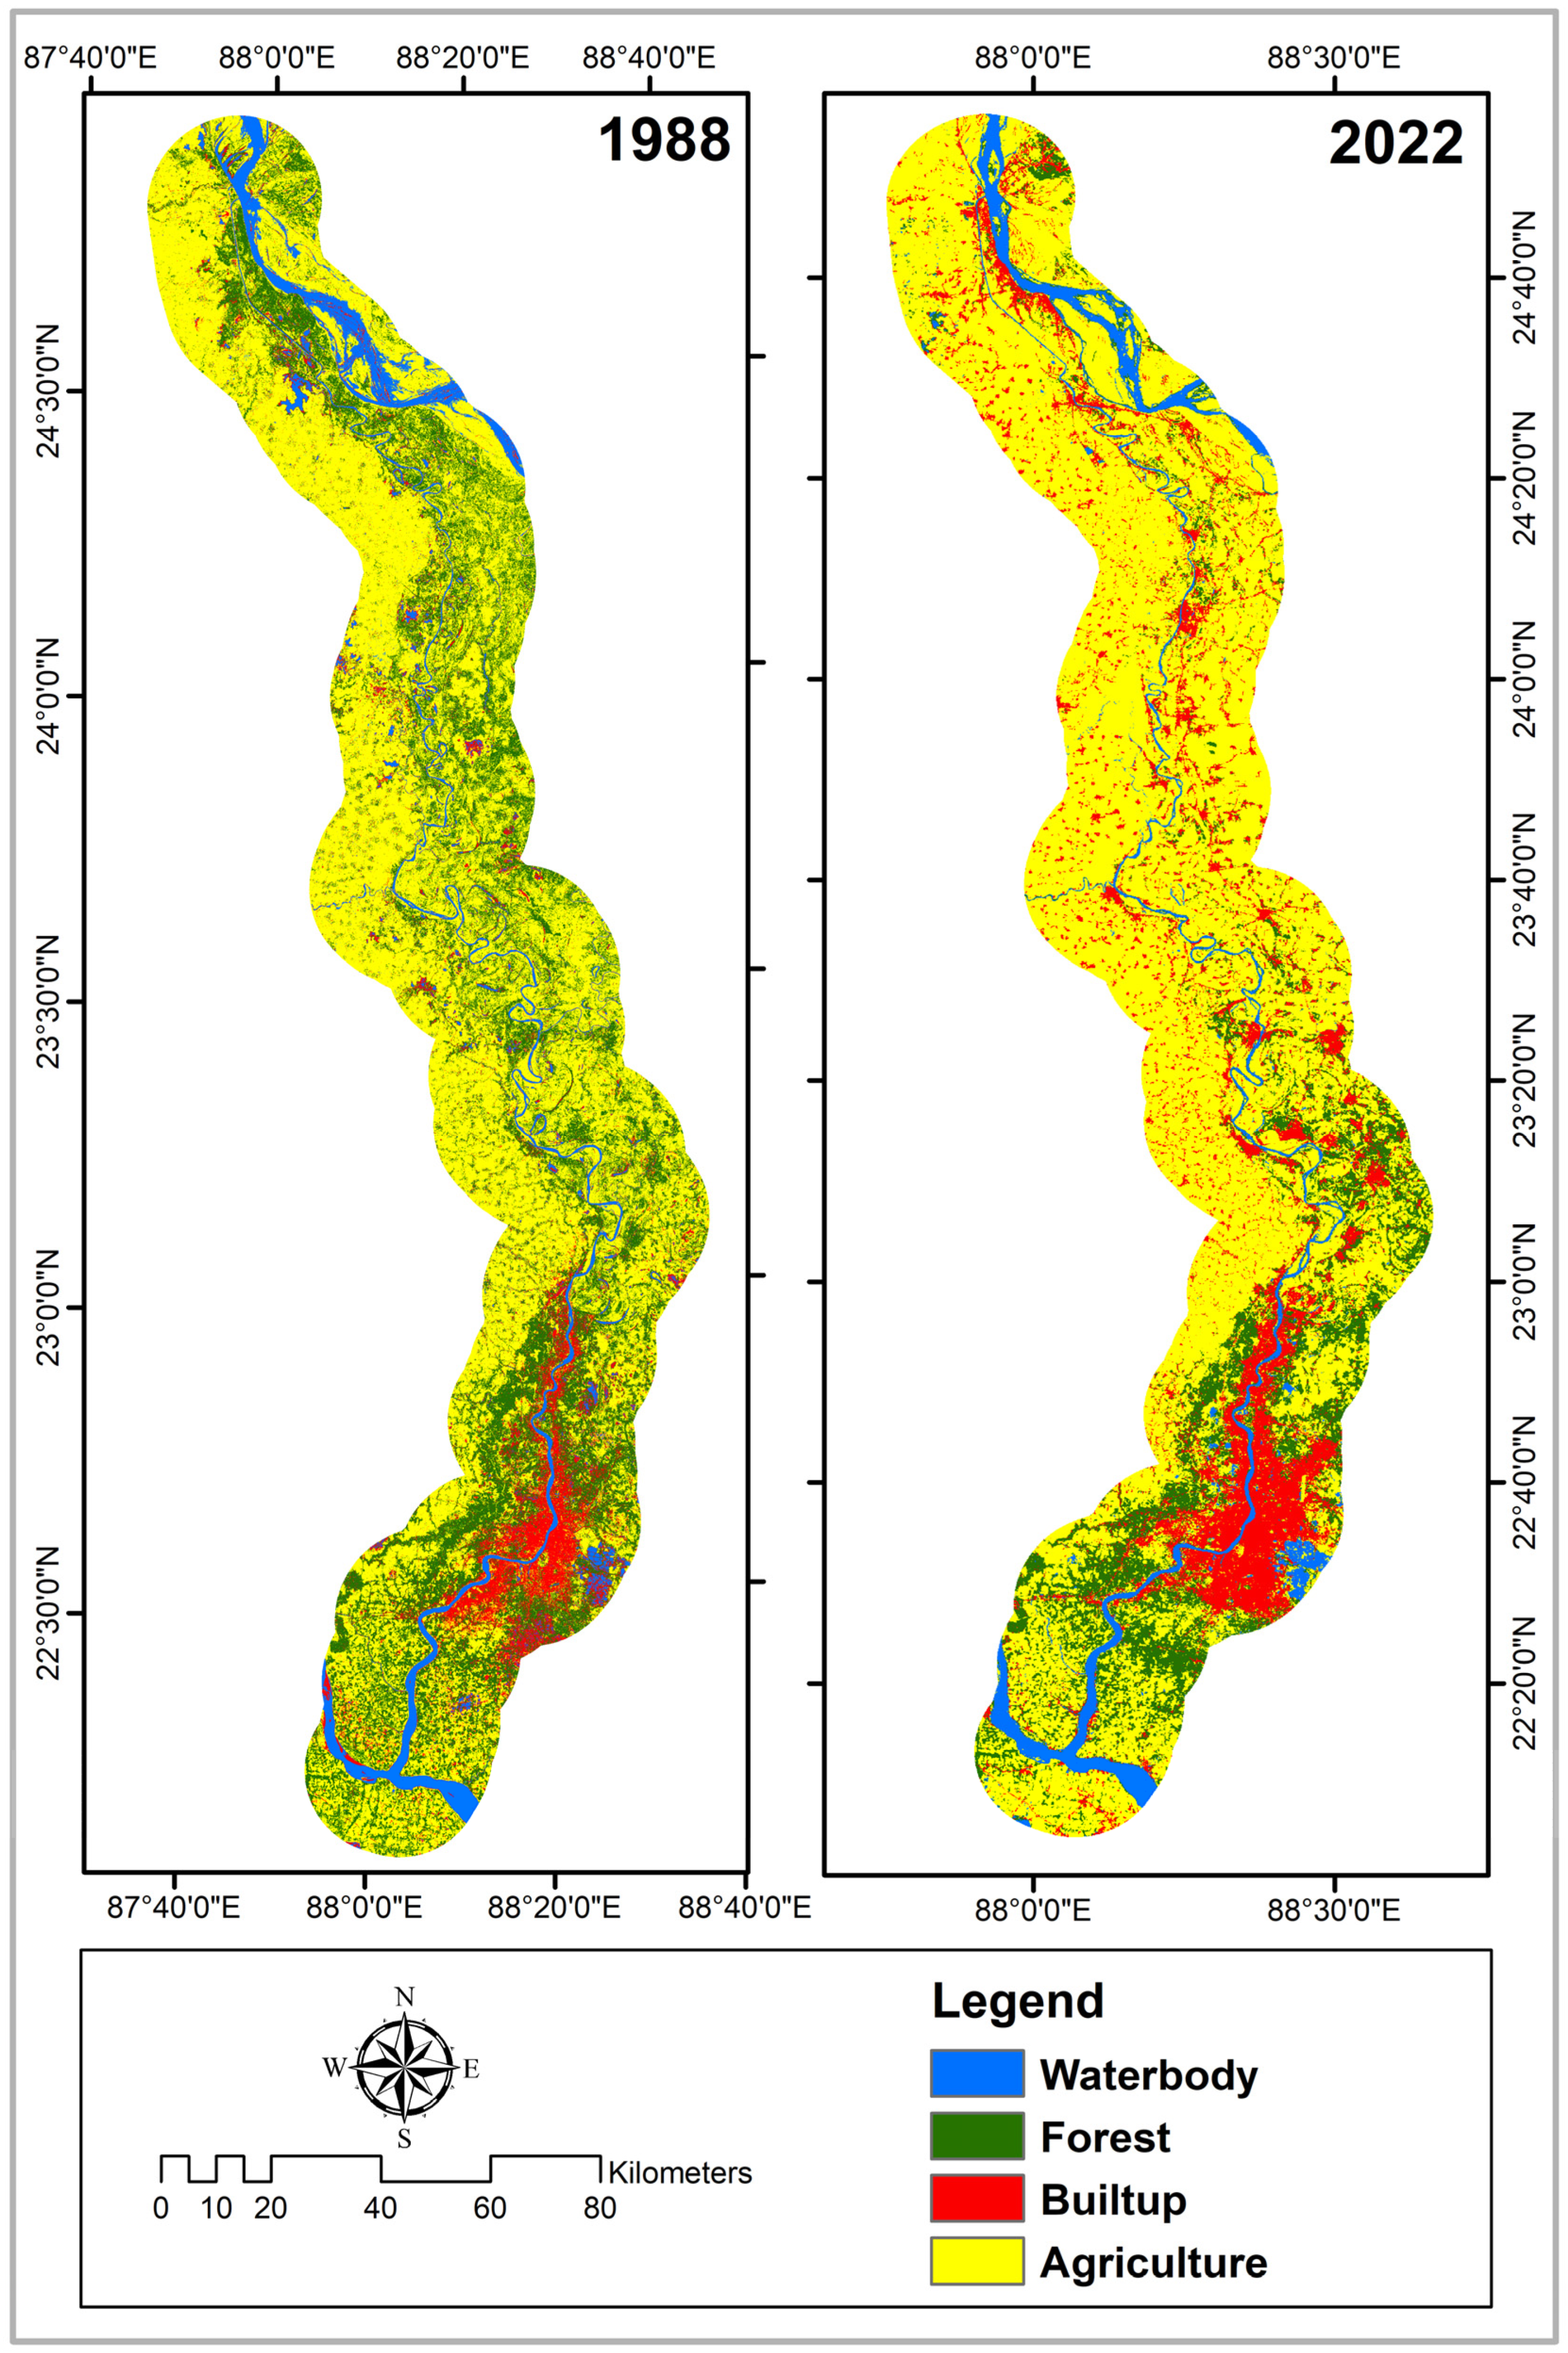
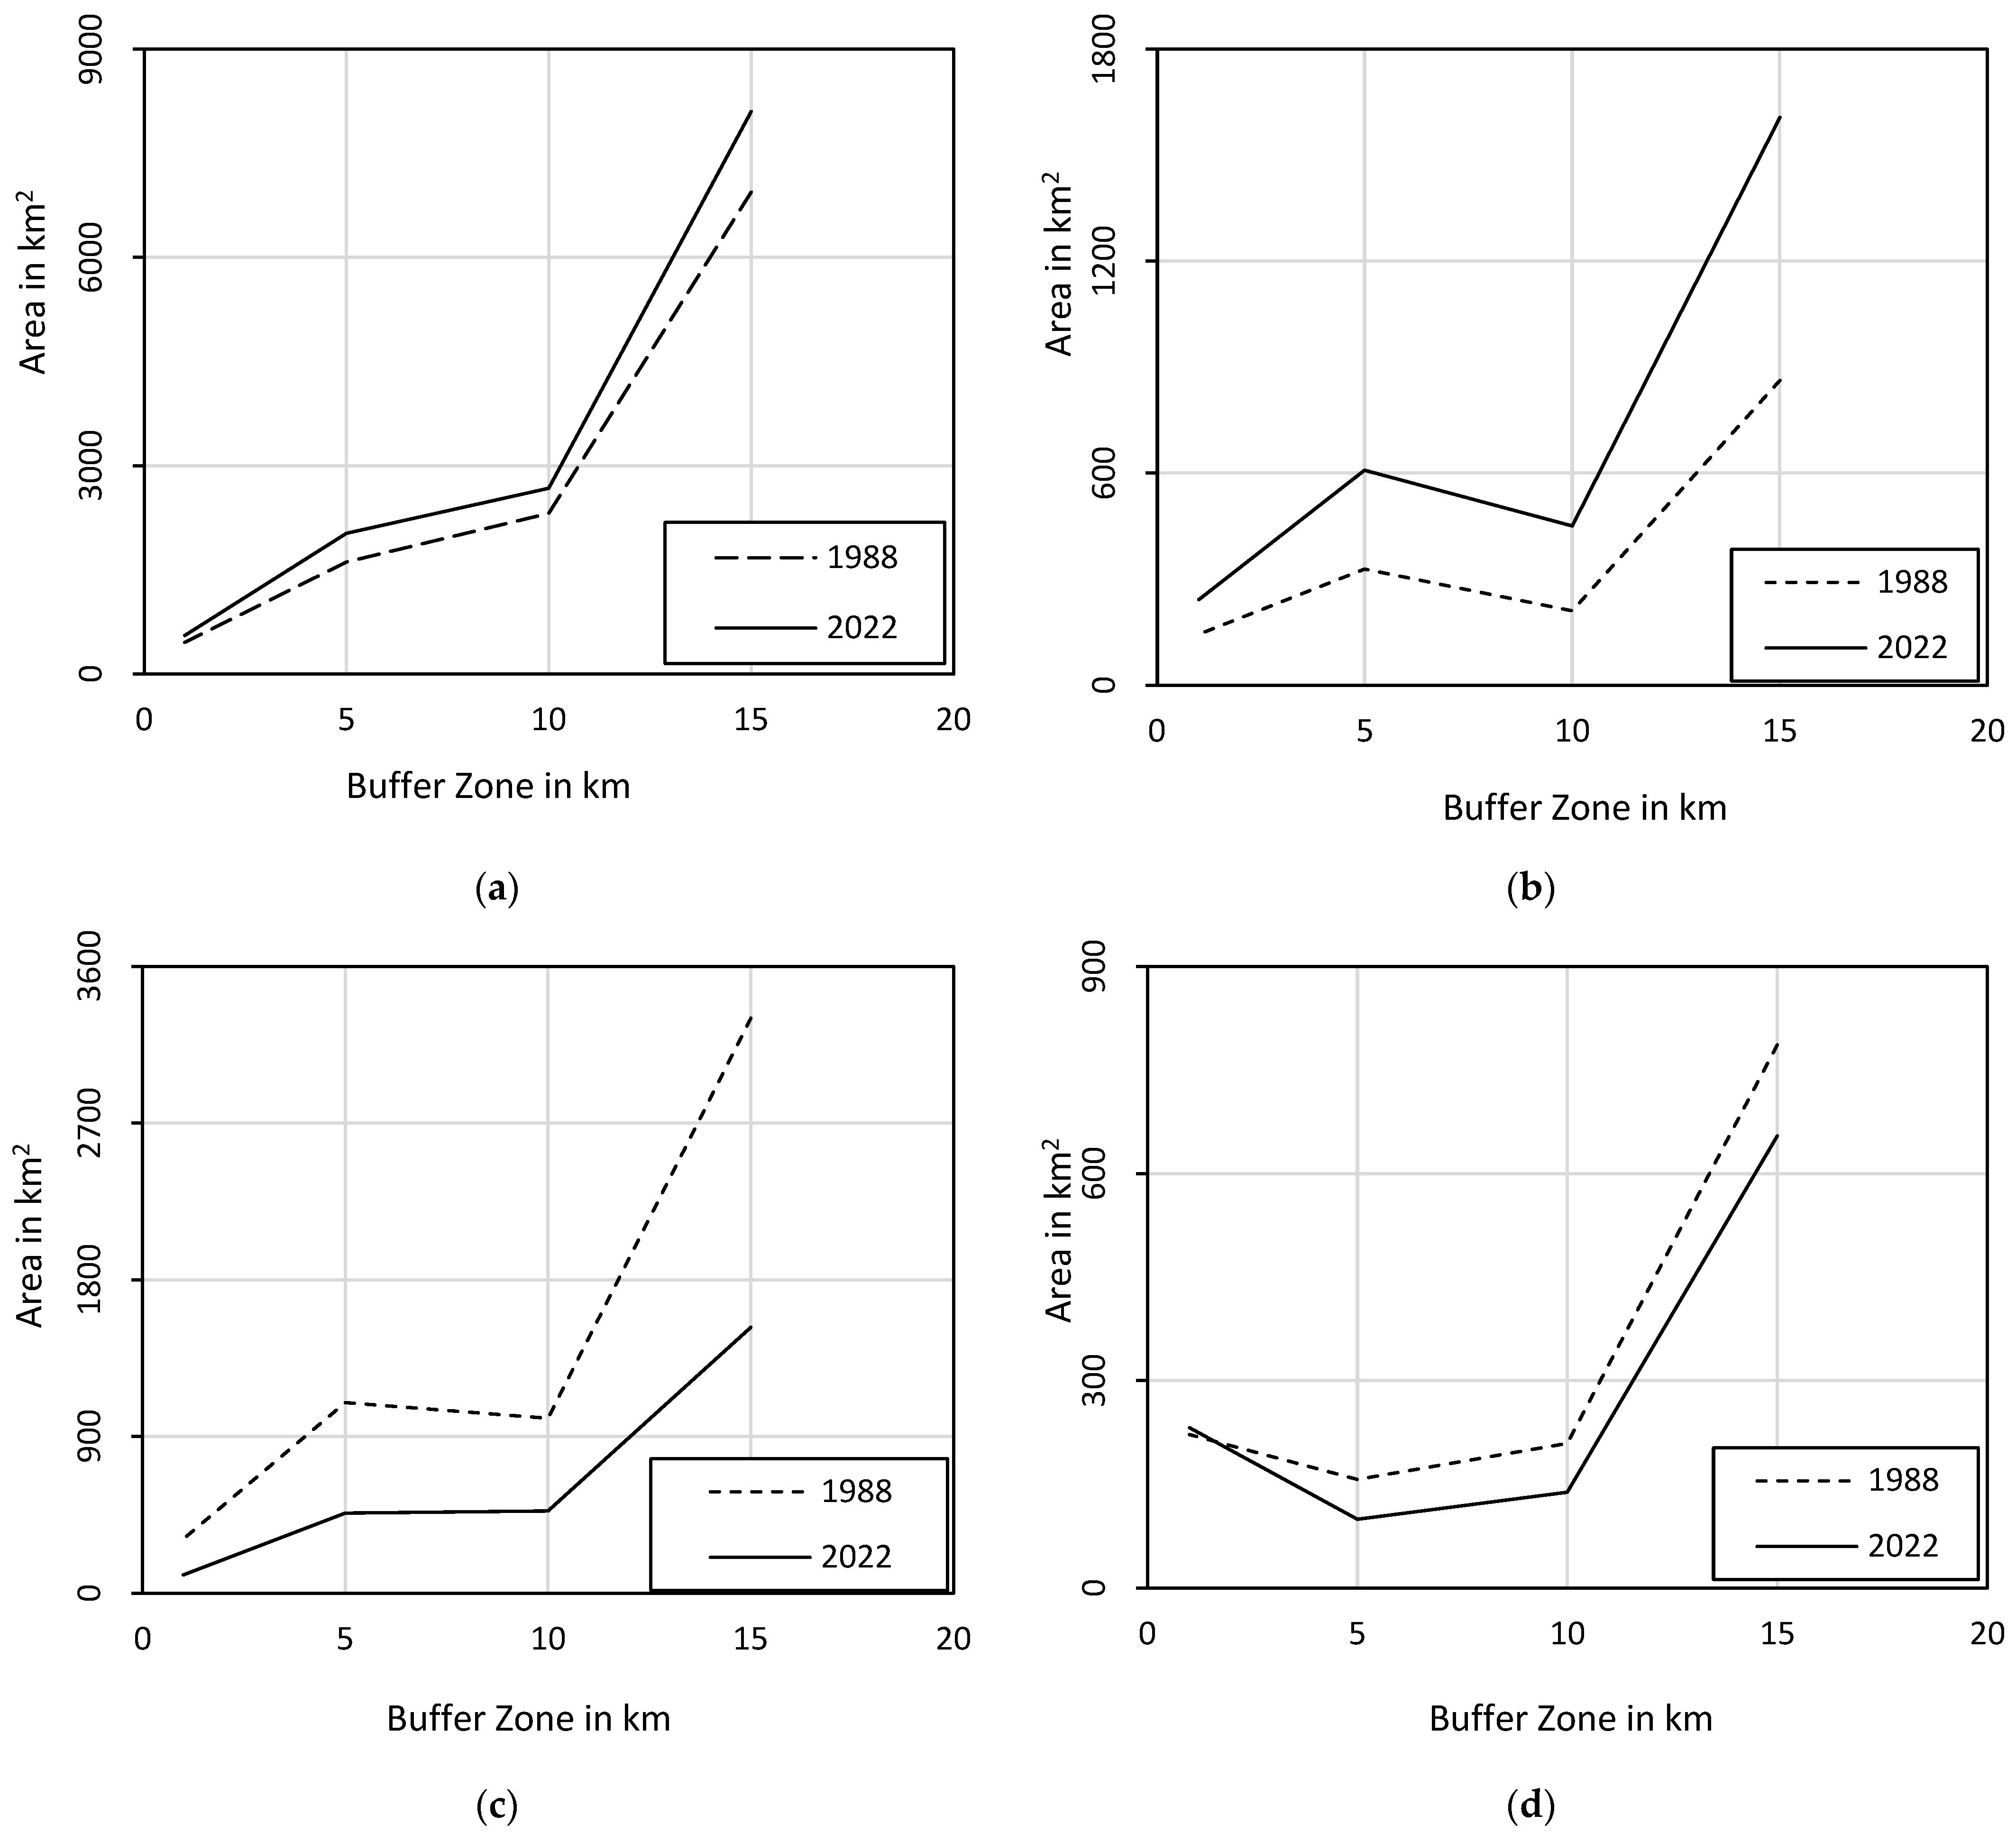
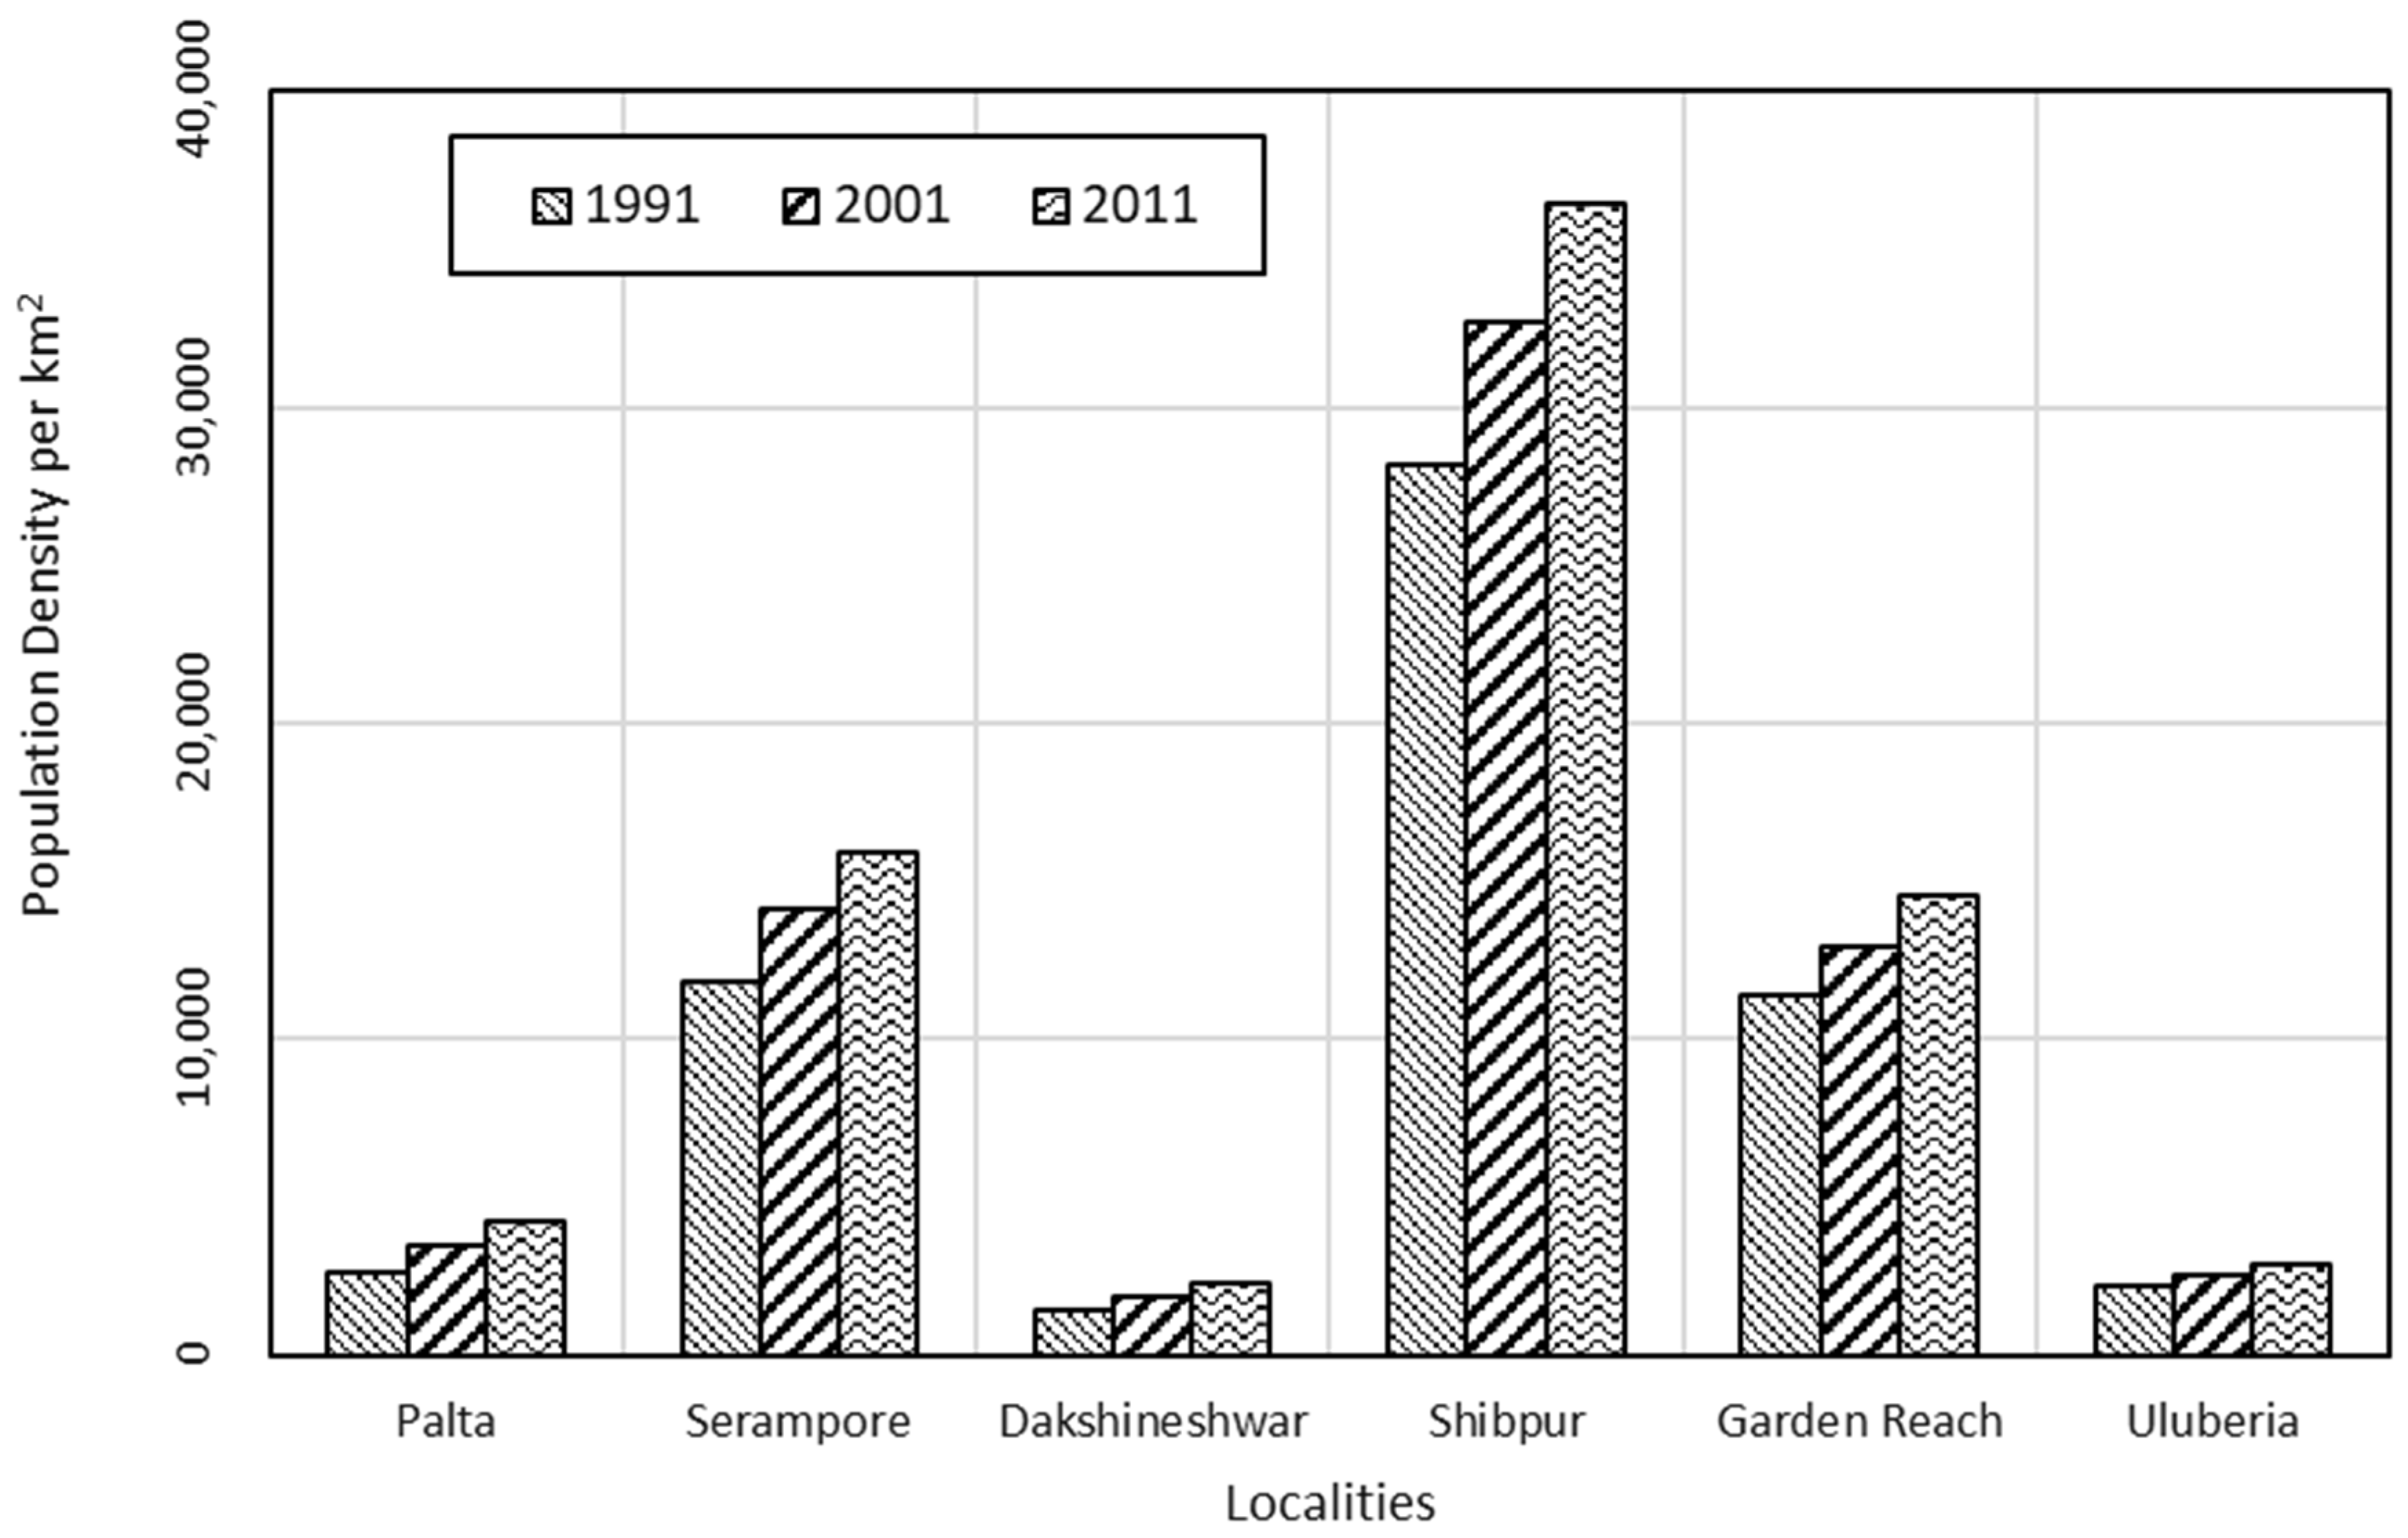
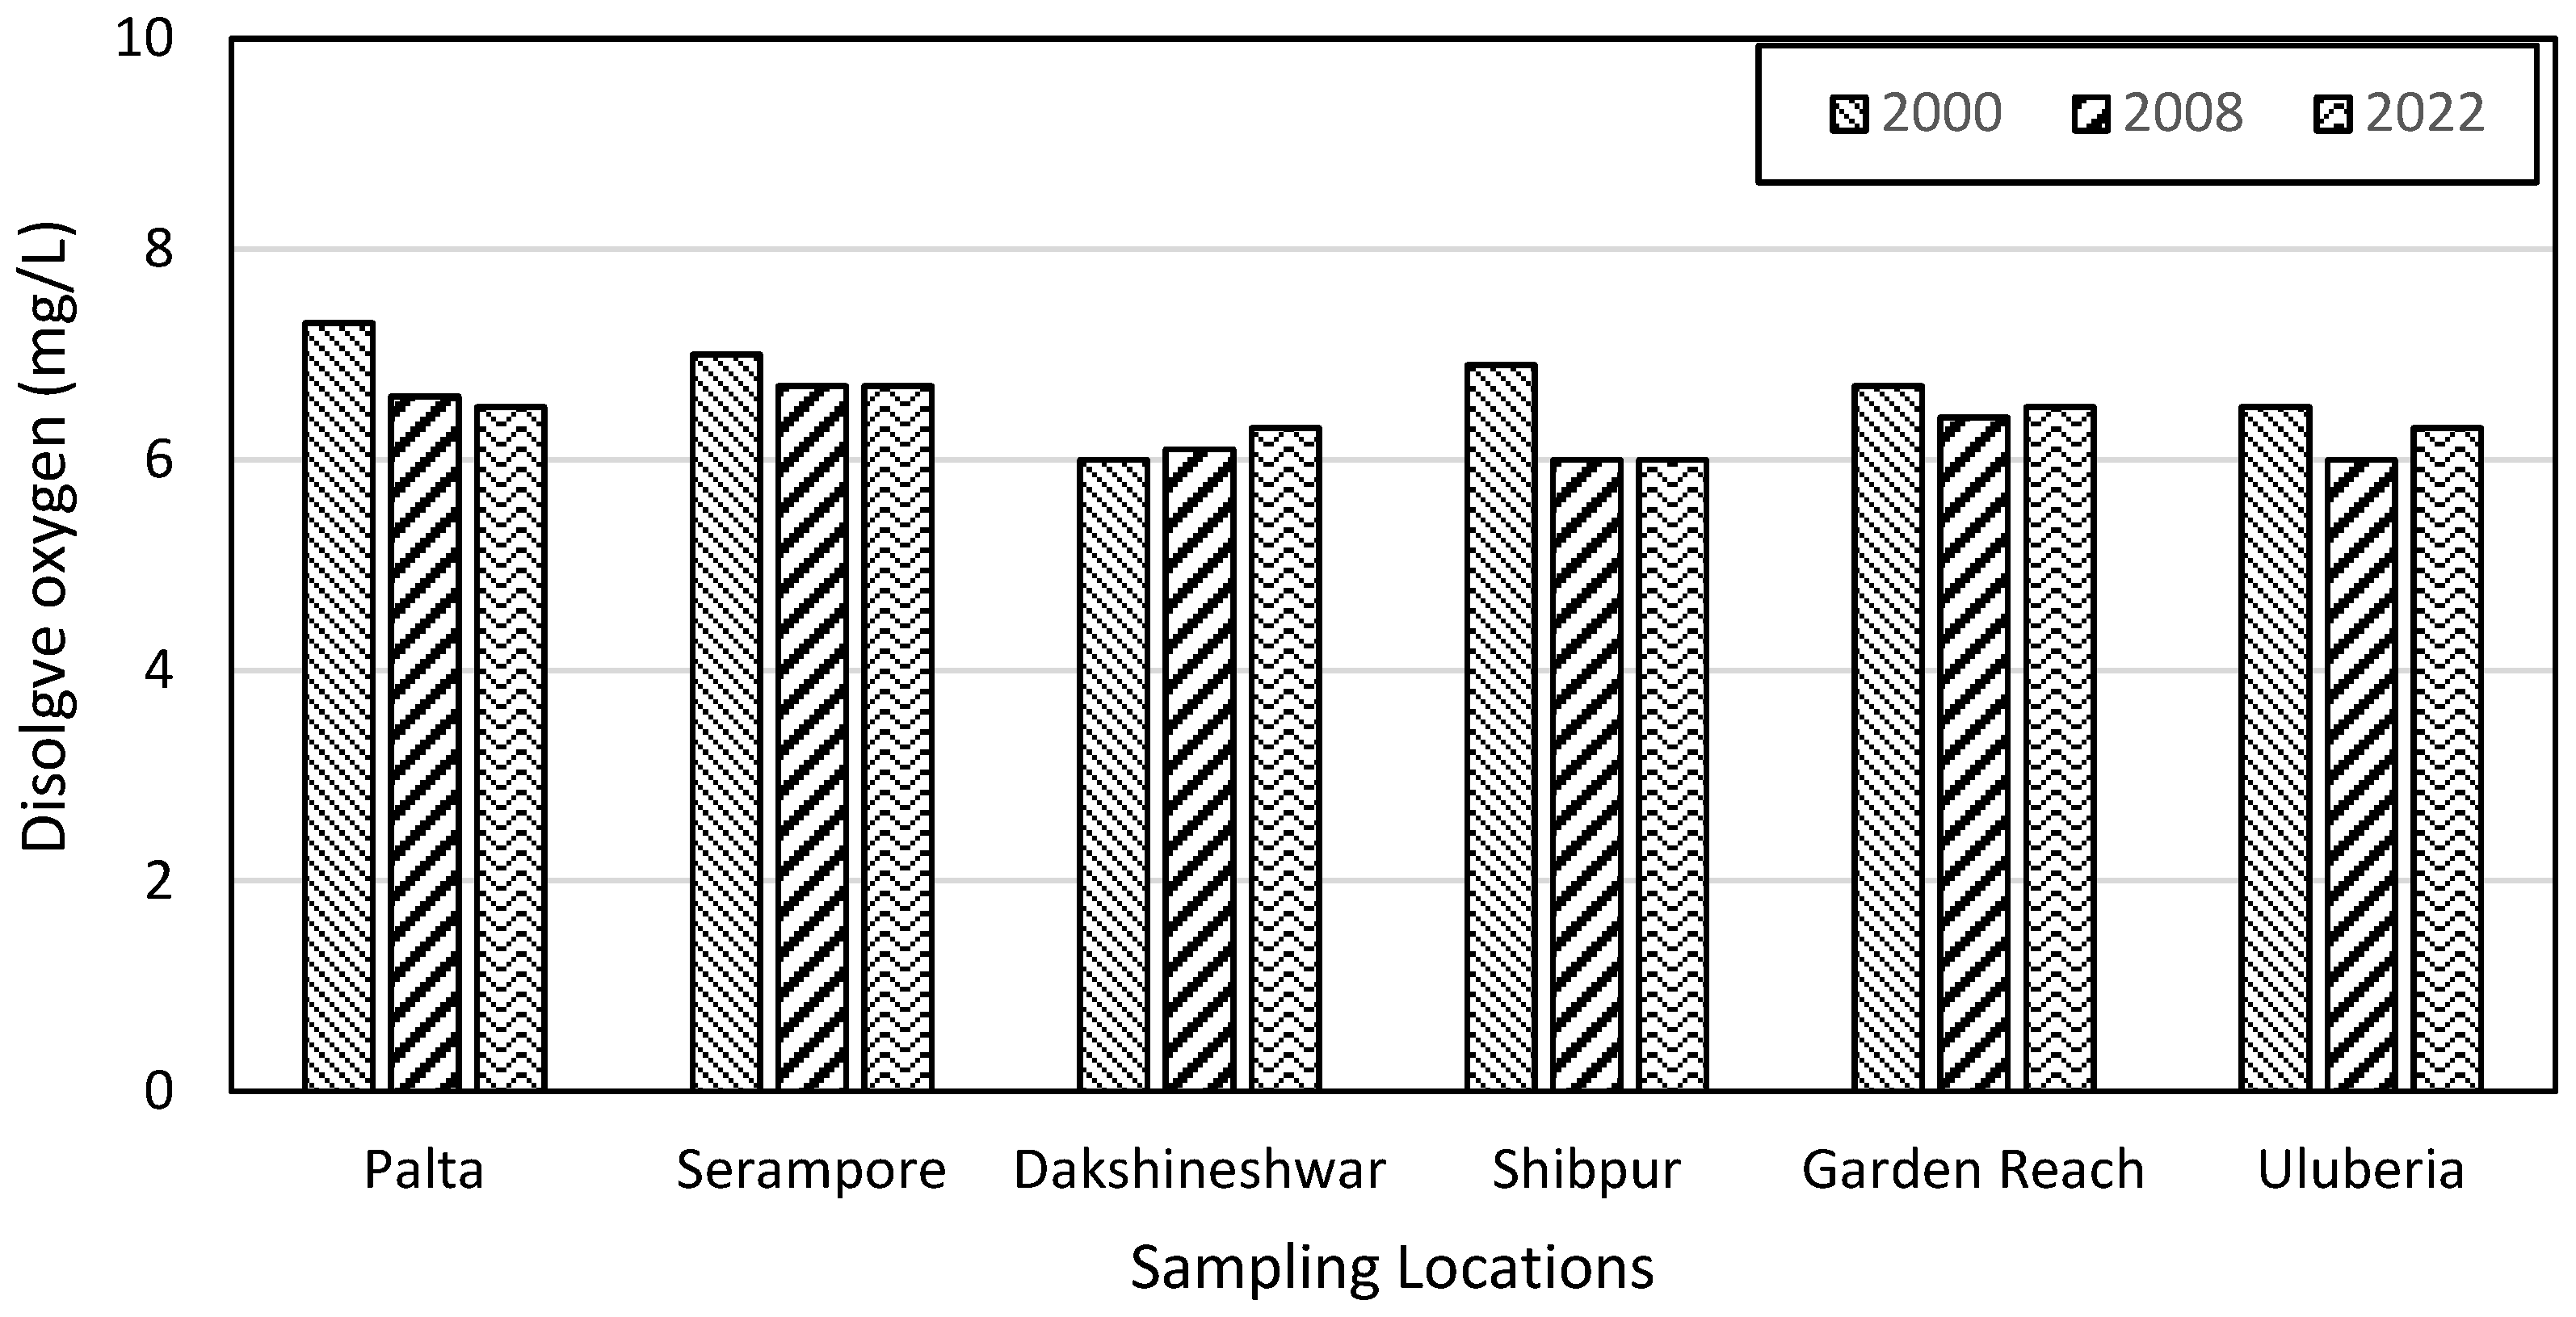
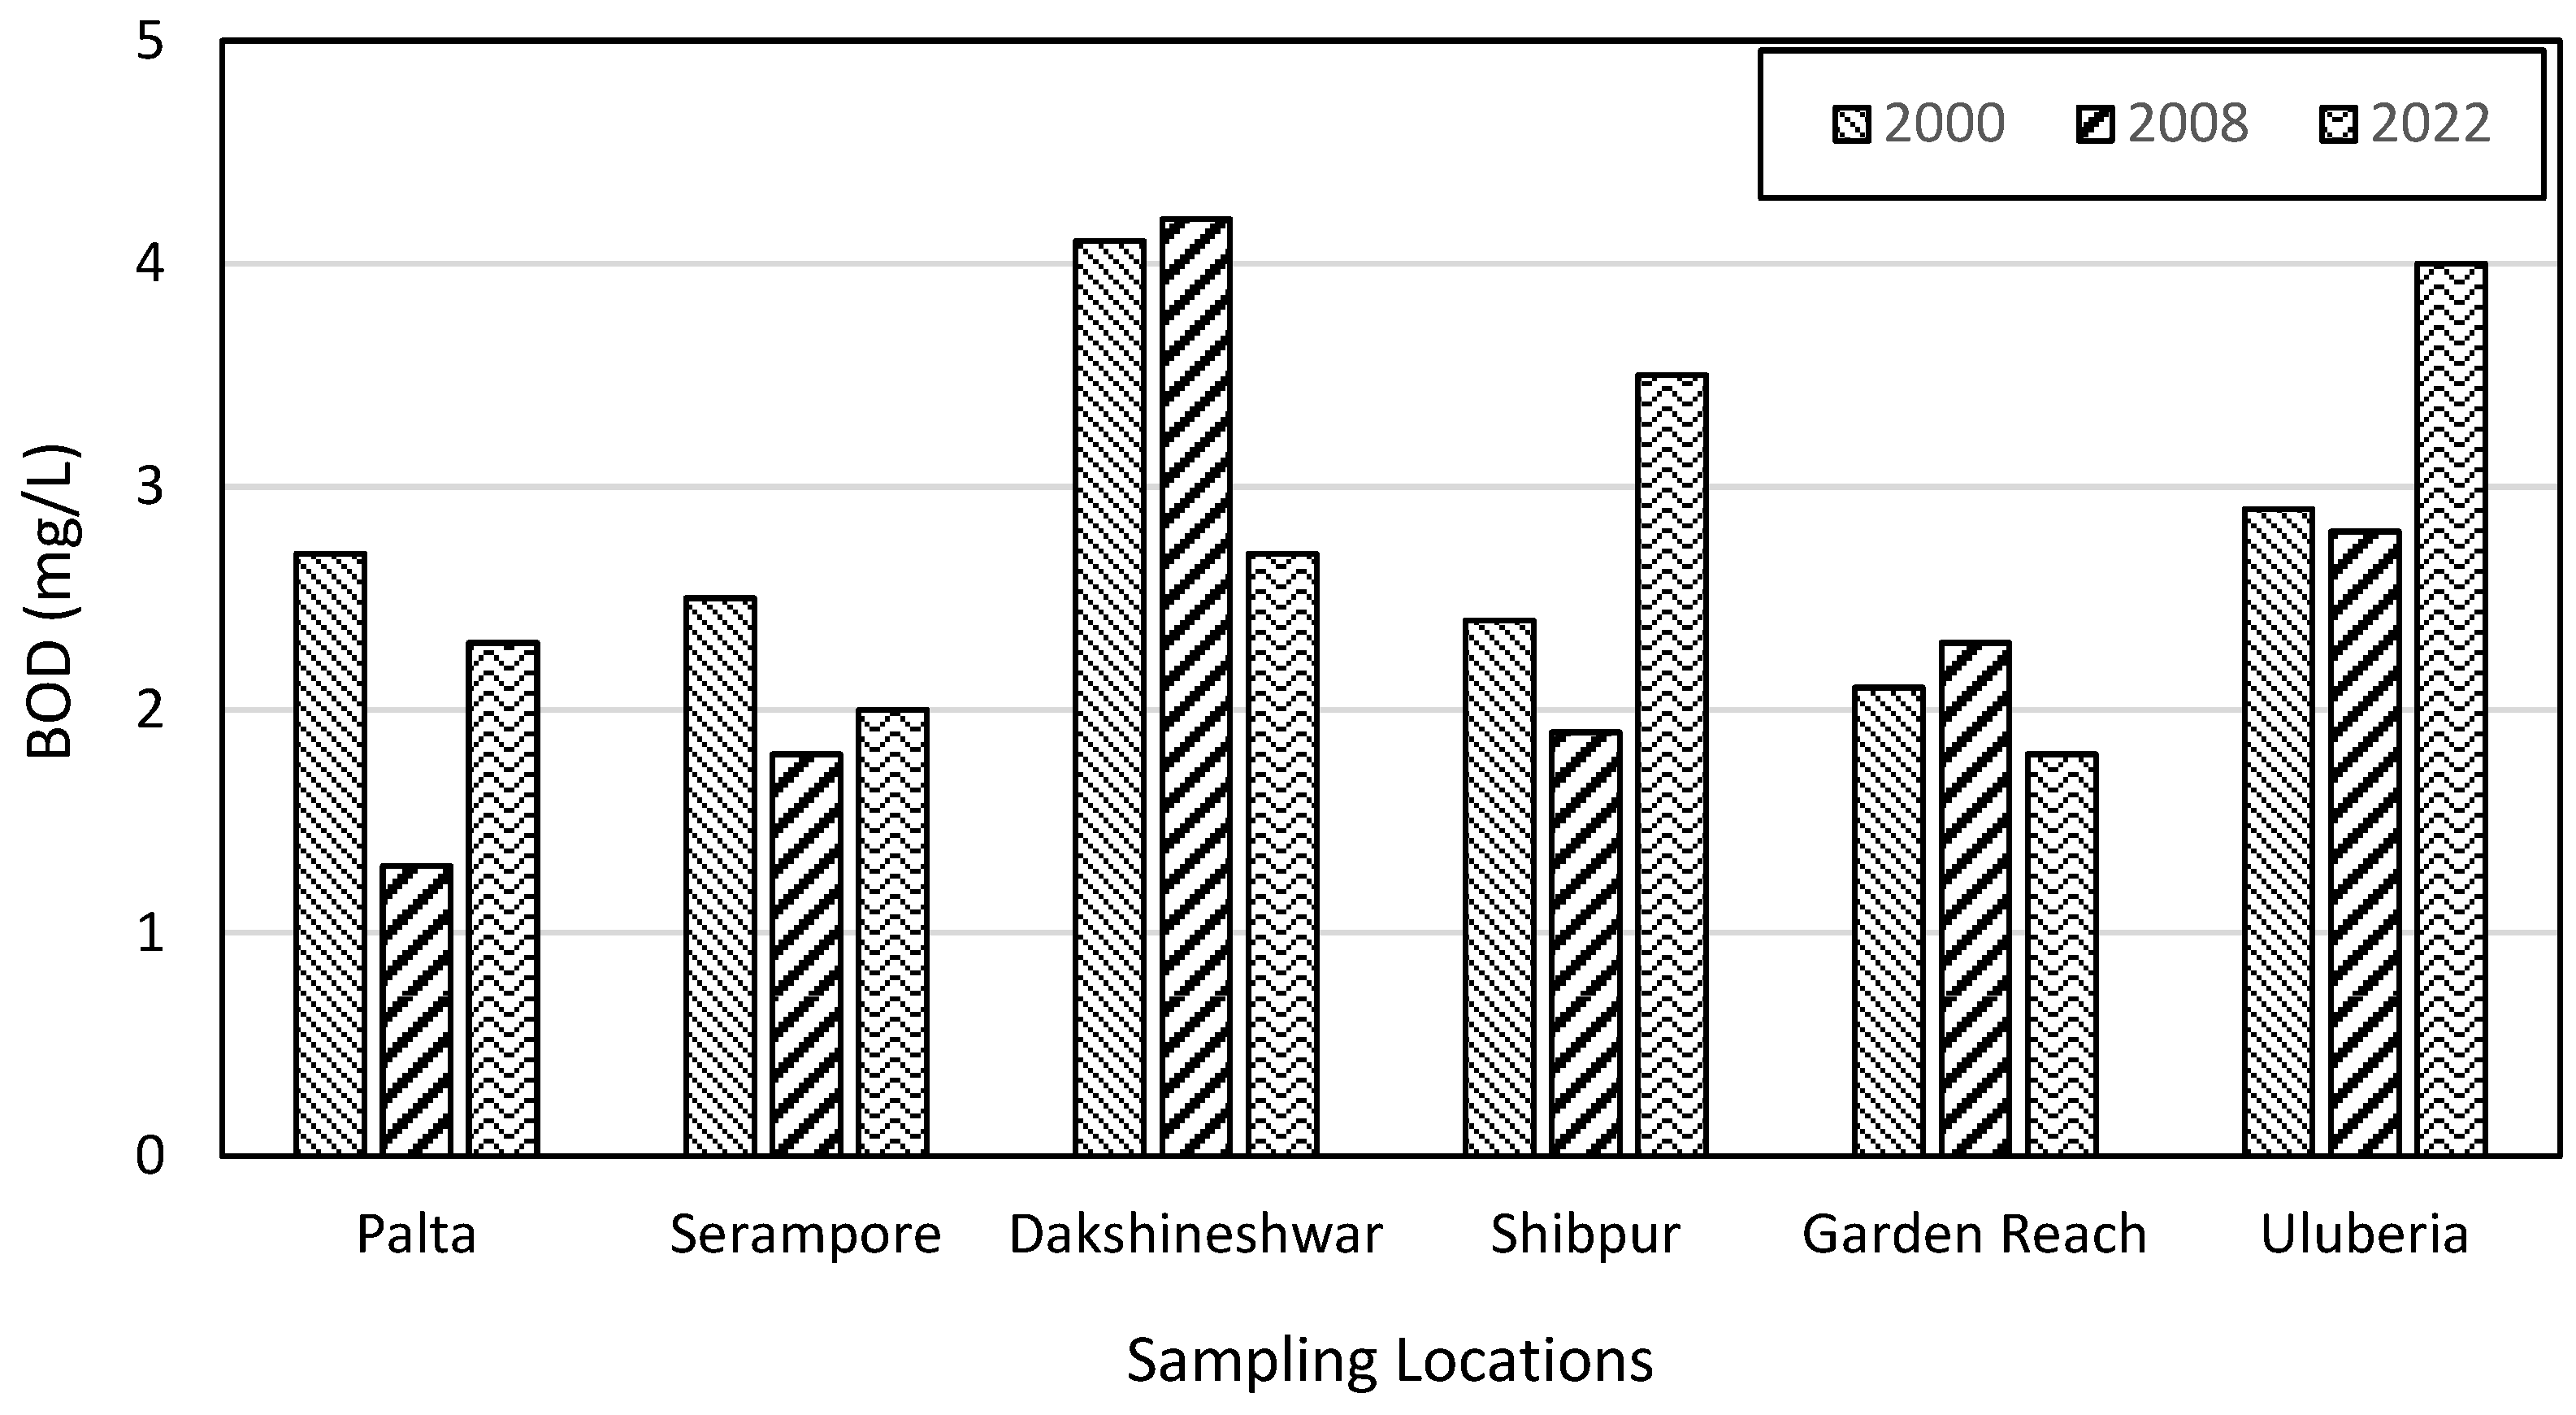
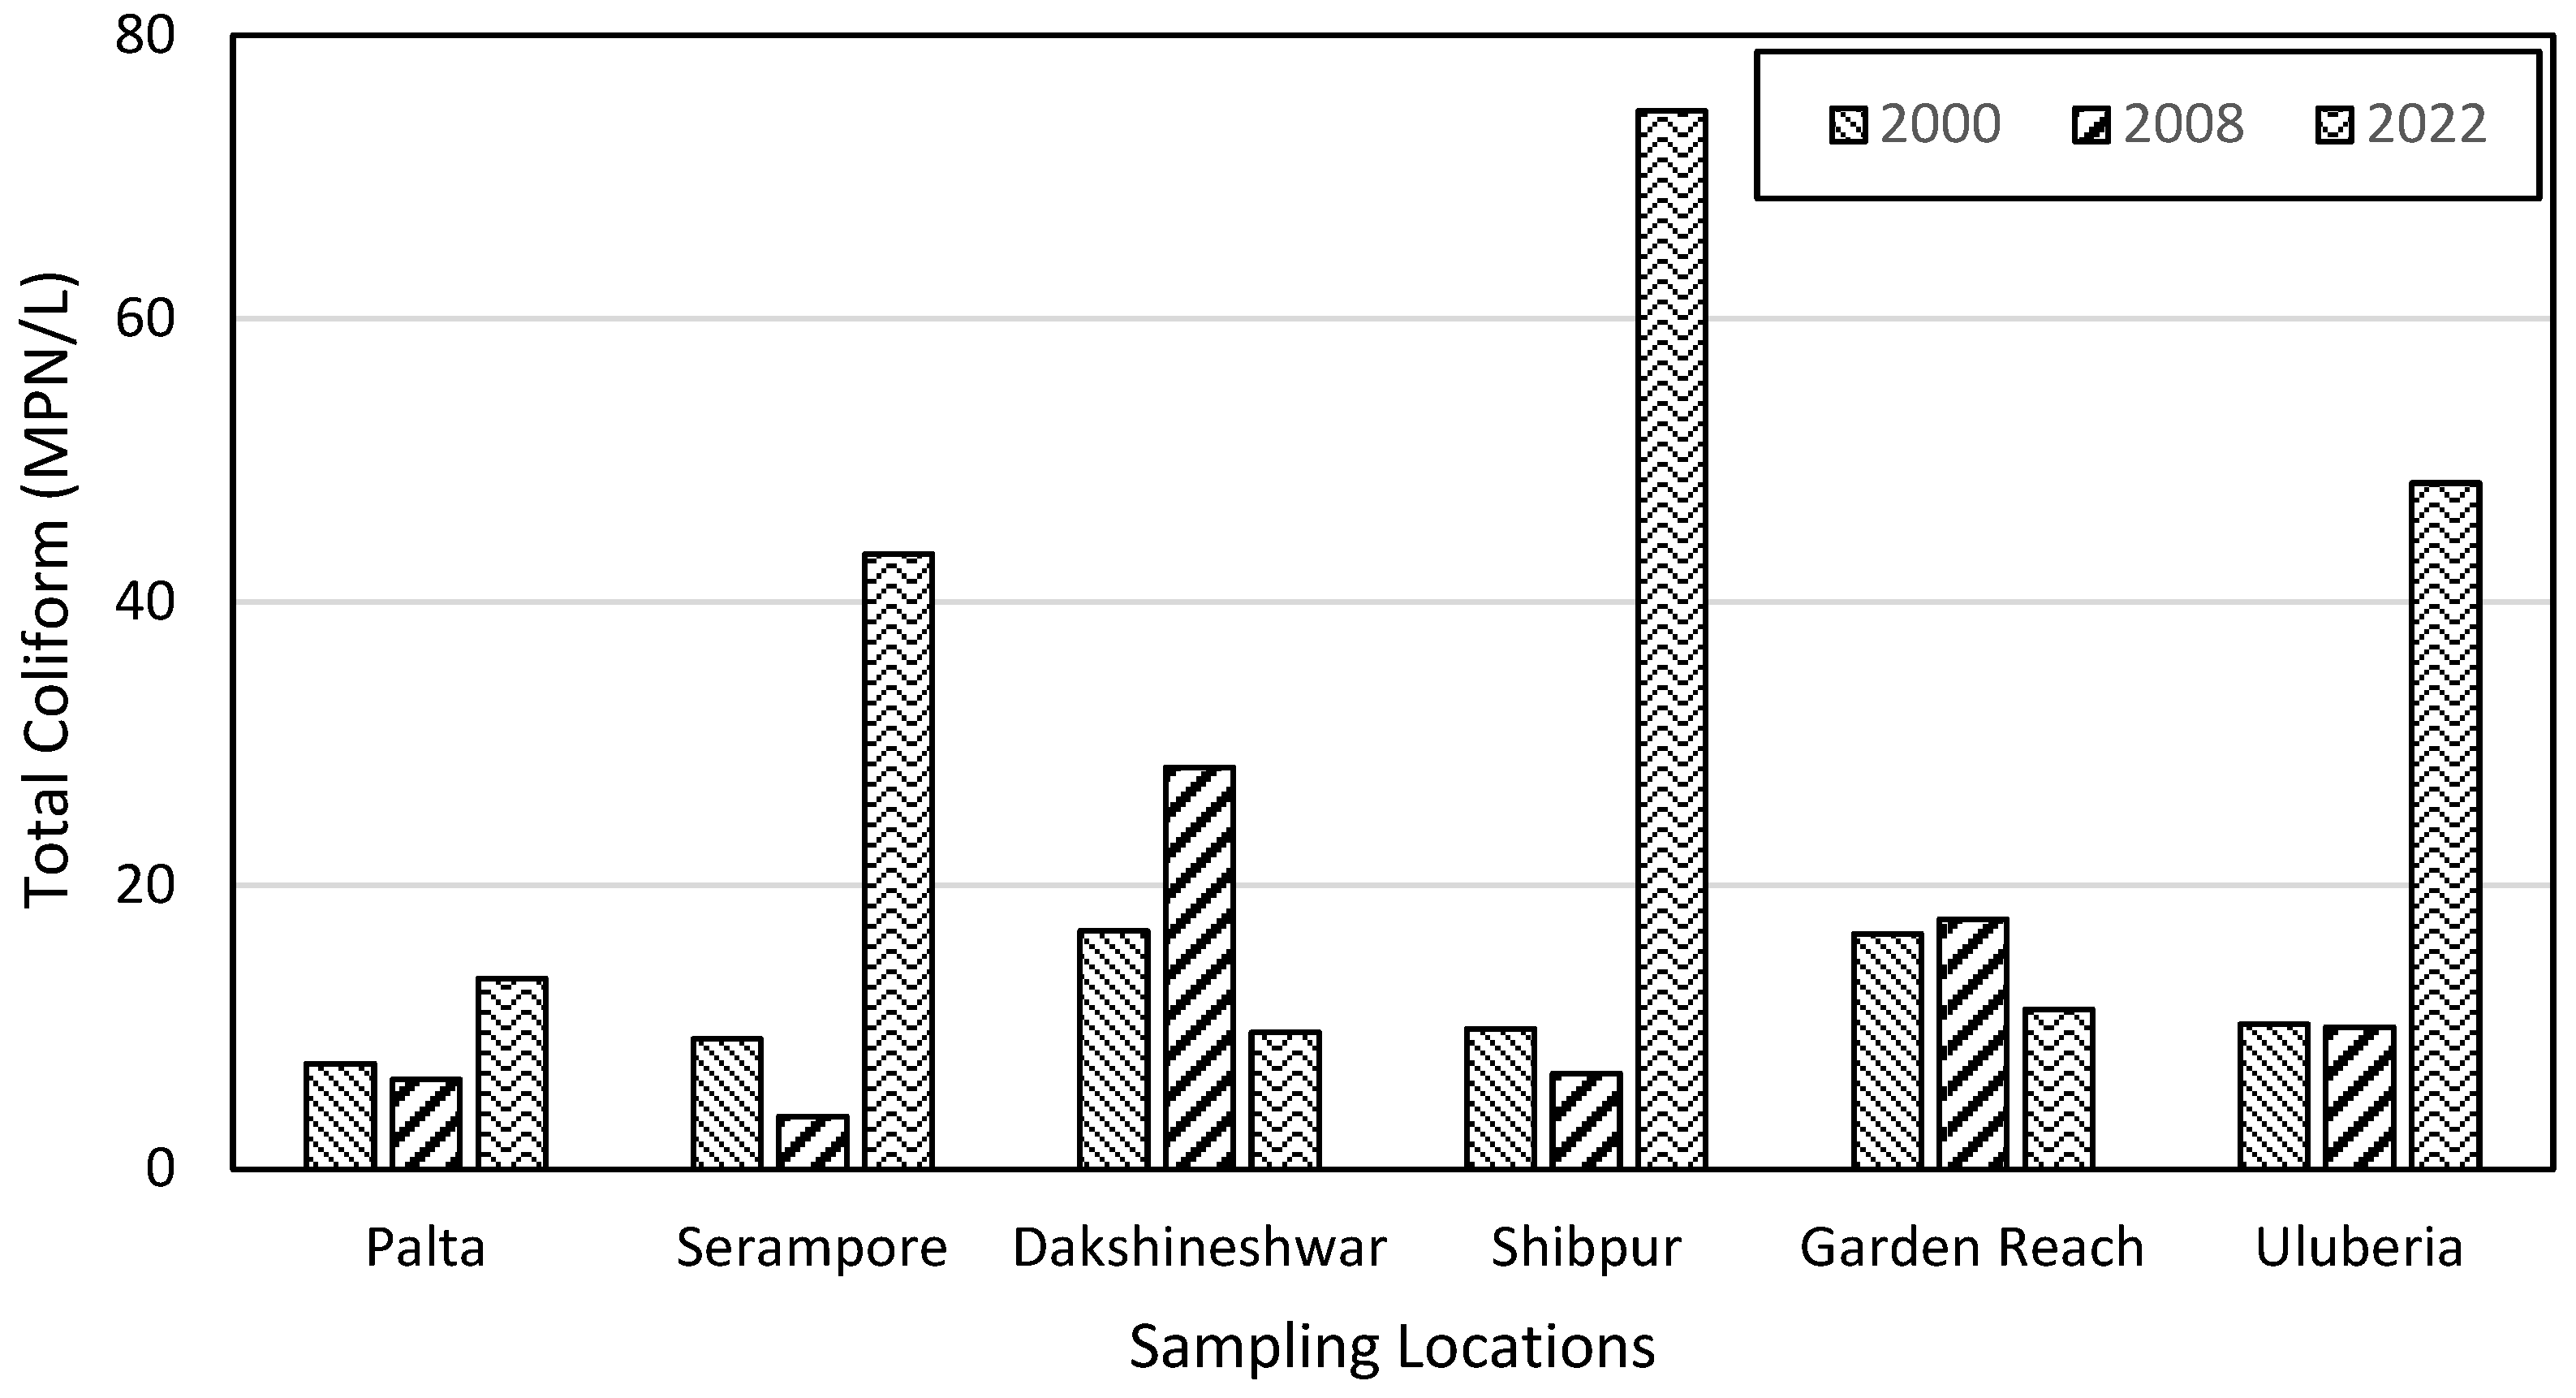
The river Hooghly is a significant water resource for West Bengal, India, providing water for consumption and navigation. As Kolkata city continues to expand, there are concerns about the impact on the quality of water in the river and surrounding areas. To address these concerns, the water quality has been assessed at various specific locations in the vicinity of Kolkata. The quality of water in the river is primarily influenced by LULC and population. In particular, the LULC within 15 km of the river’s left and right banks has been evaluated. The findings indicate that there is a notable change in LULC across all buffer zones, with the degree of change increasing gradually towards the outer buffer zones.
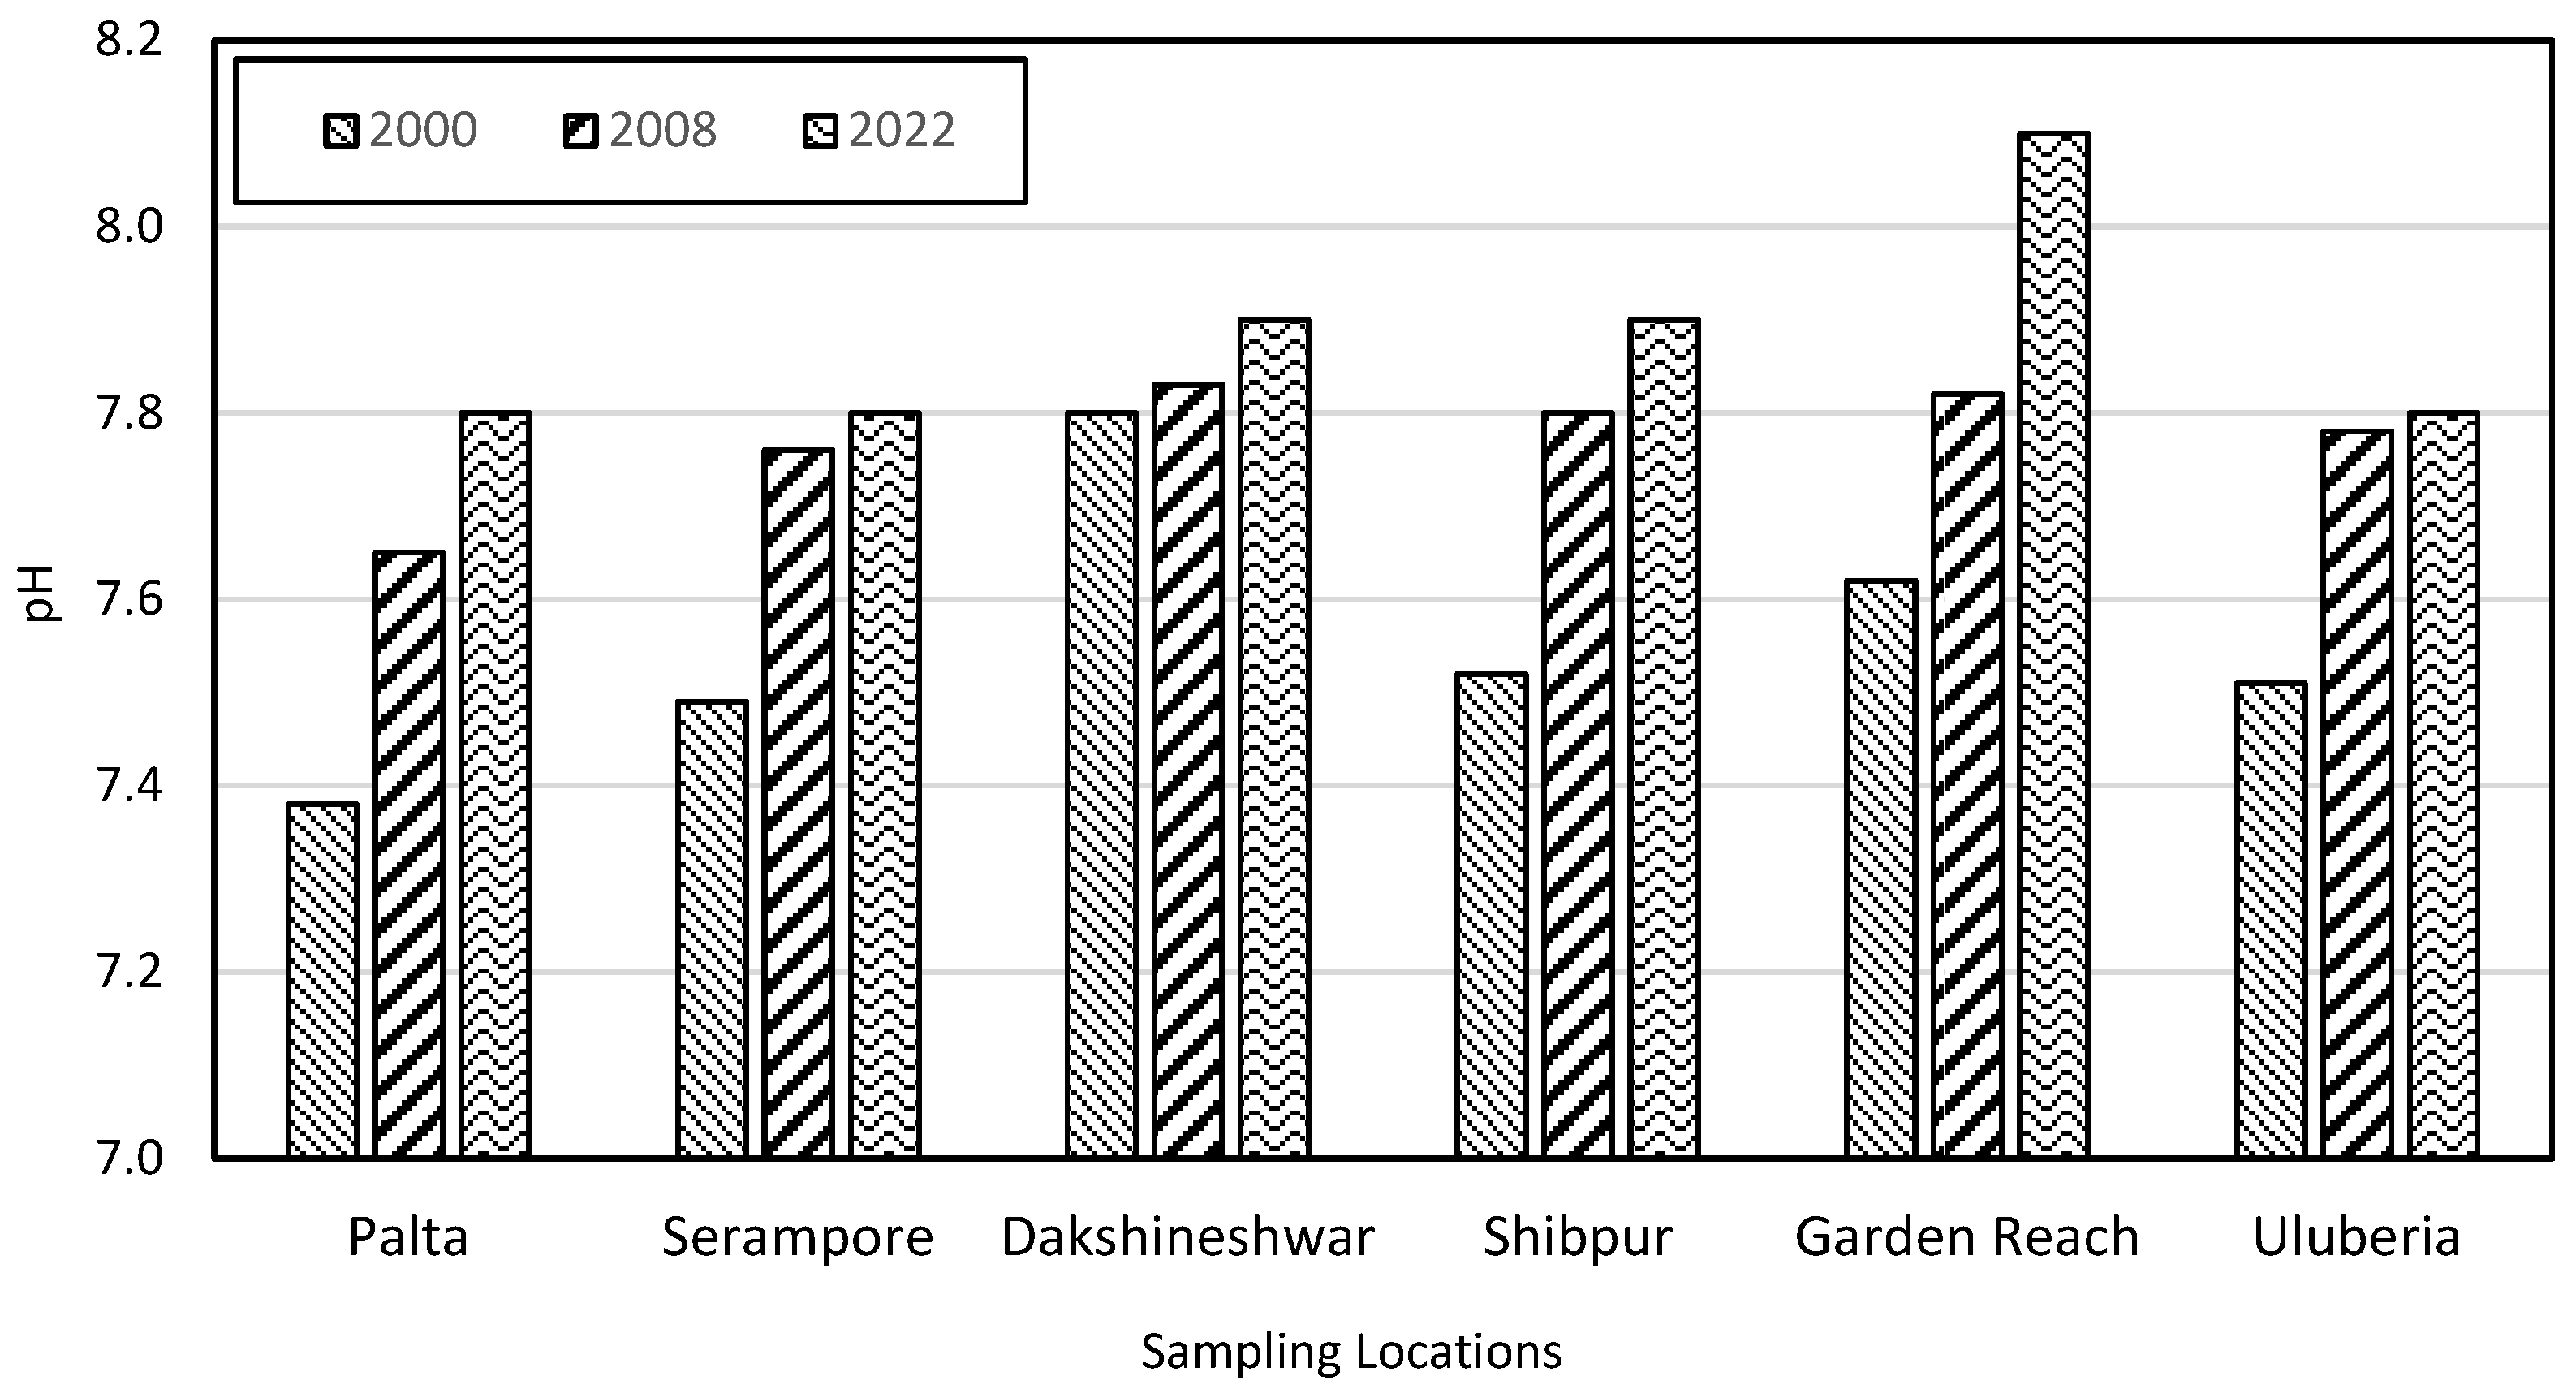
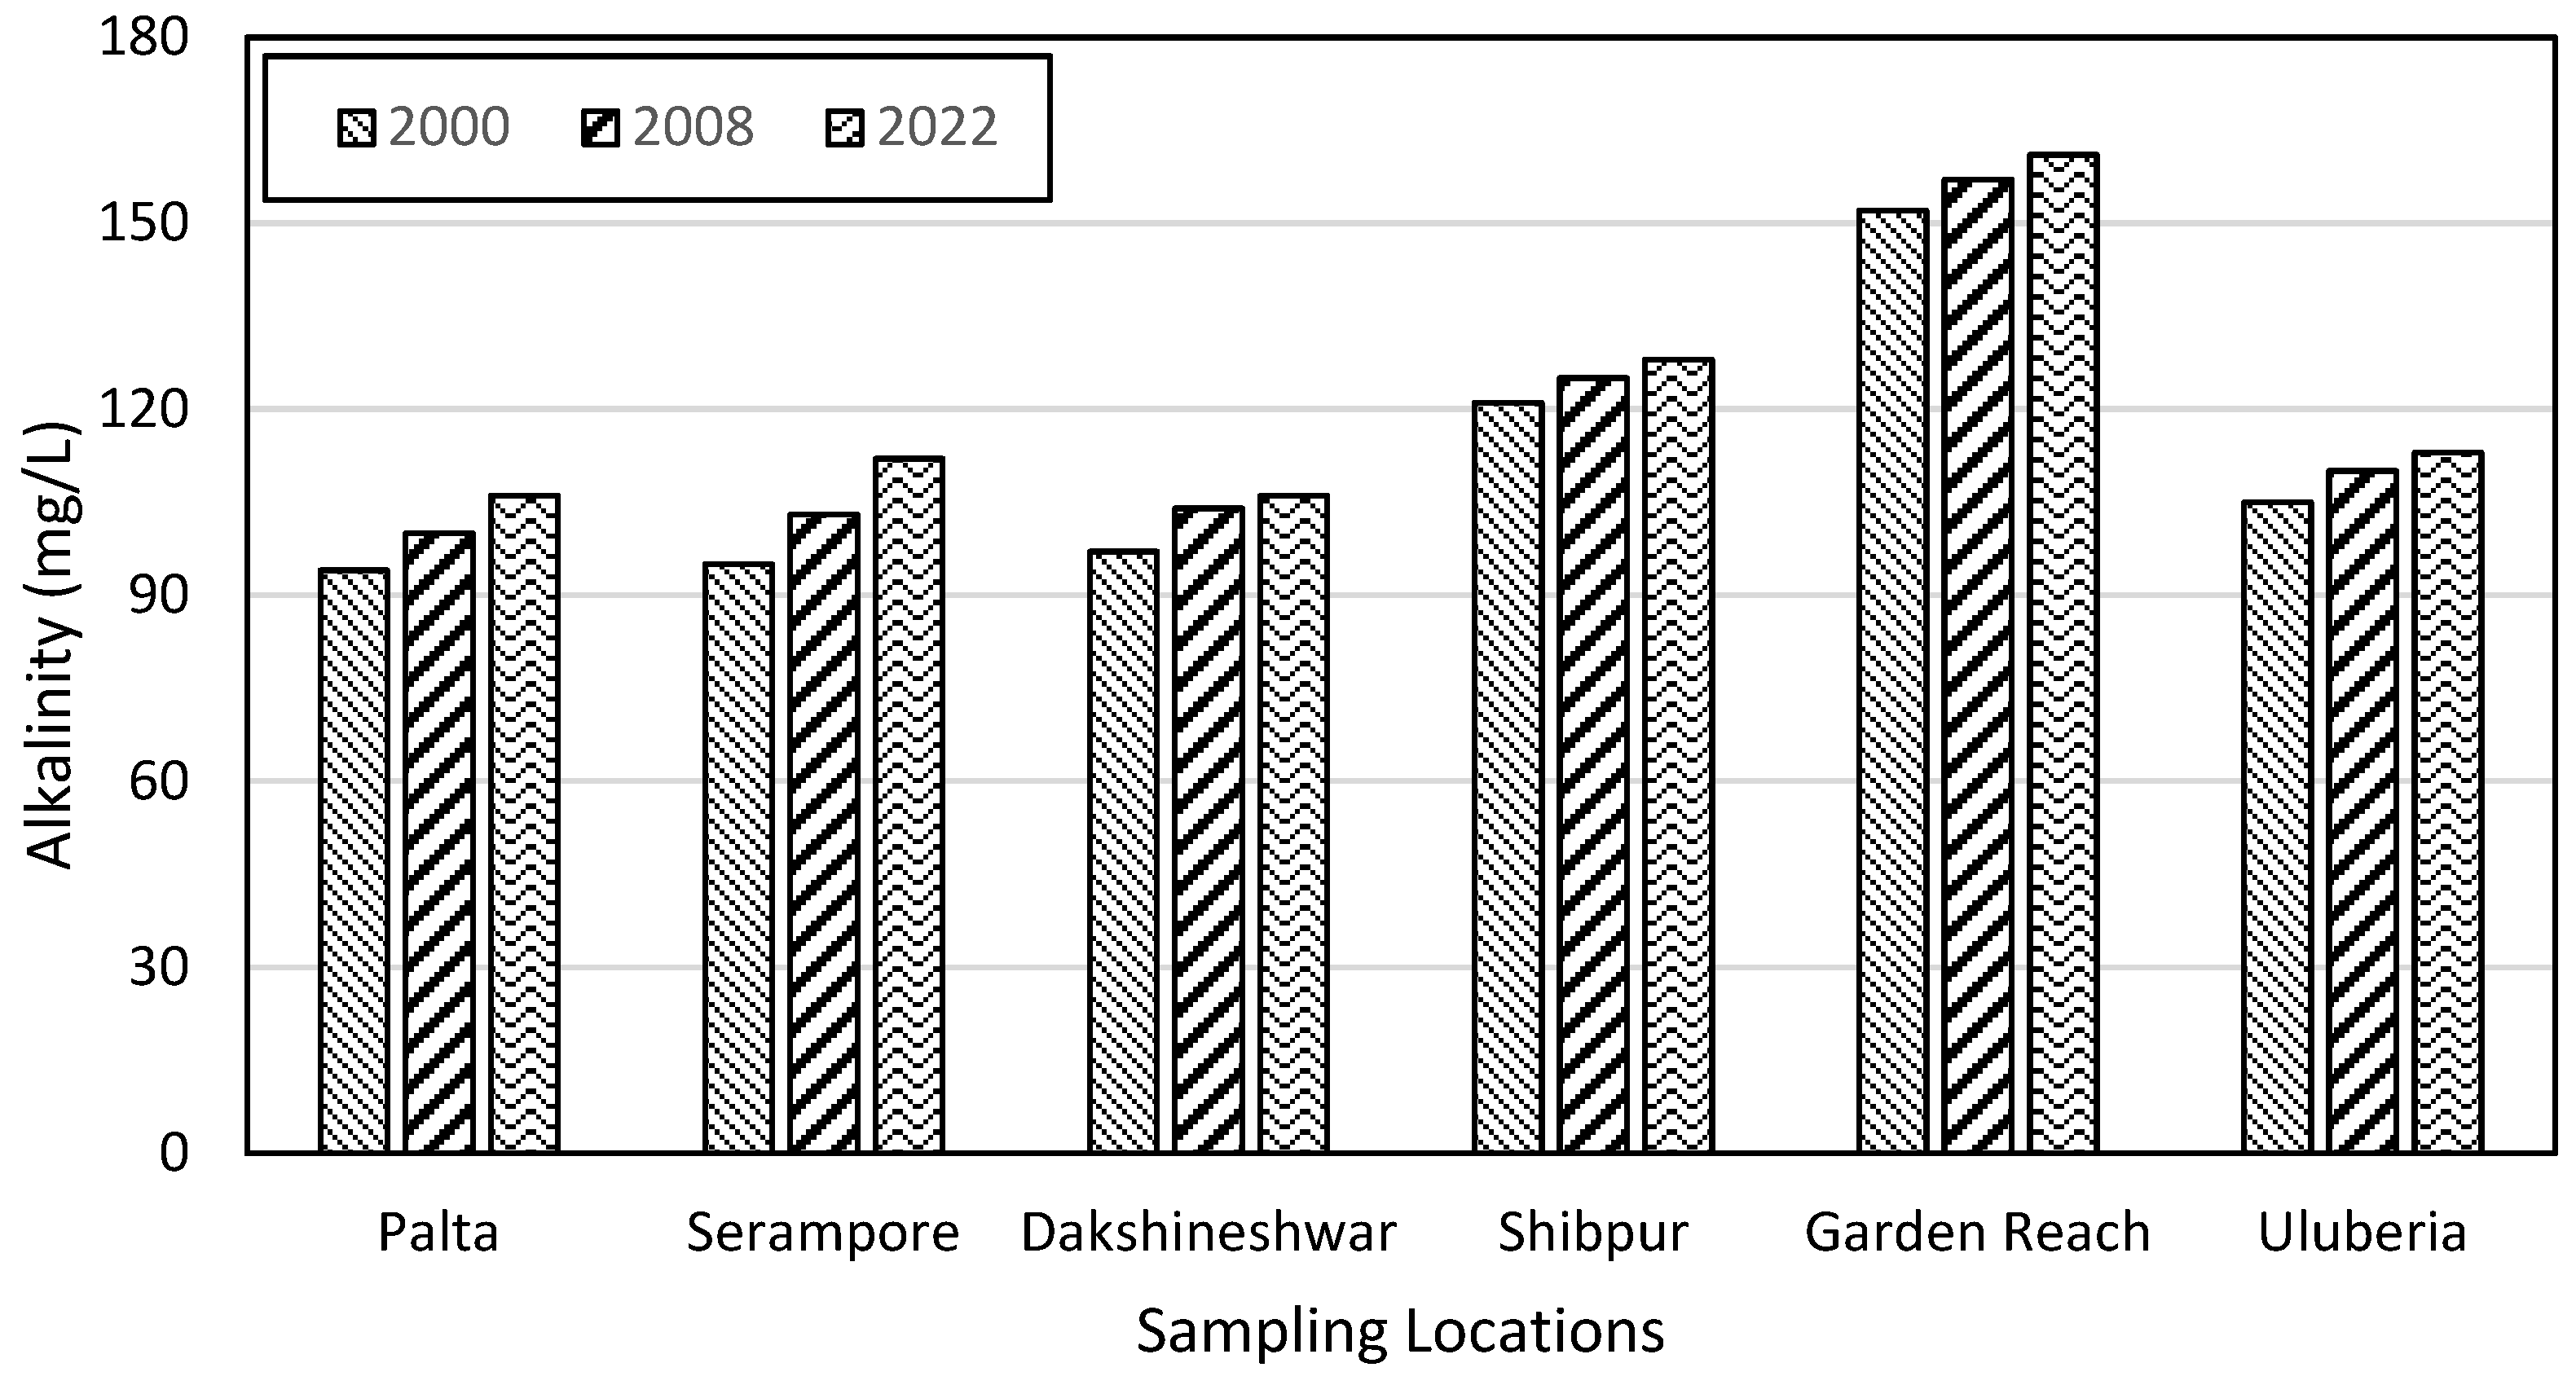
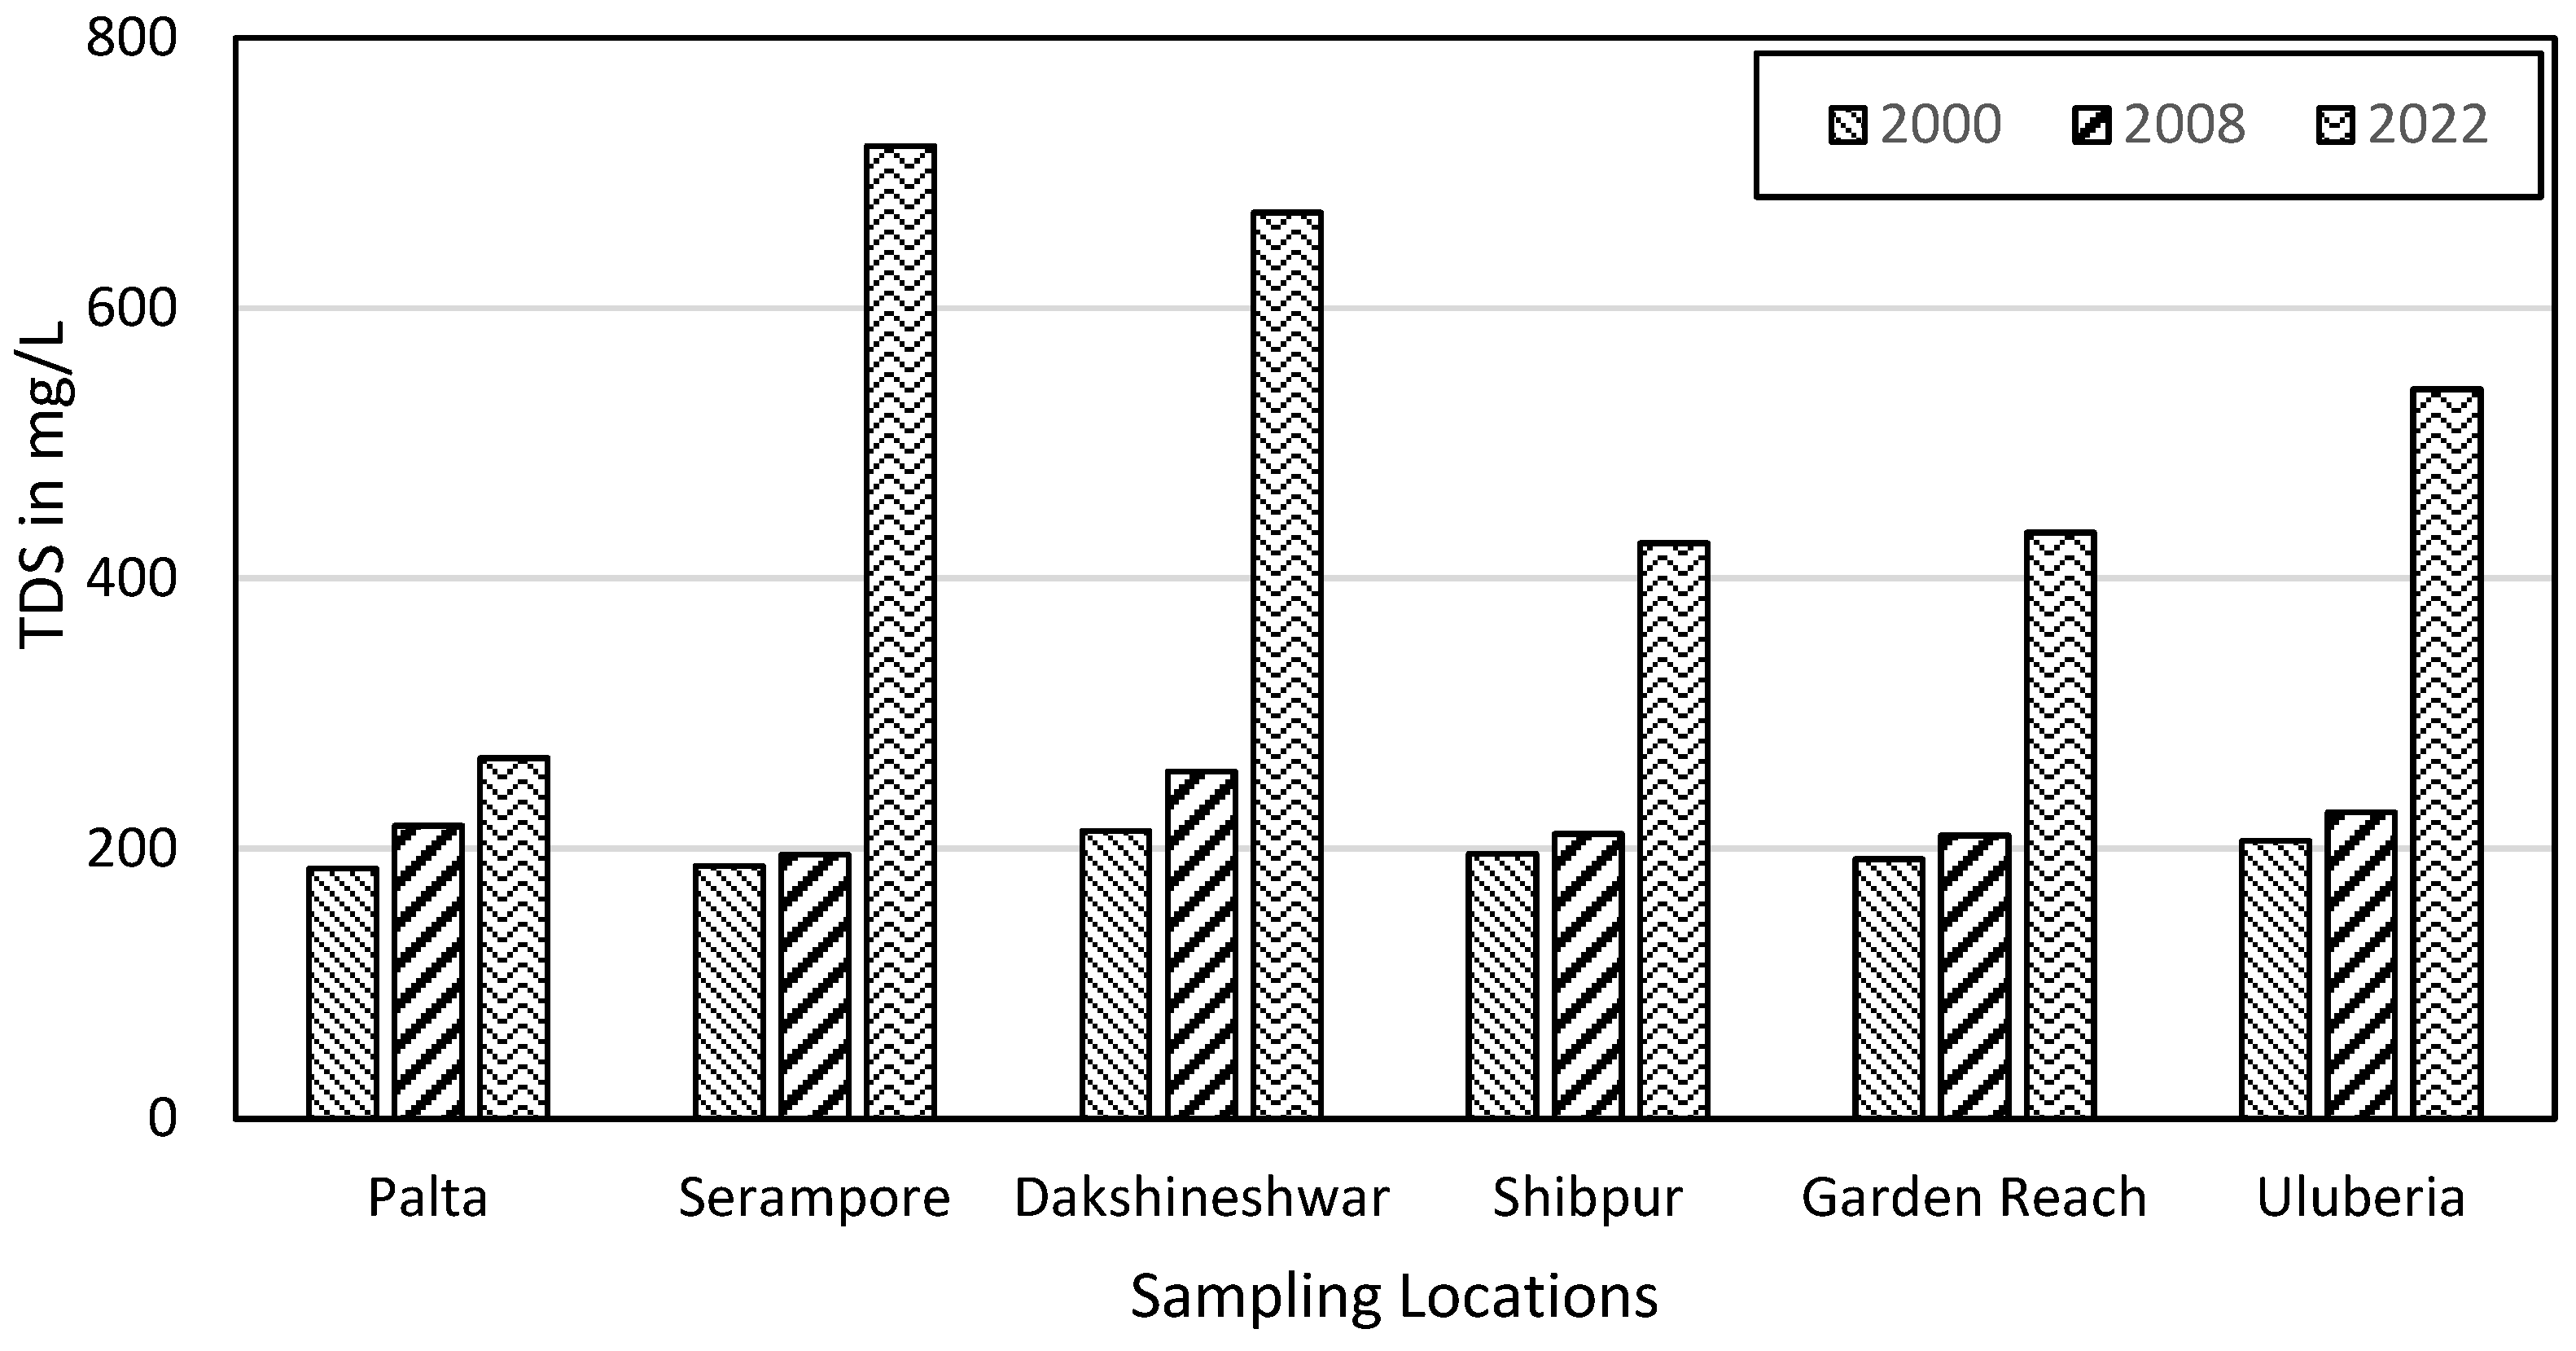
The water quality parameters have been assessed and compared with historical values, revealing an upward trend. Although the current values are not yet alarming, the continued deterioration could result in hazardous conditions, especially in densely populated areas with increasing built-up areas and high freshwater demands. Analysis showed that all parameters were present at high levels in all sampling locations, with the trend being more pronounced in and around Kolkata city. Localities in the vicinity of Dakshineshwar, Shibpur, and Garden Reach are particularly vulnerable to water quality deterioration due to LULC changes and increasing population density [52,53]. Urgent measures are necessary to prevent further deterioration.
Analysis of land use and land cover change has shown a growing trend in the built-up area surrounding the Hooghly River, which is attributed to an increase in population and demand for food production. Additionally, there has been an expansion of agricultural areas at the expense of water bodies, leading to concerns about the impact of chemical fertilizers on the water quality of the river Hooghly.
This study has demonstrated the impact of changes in land use and land cover (LULC) and population growth on water quality. The results reveal that areas experiencing significant LULC changes and population growth exhibit poorer water quality [54]. To mitigate this issue, it is recommended that strict measures be implemented to manage population density through the development of sustainable management plans. Furthermore, effective LULC management is essential for maintaining the health and quality of surface water resources and their dependent ecosystems.

Author Contributions

Conceptualization, S.B. and G.G.; methodology, S.B., G.G. and S.M.; software, G.G. and S.M.; validation, G.G., S.B. and R.M.; formal analysis, S.B.; investigation, S.B., G.G., and S.M.; resources, G.G., S.B. and S.M.; data curation, G.G., S.M., S.B. and R.M.; writing—original draft preparation, S.B. and S.M.; writing—review and editing, G.G., S.M. and M.K.; visualization, M.K.; supervision, R.M.; project administration, R.M.; funding acquisition, M.K. All authors have read and agreed to the published version of the manuscript.

Funding

This research received no external funding.

Data Availability Statement

All data are available in the paper.

Acknowledgments

The authors acknowledge the infrastructural support provided by Pinnacle Educational Trust, Kolkata, India, to conduct the study. The water samples were collected with permission from the Government of West Bengal.

Conflicts of Interest

The authors declare no conflict of interest.

References

  1. Anderson, J.R.; Hardy, E.E.; Roach, J.T.; Witmer, R.E. A Land Use and Land Cover Classification System for Use with Remote Sensor Data; U.S. Government Printing Office: Washington, DC, USA, 1976.
  2. Di Gregorio, A.; Jansen, L.J. Land Cover Classification System: Classification Concepts and User Manual; Food and Agriculture Organization of the United Nations: Rome, Italy, 1998. [Google Scholar]
  3. Loveland, T.R.; Belward, A.S. The IGBP-DIS Global 1 km Land Cover Data Set, DISCover: First Results. Int. J. Remote Sens. 1997, 18, 3291–3295. [Google Scholar] [CrossRef]
  4. Ranjan, P.; Ramanathan, A. Hooghly River. In The Indian Rivers; Singh, D., Ed.; Springer: Singapore, 2018; pp. 265–283. [Google Scholar] [CrossRef]
  5. Mitra, S.; Ghosh, S.; Satpathy, K.K.; Bhattacharya, B.D.; Sarkar, S.K.; Mishra, P.; Raja, P. Water Quality Assessment of the Ecologically Stressed Hooghly River Estuary, India: A Multivariate Approach. Mar. Pollut. Bull. 2018, 126, 592–599. [Google Scholar] [CrossRef]
  6. Basu, S.; Banerjee, T.; Manna, P.; Bhattacharyya, B.; Guha, B. Influence of Physicochemical Parameters on the Abundance of Coliform Bacteria in an Industrial Site of the Hooghly River, India. Proc. Zool. Soc. 2013, 66, 20–26. [Google Scholar] [CrossRef]
  7. Nath, S.; Mukherjee, R.; Bose, S.; Ghosh, S.A. Short Period Assessment of Water Physicochemical Characteristics of Hooghly River, West Bengal, India. Int. Res. J. Environ. Sci. 2017, 6, 1–6. [Google Scholar]
  8. Ghosh, S.; Das, R.; Bakshi, M.; Mahanty, S.; Chaudhuri, P. Potentially Toxic Element and Microplastic Contamination in the River Hooghly: Implications to Better Water Quality Management. J. Earth Syst. Sci. 2021, 130, 44. [Google Scholar] [CrossRef]
  9. Kar, S.; Ghosh, I.; Ghosh, A.; Aitch, P.; Bhandari, G. Determination of water quality index (WQI) during mass bathing in different ghats of river Ganga in Howrah and North 24 Parganas district, West Bengal, India. Int. J. Res. Appl. Sci. Eng. 2017, 5, 1097–1104. [Google Scholar] [CrossRef]
  10. Ozbay, G.; Fan, C.; Yang, Z. Relationship between Land Use and Water Quality and its Assessment Using Hyperspectral Remote Sensing in Mid- Atlantic Estuaries. In Water Quality; InTech Open: Rijeka, Croatia, 2017. [Google Scholar] [CrossRef] [Green Version]
  11. Tahiru, A.A.; Doke, D.A.; Baatuuwie, B.N. Effect of land use and land cover changes on water quality in the Nawuni Catchment of the White Volta Basin, Northern Region, Ghana. Appl. Water Sci. 2020, 10, 198. [Google Scholar] [CrossRef]
  12. Sinha, K.; Das, P. Assessment of water quality index using cluster analysis and artificial neural network modeling: A case study of the Hooghly River basin, West Bengal, India. Desalination Water Treat. 2015, 54, 28–36. [Google Scholar] [CrossRef]
  13. Karmakar, J. Appraisal of Hooghly river water quality using pollution indices. J. Indian Water Work. Assoc. 2021, 41, 17–27. [Google Scholar]
  14. Ghosh, S.; Bakshi, M.; Mahanty, S.; Gaine, T.; Bhattacharyya, S.; Biswas, J.K.; Chaudhuri, P. Spatiotemporal distribution of potentially toxic elements in the lower Gangetic delta and their implications for non-carcinogenic health risk management. Geosci. Lett. 2021, 8, 19. [Google Scholar] [CrossRef]
  15. Kar, S.; Ghosh, I.; Chowdhury, P.; Ghosh, A.; Aitch, P.; Bhandari, G.; RoyChowdhury, A. A model-based prediction and analysis of seasonal and tidal influence on pollutants distribution from city outfalls of river Ganges in West Bengal, India and its mapping using GIS tool. PLoS Water 2022, 1, e0000008. [Google Scholar] [CrossRef]
  16. Dutta, J.; Basack, S.; Goswami, G.; Kiron, B. Geomechanical Hazards related to River Hydraulics and Remedial Measures: Selected case studies in India. WSEAS Trans. Fluid Mech. 2021, 16, 214–221. [Google Scholar] [CrossRef]
  17. Kiron, B.; Basack, S.; Goswami, G.; Bida, H. Hydrological and environmental study on surface water characterization in a locality in North Eastern India. WSEAS Trans. Environ. Dev. 2021, 17, 1228–1233. [Google Scholar] [CrossRef]
  18. Goswami, G.; Basack, S.; Mastorakis, N.; Saikia, A.; Nilo, B.; Ahmed, N. Coastal groundwater flow and management: A state-of-the-art review. Int. J. Mech. 2020, 14, 37–48. [Google Scholar] [CrossRef]
  19. Basack, S.; Loganathan, M.K.; Goswami, G.; Khabbaz, H. Saltwater intrusion into coastal aquifers and associated risk management: Critical review and research directives. J. Coast. Res. 2022, 38, 654–672. [Google Scholar] [CrossRef]
  20. Basack, S.; Loganathan, M.K.; Goswami, G.; Baruah, P.; Alam, R. Review of risk assessment and mitigation measures of coastal aquifers vulnerable to saline water intrusion. Pol. J. Environ. Stud. 2022, 31, 1505–1512. [Google Scholar] [CrossRef]
  21. Basack, S.; Goswami, G.; Sonowal, S.; Karakouzian, M. influence of saltwater submergence on geohydraulic properties of sand: A laboratory investigation. Hydrology 2021, 8, 181. [Google Scholar] [CrossRef]
  22. Basack, S.; Goswami, G.; Khabbaz, H.; Karakouzian, M. Flow characteristics through granular soil influenced by saline water intrusion: A laboratory investigation. Civ. Eng. J. 2022, 8, 863–878. [Google Scholar] [CrossRef]
  23. Mustafa, A.M.; Muhammed, H.H.; Szydlowski, M. Extreme Rainfalls as a Cause of Urban Flash Floods; a Case Study of the Erbil-Kurdistan Region of Iraq. Acta Sci. Pol. Form. Circumiectus 2019, 18, 113–132. [Google Scholar] [CrossRef]
  24. Mustafa, A.; Szydłowski, M. The Impact of Spatiotemporal Changes in Land Development (1984–2019) on the Increase in the Runoff Coefficient in Erbil, Kurdistan Region of Iraq. Remote Sens. 2020, 12, 1302. [Google Scholar] [CrossRef] [Green Version]
  25. Noori, M.; Hassan, H.; Mustafa, Y. Spatial Estimation of Rainfall Distribution and Its Classification in Duhok Governorate Using GIS. J. Water Resour. Prot. 2014, 6, 75–82. [Google Scholar] [CrossRef] [Green Version]
  26. Al-Quraishi, A.M.F.; Negm, A.M. (Eds.) Environmental Remote Sensing and GIS in Iraq. In Springer Water; Springer: Berlin/Heidelberg, Germany, 2020. [Google Scholar] [CrossRef]
  27. Rosgen, D.L. A Classification of Natural Rivers. CATENA 1994, 22, 169–199. [Google Scholar] [CrossRef] [Green Version]
  28. Jain, V.; Karnatak, N.; Raj, A.; Shekhar, S.; Bajracharya, P.; Jain, S. Hydrogeomorphic Advancements in River Science for Water Security in India. Water Secur. 2022, 16, 100118. [Google Scholar] [CrossRef]
  29. Kumar, R.; Singh, R.D.; Sharma, K.D. Water Resources of India. Curr. Sci. 2005, 89, 794–811. [Google Scholar]
  30. De, T.K.; Raman, M.; Sarkar, S.K.; Mukherjee, A. Ecological Assessment of Hooghly River Considering a Few of the More Perturbed Sites Based on Some Relevant Physic-Chemical and Biological Variables—A Part of the AVIRIS-NG (NASA-ISRO) Ground Truth Verification. Reg. Stud. Mar. Sci. 2021, 41, 101598. [Google Scholar] [CrossRef]
  31. Teixeira Pinto, C.; Jing, X.; Leigh, L. Evaluation Analysis of Landsat Level-1 and Level-2 Data Products Using In Situ Measurements. Remote Sens. 2020, 12, 2597. [Google Scholar] [CrossRef]
  32. Taati, A.; Abbas, M.; Sarmadian, F.; Mousavi, A.; Pour, C.; Shahir, A. Land Use Classification using Support Vector Machine and Maximum Likelihood Algorithms by Landsat 5 TM Images. Walailak J. Sci. Technol. 2015, 12, 681–687. [Google Scholar] [CrossRef]
  33. Chachondhia, P.; Shakya, A.; Kumar, G. Performance Evaluation of Machine Learning Algorithms Using Optical and Microwave Data for LULC Classification. Remote Sens. Appl. Soc. Environ. 2021, 23, 100599. [Google Scholar] [CrossRef]
  34. Suykens, J.A.K. Support Vector Machines: A Nonlinear Modelling and Control Perspective. Eur. J. Control 2001, 7, 311–327. [Google Scholar] [CrossRef]
  35. Mountrakis, G.; Im, J.; Ogole, C. Support Vector Machines in Remote Sensing: A Review. ISPRS J. Photogramm. Remote Sens. 2011, 66, 247–259. [Google Scholar] [CrossRef]
  36. Disperati, L.; Gonario, S.; Virdis, P. Assessment of Land-Use and Land-Cover Changes from 1965 to 2014 in Tam Giang-Cau Hai Lagoon, Central Vietnam. Appl. Geogr. 2015, 58, 48–64. [Google Scholar] [CrossRef]
  37. Foody, G.M. Sample size determination for image classification accuracy assessment and comparison. Int. J. Remote Sens. 2009, 30, 5273–5291. [Google Scholar] [CrossRef]
  38. Xu, H. Modification of Normalized Difference Water Index (NDWI) to Enhance Open Water Features in Remotely Sensed Imagery. Int. J. Remote Sens. 2006, 27, 3025–3033. [Google Scholar] [CrossRef]
  39. ASTM D3370-18; Standard Practices for Sampling Water from Flowing Process Streams. ASTM International: West Conshohocken, PA, USA, 2018.
  40. Central Pollution Control Board, Ministry of Environment and Forests, Delhi—110 032 at ENVIS Centre—01. Available online: https://cpcb.nic.in/ (accessed on 12 December 2022).
  41. ASTM D5907-18; Standard Test Methods for Filterable Matter (Total Dissolved Solids) and Nonfilterable Matter (Total Suspended Solids) in Water. ASTM International: West Conshohocken, PA, USA, 2018.
  42. ASTM D1293-18; Standard Test Methods for pH of Water. ASTM International: West Conshohocken, PA, USA, 2018.
  43. ASTM D1067-16; Standard Test Methods for Acidity or Alkalinity of Water. ASTM International: West Conshohocken, PA, USA, 2016.
  44. ASTM D888-18; Standard Test Methods for Dissolved Oxygen in Water. ASTM International: West Conshohocken, PA, USA, 2018.
  45. ASTM D6238-98; Standard Test Method for Total Oxygen Demand in Water. ASTM International: West Conshohocken, PA, USA, 2018.
  46. Indian Standard 1622 (1981); Methods of Sampling and Micro Biological Examination or Water. Bureau of Indian Standards Manak Bhavan: New Delhi, India, 2003.
  47. Chen, Q.; Mei, K.; Dahlgren, R.A.; Wang, T.; Gong, J.; Zhang, M. Impacts of Land Use and Population Density on Seasonal Surface Water Quality Using a Modified Geographically Weighted Regression. Sci. Total Environ. 2016, 572, 450–466. [Google Scholar] [CrossRef] [PubMed] [Green Version]
  48. Capodaglio, A.G.; Ghilardi, P.; Boguniewicz-Zablocka, J. New Paradigms in Urban Water Management for Conservation and Sustainability. Water Pract. Technol. 2016, 11, 176–186. [Google Scholar] [CrossRef] [Green Version]
  49. Wang, X.-H.; Wang, X.; Huppes, G.; Heijungs, R.; Ren, N.-Q. Environmental Implications of Increasingly Stringent Sewage Discharge Standards in Municipal Wastewater Treatment Plants: Case Study of a Cool Area of China. J. Clean. Prod. 2015, 94, 278–283. [Google Scholar] [CrossRef]
  50. Oliver, T.H.; Morecroft, M.D. Interactions between Climate Change and Land Use Change on Biodiversity: Attribution Problems, Risks, and Opportunities. Wiley Interdiscip. Rev. Clim. Chang. 2014, 5, 317–335. [Google Scholar] [CrossRef] [Green Version]
  51. Yadav, D.N. Assessment of Water Quality of River Yamuna at Agra. Int. J. Res. Appl. Sci. Eng. Technol. 2019, 7, 3–7. [Google Scholar] [CrossRef]
  52. Samuel Che, N.; Bett, S.; Chimaijem Okpara, E.; Oluwadamilare Olagbaju, P.; Esther Fayemi, O.; Mathuthu, M. An Assessment of Land Use and Land Cover Changes and Its Impact on the Surface Water Quality of the Crocodile River Catchment, South Africa. In River Deltas Research—Recent Advances; InTech Open: Rijeka, Croatia, 2022. [Google Scholar] [CrossRef]
  53. Verma, S.; Verma, R.K.; Tiwary, R.K.; Patel, N.; Murthy, S. Relationships between Land-use/Land-cover Patterns and Surface Water Quality in Damodar River Basin, India. Glob. J. Appl. Environ. Sci. 2012, 2, 107–121. [Google Scholar]
  54. Shukla, A.K.; Ojha, C.S.P.; Mijic, A.; Buytaert, W.; Pathak, S.; Garg, R.D.; Shukla, S. Population Growth, Land Use and Land Cover Transformations, and Water Quality Nexus in the Upper Ganga River Basin. Hydrol. Earth Syst. Sci. 2018, 22, 4745–4770. [Google Scholar] [CrossRef] [Green Version]
Figure 1. Schematic diagrams of the rivers Ganges and Hooghly with Sampling locations.
Hydrology 10 00071 g001
Figure 2. Landsat-5 TM and Landsat-8 OLI for 1988 and 2022.
Hydrology 10 00071 g002
Figure 3. Flowchart of the methodology.
Hydrology 10 00071 g003
Figure 4. LULC map of the study area for 1988 and 2022.
Hydrology 10 00071 g004
Figure 5. Change in LULC classes under different buffer zone from 1988 to 2022: (a) Agriculture, (b) Built-up, (c) Tree cover, (d) Waterbody.
Hydrology 10 00071 g005
Figure 6. Bar chart for population density (Census data [44]).
Hydrology 10 00071 g006
Figure 7. Variation of pH in different locations.
Hydrology 10 00071 g007
Figure 8. Variation of Alkalinity in different locations.
Hydrology 10 00071 g008
Figure 9. Variation of TDS in different locations.
Hydrology 10 00071 g009
Figure 10. Variation of Dissolve Oxygen in different locations.
Hydrology 10 00071 g010
Figure 11. Variation of BOD in different locations.
Hydrology 10 00071 g011
Figure 12. Variation of COD in different locations.
Hydrology 10 00071 g012
Figure 13. Variation of Total Coliform in different locations.
Hydrology 10 00071 g013
Table 1. Details of the dataset used.
LULC YearSatellite/SensorPath/RowAcquisition DateResolution (m)
1988Landsat 5 TM C 2 Level 2 Tier 1138/4317 December 198830
138/4417 December 198830
138/4526 December 198830
139/4326 December 198830
139/4426 December 198830
2022Landsat 8 OLI C 2 Level 2 Tier 1138/4313 November 202230
138/4413 November 202230
138/4514 November 202230
139/4314 November 202230
139/4414 November 202230
Table 2. Description of LULC classes.
LULC ClassesDescription
WaterbodiesRiver, inland natural and manmade wetlands, and waterbodies
Tree coverDense forest, open forest, and urban forest
Built upSettlement areas of major cities and towns
AgricultureLand used for the production of agriculture produce
Table 3. Sampling locations.
LocalityDistance from Farakka (km)
Palta, 24 Parganas (N)267
Serampore, Hooghly272
Dakshineshwar, 24 Parganas (N)284
Shibpur, Howrah296
Garden Reach, 24 Parganas (S)300
Uluberia, Howrah324
Notes: The water samples were collected during September 2021 which was a post-monsoon period in the year.
Table 4. Test specifications.
ParameterTest Specifications
Total solidsASTM D5907-18 [41]
pHASTM D1293-18 [42]
AlkalinityASTM D1067-16 [43]
Dissolved oxygenASTM D888-18 [44]
BOD * and COD #ASTM D6238-98 [45]
Total coliformIS 1622 [46]
Note: Each test was conducted thrice to minimize the error and the average value is considered. * Biochemical Oxygen Demand; # Chemical Oxygen Demand.
Table 5. Accuracy assessment of LULC of 1988.
LULC ClassesWBBUTCAGTotalUser’s Accuracy
Waterbody28400320.88
Built-up33300360.92
Tree Cover00120131330.90
Agriculture65102582790.92
Total3742130271480
Producer’s Accuracy0.760.790.920.95
Overall Accuracy0.91
Kappa0.85
Table 6. Accuracy assessment of LULC of 2022.
LULC ClassesWBBUTCAGTotalUser’s Accuracy
Waterbody29300320.91
Built-up23400360.94
Tree Cover10120121330.90
Agriculture6582602790.93
Total38421282724800.00
Producer’s Accuracy0.760.810.940.960.00
Overall Accuracy0.92
Kappa0.87
Disclaimer/Publisher’s Note: The statements, opinions and data contained in all publications are solely those of the individual author(s) and contributor(s) and not of MDPI and/or the editor(s). MDPI and/or the editor(s) disclaim responsibility for any injury to people or property resulting from any ideas, methods, instructions or products referred to in the content.

