1. Introduction
Groundwater presents an important source of drinking water, which is why its use and protection has become an important global issue [
1]. To achieve comprehensive and integrated management of groundwater resources, various conceptual models were developed worldwide [
2,
3,
4,
5,
6,
7,
8,
9,
10,
11]. The development of conceptual models relies on frameworks expressing the cause-and-effect structure of groundwater systems. Therefore, different frameworks should be used when dealing with complex natural systems such as aquifers [
12]. The main objective of this study is to develop an integrated model of two separate but interconnected aquifers, which will provide a management tool facilitating decision making for the prevention of groundwater pollution. Regardless of its vital importance to water supply, their recharge area is also a site of diverse and intensive land use, resulting in conflicts of interest. Considering all these aspects, it is imperative to raise the knowledge of the aquifers used in this area. The
Dravska kotlina groundwater body is located in north-eastern Slovenia and contains two of the largest, interconnected, and most important aquifers used as water resources in Slovenia: the
Dravsko polje aquifer and the
Ptujsko polje aquifer. Both are filled with Quaternary sediments of the Drava River and are intergranular aquifers. Their water tables are near the surface and have an average depth of about 8 m. Both aquifers are unconfined and have no overlying low-permeability layers that could protect them from possible pollution. Considering this, they are the most strategic groundwater resources in Slovenia. In recent decades, this area has been affected by high nitrate and pesticide concentrations caused by anthropogenic sources such as animal manure used as fertilizer, synthetic fertilizers, septic systems, and other waste waters. The study area of the two aquifers is intensively used for agriculture. There are many livestock farms in the aquifer recharge area. Contamination of groundwater from diffuse agricultural sources is known to be a major pollution problem [
13,
14,
15,
16,
17].
The protection of groundwater sources begins with the improvement of groundwater management and the effective implementation of environmental protection measures. The EU Water Framework Directive (2000/60/EC) [
18] and its daughter Directive on the Protection of Groundwater Against Pollution (2006/118/EC) [
19] established the criteria for defining the qualitative and quantitative status of groundwater. Slovenia recognised this directive in its national regulation: the Water Act [
20] and the Regulation on the Protection of Waters Against Pollution Caused by Nitrates from Agricultural Sources [
21]. The main objective of this research is to develop a conceptual and hydraulic groundwater flow model on a regional scale, starting from borehole data, grain size distributions and well tests, in order to analyse the overall groundwater flow behaviour. Problems associated with the conceptualisation of groundwater systems have been known for over a decade [
22,
23]. In recent years, increasing attention has been paid to the development and evaluation of conceptual models [
24,
25]. The development of an appropriate conceptual model is a critical step in any successful modelling study. A simple model is needed that would be able to capture the behaviour of total groundwater flow in the main aquifers without complex fine-resolution behaviours arising from aquifer heterogeneity. On the other hand, despite their simplicity, such conceptual and numerical models must be accurate and hydro-stratigraphically sound. In designing the conceptual models, we defined the study area, created a 3D model of the hydrogeological system, estimated the groundwater recharge from precipitation and surface waters, and defined the boundary conditions (BCs). Previous assessments of groundwater recharge from precipitation and its spatial distribution in the study area were sparse and insufficient. Groundwater recharge in our models was divided into two categories: targeted recharge from surface waters such as rivers, canals, and lakes, and diffuse recharge from infiltration of precipitation through the unsaturated zone into the groundwater. The analysis of groundwater and surface water levels allowed us to define the BCs and the relationship between surface water and groundwater.
This study is the first to evaluate the spatial distribution of long-term average groundwater recharge from precipitation in the Dravsko polje and Ptujsko polje aquifers as part of the larger Dravska kotlina water body. The objective of the research was to develop and present the first hydrogeological model of the interconnected Dravsko polje and Ptujsko polje aquifers as a basis for integrated management of both aquifers. A detailed overview of the hydrodynamic characteristics of the aquifers was prepared in order to develop a hydrogeological conceptual model that will serve as the foundation for the construction of a numerical groundwater flow and contaminant transport models. The results, along with the geometry of the aquifer and other BCs, can serve as an important input to the development of a numerical model for various contaminants. The model represents a part of the decision support system for groundwater management at national and local levels. Land use in the area under consideration is diverse, and there are considerable conflicts of interest related to various activities. The model provides the basis for an assessment of the qualitative and quantitative state of the water body, as well as for monitoring its changes due to climate change. The model facilitates the assessment of potential sources of pollution and the development of measures to improve groundwater quality. It provides support for groundwater management intended for water supply, irrigation, and other specific uses. The model also serves to verify the proper delineation of drinking water protection areas.
2. Materials and Methods
2.1. Study Area
2.1.1. Location and Climate of the Study Area
The study area includes two aquifers—
Dravsko polje and
Ptujsko polje—which are both part of the
Dravska kotlina water body (
Figure 1). Both aquifers are hydraulically connected.
The
Dravsko polje aquifer is located on the right bank of the Drava River. It covers an area of 293 km
2 and extends from Maribor in the north to Ptuj in the southeast and Slovenska Bistrica in the southwest. In general, it has the shape of a triangle between Maribor, Ptuj, and Pragersko. It is bordered by the Pohorje Massif to the west, Slovenske Gorice Hills to the east and north, and by Haloze and Dravinjske Gorice to the south. A supply canal for the Zlatoličje Hydro Power Plant runs parallel to the Drava River. In the town of Ptuj, the Drava flows into Lake Ptuj, an artificial lake from which the river continues to flow. The
Dravsko polje aquifer began to form in the Pleistocene when the Drava eroded tertiary sediments and began filling it with sediments. During this process, the Drava also eroded its own sediments, which can be seen in many terraces [
26]. There are four terraces; the highest of which is at an altitude of 270 metres. The two upper terraces are inclined towards Ptuj and have a slope of 1.8% [
27]. The
Dravsko polje graben is filled with Quaternary sediments [
26]. The sedimentology of the aquifer is heterogeneous and changes rapidly in the vertical direction. It is mostly composed of gravel and sand and contains layers and lenses of sand. In some areas, there are also clay deposits. Conglomerate is found mainly on the edges of the terraces.
The
Ptujsko polje aquifer is located on the left bank of the Drava River and extends between Ptuj and the town of Ormož. It borders the
Dravsko polje aquifer to the west and the
Ormoško polje aquifer to the east. It is bordered by the hills of Slovenske Gorice to the north and by the Drava River to the south. It has the shape of an elongated triangle with an area of about 91 km
2. The surface is slightly inclined to the east. The
Ptujsko polje aquifer is filled with Quaternary gravel deposits, the thickness of which varies from 4 m up to 22 m. The aquifer is composed of a very thin layer of gravel. The tertiary base of the Quaternary aquifer consists of conglomerate sand, clay and marl with very low permeability. In the vicinity of Lake Ptuj on the western border, the Ljutomer fault runs in the direction of SW to NE. Between Ptuj and the Ljutomer fault, the base of the Quaternary aquifer consists of Pliocene sediments. The rest of the area east of the fault base consists of Lower Pliocene and Miocene sediments. The tertiary base is strongly undulated [
26]. The most important watercourse in the
Ptujsko polje aquifer is the Drava River. It flows along the southern edge of the aquifer to Ormož. After the construction of the Formin Hydro Power Plant between Markovci and the town of Ptuj, the 5 km long and 1.2 km wide Lake Ptuj was created. A flood control dam was built along this artificial lake. When the Formin Hydro Power Plant was built, the
Ptujsko polje aquifer was subdivided by an 8.5 km long supply canal between Markovci and Formin and an 8 km long guide canal between Formin and the town of Ormož [
26].
The intersection between the two models is the area between the Drava River and Lake Ptuj (
Figure 1). Based on the flow budget of the
Drava polje aquifer, the total discharge below Lake Ptuj and the Drava River is the amount of groundwater that is expected to continue to flow from the
Dravsko polje into the
Ptujsko polje aquifer.
2.1.2. Geology and Hydrogeology of the Study Area and Geometry of the Aquifers
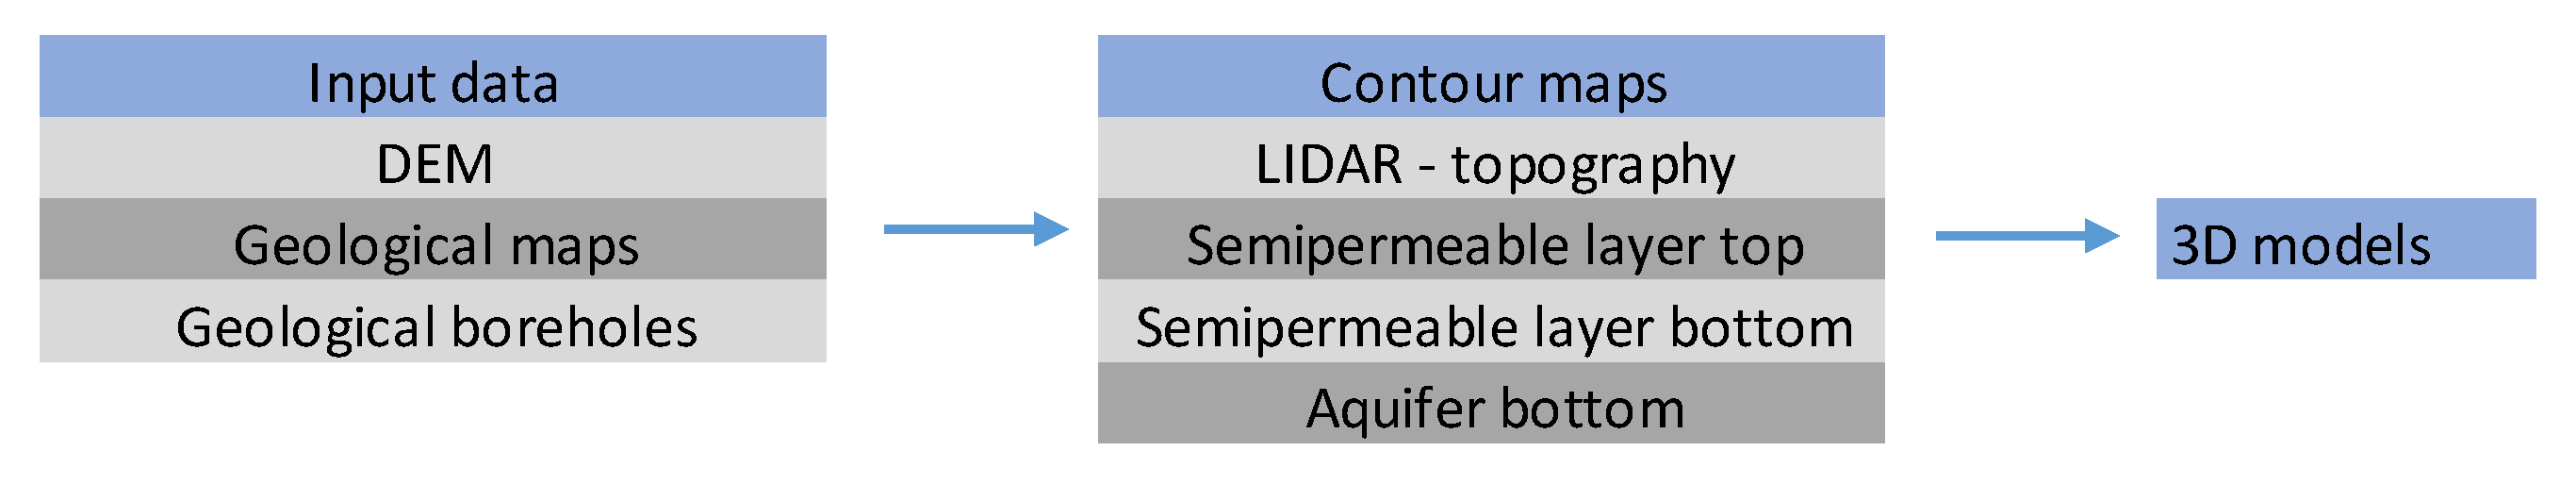
To describe the geometry of the bedrock of both aquifers (
Figure 2 and
Figure 3), we collected lithological data from the archives of the Geological Survey of Slovenia (GeoZS). Data were collected from 2510 boreholes drilled from Pleistocene sediments to the bedrock. The boreholes are spatially distributed throughout the study area, which allows a good definition of the geometry of the aquifer. The study area is crossed by a major fault—the Ljutomer fault. It was included in the bedrock model [
28,
29]. In the south of the model, the Ljutomer fault shows a slight faulting of the bedrock especially near the Drava River and Lake Ptuj. Both aquifers were treated as a single homogeneous layer consisting mainly of gravel and sand [
26]. The homogeneity of the aquifer was verified by a lithological model created using the JewelSuite software [
30]. We grouped the lithologic description of the sediments from the boreholes into seven categories (gravel; silt and clay with gravel; silt and clay; conglomerate; gravel, clay, silt; humus and bedrock). The subsurface was drawn using the ESRI ArcMap software with lithologic data obtained from the boreholes and expertise on the study area. Sequential Indicator Simulation (SIS) was used to interpolate the defined lithological units in the 3D model. The model extends from the surface (defined by a digital elevation model) to the bedrock of the Quaternary aquifer. Sequential Indicator Simulation is a stochastic interpolation method based on Juang et al. [
31]. For the surface layer, the data from LIDAR were used as Slovenia is completely covered by LIDAR. The models are set to cells with a size of 100 × 100 m. In both models, we used a porosity value of 0.15, which is typical for porous aquifers.
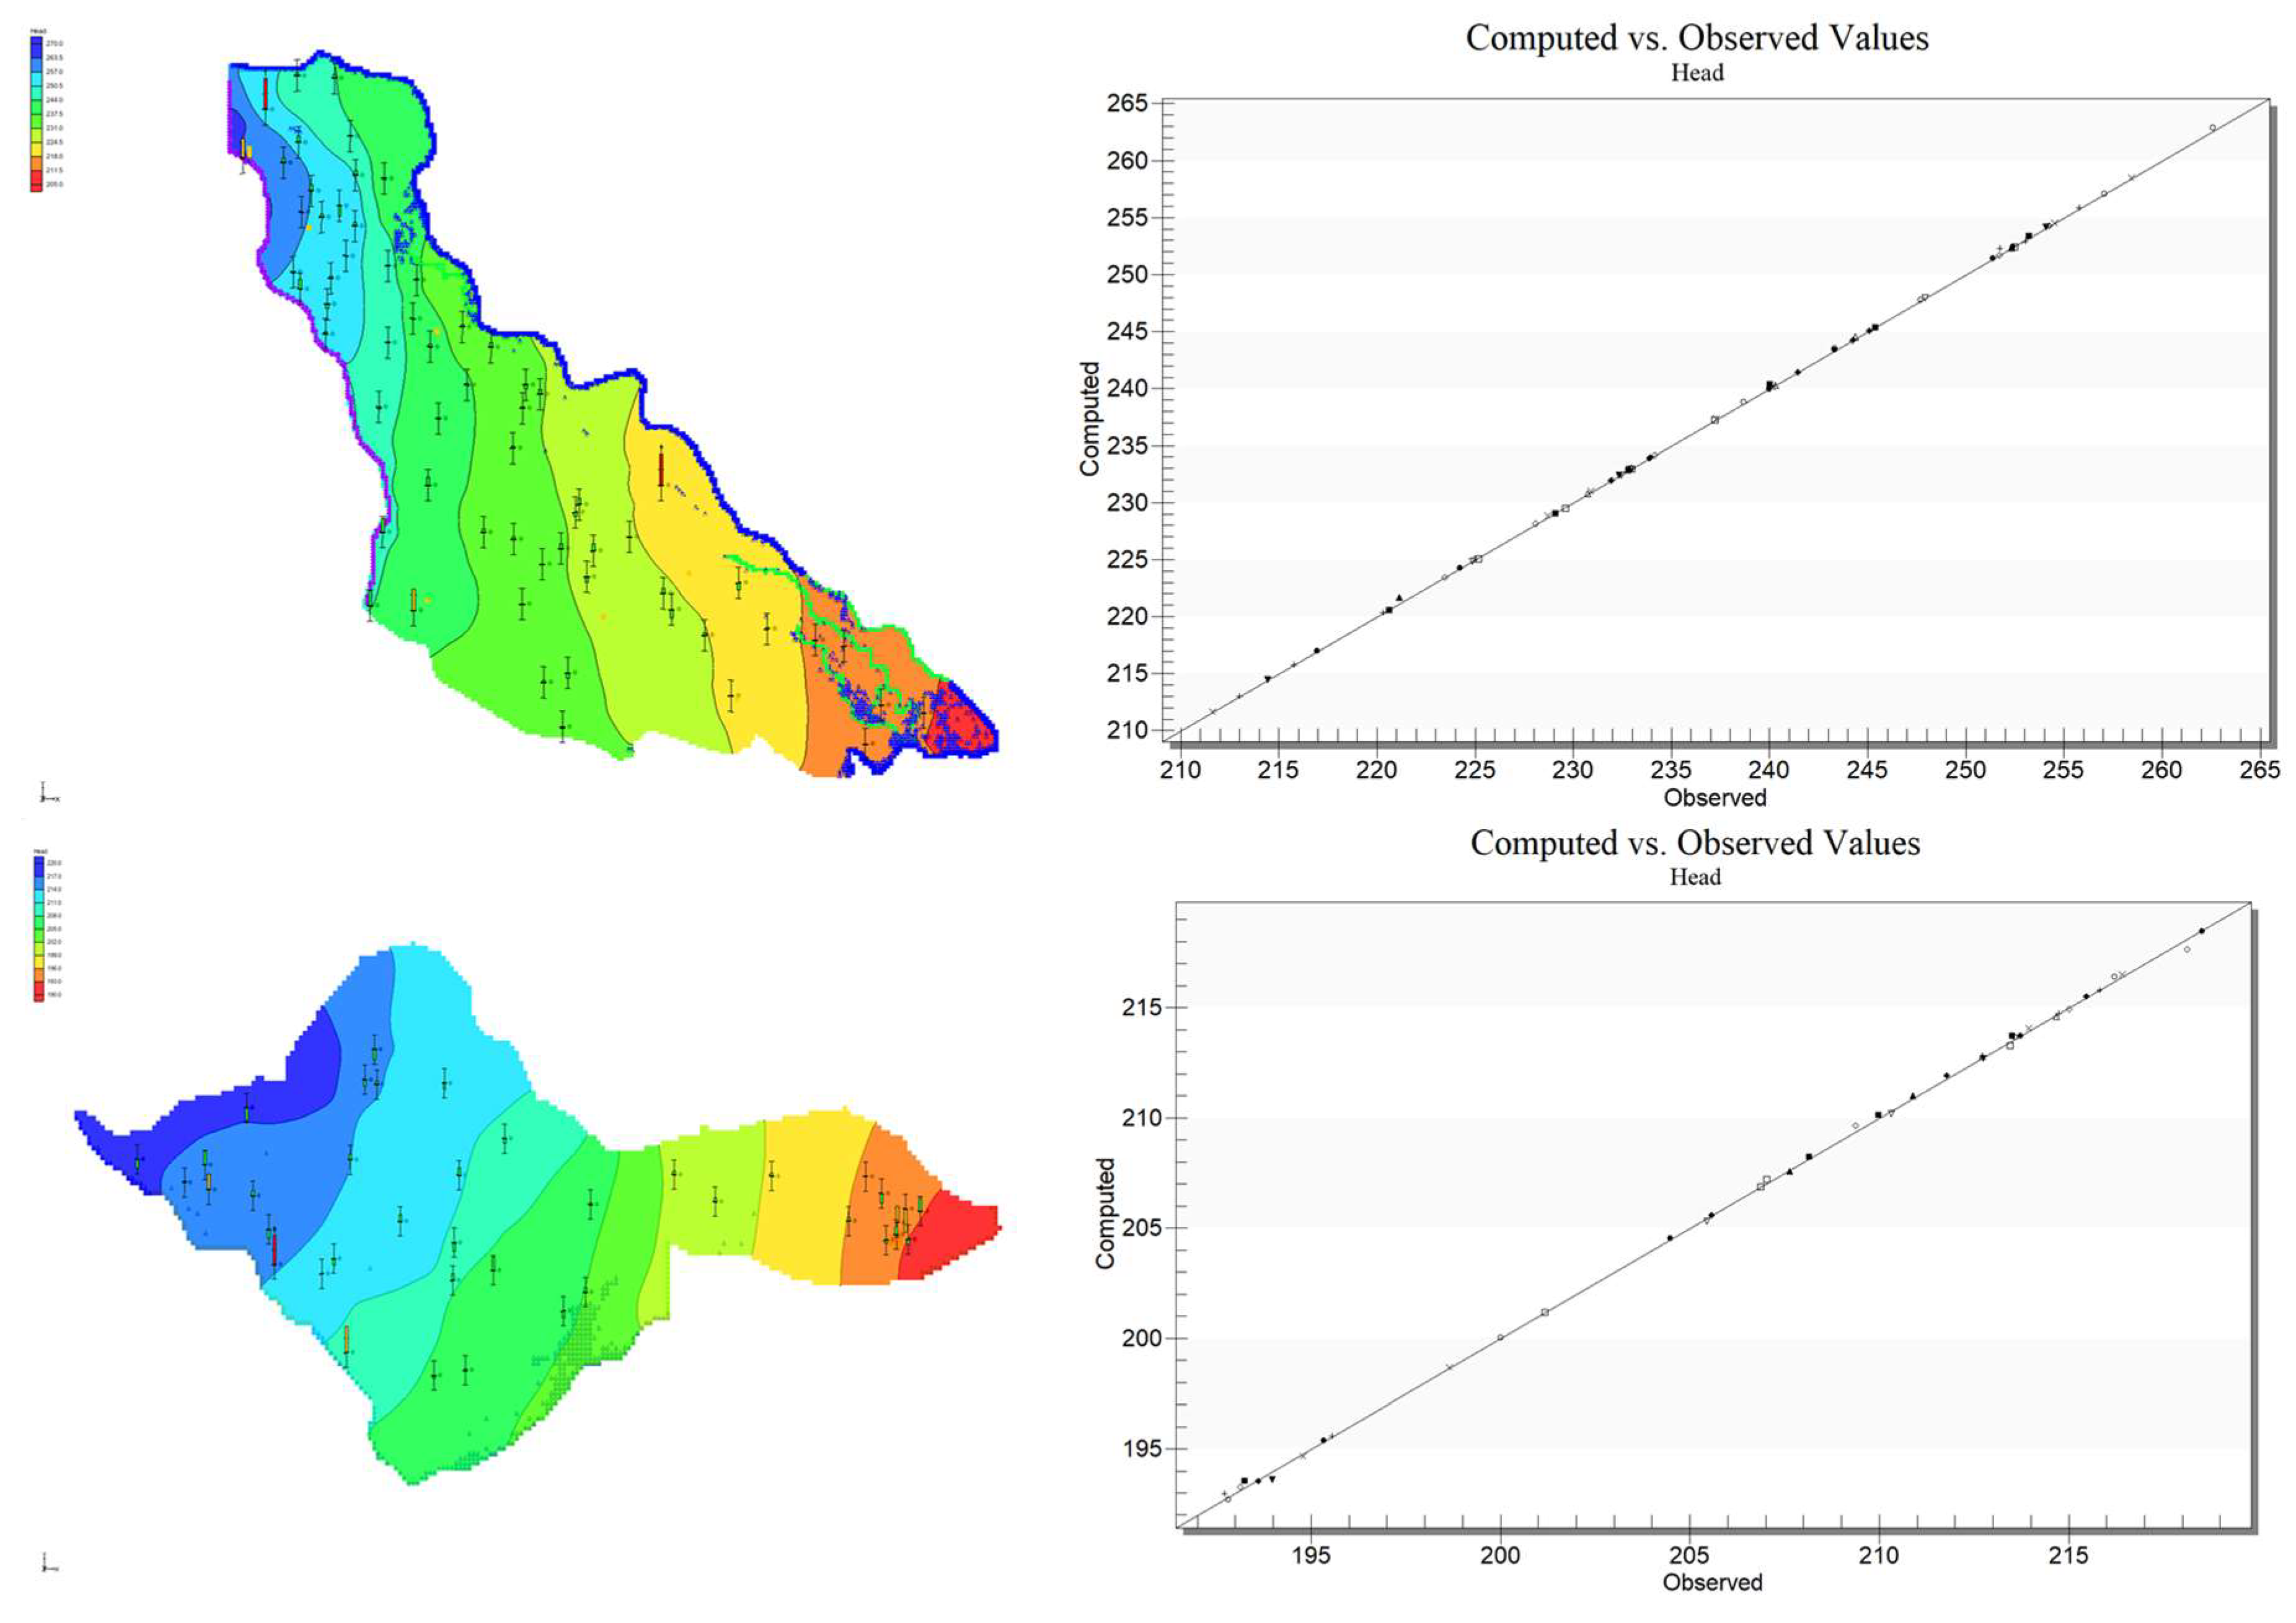
2.2. Groundwater Flow System and Groundwater Level Monitoring
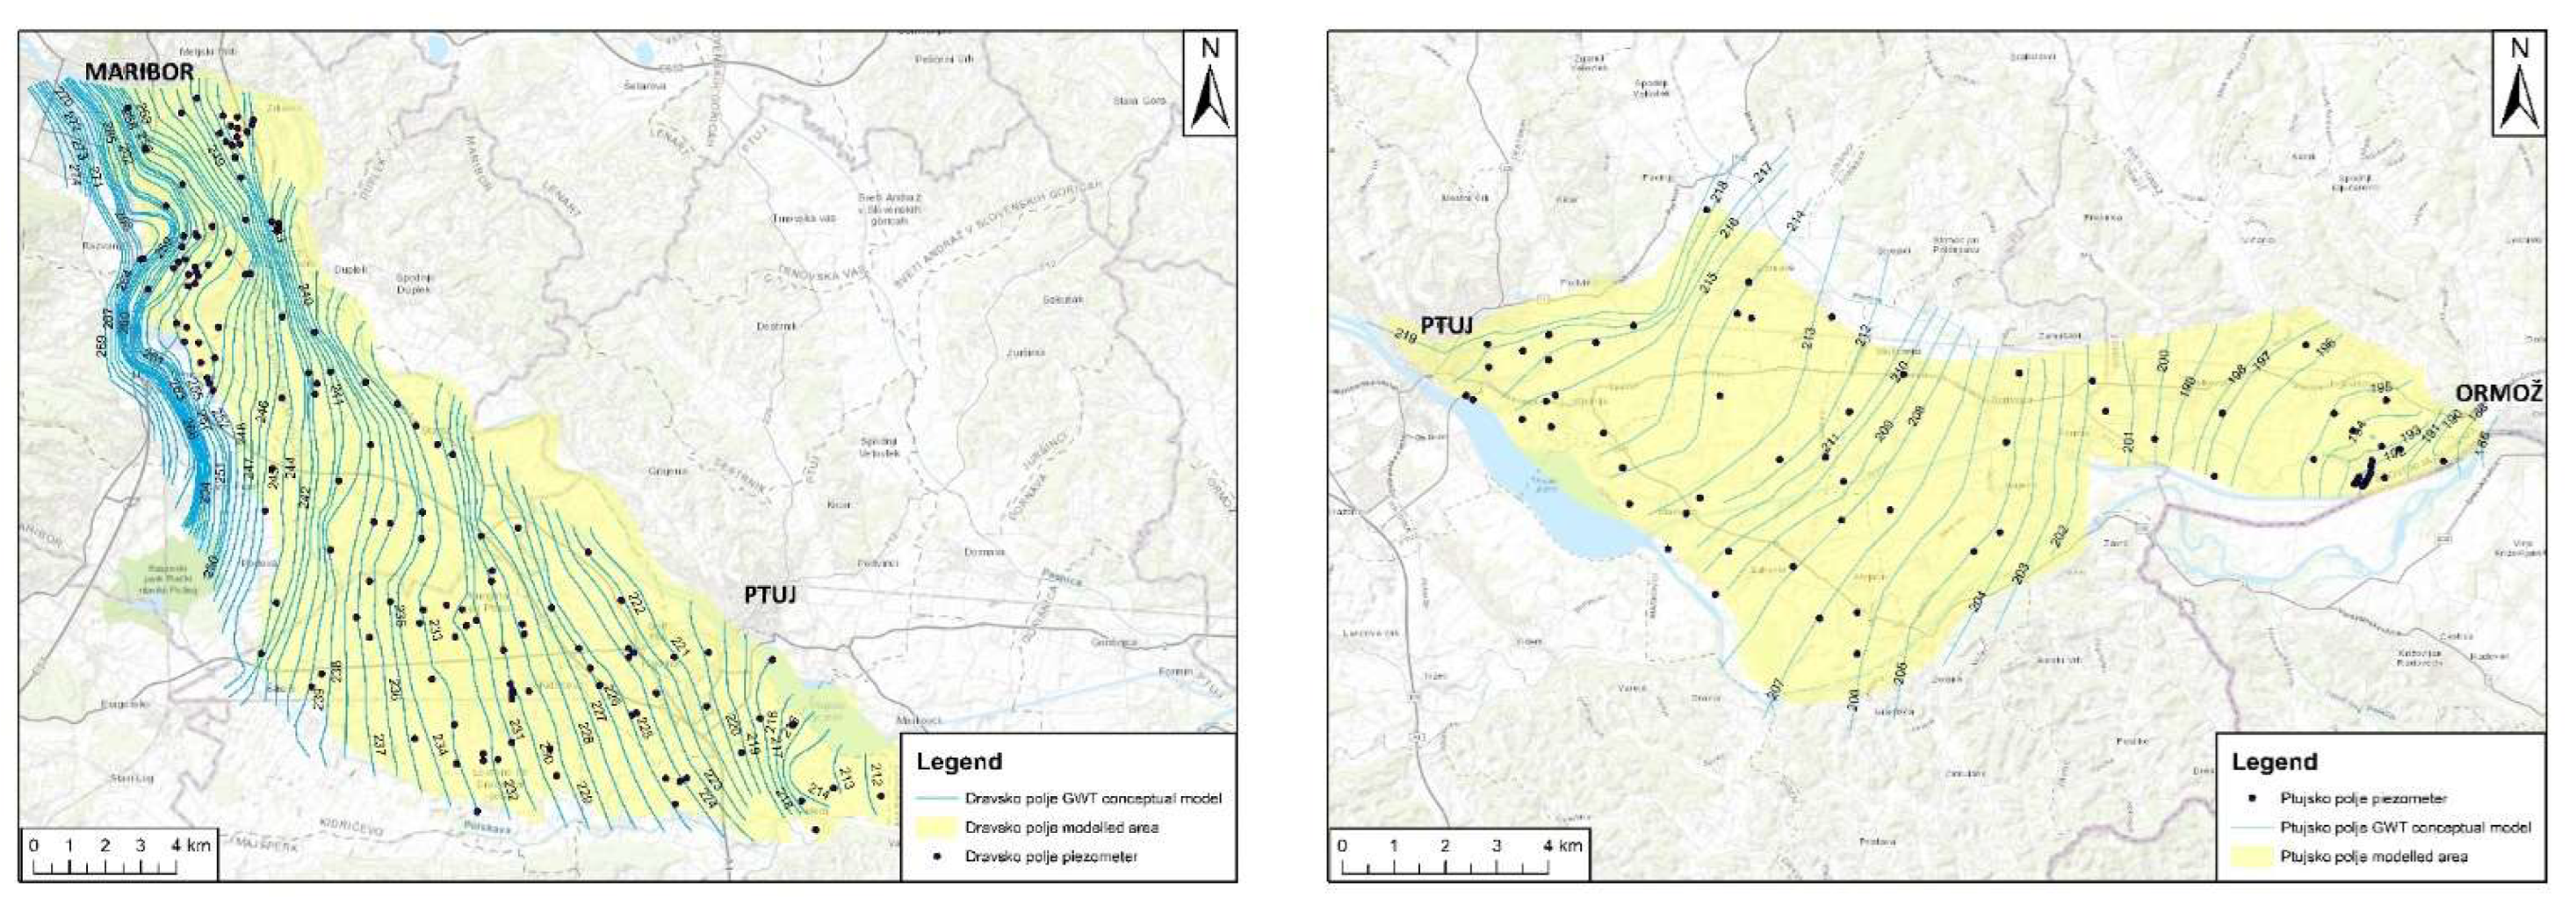
The groundwater level (GWL) and the upper and lower layers of the model were unified for both models. Based on the measured GWL values of 152 wells in the
Dravsko polje aquifer and 86 wells in the
Ptujsko polje aquifer, a GWL map was created using ArcGis software. In addition, the modelled GWLs were compared with the measured (observed) values. For the
Dravsko polje aquifer, most of the data available were collected between 21 and 25 November 2012, so the GWL map was created for November 2012 (
Figure 4). For the
Ptujsko polje aquifer, most of the data available were collected on 20 March 2015 (
Figure 4). For these dates, a medium water level is characteristic.
2.3. Groundwater Recharge Estimation
The groundwater of the
Dravsko polje aquifer is recharged by infiltration of streams from the Pohorje Massif and by infiltration of precipitation. The
Dravsko polje aquifer is not homogeneous; moreover, the differences in the way it is recharged are so vast that it was divided into three hydrogeological units, as described by [
26]. Each of these units has a separate precipitation margin and a well-defined regime of groundwater recharge and discharge. The first unit covers the north-western part of the territory, which is mainly urbanised. It includes the foothills of the Pohorje Massif of the
Radvanjski potok and
Razvanjski potok creeks. In the south, it is bounded by the surface ridge of the
Razvanjski potok creek ridgeline and the underground ridge extending from Bohova to Dogoše. In this unit, groundwater flow is quite low due to the small precipitation catchment area and the low thickness of the aquifer. The second hydrogeological unit includes part of the
Dravsko polje aquifer between Bohova and Dogoše in the north and Hotinja vas, Dravski Dvor and Starše in the south of the
Dravsko polje aquifer. It also includes the hilly outskirts of the
Pivolski potok,
Hočki potok, and
Polanski potok creeks. Groundwater from the second unit of the
Dravsko polje aquifer is discharged into the Miklavž Spring and the Drava River.
The third and largest hydrogeological unit includes the hilly outskirts of the
Rački potok creek and the middle part of the
Dravsko polje aquifer from the border of the Pohorje Massif in the west to the Drava River in the north-east and the Polskava River in the south. Groundwater is discharged from the Pohorje Massif towards the Zlatoličje Canal and the Hajdina and Pobreš springs [
32].
The area is largely covered by agricultural land (44%), followed by forested land (20%) and urban (populated) areas, which represent sources of both urban and industrial pollution (19%), while the rest of the area is covered by meadows. Surface activities are also reflected in the quality of the groundwater.
Most of the recharge volume is provided by infiltration of precipitation. The average annual amount of precipitation is between 800 and 1000 mm/year. The long-term mean annual groundwater recharge is estimated at 300–450 mm [
33], including evapotranspiration. To determine the long-term mean precipitation, we selected two monitoring stations: one in the north (Maribor—Airport) and one in the south (Ptuj) of the study area (
Figure 4). The year with the highest precipitation was 1972 with 1284 mm/year (Ptuj).
Approximately one-third of the average annual precipitation is infiltrated and discharged into the Drava River. The recharge rate of the Quaternary aquifer is estimated at 3 m
3/s [
34]. Thus, groundwater discharge equals 2 m
3/s and direct recharge equals 0.8 m
3/s. Surface runoff accounts for the smallest share of the average annual precipitation volume, and about 41% is infiltrated by precipitation (27–47%) [
34]. In general, the
Dravsko polje aquifer has good hydraulic conductivity, ranging from about 68 to 790 m/day [
26].
The
Ptujsko polje aquifer is recharged mainly by precipitation and partly by the Drava River. Groundwater discharges into numerous springs called Zvirenčine at the foot of the high Quaternary gravel terrace. The town of Ormož is supplied with drinking water from the wells in the eastern part of the
Ptujsko polje aquifer. The supply canal, which belongs to the Formin Hydro Power Plant, affects the groundwater only to a small extent, as all necessary measures were taken to prevent the canal from polluting the groundwater. This canal is sealed only on the eastern side of the
Ptujsko polje aquifer at a distance of 6 km from Formin in the direction of the town of Ormož to the tertiary base. However, the last 2 km are permeable, allowing water to drain into the Drava River. GWL fluctuations are caused mainly by precipitation and partly by the natural flow of the Drava. Groundwater discharges into the Drava and into springs located along the Drava. The discharge of groundwater into the Drava River is significant for the part after the confluence of the Dravinja River with the Drava River. Before the Dravinja flows into the Drava, an equilibrium is reached between the river and the groundwater, so that it is neither drained nor dammed [
35].
In the eastern part between the village of Formin and the town of Ormož, the groundwater no longer flows evenly, as the Formin supply canal is sealed up by the non-permeable tertiary base. Therefore, the groundwater flow is divided into the southern and northern parts of the Formin supply canal. In the northern part, groundwater flows in a W-E direction and discharges into the Drava River, with the last 2 km of the canal being permeable again. Only precipitation has an influence on GWL fluctuation. In this part, water is tapped for the fresh water supply of the town of Ormož. In the southern part of the canal, GWL fluctuation is influenced both by precipitation and the Drava River.
2.4. Conceptual Models of the Study Area
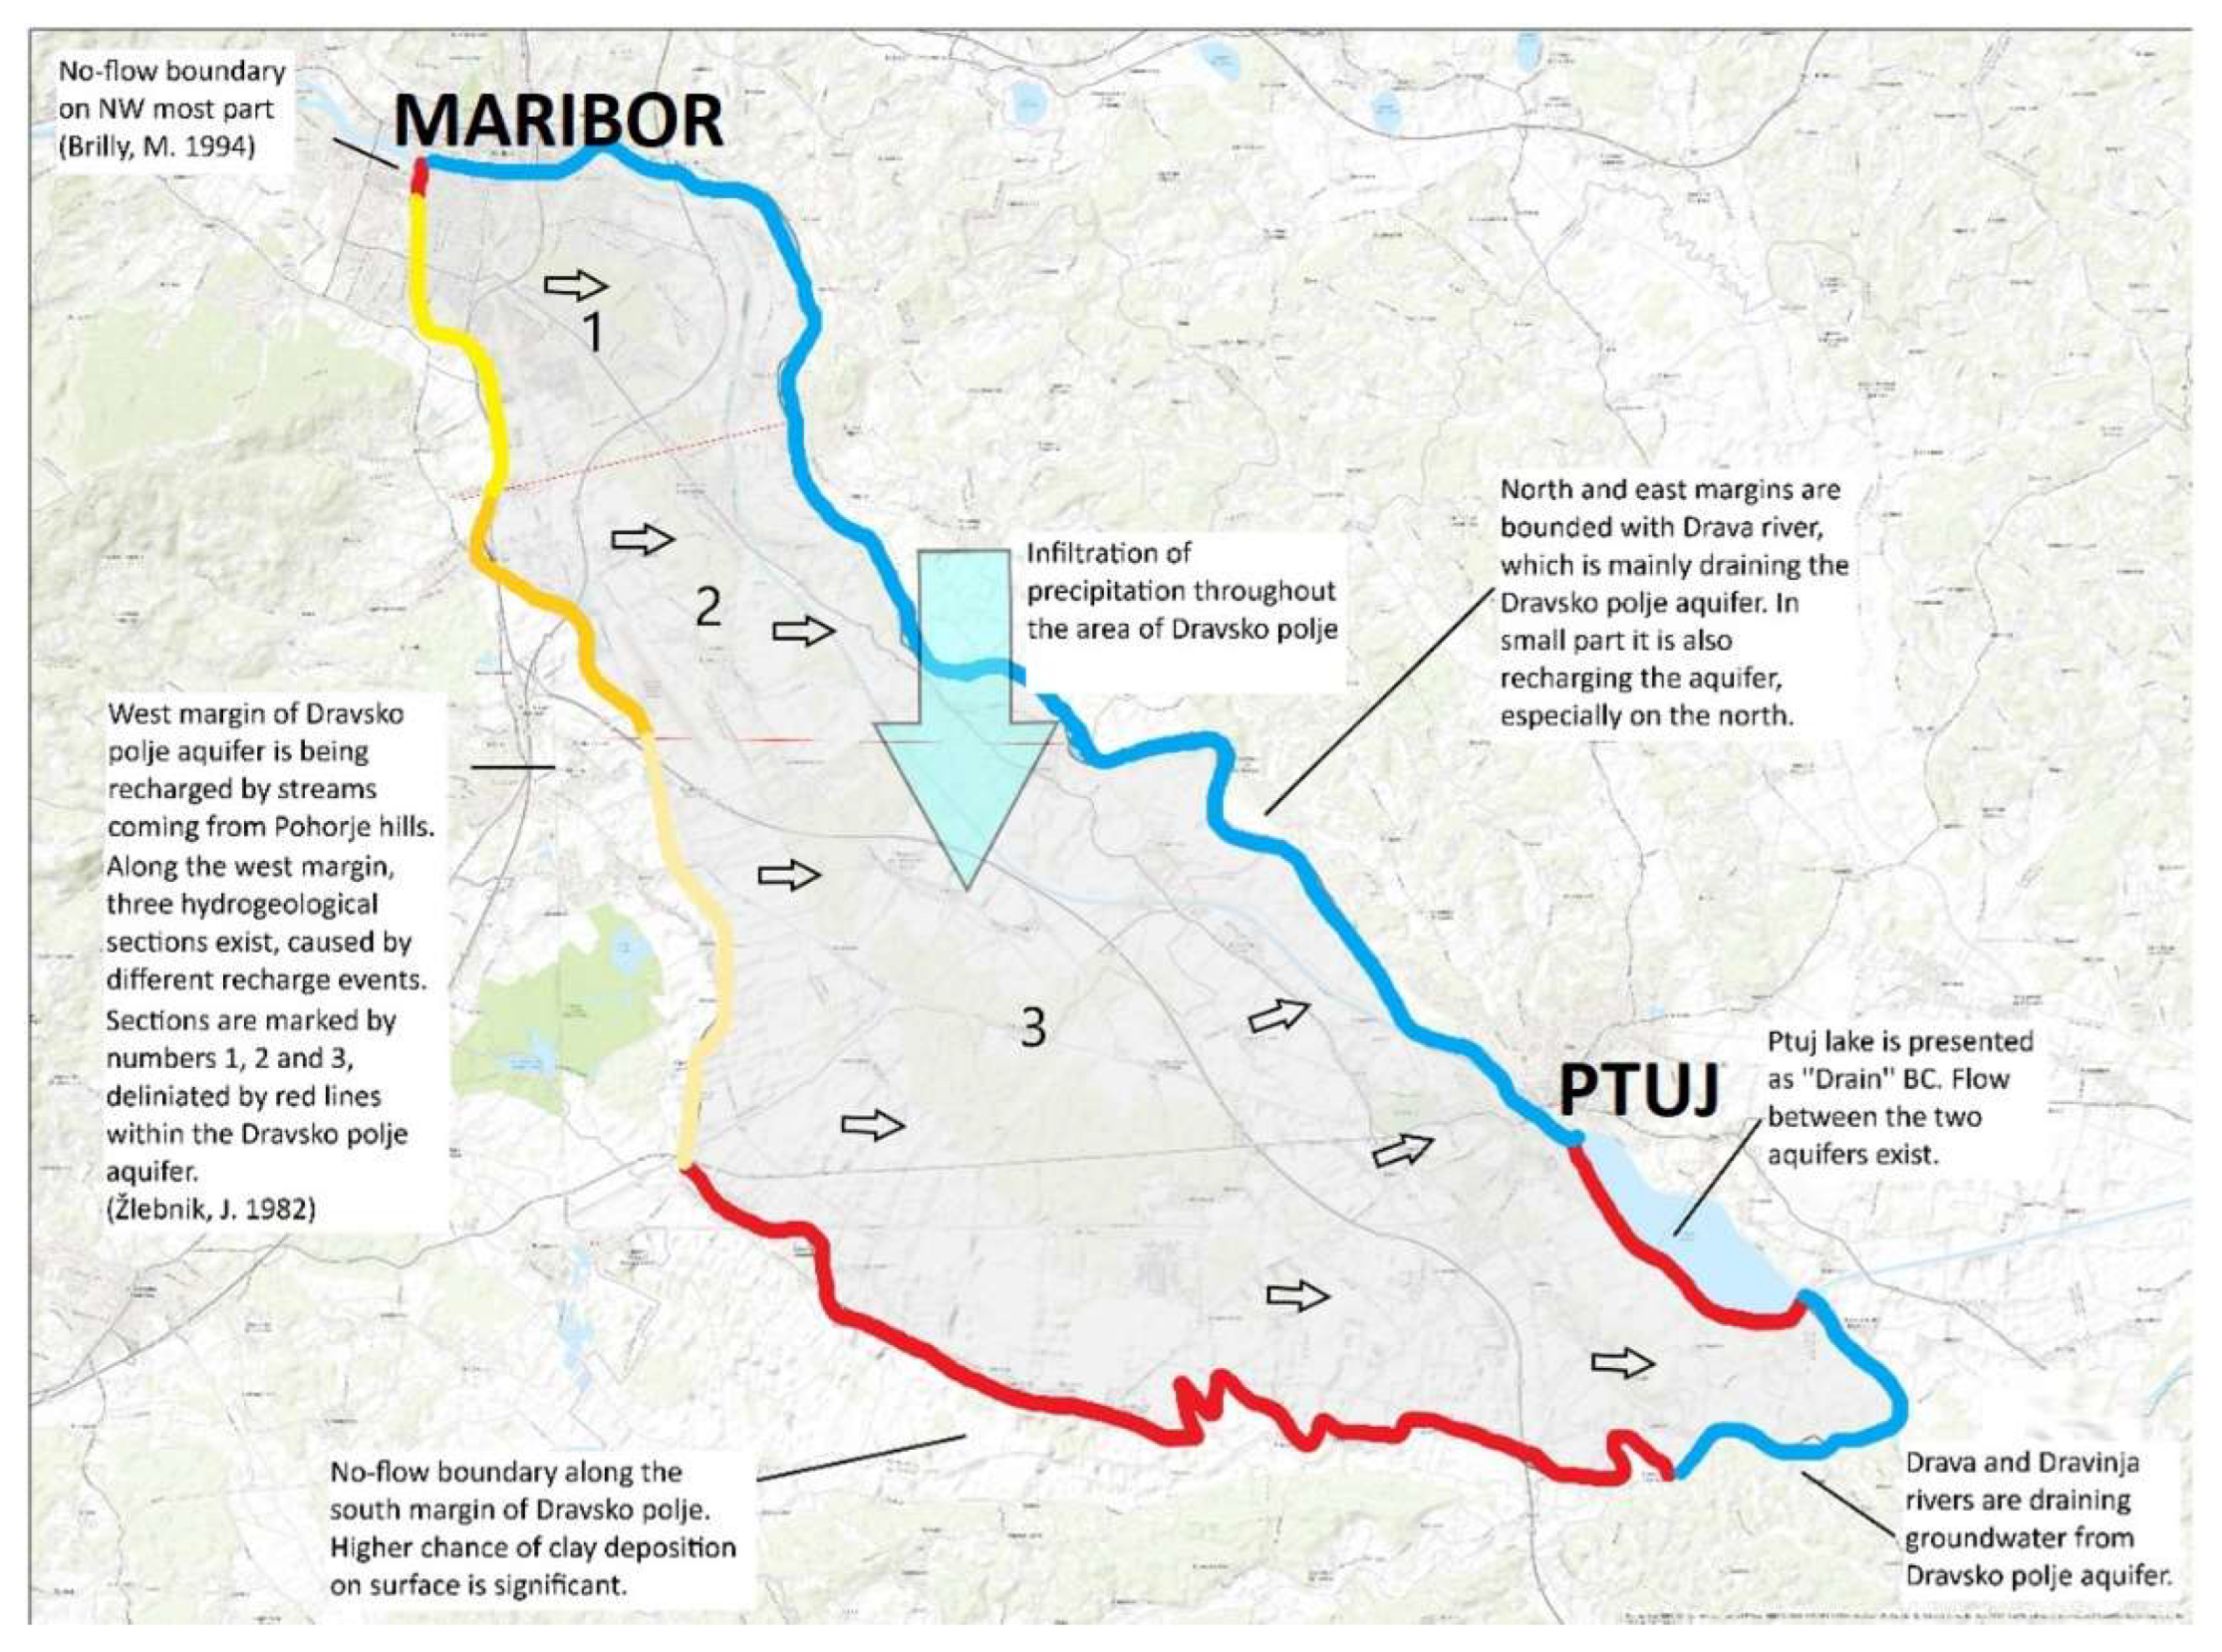
The modelled area of the
Dravsko polje aquifer is bounded along the western edge by the ‘Specified head’ BC, which enables a constant flow from the Pohorje Massif to the
Dravsko polje aquifer. The constant head corresponds to the GWL and is divided into three sections (
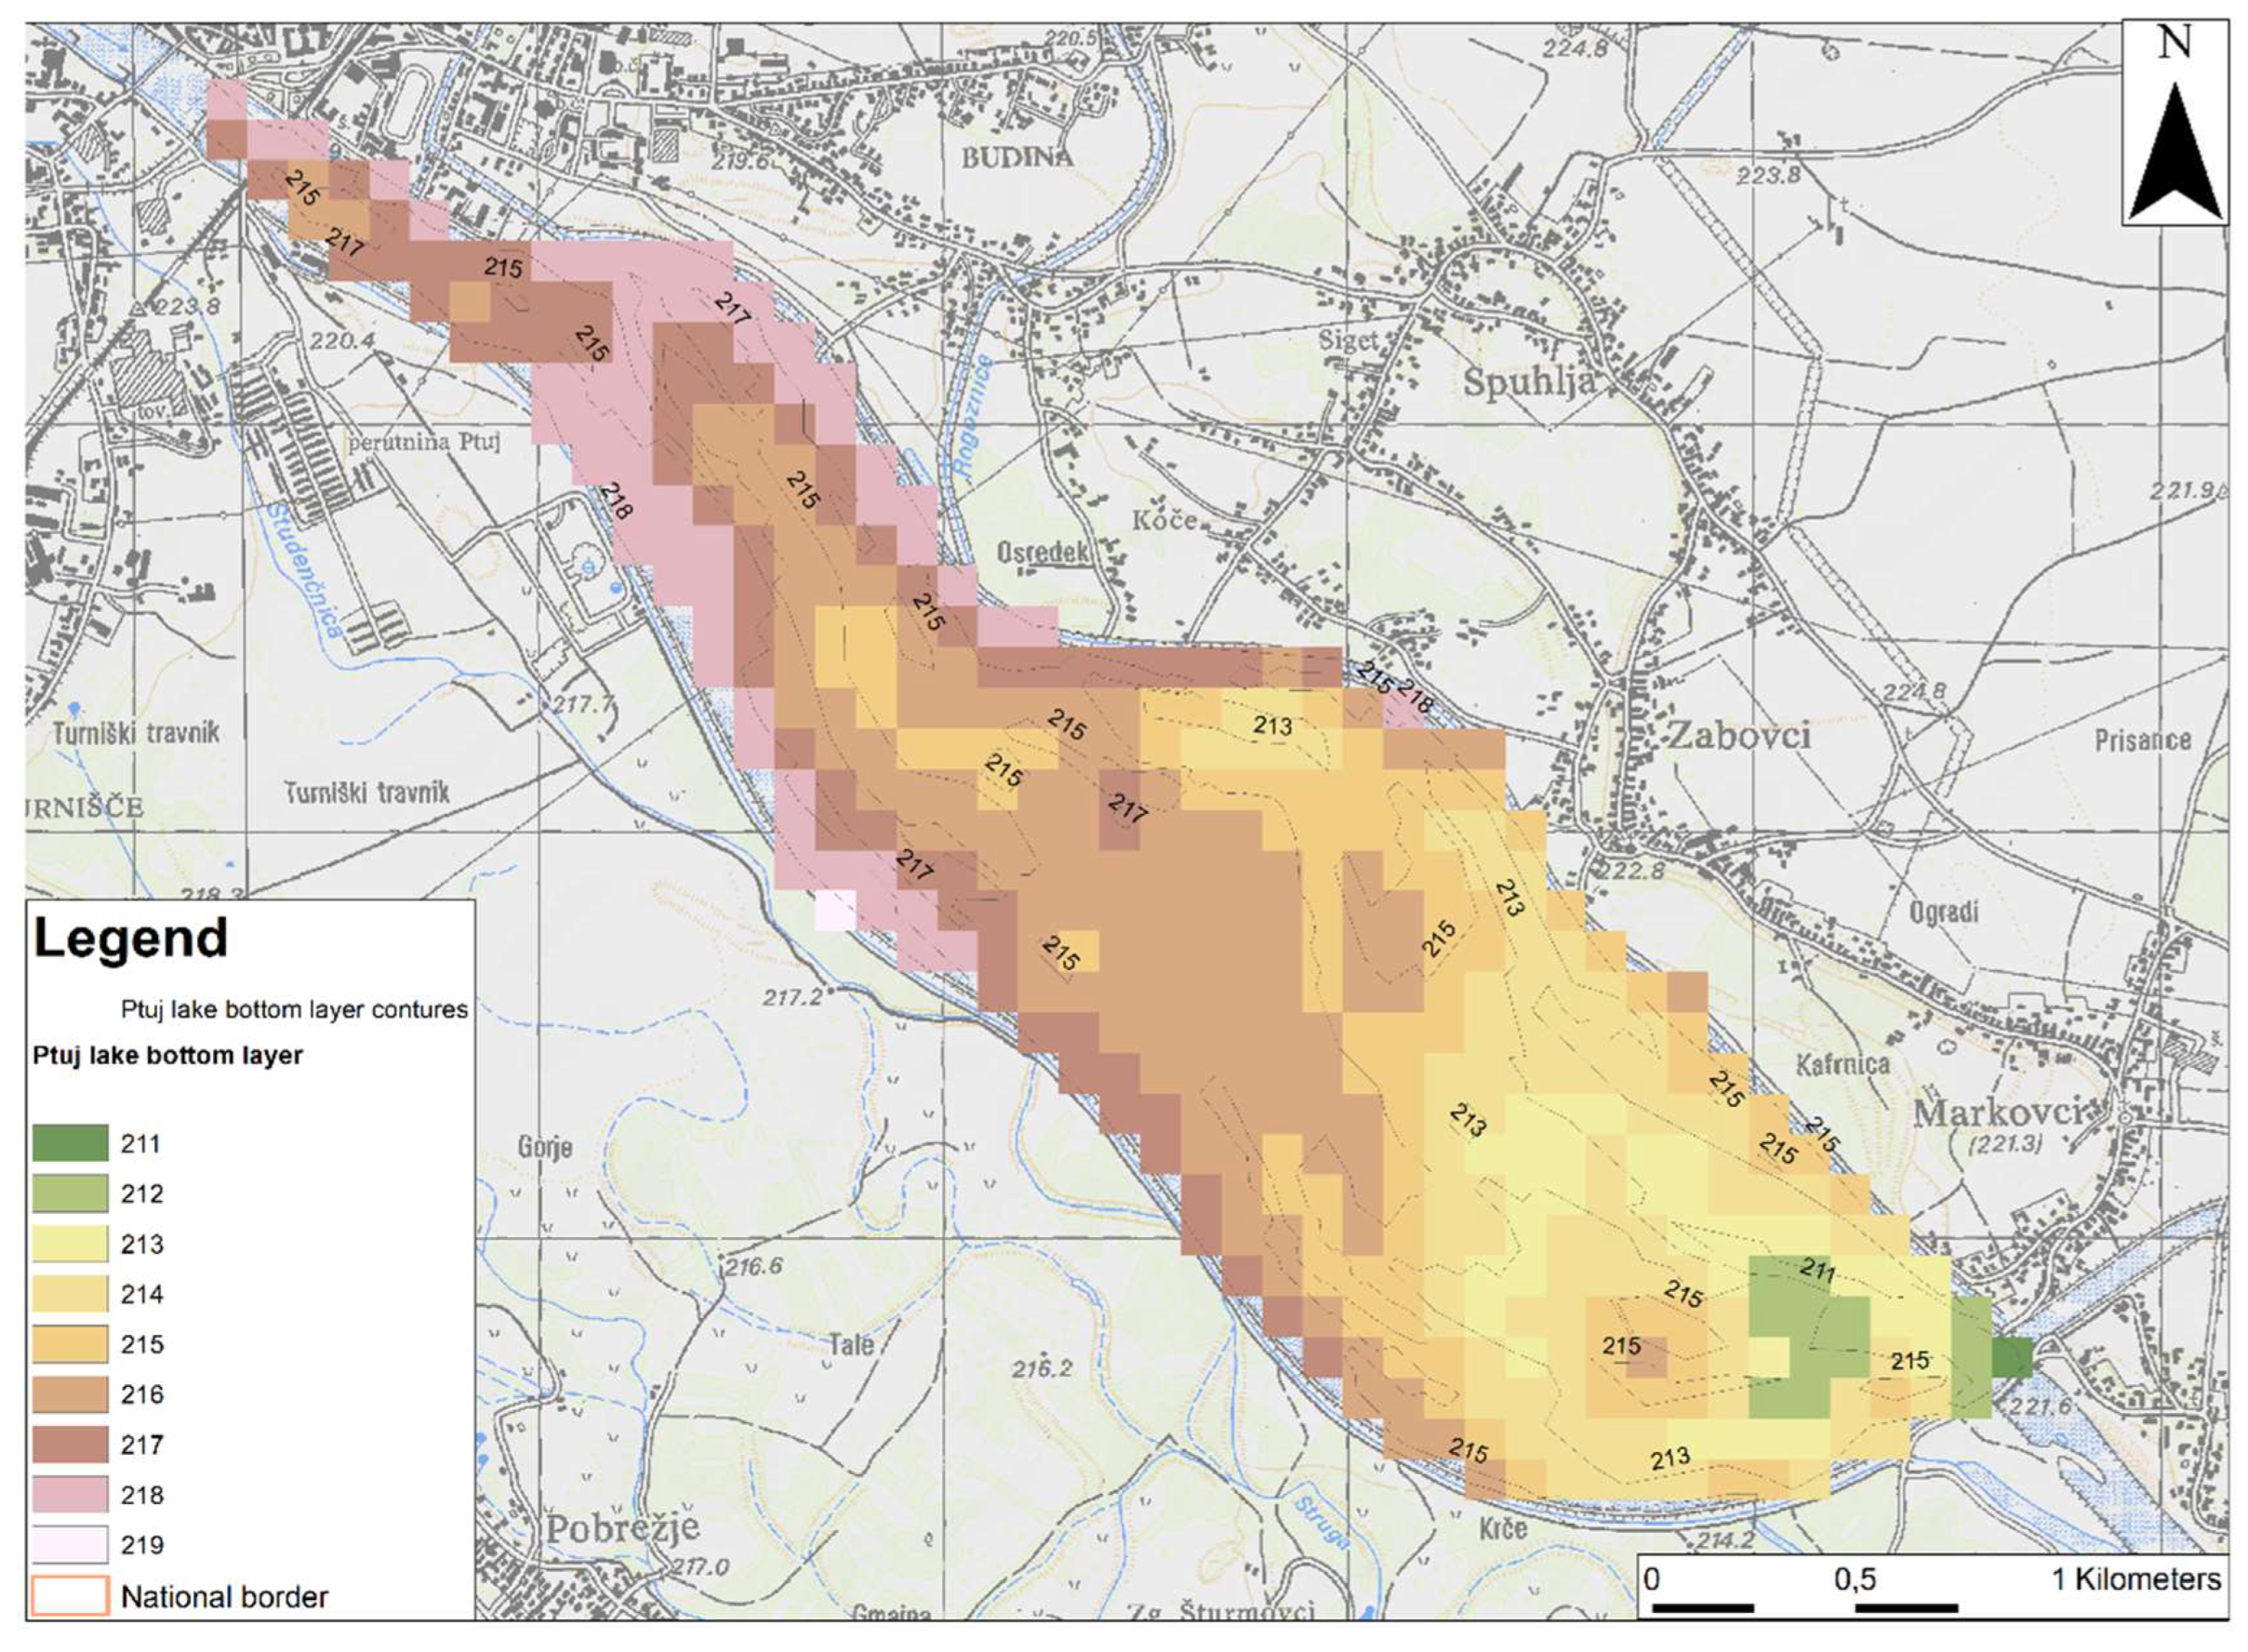
Figure 5). From the north to the edge of the south-east, the groundwater flow is determined by two BCs: ‘Drain’, where the groundwater flows further down or into Lake Ptuj, and ‘River’, where the Drava and Dravinja rivers are located. The ‘Drain’ stage corresponds to the lower layer of the lake, where the groundwater is higher than the bottom layer of the lake. This is an indication that the groundwater flow exists between the tertiary bottom and the lake bottom. The bottom layer of the lake is shown in
Figure 6. It was adapted from [
36], which contains an image of the bottom layer, and redrawn using ArcMap.
Figure 5.
Conceptual model of the
Dravsko polje aquifer, Žlebnik, L. [
26], Brilly, M. [
37].
Figure 5.
Conceptual model of the
Dravsko polje aquifer, Žlebnik, L. [
26], Brilly, M. [
37].
The approximate groundwater flow beneath the lake was calculated based on Darcy’s flow for unconfined aquifers. Most of the groundwater is discharged into streams. However, groundwater discharge is substantial in the northern part of the river. The ‘River’ BC was based on the GWL map; the southern and south-western parts have a ‘No-flow’ BC. Infiltration of precipitation into the
Dravsko polje aquifer is 300 mm/yr as ‘Recharge’ BC [
38].
Near the eastern edge of the aquifer and in the south-east, there are two drainages that drain a small amount of groundwater. The model includes 7 pumping fields with a total of 10 wells (Betnava: 40 m
3/day, Dobrovce: 60 m
3/day, Šikole: 44.5 m
3/day, Skorba: 135.5 m
3/day, Kidričevo: 183 m
3/day, Lancova vas: 15.5 m
3/day, Bohova: 50 m
3/day). The total pumping capacity is 528.5 m
3/day. The porosity of the entire model was set to 0.15, as is typical for porous aquifers. The approximate values of water balance were estimated from data in the literature (
Table 1).
The conceptual model for the
Ptujsko polje aquifer is shown in
Figure 7. Infiltration by precipitation is described as ‘Recharge’ BC. A negligible amount of surface water from streams infiltrates from the hills of Slovenske Gorice along the northern edge of the aquifer. Therefore, to simplify the model, the northern edge of the aquifer was defined as a basin with a no-flow BC.
In the eastern part of the aquifer between the village of Formin and the town of Ormož, the supply canal leading to the Formin Hydro Power Plant represents an impermeable boundary, as it is sealed by the impermeable tertiary base of the Quaternary aquifer. However, the last 2 km of this canal are permeable and here, the groundwater is discharged into the Drava River. The eastern part of the Ptujsko polje aquifer is also permeable and allows groundwater to discharge into the Ormož polje aquifer. Therefore, the canal between the village of Formin and the town of Ormož is without discharge except for the last two kilometres. In the western part of the aquifer, groundwater is discharged mainly into the Drava River. In our model, the Drava was described as ‘River’ BC. The head stage of the River BC was based on the GWL map. On the west side between Ptuj and Markovci, artificial Lake Ptuj was represented as ‘Specified Flow’ BC. The recharge rate below the lake was taken from the model of the Dravsko polje aquifer, as we assumed that the same amount of groundwater flows from the Dravsko polje aquifer into the Ptujsko polje aquifer.
The Pesnica River flows through the
Ptujsko polje aquifer towards
Ormoško polje. It was neglected, as the amount of water infiltrating into the groundwater is low due to clay deposits at the bottom of the riverbed. In the eastern part of the
Ptujsko polje aquifer, the
Sejanica pri Mihovcih pumping station supplies drinking water to the town of Ormož. The water is pumped from 16 pumping wells. However, to avoid depletion of the aquifer, the groundwater is recharged by 5 infiltration fields, where surface water from the canal is infiltrated into the groundwater. The recharge rates are shown in
Table 2 and
Table 3.
Table 4 shows the groundwater balance of the
Ptujsko polje aquifer.
2.5. Numerical Models and Boundary Conditions (BCs)
Numerical groundwater modelling was performed using the Groundwater Modelling System (GMS 10.1.3) based on MODFLOW 2000, a comprehensive graphical user environment developed by Aquaveo. GMS is compatible with GIS -based graphical pre-processing tools to automate and streamline the modelling process for the conceptualisation and implementation of groundwater flow simulations. The GMS system consists of a graphical user interface (the GMS software) and a number of modelling codes (MODFLOW, MT3DMS, etc.) that provide tools for each phase of groundwater simulation, including site characterisation, model development, calibration, post-processing, and visualisation. GMS supports the appropriate ArcMap version as well as finite difference and finite element models in 2D and 3D, including MOD-FLOW 2000, MODPATH, MT3DMS/RT3D, SEAM3D, FEMWATER, PEST, UTEXAS, MODAEM, and SEEP2D [
39].
The Dravsko polje and Ptujsko polje aquifer models were designed separately. First, conceptual models were created for each area, and then, two numerical models were designed using Modflow 2000. Groundwater flow was modelled with Modflow 2000 using the finite difference method, which uses cell-centred saturated flow. The finite difference method (FDM) is a method used to solve differential equations that are difficult or impossible to solve analytically. In both cases, steady-state models were created. The units describing the flow between the cells are L for unit length and T for unit time. The groundwater flow in the model was calculated using Darcy’s law.
The three-dimensional movement of groundwater with constant density through porous earth material may be described by the partial-differential equation:
where:
,
,
—values of hydraulic conductivity along x, y, and z coordinate axes, which are assumed to be parallel to the main axes of hydraulic conductivity, h—hydraulic head
, q—volumetric flux per unit volume representing sources and sinks of water, with q < 0 for the flow out of the groundwater system, and q > 0 for the flow into the system
,
—is the specific storage of the porous media
, t—time
.
In general,
,
,
and
are functions of space, and q is a function of space and time. Equation (1) describes groundwater flow under non-equilibrium conditions in a heterogeneous and anisotropic medium. The main axes of hydraulic conductivity are aligned with the coordinate directions. Unless the system is very simple, an analytical solution is possible, but usually numerical methods must be used to solve this equation. One approach is the finite difference method, in which the space is described with elements having predetermined head values at the centre of each element. The solution provides the head values at specific points and times [
40].
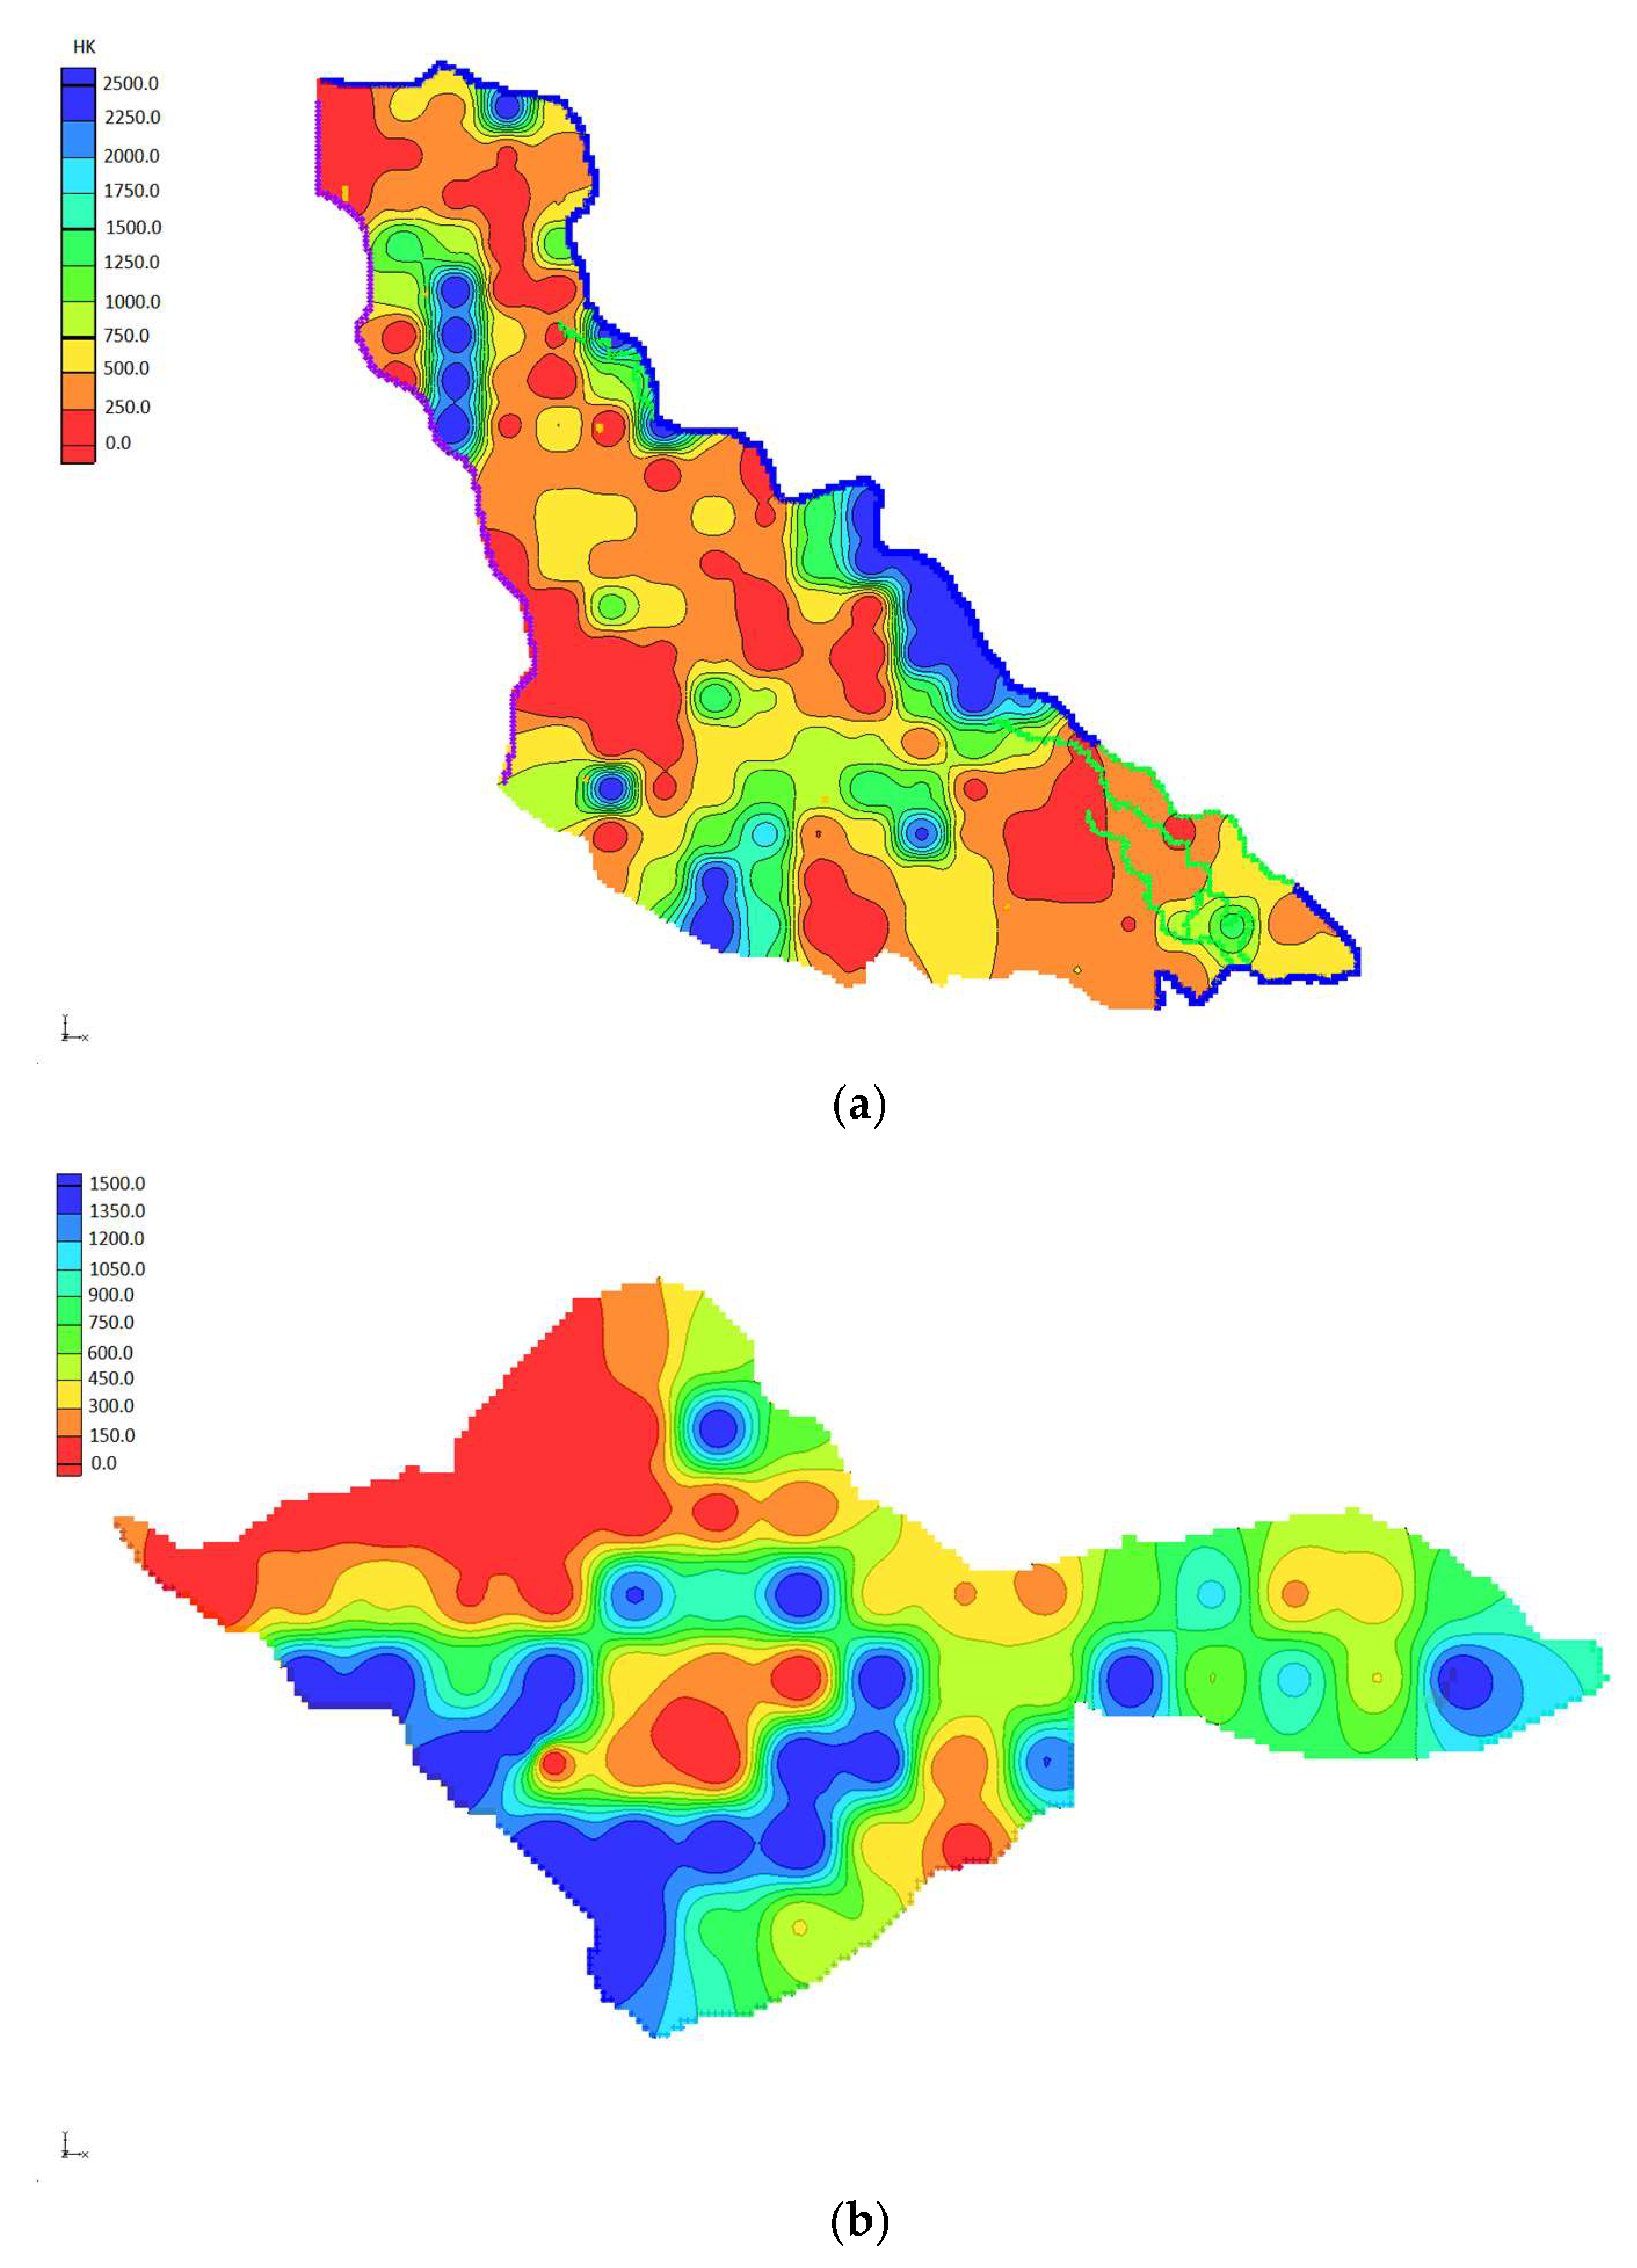
In our model, we used the PEST tool to calibrate hydraulic conductivity and hydraulic heads between the measured and modelled data (hydraulic conductivity with a range from k = 0.01 m/s to k = 1 × 10⁻⁹ m/s and recharge from precipitation). The purpose of PEST (parameter estimation) is to assist in data interpretation, model calibration, and predictive analysis.
2.6. Validation of the Modelled Data
The Nash–Sutcliffe [
41] efficiency coefficient was used to validate the modelled data. It indicates how well the measured and the simulated data match. The range of the efficiency coefficient is between minus infinity, which corresponds to a very poor model, and 1. The closer the coefficient is to 1, the better the modelled results. The following equation is used:
where:
—coefficient of efficiency [/];
—measured parameter [];
—modelled parameter [];
—mean measured parameter [].
The calibration is considered successful if the error between the modelled and the measured data is minimal.
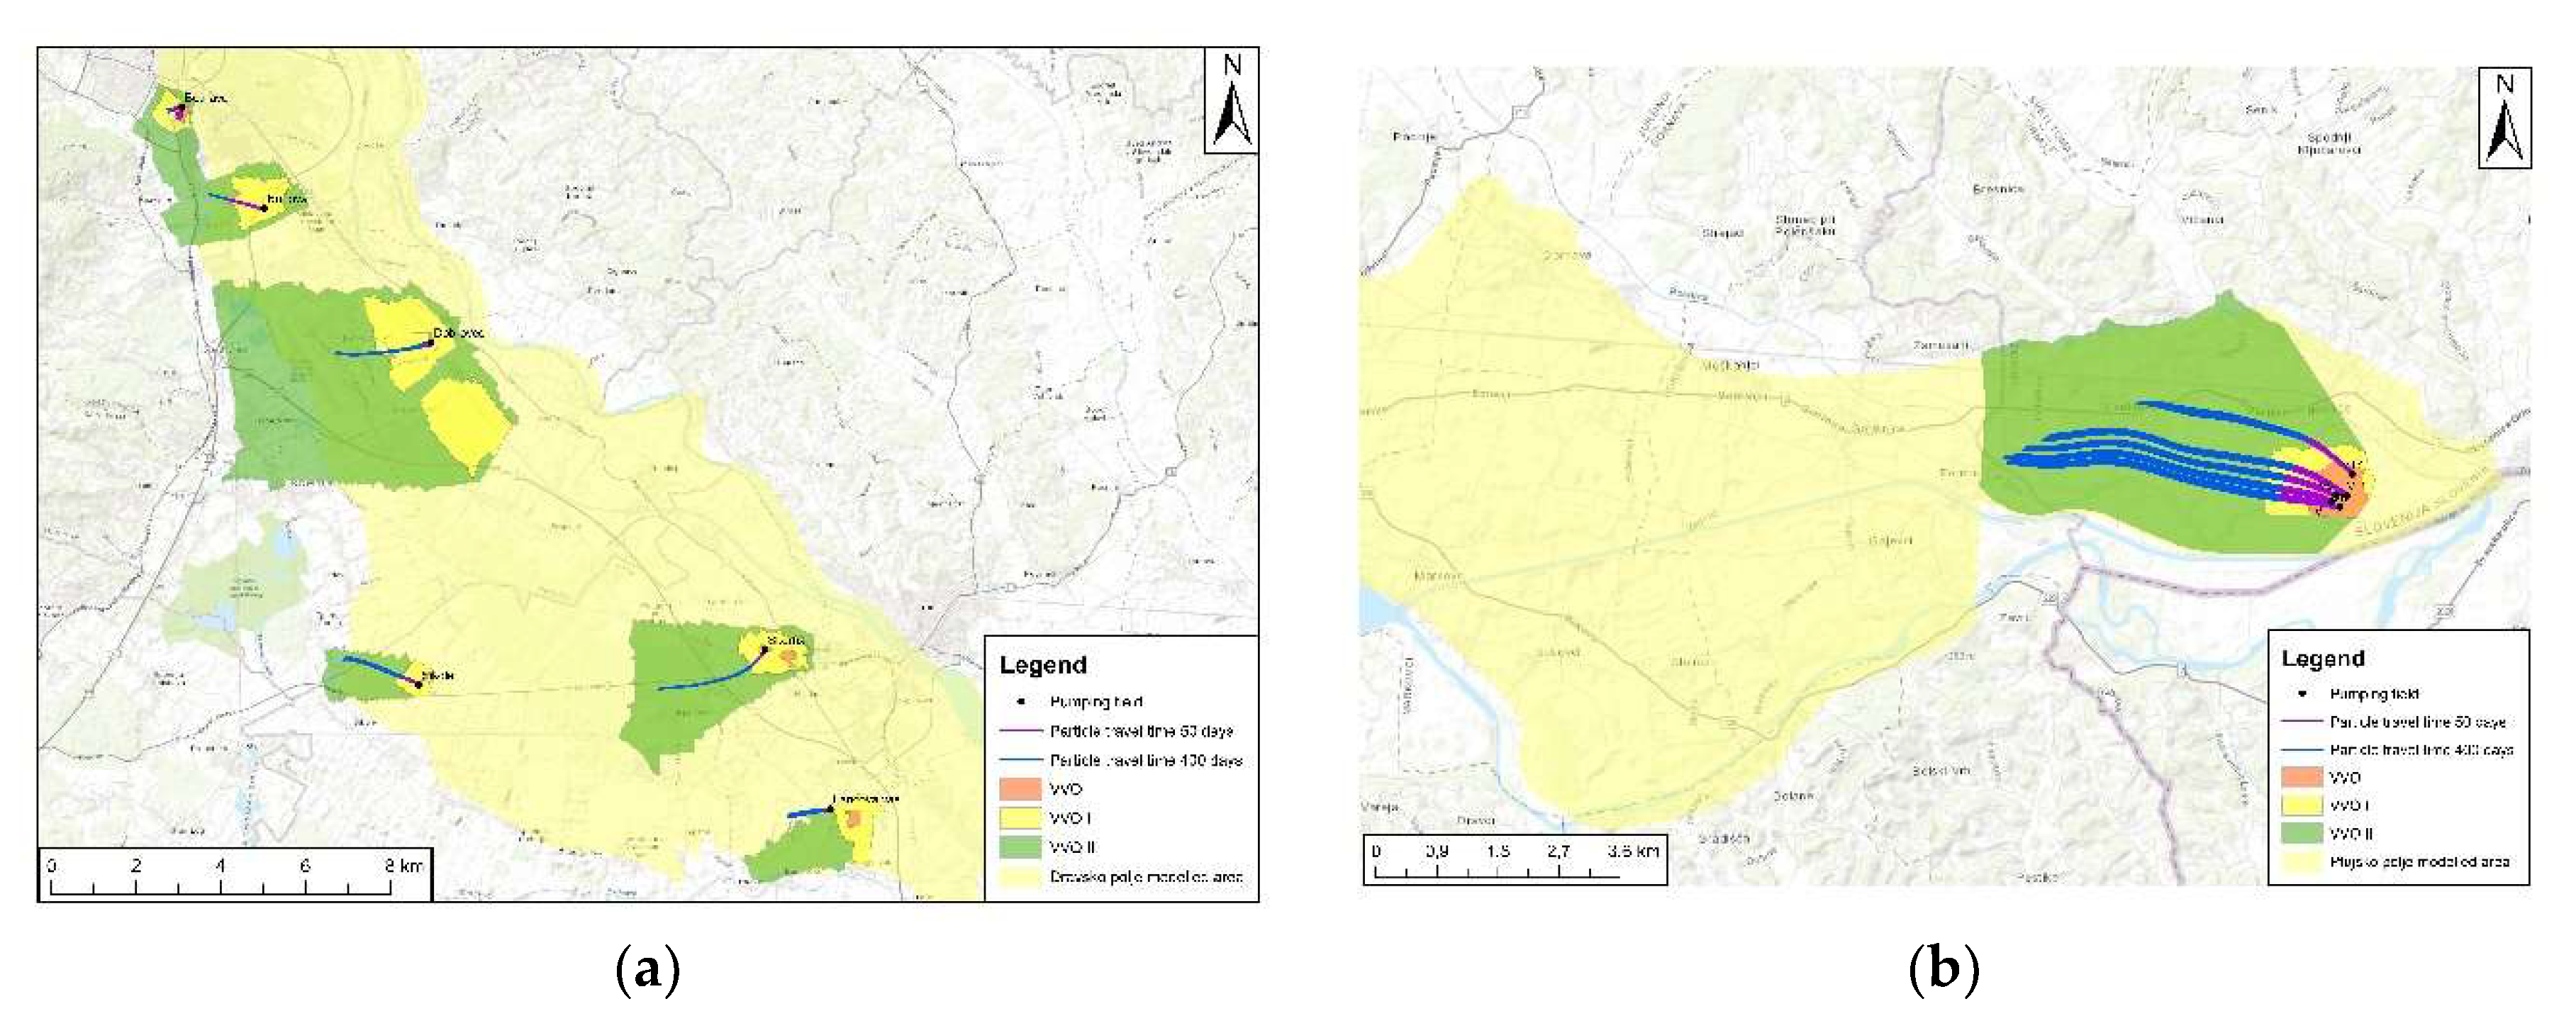
MODPATH was used as a model validation method of hydraulic conductivity with particle tracking simulated using MODPATH [
39]. After successfully calibrating the model using PEST, we performed validation of travel times within groundwater protection areas (VVOs). If particles travel from the source to the edge of the protected area within the time frame specified in the regulation, the model has been successfully calibrated. In Slovenia, VVOs are subdivided according to the type of aquifer: a karst aquifer or a porous aquifer. The travel times of pollutants are shorter in the case of a karst aquifer. In our study, we performed validation for porous aquifers. Our aim was to ensure sustainable use of fresh drinking water in the protected areas of the
Dravsko polje and
Ptujsko polje groundwater pumping stations, and prevent pollution of this valuable source. In addition to being the most vulnerable direct freshwater source, and; as such; subject to the strictest restrictions, the area around the source is divided into sections that are protected according to their respective distance from the source. These areas are divided into the narrowest inner area (VVO I), the narrowest area (VVO II) and the widest area (VVO III). The strictest measures apply to the inner area, followed by strict measures and finally milder measures for the outer area. The measures for each protected area are based on the travel time (up to 50 days in VVO I and up to 400 days in VVO II) of the pollutant from the intake to the source.
2.7. Uncertainties and Limitations
Numerical groundwater simulations play an important role in the description of dynamic groundwater processes and quantitative assessments of groundwater resources [
42]. However, the reliability of numerical groundwater simulations is confounded by uncertainties associated with hydrogeologic structure, spatial local-scale heterogeneity, and parameter values of modelled geological materials. Uncertainties related to hydrogeological structure are often of greatest concern [
43]. Hydrogeological structure mainly refers to the spatial distribution of the spatial characteristics of aquifers and aquitards [
44]. A proper description or model of their hydrogeological structure is required to accurately resolve uncertainties and effectively evaluate groundwater resources.
While the water balance of the presented porous aquifer system is well understood and previously well researched, a window of data is unpredictable and, therefore, remains unknown. For the purposes of the targeted model, area simplifications had to be applied, which proved sufficient to create a steady-state model of the system. For instance, the amount of precipitation is influenced by numerous factors, such as altitude, outskirts, natural barriers, local climate changes, etc., which have a major impact on groundwater recharge. Another variable is the recharge of groundwater from the outskirts, which is not regularly measured and needed to be inferred from data estimates from more than a decade ago. The same was true for GWLs, which had been measured in different seasons over the years, and each measurement also required taking into account the weather conditions to achieve the best accuracy. Another factor impossible to measure is whether the riverbed is recharged by groundwater or the aquifer is recharged by a riverbed leakage. Generally, both scenarios are known to be valid, but it is impossible to determine them locally on such a scale. In addition, groundwater flow is generally known, but local changes in flow remain unknown and need to be explored locally for the needs of targeted studies. Therefore, this portion of the data must also be viewed with caution. However, to create a genuine and precise simultaneous model of a large spatial reach, it seems more appropriate to model smaller parts targeting local problems and gradually combine them to form the entire aquifer system.
4. Discussion and Conclusions
Sustainable management of hydrological resources is regulated by the European Water Directive (60/2000/EC), which requires each water authority in the EU to prepare a watershed management plan. It is noted that to fulfil these obligations, it is necessary to use integrated management tools and methods, such as computer models, while also taking into account the complexity of water bodies monitoring and uncertain future scenarios brought about by climate change.
Modelling is important to improve our understanding of hydrogeological systems and to assess future conditions in aquifers. Integrated hydrogeological models represent a valuable tool not only in the planning, but also in the implementation and operation of activities related to groundwater management, land use, and water protection action plans. A model provides a description of a specific hydrogeological system. Data availability is extremely important when developing models. For better estimates of the key parameters, field measurements should be conducted. To assess the degree of validity of the model outputs, uncertainty analysis should also be carried out.
This article presents the first results of two separate hydrogeological numerical models for the Dravsko polje and Ptujsko polje aquifers, which were combined into an integrated groundwater resource management system. The combination of the two models allowed us to follow and optimise the same approach in groundwater management in this area. It is a tool that helps solve potential problems related to the quantity and quality of groundwater. The models were constructed using different grid-based maps: GWL, lower and upper aquifer layers. Both models were at steady state.
Based on the results, we successfully calibrated both models. From the calibrated model for the Dravsko polje and Ptujsko polje aquifers, it appeared that the hydraulic heads for both aquifers were well coordinated, and most were within a 25% discrepancy. There are larger discrepancies in hydraulic heads at the western margins of the aquifers, which is to be expected since the aquifers are highly variable. The western margin of the Dravsko polje aquifer presented a major modelling challenge. Due to the very high elevation of the tertiary layer and the resulting low thickness of the aquifer (less than 0.5 m), the high GWL, the constant pumping rate, and the unknown recharge rate from the surrounding area, conditions were not ideal. In addition, under such unpredictable conditions, it was very challenging for PEST to calibrate the type of groundwater flow and meet all the given conditions: hydraulic conductivity, GWL within the aquifer thickness, recharge rate, and constant pumping rate.
To achieve the best possible approximation of the model to the natural conditions, it is imperative to continuously measure GWL, infiltration by precipitation, and recharge from the surrounding area, and to update the model regularly. Only then can the model represent a good approximation of the natural conditions. The comparison between the measured and the modelled data shows a very good alignment for both models and indicates that both numerical models provide realistic results of hydraulic pressure distribution and groundwater flow direction.
In addition, the overall water budget of the Dravsko polje aquifer and the Ptujsko polje aquifer showed only minimal deviation between inflow and outflow, indicating that both models were stable. The modelled water balance data and the estimated water balance data derived from the literature showed that the water balance estimate was consistent with the modelled data. This indicates that the understanding of the groundwater system was correct from the beginning, which facilitated the attainment of correct model results.
Finally, both models were compared to particle travel times from the source of the groundwater protection areas, using the MODPATH procedure for validation. Based on the data presented, the particle travel times were very well aligned. This indicates that the hydraulic conductivity was well calibrated, and the effective porosity was realistic.
However, the models were created separately as this made them easier to present, and the modelled areas were smaller, which gave more control to the BCs. Therefore, we had to unify the intersecting part of the two models. They were connected to the Drava River and Lake Ptuj. Based on the flow budget of the Drava polje aquifer, the total discharge below Lake Ptuj and the Drava River was 31.124 m3/s, and this amount of groundwater was expected to continue to flow into the Ptujsko polje aquifer. The modelled flow budget of the Ptujsko polje aquifer showed that the inflow at its western edge totalled 13.860 m3/s, which was less than the amount from the Dravsko polje aquifer. Based on these volumes, more than half of the groundwater volume from the Dravsko polje aquifer disappeared. However, since the Drava River flows downstream, it is possible that part of the groundwater does not infiltrate into the Ptujsko polje aquifer, but enriches the Drava River. It should be kept in mind that Lake Ptuj is artificially regulated, which is another factor for possible discrepancies and a higher probability of errors.
Practice has shown that it is difficult to predict all input values to perfectly match the natural system. However, with such models based on the mathematical background of cell-to-cell flow rate calculations, we can predict behaviour similar to the natural system, which is exactly the case in our example.
In summary, both models were successfully modelled and validated. Not only did these two models provide a better understanding of groundwater flow in the Drava River water body, but they can also be used to model pollution distribution and infiltration through the saturated zone of the aquifer. The hydraulic model will facilitate the planning of measures for chemical and quantitative improvement of the aquifer. According to the European Water Framework Directive, the groundwater body of the Dravska kotlina is classified as a groundwater body with poor chemical and quantitative status. For this reason, measures must be taken to restore its chemical and quantitative status. The hydraulic model of the aquifer is, therefore, essential both for a more detailed definition of the current situation and for predicting the impact of future measures aimed at improving the situation. In addition, these models allow for more accurate simulations of groundwater dynamics and pollutant migration in aquifers, which, in turn, can contribute to more efficient management of groundwater resources. Last but not least, both models together form the basis for a complete decision support system for the management of the entire groundwater body.


