
Estimation of Nitrate Background Value in Groundwater under the Long-Term Human Impact


Abstract
:1. Introduction
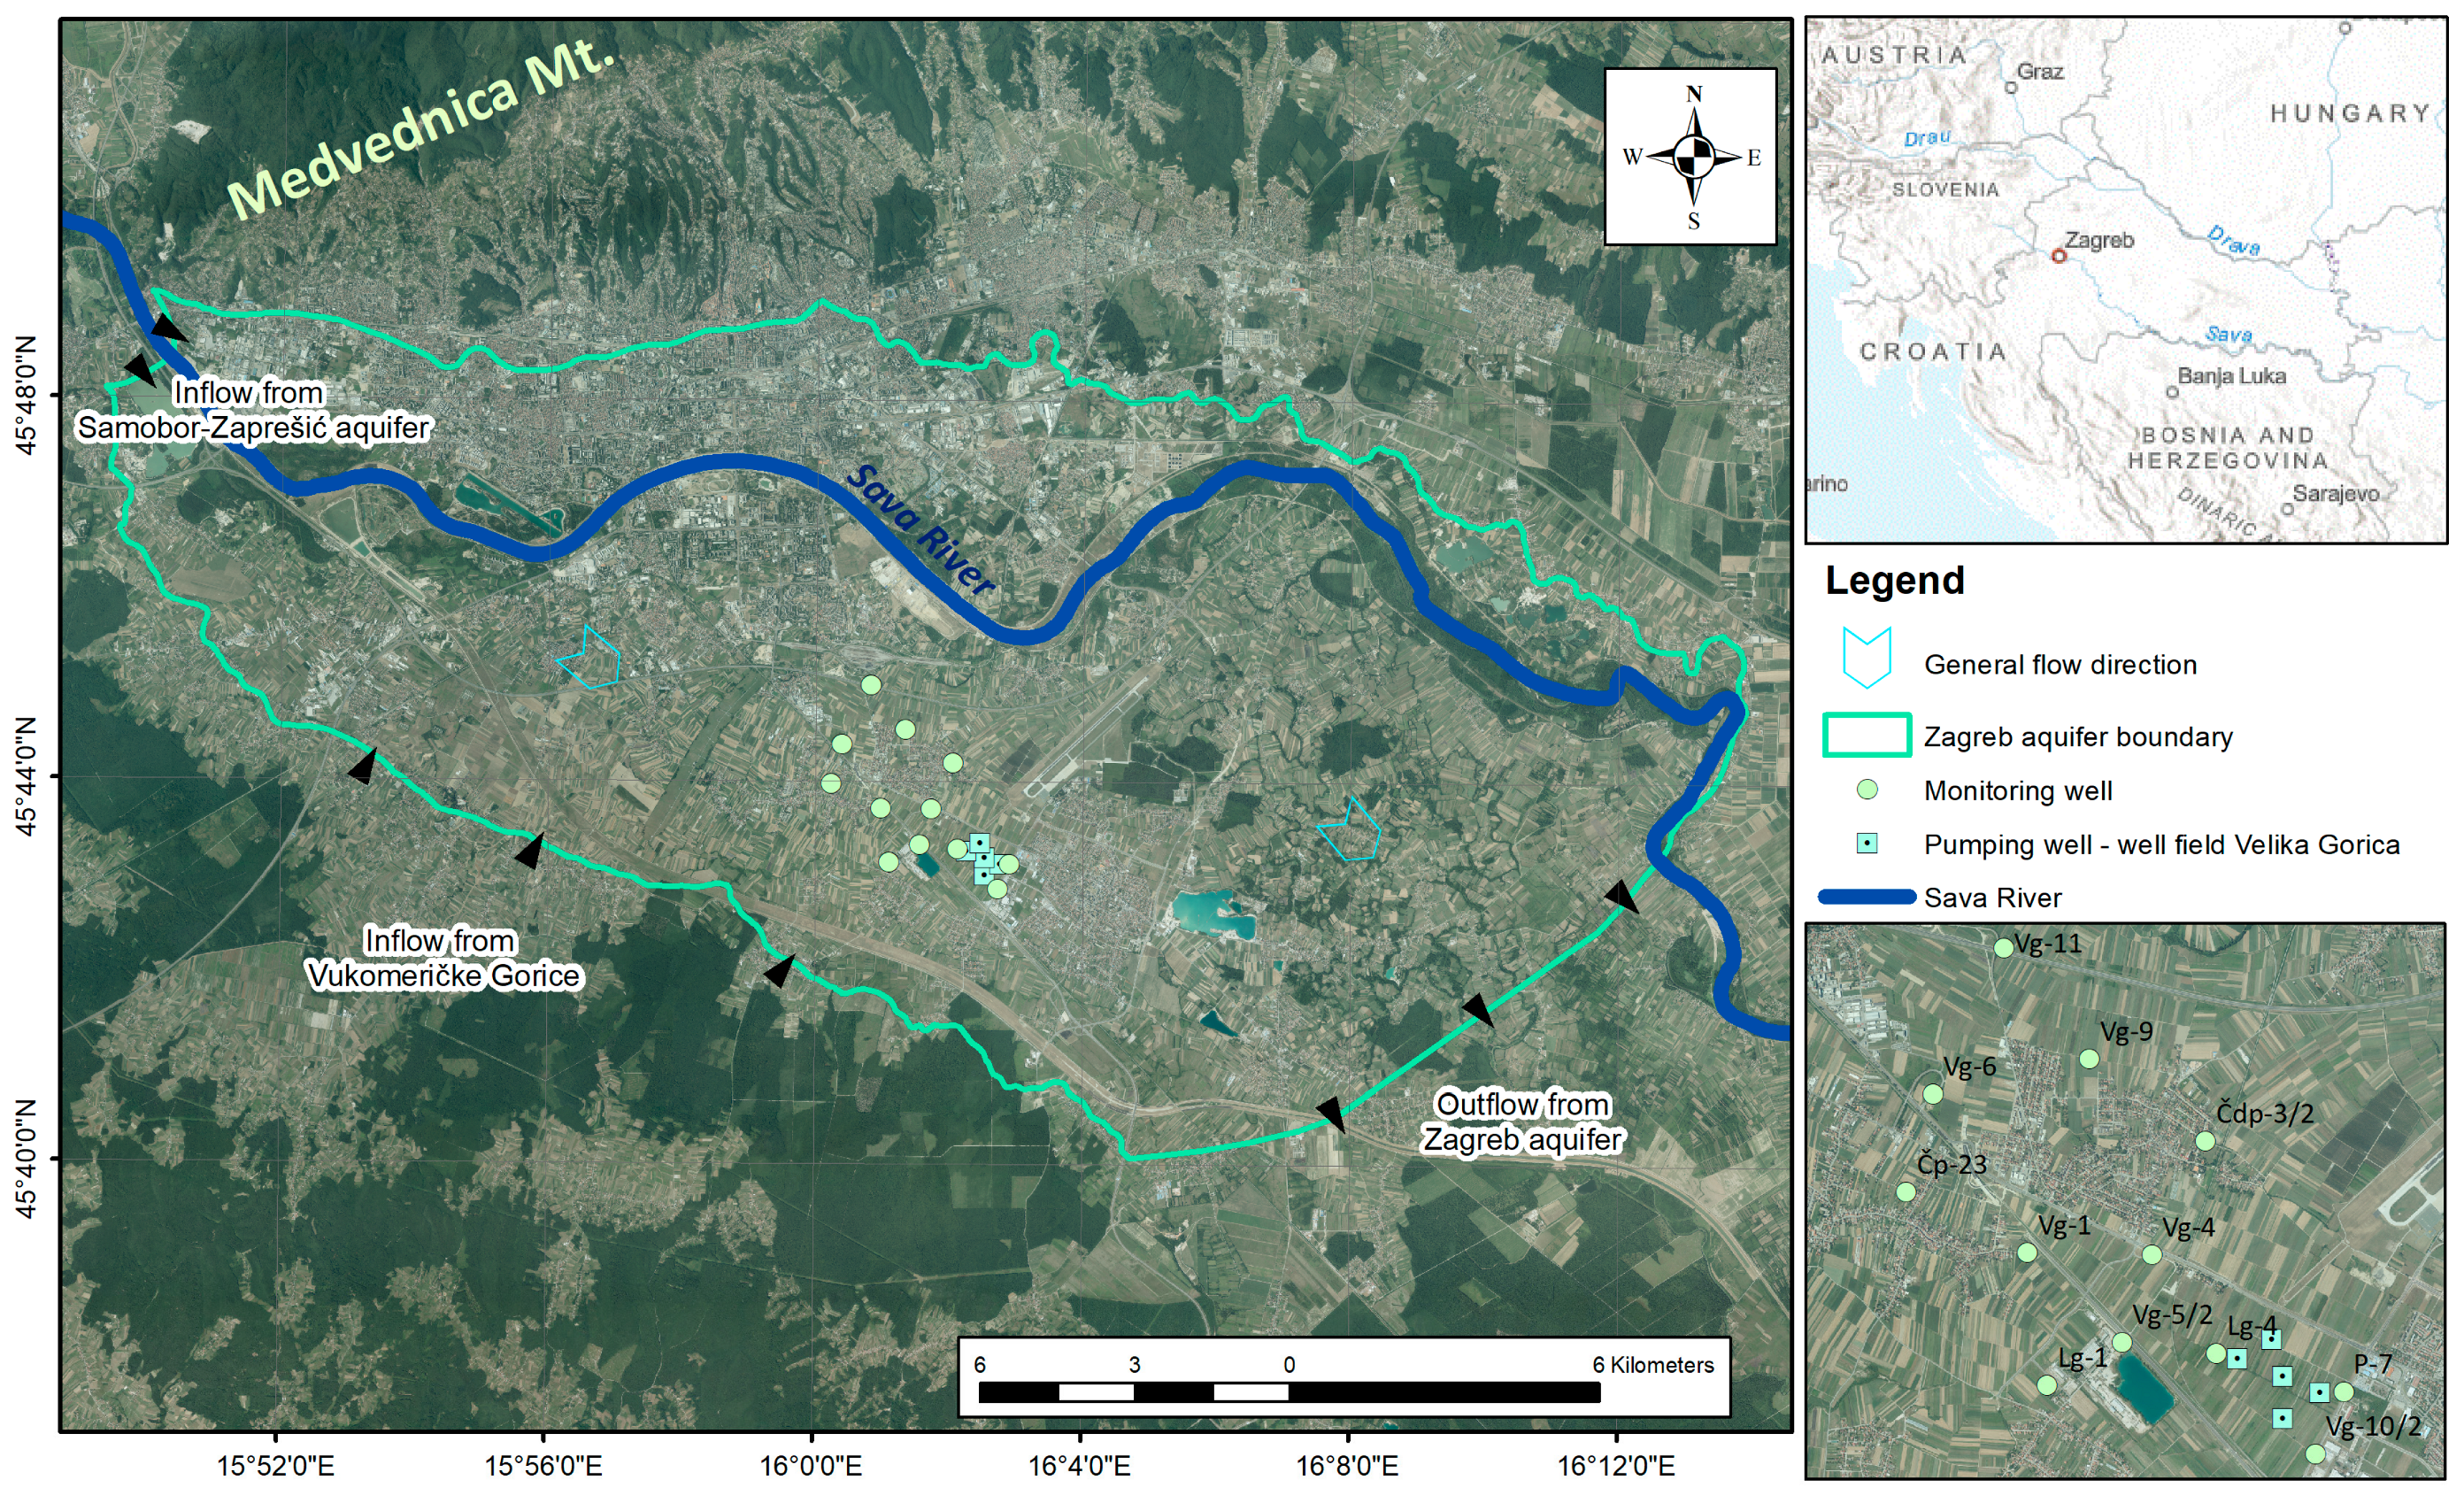
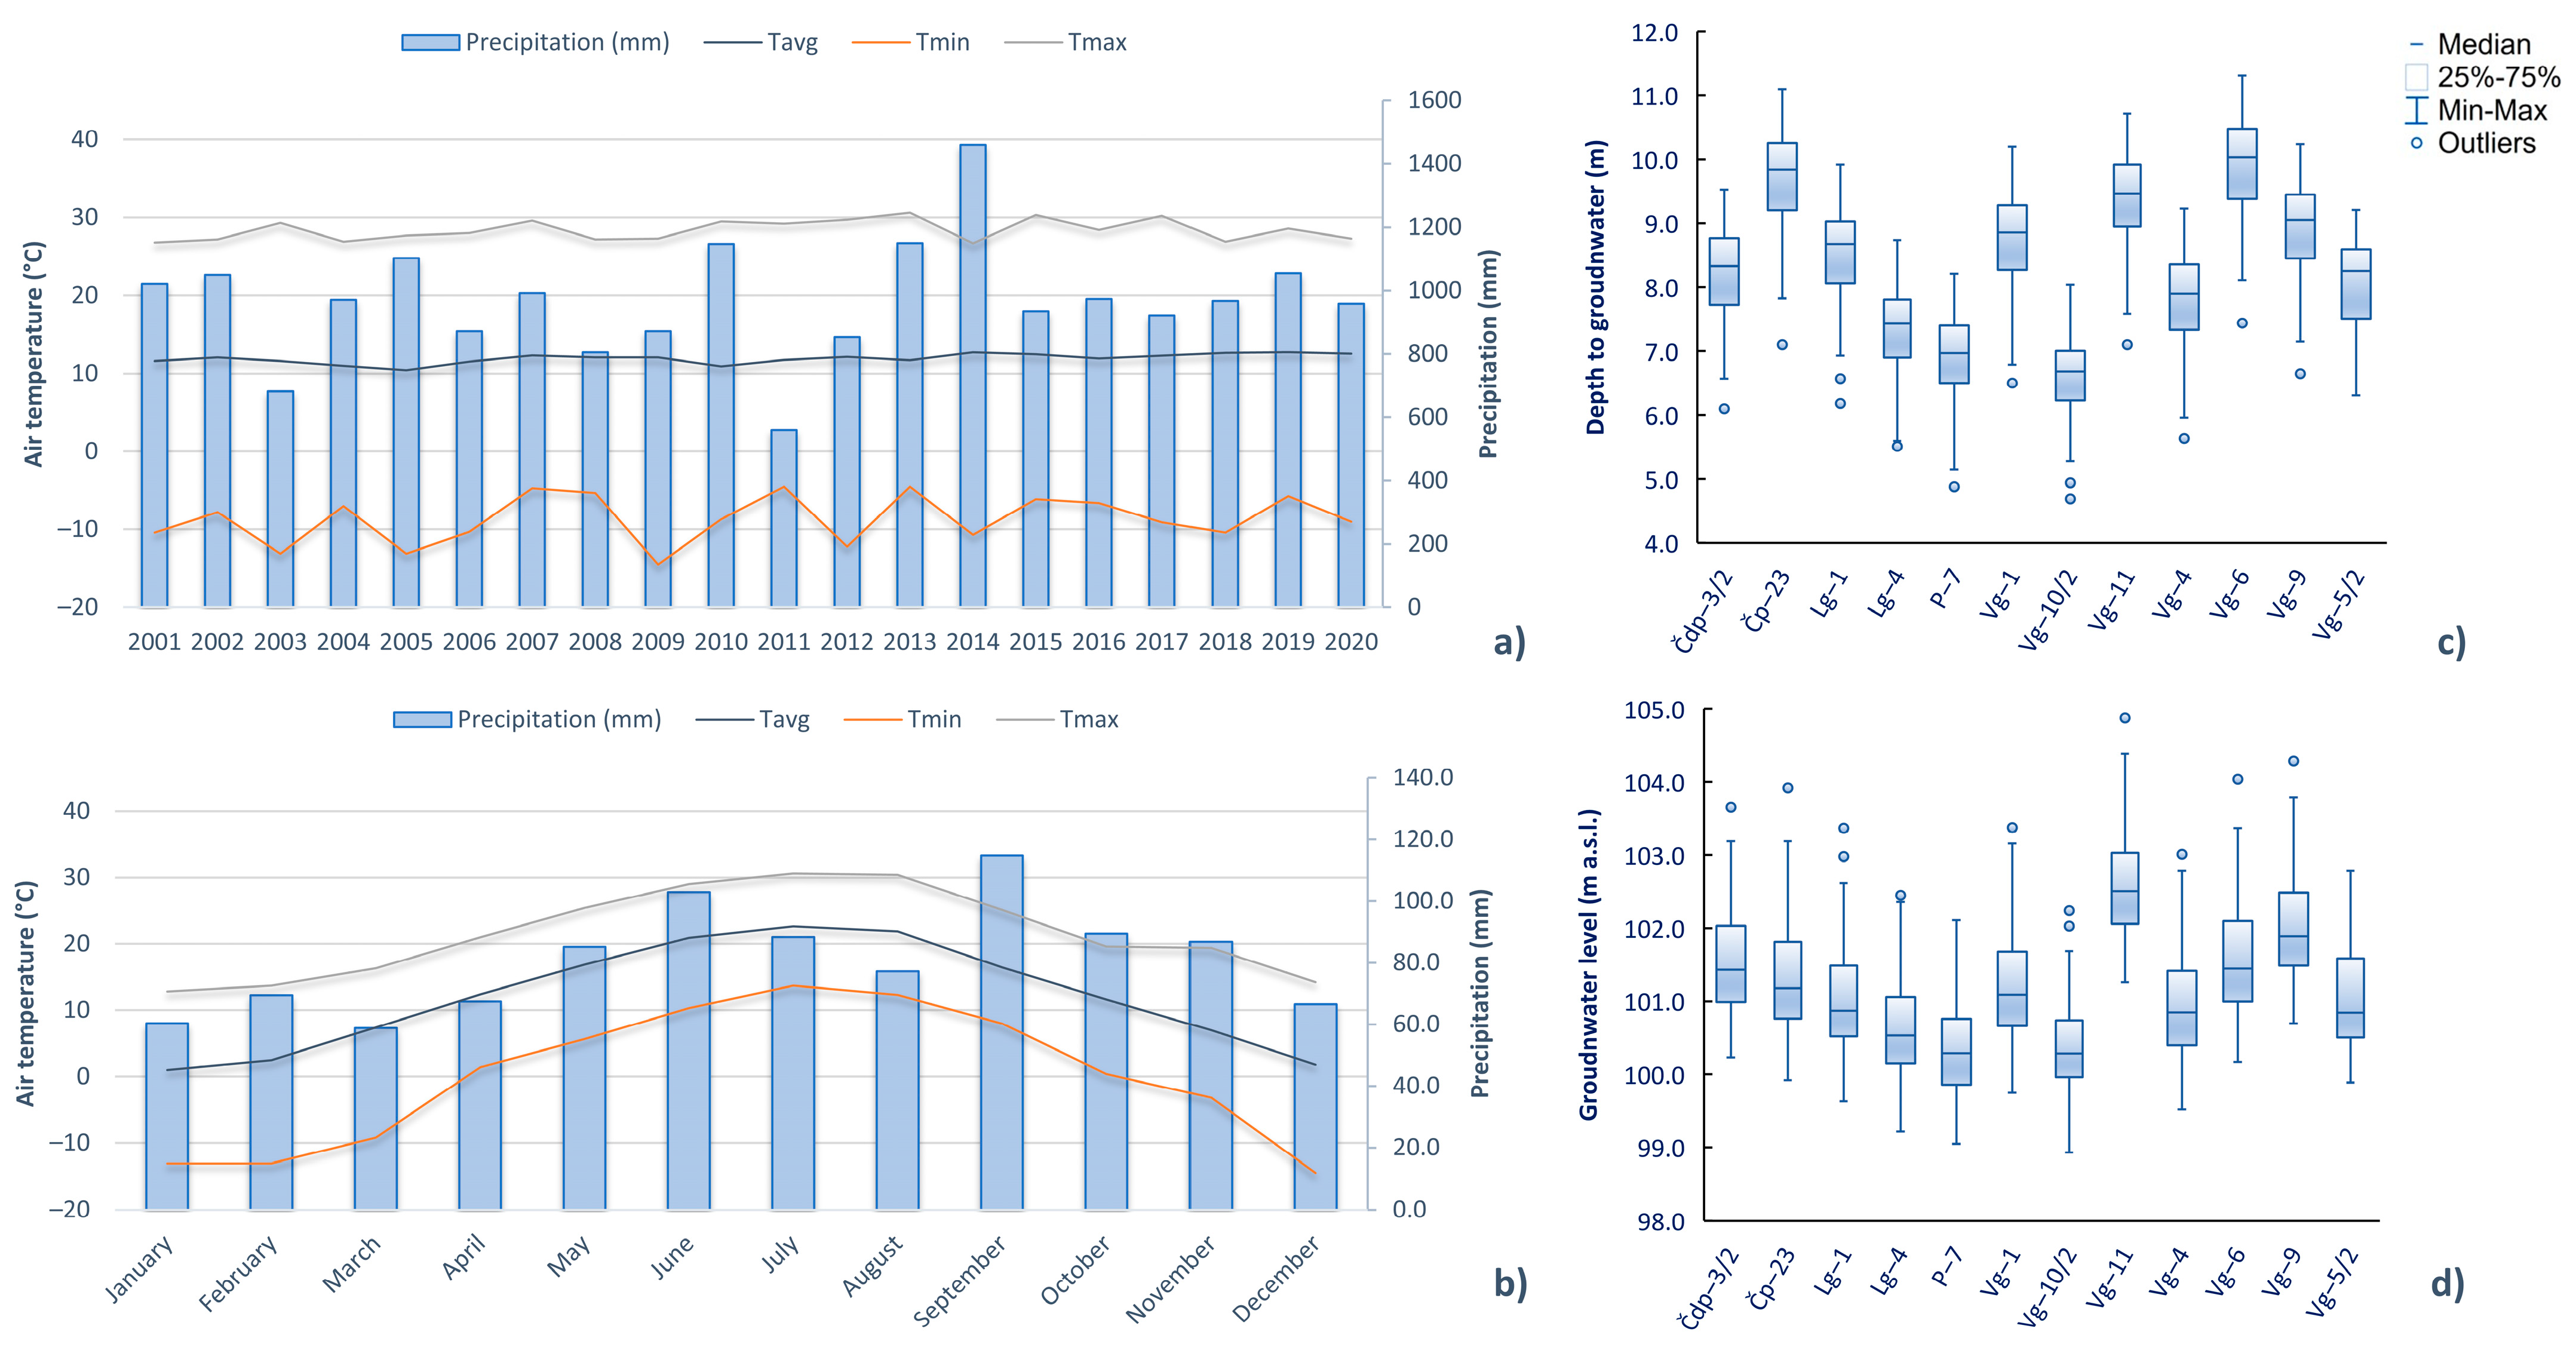
2. Study Area
3. Materials and Methods
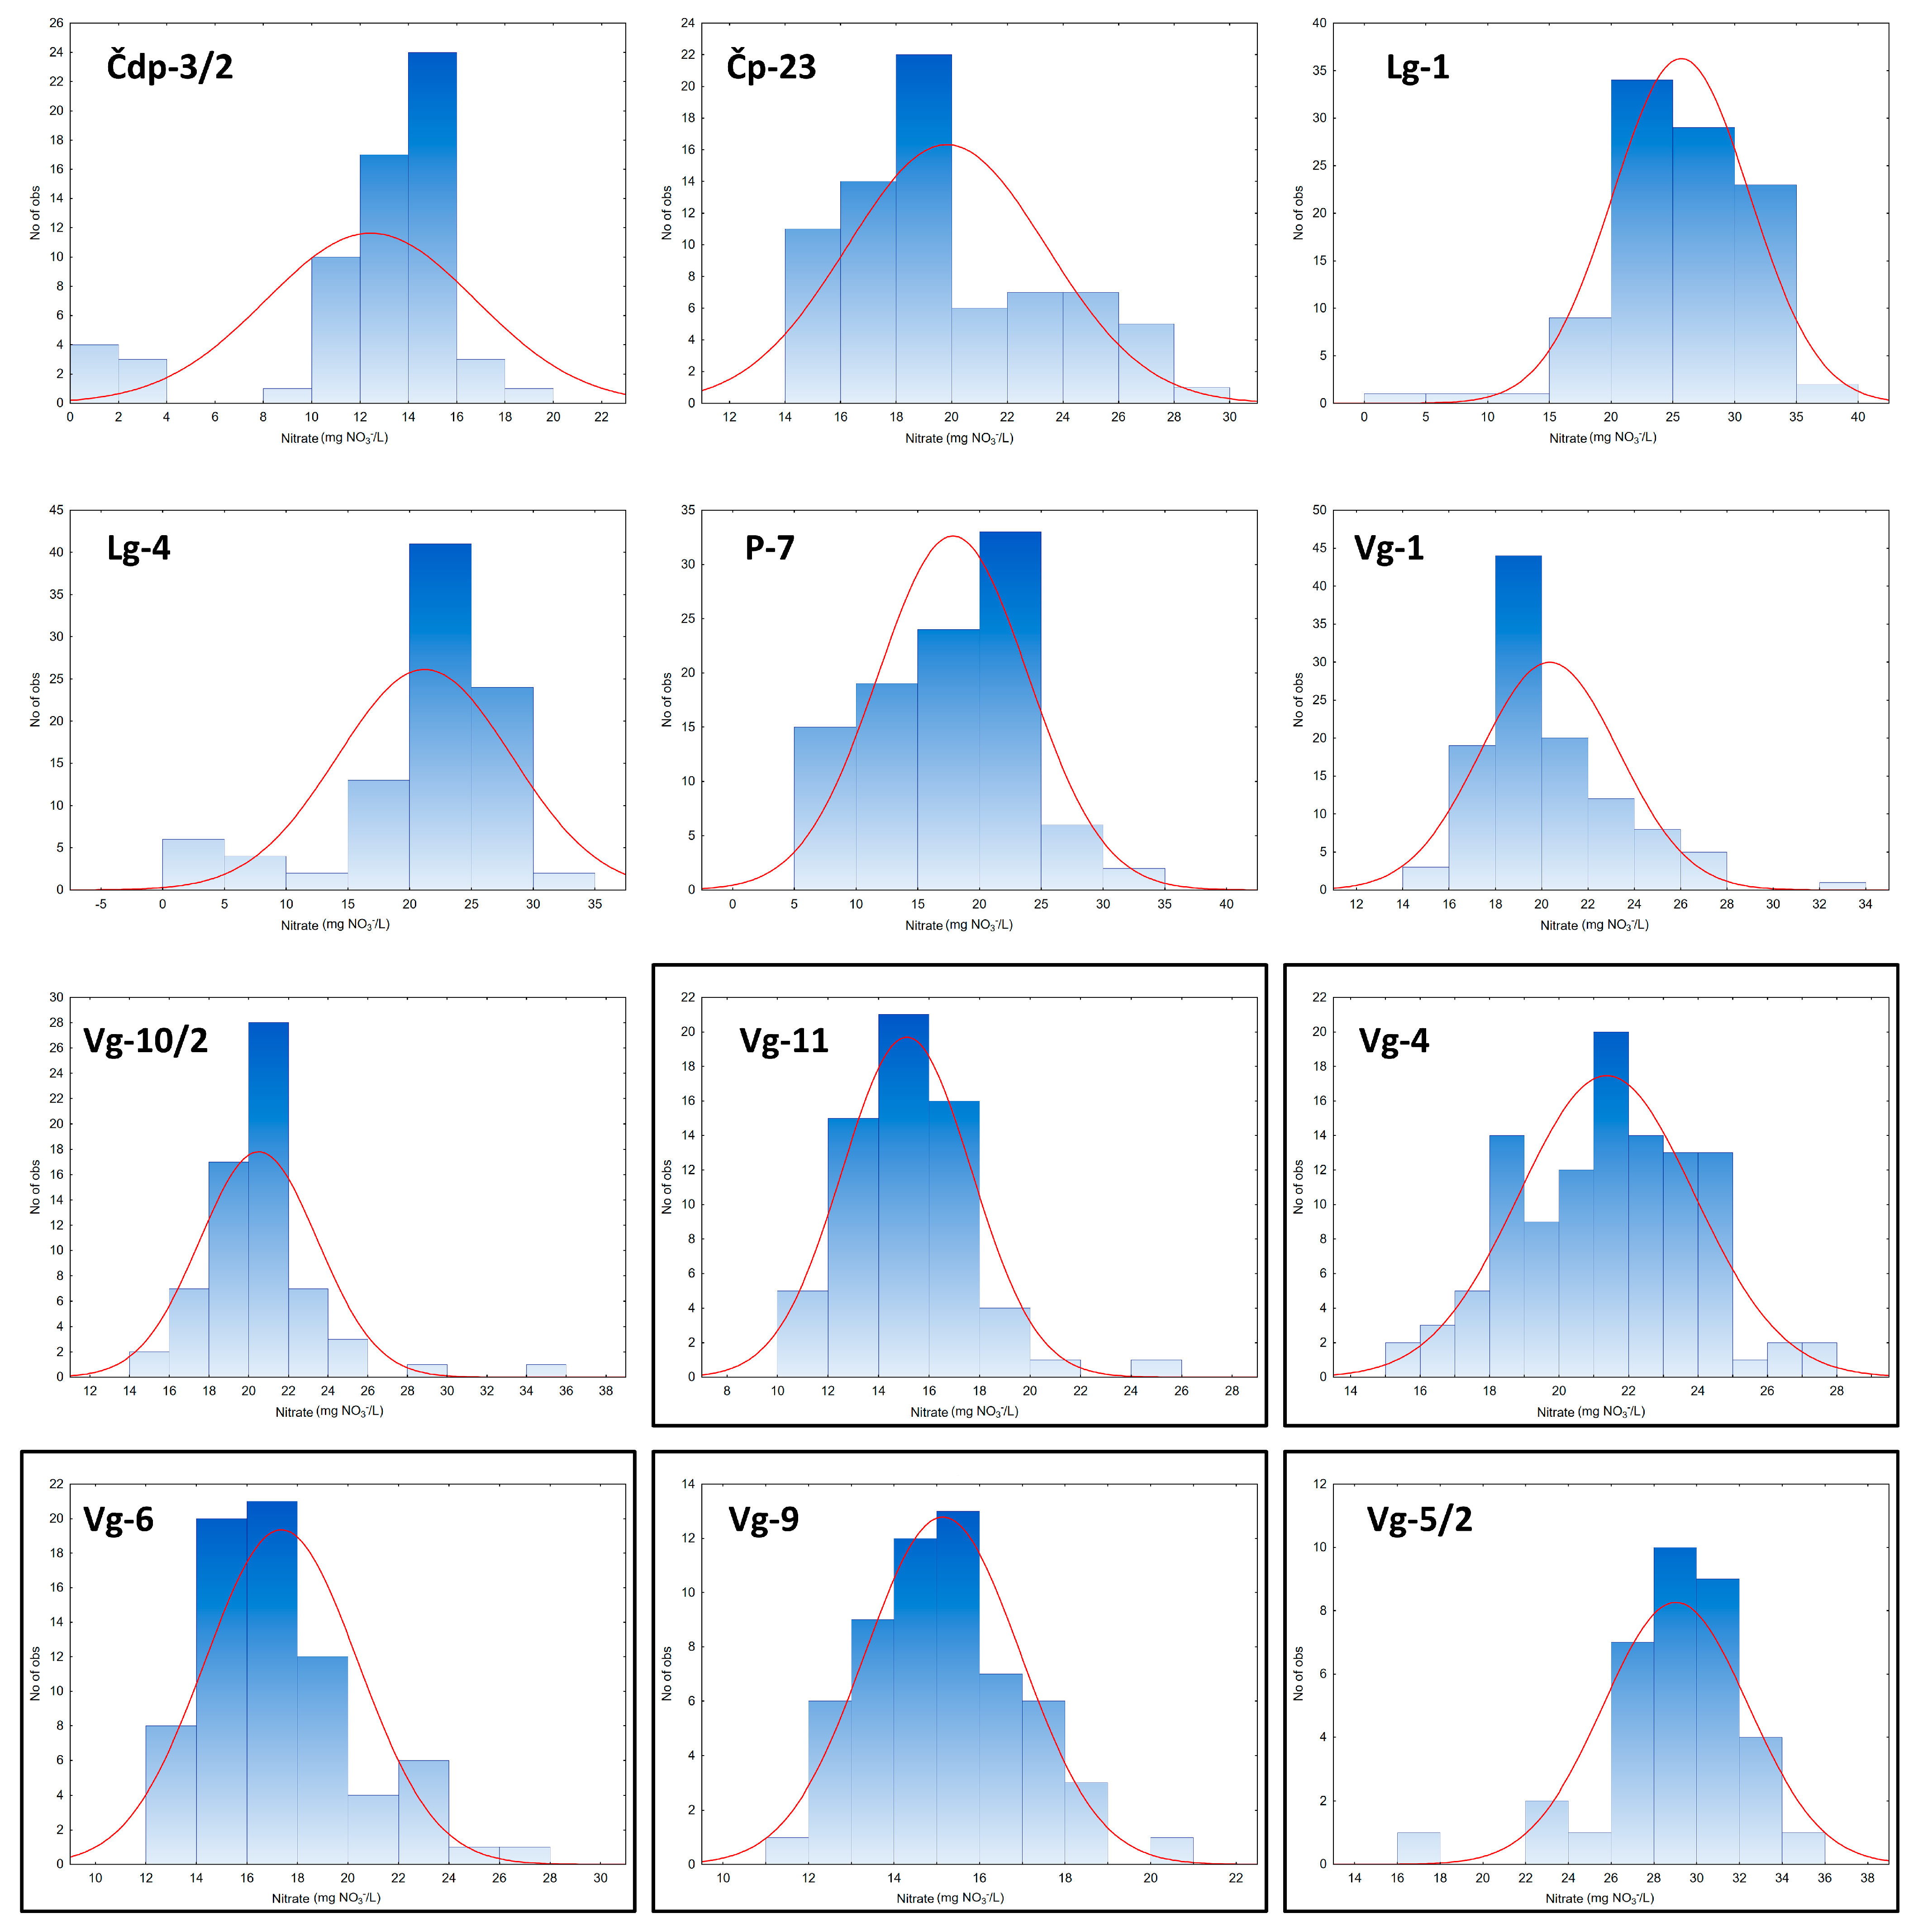
3.1. Available Data Set
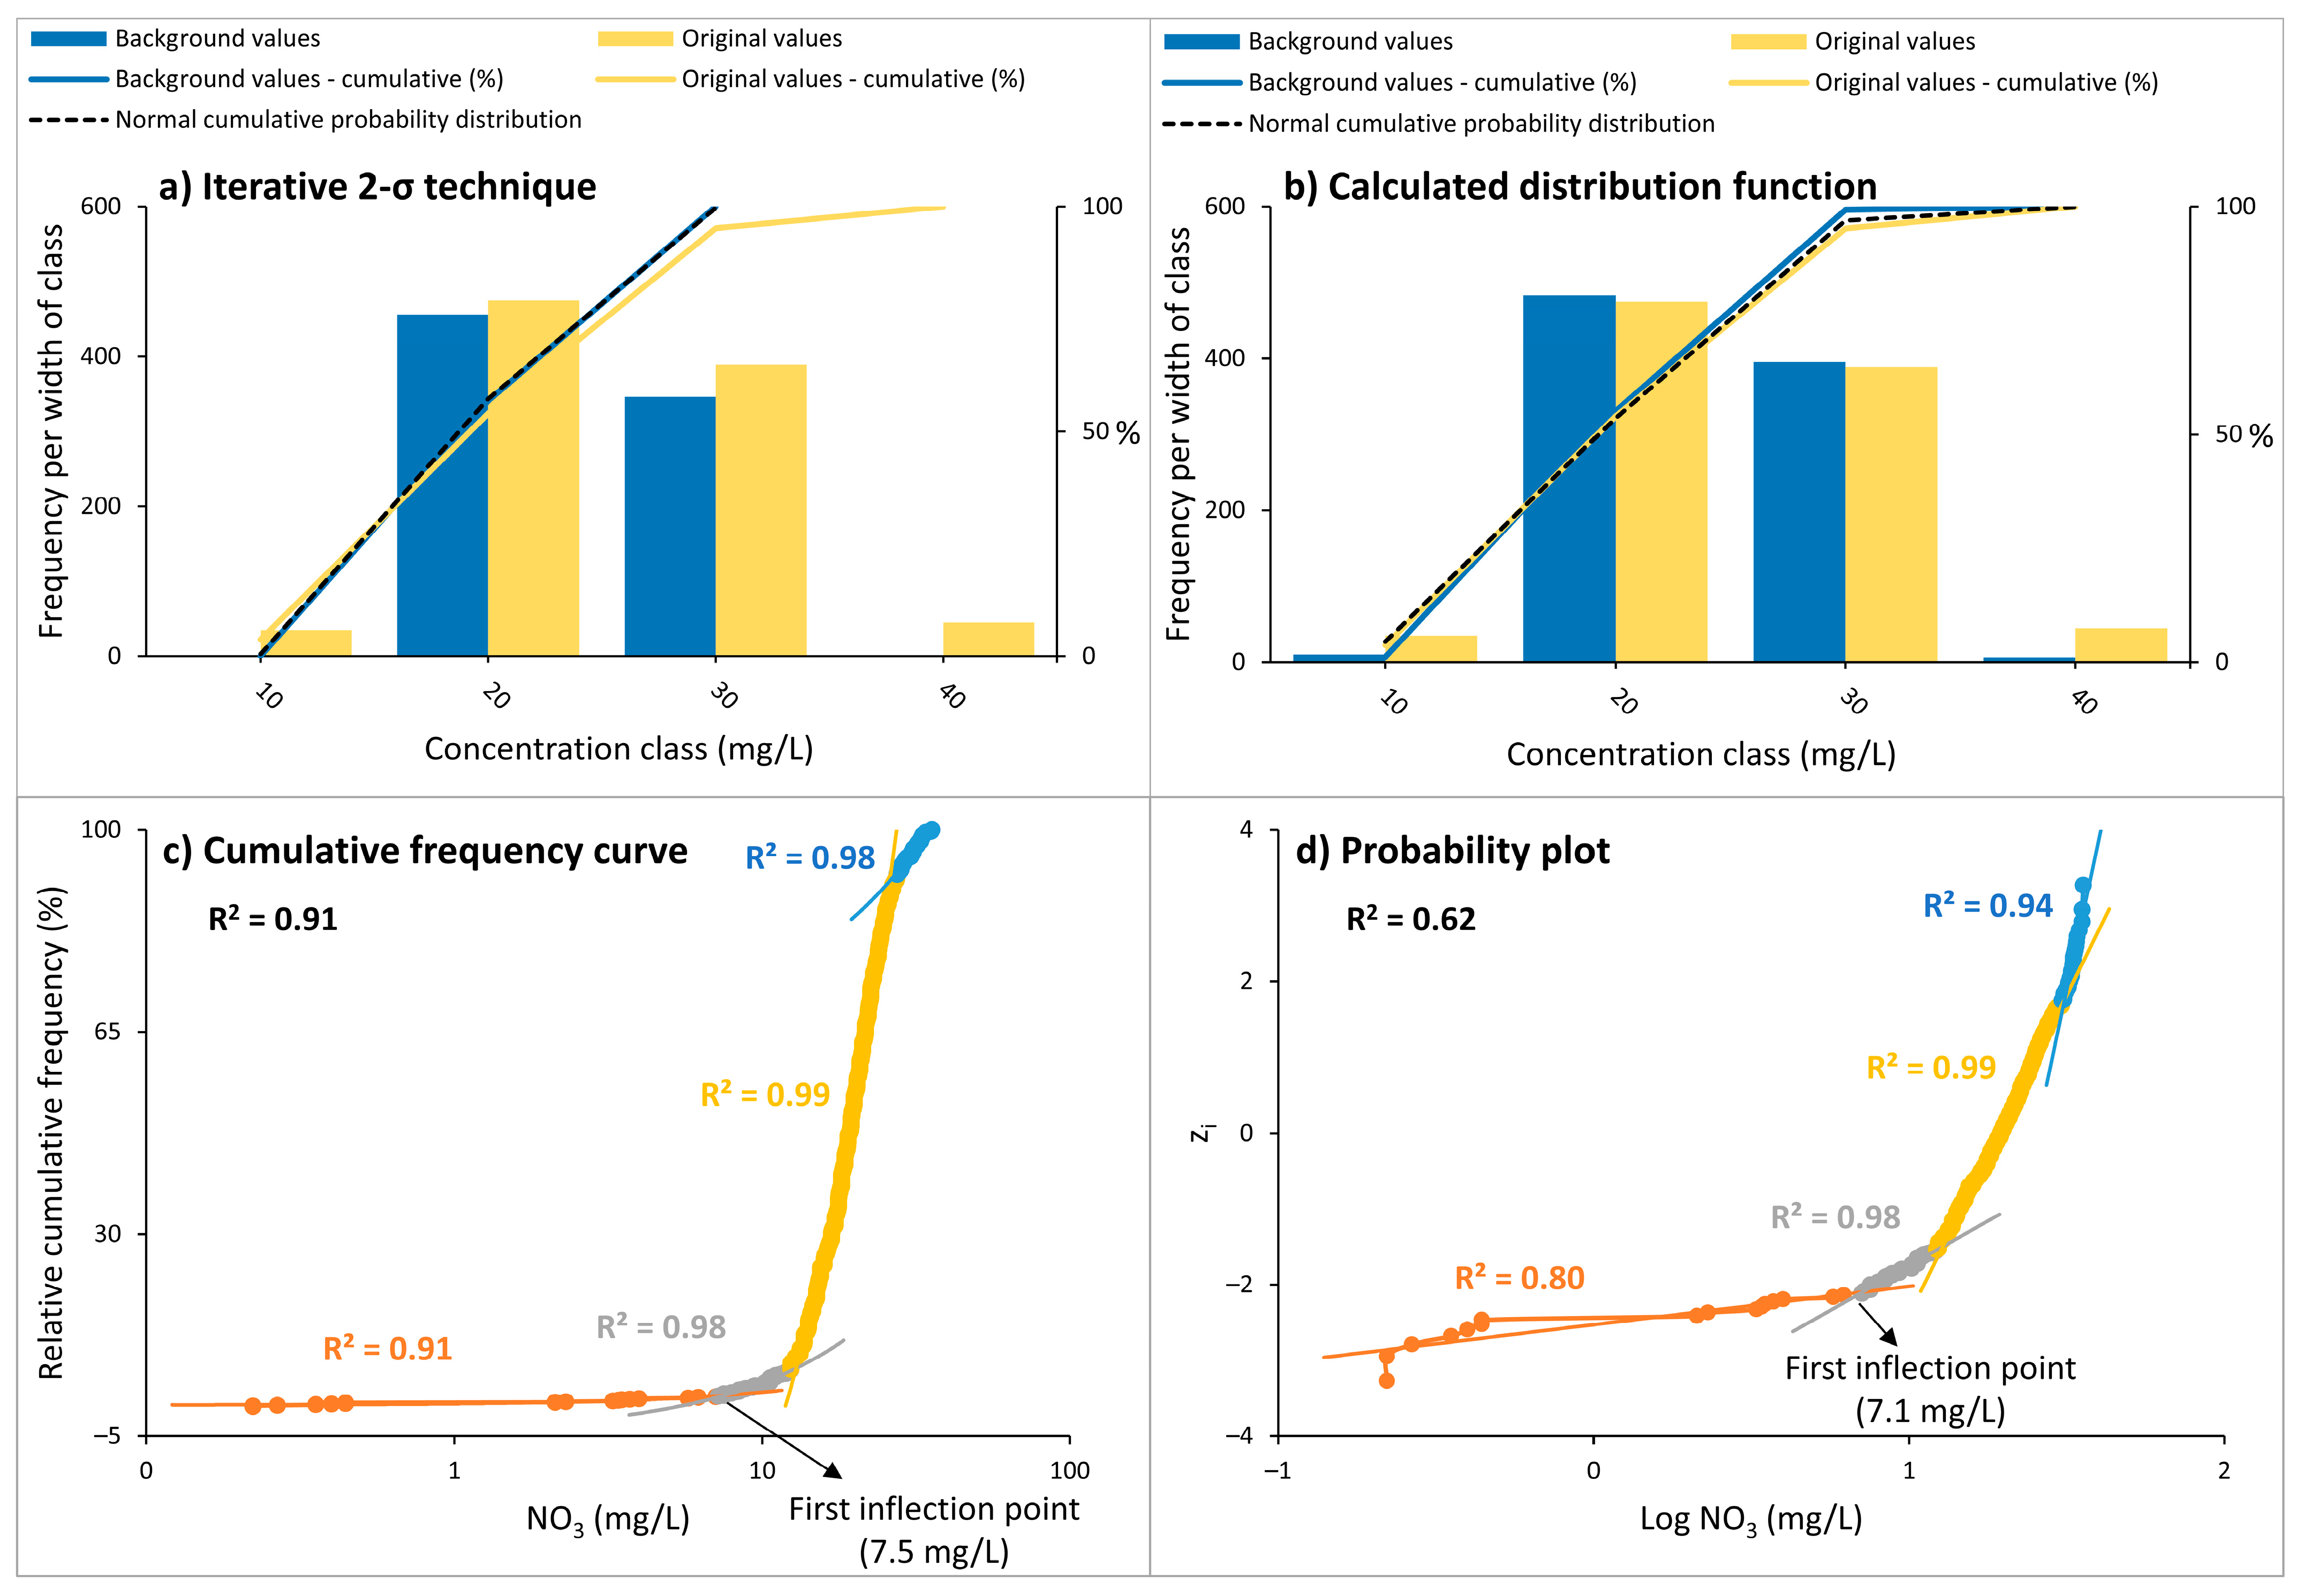
3.2. Description of Methods
4. Results and Discussion
5. Conclusions
Author Contributions
Funding
Data Availability Statement
Acknowledgments
Conflicts of Interest
References
- Sunitha, V.; Sudharshan Reddy, Y.; Suvarna, B.; Reddy, B.M. Human Health Risk Assessment (HHRA) of Fluoride and Nitrate Using Pollution Index of Groundwater (PIG) in and around Hard Rock Terrain of Cuddapah, A.P. South India. Environ. Chem. Ecotoxicol. 2022, 4, 113–123. [Google Scholar] [CrossRef]
- United Nations. The Sustainable Development Goals Report 2021; United Nations Publications: New York, NY, USA, 2021. [Google Scholar]
- Adimalla, N.; Qian, H.; Nandan, M.J. Groundwater Chemistry Integrating the Pollution Index of Groundwater and Evaluation of Potential Human Health Risk: A Case Study from Hard Rock Terrain of South India. Ecotoxicol. Env. Saf. 2020, 206, 111217. [Google Scholar] [CrossRef] [PubMed]
- Abascal, E.; Gómez-Coma, L.; Ortiz, I.; Ortiz, A. Global Diagnosis of Nitrate Pollution in Groundwater and Review of Removal Technologies. Sci. Total Environ. 2022, 810, 152233. [Google Scholar] [CrossRef]
- Pérez-Indoval, R.; Rodrigo-Ilarri, J.; Cassiraga, E.; Rodrigo-Clavero, M.E. PWC-Based Evaluation of Groundwater Pesticide Pollution in the Júcar River Basin. Sci. Total Environ. 2022, 847, 157386. [Google Scholar] [CrossRef]
- Rezaei, A.; Hassani, H.; Tziritis, E.; Fard Mousavi, S.B.; Jabbari, N. Hydrochemical Characterization and Evaluation of Groundwater Quality in Dalgan Basin, SE Iran. Groundw. Sustain. Dev. 2020, 10, 100353. [Google Scholar] [CrossRef]
- Mekonnen, M.M.; Hoekstra, A.Y. Four Billion People Facing Severe Water Scarcity. Sci. Adv. 2016, 2, e1500323. [Google Scholar] [CrossRef] [PubMed] [Green Version]
- Díaz-Alcaide, S.; Martínez-Santos, P. Review: Advances in Groundwater Potential Mapping. Hydrogeol. J. 2019, 27, 2307–2324. [Google Scholar] [CrossRef]
- Majkić-Dursun, B.; Oros, I.; Oparušić, I.; Petković, A. Assessing Groundwater Quality for Multiuse and Geochemical Evolution in the South Banat Area of Serbia, Pannonian Basin. Pol. J. Env. Stud. 2019, 28, 3269–3278. [Google Scholar] [CrossRef]
- Erisman, J.W.; Galloway, J.N.; Seitzinger, S.; Bleeker, A.; Dise, N.B.; Roxana Petrescu, A.M.; Leach, A.M.; de Vries, W. Consequences of Human Modification of the Global Nitrogen Cycle. Philos. Trans. R. Soc. B Biol. Sci. 2013, 368, 20130116. [Google Scholar] [CrossRef] [PubMed] [Green Version]
- Hosono, T.; Tokunaga, T.; Kagabu, M.; Nakata, H.; Orishikida, T.; Lin, I.T.; Shimada, J. The Use of Δ15N and Δ18O Tracers with an Understanding of Groundwater Flow Dynamics for Evaluating the Origins and Attenuation Mechanisms of Nitrate Pollution. Water Res. 2013, 47, 2661–2675. [Google Scholar] [CrossRef]
- Liu, A.; Ming, J.; Ankumah, R.O. Nitrate Contamination in Private Wells in Rural Alabama, United States. Sci. Total Environ. 2005, 346, 112–120. [Google Scholar] [CrossRef] [PubMed]
- Ma, Z.; Yang, Y.; Lian, X.; Jiang, Y.; Xi, B.; Peng, X.; Yan, K. Identification of Nitrate Sources in Groundwater Using a Stable Isotope and 3DEEM in a Landfill in Northeast China. Sci. Total Environ. 2016, 563–564, 593–599. [Google Scholar] [CrossRef]
- Rockström, J.; Steffen, W.; Noone, K.; Persson, Å.; Chapin, F.S., III; Lambin, E.F.; Lenton, T.M.; Scheffer, M.; Folke, C.; Schellnhuber, H.J.; et al. A Safe Operation Space for Humanity. Nature 2009, 461, 472–475. [Google Scholar] [CrossRef] [PubMed]
- Romanelli, A.; Soto, D.X.; Matiatos, I.; Martínez, D.E.; Esquius, S. A Biological and Nitrate Isotopic Assessment Framework to Understand Eutrophication in Aquatic Ecosystems. Sci. Total Environ. 2020, 715, 136909. [Google Scholar] [CrossRef]
- Xue, D.; de Baets, B.; van Cleemput, O.; Hennessy, C.; Berglund, M.; Boeckx, P. Use of a Bayesian Isotope Mixing Model to Estimate Proportional Contributions of Multiple Nitrate Sources in Surface Water. Environ. Pollut. 2012, 161, 43–49. [Google Scholar] [CrossRef]
- Xue, D.; Botte, J.; de Baets, B.; Accoe, F.; Nestler, A.; Taylor, P.; van Cleemput, O.; Berglund, M.; Boeckx, P. Present Limitations and Future Prospects of Stable Isotope Methods for Nitrate Source Identification in Surface- and Groundwater. Water Res. 2009, 43, 1159–1170. [Google Scholar] [CrossRef] [PubMed]
- Xu, S.; Kang, P.; Sun, Y. A Stable Isotope Approach and Its Application for Identifying Nitrate Source and Transformation Process in Water. Environ. Sci. Pollut. Res. 2016, 23, 1133–1148. [Google Scholar] [CrossRef]
- Fenech, C.; Rock, L.; Nolan, K.; Tobin, J.; Morrissey, A. The Potential for a Suite of Isotope and Chemical Markers to Differentiate Sources of Nitrate Contamination: A Review. Water Res. 2012, 46, 2023–2041. [Google Scholar] [CrossRef]
- Ahada, C.P.S.; Suthar, S. Groundwater Nitrate Contamination and Associated Human Health Risk Assessment in Southern Districts of Punjab, India. Environ. Sci. Pollut. Res. 2018, 25, 25336–25347. [Google Scholar] [CrossRef]
- Burkart, M.R.; Kolpin, D.W. Hydrologic and Land-Use Factors Associated with Herbicides and Nitrate in Near-Surface Aquifers. J. Environ. Qual. 1993, 22, 646–656. [Google Scholar] [CrossRef]
- Nakić, Z.; Ružičić, S.; Posavec, K.; Mileusnić, M.; Parlov, J.; Bačani, A.; Durn, G. Conceptual Model for Groundwater Status and Risk Assessment—Case Study of the Zagreb Aquifer System. Geol. Croat. 2013, 66, 55–77. [Google Scholar] [CrossRef]
- de Caro, M.; Crosta, G.B.; Frattini, P. Hydrogeochemical Characterization and Natural Background Levels in Urbanized Areas: Milan Metropolitan Area (Northern Italy). J. Hydrol. 2017, 547, 455–473. [Google Scholar] [CrossRef]
- Reimann, C.; Garrett, R.G. Geochemical Background—Concept and Reality. Sci. Total Environ. 2005, 350, 12–27. [Google Scholar] [CrossRef] [PubMed]
- Nakić, Z.; Posavec, K.; Bačani, A. A Visual Basic Spreadsheet Macro for Geochemical Background Analysis. Ground Water 2007, 45, 642–647. [Google Scholar] [CrossRef] [PubMed]
- Sellerino, M.; Forte, G.; Ducci, D. Identification of the Natural Background Levels in the Phlaegrean Fields Groundwater Body (Southern Italy). J. Geochem. Explor. 2019, 200, 181–192. [Google Scholar] [CrossRef]
- Cruz, J.; Andrade, C. Natural Background Groundwater Composition in the Azores Archipelago (Portugal): A Hydrogeochemical Study and Threshold Value Determination. Sci. Total Environ. 2015, 520, 127–135. [Google Scholar] [CrossRef] [PubMed]
- Biddau, R.; Cidu, R.; Lorrai, M.; Mulas, M.G. Assessing Background Values of Chloride, Sulfate and Fluoride in Groundwater: A Geochemical-Statistical Approach at a Regional Scale. J. Geochem. Explor. 2017, 181, 243–255. [Google Scholar] [CrossRef]
- Panno, S.; Kelly, W.R.; Martinsek, A.T.; Hackley, K.C. Estimating Background and Threshold Nitrate Concentrations Using Probability Graphs. Ground Water 2006, 44, 697–709. [Google Scholar] [CrossRef]
- Parslow, G.R. Determination of Background and Threshold in Exploration Geochemistry. J. Geochem. Explor. 1974, 3, 319–336. [Google Scholar] [CrossRef]
- Kelly, W.R.; Panno, S.V. Some Considerations in Applying Background Concentrations to Ground Water Studies. Ground Water 2008, 46, 790–792. [Google Scholar] [CrossRef]
- Filzmoser, P.; Garrett, R.G.; Reimann, C. Multivariate Outlier Detection in Exploration Geochemistry. Comput. Geosci. 2005, 31, 579–587. [Google Scholar] [CrossRef]
- Sinclair, A.J. A Fundamental Approach to Threshold Estimation in Exploration Geochemistry: Probability Plots Revisited. J. Geochem. Explor. 1991, 41, 1–22. [Google Scholar] [CrossRef]
- Reimann, C.; Filzmoser, P. Normal and Lognormal Data Distribution in Geochemistry: Death of a Myth. Consequences for the Statistical Treatment of Geochemical and Environmental Data. Environ. Geol. 2000, 39, 1001–1014. [Google Scholar] [CrossRef]
- Geranian, H.; Mokhtari, A.R.; Cohen, D.R. Bivariate Probability Plots: A Method for Delineating Different Populations in Soil Geochemical Data. Sci. Total Environ. 2019, 671, 1047–1055. [Google Scholar] [CrossRef]
- Kim, K.-H.; Yun, S.-T.; Kim, H.-K.; Kim, J.-W. Determination of Natural Backgrounds and Thresholds of Nitrate in South Korean Groundwater Using Model-Based Statistical Approaches. J. Geochem. Explor. 2015, 148, 196–205. [Google Scholar] [CrossRef]
- Rahman, A.; Tiwari, K.K.; Mondal, N.C. Assessment of Hydrochemical Backgrounds and Threshold Values of Groundwater in a Part of Desert Area, Rajasthan, India. Environ. Pollut. 2020, 266, 115150. [Google Scholar] [CrossRef] [PubMed]
- Bulut, O.F.; Duru, B.; Çakmak, Ö.; Günhan, Ö.; Dilek, F.B.; Yetis, U. Determination of Groundwater Threshold Values: A Methodological Approach. J. Clean. Prod. 2020, 253. [Google Scholar] [CrossRef]
- Urresti-Estala, B.; Carrasco-Cantos, F.; Vadillo-Pérez, I.; Jiménez-Gavilán, P. Determination of Background Levels on Water Quality of Groundwater Bodies: A Methodological Proposal Applied to a Mediterranean River Basin (Guadalhorce River, Málaga, Southern Spain). J. Environ. Manag. 2013, 117, 121–130. [Google Scholar] [CrossRef] [PubMed]
- Matschullat, J.; Ottenstein, R.; Reimann, C. Geochemical Background—Can We Calculate It? Environ. Geol. 2000, 39, 990–1000. [Google Scholar] [CrossRef]
- Amiri, V.; Nakhaei, M.; Lak, R.; Li, P. An Integrated Statistical-Graphical Approach for the Appraisal of the Natural Background Levels of Some Major Ions and Potentially Toxic Elements in the Groundwater of Urmia Aquifer, Iran. Environ. Earth Sci. 2021, 80, 432. [Google Scholar] [CrossRef]
- Lions, J.; Devau, N.; Elster, D.; Voutchkova, D.D.; Hansen, B.; Schullehner, J.; Petrović Pantić, T.; Samolov, K.A.; Camps, V.; Arnó, G.; et al. A Broad-Scale Method for Estimating Natural Background Levels of Dissolved Components in Groundwater Based on Lithology and Anthropogenic Pressure. Water 2021, 13, 1531. [Google Scholar] [CrossRef]
- Molinari, A.; Guadagnini, L.; Marcaccio, M.; Guadagnini, A. Natural Background Levels and Threshold Values of Chemical Species in Three Large-Scale Groundwater Bodies in Northern Italy. Sci. Total Environ. 2012, 425, 9–19. [Google Scholar] [CrossRef] [PubMed]
- Parrone, D.; Ghergo, S.; Preziosi, E. A Multi-Method Approach for the Assessment of Natural Background Levels in Groundwater. Sci. Total Environ. 2019, 659, 884–894. [Google Scholar] [CrossRef] [PubMed]
- Preziosi, E.; Parrone, D.; del Bon, A.; Ghergo, S. Natural Background Level Assessment in Groundwaters: Probability Plot versus Pre-Selection Method. J. Geochem. Explor. 2014, 143, 43–53. [Google Scholar] [CrossRef]
- Kovač, Z.; Nakić, Z.; Pavlić, K. Influence of Groundwater Quality Indicators on Nitrate Concentrations in the Zagreb Aquifer System. Geol. Croat. 2017, 70, 93–103. [Google Scholar] [CrossRef]
- Kovač, Z.; Cvetković, M.; Parlov, J. Gaussian Simulation of Nitrate Concentration Distribution in the Zagreb Aquifer. J. Maps 2017, 13, 727–732. [Google Scholar] [CrossRef] [Green Version]
- Huljek, L.; Perković, D.; Kovač, Z. Nitrate Contamination Risk of the Zagreb Aquifer. J. Maps 2019, 15, 570–577. [Google Scholar] [CrossRef] [Green Version]
- Kovač, Z.; Nakić, Z.; Barešić, J.; Parlov, J. Nitrate Origin in the Zagreb Aquifer System. Geofluids 2018, 2018, 2789691. [Google Scholar] [CrossRef] [Green Version]
- Kovač, Z.; Nakić, Z.; Špoljarić, D.; Stanek, D.; Bačani, A. Estimation of Nitrate Trends in the Groundwater of the Zagreb Aquifer. Geosciences 2018, 8, 159. [Google Scholar] [CrossRef] [Green Version]
- Kovač, Z.; Bačani, L.; Ružičić, S.; Parlov, J.; Posavec, K.; Buškulić, P. Using Water Stable Isotopes and Cross-Correlation Analysis to Characterize Infiltration of Precipitation through Unsaturated Zone at the Velika Gorica Site of Zagreb Aquifer. J. Hydrol. Eng. 2023, 28, 04023002. [Google Scholar] [CrossRef]
- Kovač, Z. Podrijetlo nitrata u podzemnoj vodi zagrebačkoga aluvijalnoga vodonosnika (Nitrate Origin in Groundwater of the Zagreb Alluvial Aquifer); University of Zagreb, Faculty of Mining, Geology and Petroleum Engineering: Zagreb, Croatia, 2017. [Google Scholar]
- Preziosi, E.; Giuliano, G.; Vivona, R. Natural Background Levels and Threshold Values Derivation for Naturally As, V and F Rich Groundwater Bodies: A Methodological Case Study in Central Italy. Environ. Earth Sci. 2010, 61, 885–897. [Google Scholar] [CrossRef]
- Velic, J.; Saftic, B. Subsurface Spreading and Facies Characteristics of Middle Pleistocene Deposits between Zaprešić and Samobor. Geološki Vjesn 1991, 44, 69–82. [Google Scholar]
- Velić, J.; Saftić, B.; Malvić, T. Lithologic Composition and Stratigraphy of Quaternary Sediments in the Area of the “Jakuševec” Waste Depository (Zagreb, Northern Croatia). Geol. Croat. 1999, 52, 119–130. [Google Scholar]
- Velić, J.; Durn, G. Alternating Lacustrine-Marsh Sedimentation and Subaerial Exposure Phases during Quaternary: Prečko, Zagreb, Croatia. Geol. Croat. 1993, 46, 71–90. [Google Scholar]
- Ružičić, S.; Mileusnić, M.; Posavec, K. Building Conceptual and Mathematical Model for Water Flow and Solute Transport in the Unsaturated Zone at Kosnica Site. Rud. -Geološko-Naft. Zb. 2012, 25, 21–31. [Google Scholar]
- Posavec, K.; Vukojević, P.; Ratkaj, M.; Bedeniković, T. Cross-Correlation Modelling of Surface Water—Groundwater Interaction Using the Excel Spreadsheet Application. Rud. -Geološko-Naft. Zb. 2017, 32, 25–32. [Google Scholar] [CrossRef]
- Parlov, J.; Kovač, Z.; Nakić, Z.; Barešić, J. Using Water Stable Isotopes for Identifying Groundwater Recharge Sources of the Unconfined Alluvial Zagreb Aquifer (Croatia). Water 2019, 11, 2177. [Google Scholar] [CrossRef] [Green Version]
- Barešić, J.; Parlov, J.; Kovač, Z.; Sironić, A. Use of Nuclear Power Plant Released Tritium as a Groundwater Tracer. Rud. -Geološko-Naft. Zb. 2020, 35, 25–35. [Google Scholar] [CrossRef] [Green Version]
- Kovač, Z.; Barešić, J.; Parlov, J.; Sironić, A. Impact of Hydrological Conditions on the Isotopic Composition of the Sava River in the Area of the Zagreb Aquifer. Water 2022, 14, 2263. [Google Scholar] [CrossRef]
- Posavec, K. Identifikacija i prognoza minimalnih razina podzemne vode zagrebackoga aluvijalnog vodonosnika modelima recesijskih krivulja (Identification and Prediction of Minimum Ground Water Levels of Zagreb Alluvial Aquifer Using Recession Curve Models); University of Zagreb, Faculty of Mining, Geology and Petroleum Engineering: Zagreb, Croatia, 2006. [Google Scholar]
- Bogunović, M.; Vidaček, Ž.; Husnjak, S.; Sraka, M. Inventory of Soils in Croatia. Agric. Conspec. Sci. 1998, 63, 105–112. [Google Scholar]
- Ružičić, S. Model Transporta Potencijalno Toksičnih Elemenata Kroz Nesaturiranu Zonu na Području Regionalnoga Vodocrpilišta Kosnica (Transport Model of Potentially Toxic Elements through Unsaturated Zone at Regional Wellfield Kosnica); Faculty of Mining, Geology and Petroleum Engineering, University of Zagreb: Zagreb, Croatia, 2013. [Google Scholar]
- Nakić, Z.; Horvat, S.; Bačani, A. Statistical Indicators of Groundwater Geochemical Characteristics in a Quaternary Aquifer from the Mala Mlaka Well Field Catchment Area (Zagreb, Croatia). Geol. Croat. 2005, 58, 87–99. [Google Scholar] [CrossRef]
- Vlahović, T.; Bačani, A.; Posavec, K. Hydrogeochemical Stratification of the Unconfined Samobor Aquifer (Zagreb, Croatia). Environ. Geol. 2009, 57, 1707–1722. [Google Scholar] [CrossRef]
- Buškulić, P.; Parlov, J. Hydrogeochemical Facies of Groundwater in the Influence Area of the Velika Gorica Well Field. In Proceedings of the Mathematical Methods and Terminology in Geology 2022, 4th Croatian Scientific Congress about Geomathematics and Terminology in Geology; Malvić, T., Ivšinović, J., Eds.; University of Zagreb, Faculty of Mining, Geology and Petroleum Engineering: Zagreb, Croatia, 2022; pp. 1–196. [Google Scholar]
- Lilliefors, H.W. On the Kolmogorov-Smirnov Test for Normality with Mean and Variance Unknown. J. Am. Stat. Assoc. 1967, 62, 399–402. [Google Scholar] [CrossRef]
- de Lima Rodrigues, A.S.; Malafaia, G.; Costa, A.T.; Nalini Junior, H.A. Background Values for Chemical Elements in Sediments of the Gualaxo Do Norte River Basin, MG, Brazil. Rev. De Ciências Ambient. —RCA 2013, 7, 15–32. [Google Scholar] [CrossRef]
- Nakić, Z.; Kovač, Z.; Parlov, J.; Perković, D. Ambient Background Values of Selected Chemical Substances in Four Groundwater Bodies in the Pannonian Region of Croatia. Water 2020, 12, 2671. [Google Scholar] [CrossRef]
- Lepeltier, C. A Simplified Statistical Treatment of Geochemical Data by Graphical Representation. Econ. Geol. 1969, 64, 538–550. [Google Scholar] [CrossRef]
- Nakić, Z.; Posavec, K.; Parlov, J. Model-Based Objective Methods for the Estimation of Groundwater Geo- Chemical Background. Aqua Mundi 2010, 1, 65–72. [Google Scholar] [CrossRef]
- Marković, T.; Brkić, Ž.; Larva, O. Using Hydrochemical Data and Modelling to Enhance the Knowledge of Groundwater Flow and Quality in an Alluvial Aquifer of Zagreb, Croatia. Sci. Total Environ. 2013, 458–460, 508–516. [Google Scholar] [CrossRef]
- Rahman, A.; Mondal, N.C.; Tiwari, K.K. Anthropogenic Nitrate in Groundwater and Its Health Risks in the View of Background Concentration in a Semi Arid Area of Rajasthan, India. Sci. Rep. 2021, 11, 9279. [Google Scholar] [CrossRef] [PubMed]


| Min | Max | Mean | SD | Median | CV | N | Interval | |
|---|---|---|---|---|---|---|---|---|
| All wells | 0.2 | 35.7 | 19.6 | 5.7 | 19.5 | 29.0 | 944 | 2001–2020 |
| Čdp-3/2 | 0.2 | 19.8 | 12.4 | 4.3 | 13.7 | 34.6 | 63 | 2001–2020 |
| Čp-23 | 14.0 | 28.3 | 19.8 | 3.5 | 19.0 | 17.9 | 73 | 2001–2020 |
| Lg-1 | 4.0 | 35.4 | 25.5 | 5.5 | 25.2 | 21.4 | 100 | 2001–2020 |
| Lg-4 | 0.2 | 31.0 | 21.1 | 7.0 | 22.6 | 33.2 | 92 | 2001–2002; 2004; 2006–2020 |
| P-7 | 6.2 | 33.1 | 17.8 | 6.0 | 18.6 | 33.9 | 99 | 2001–2020 |
| Vg-1 | 15.1 | 32.0 | 20.3 | 3.0 | 19.5 | 14.6 | 112 | 2001–2020 |
| Vg-10/2 | 14.6 | 34.7 | 20.5 | 2.9 | 20.5 | 14.4 | 66 | 2009–2020 |
| Vg-11 | 10.2 | 24.9 | 15.1 | 2.5 | 15.1 | 16.8 | 63 | 2001–2020 |
| Vg-4 | 15.5 | 27.4 | 21.3 | 2.5 | 21.2 | 11.7 | 110 | 2001–2020 |
| Vg-6 | 12.4 | 27.5 | 17.3 | 3.0 | 17.1 | 17.3 | 73 | 2001–2020 |
| Vg-9 | 11.5 | 20.2 | 15.1 | 1.8 | 15.1 | 11.9 | 58 | 2003–2020 |
| Vg-5/2 | 17.7 | 35.7 | 28.9 | 3.3 | 29.2 | 11.5 | 35 | 2014–2020 |
| Sava River | 1.3 | 14.6 | 6.8 | 1.9 | 6.6 | 28.0 | 627 | 2001–2015 |
| Precipitation | 0.03 | 5.2 | 0.8 | 0.7 | 0.5 | 94.8 | 1225 | 2001–2015 |
| Monitoring Well | Lilliefors Test | |
|---|---|---|
| D | Dcrit | |
| Čdp-3/2 | 0.232 | 0.112 |
| Čp-23 | 0.135 | 0.104 |
| Lg-1 | 0.098 | 0.089 |
| Lg-4 | 0.212 | 0.092 |
| P-7 | 0.106 | 0.089 |
| Vg-1 | 0.140 | 0.084 |
| Vg-10/2 | 0.148 | 0.109 |
| Vg-11 | 0.086 | 0.112 |
| Vg-4 | 0.070 | 0.084 |
| Vg-6 | 0.099 | 0.104 |
| Vg-9 | 0.087 | 0.116 |
| Vg-5/2 | 0.149 | 0.150 |
Disclaimer/Publisher’s Note: The statements, opinions and data contained in all publications are solely those of the individual author(s) and contributor(s) and not of MDPI and/or the editor(s). MDPI and/or the editor(s) disclaim responsibility for any injury to people or property resulting from any ideas, methods, instructions or products referred to in the content. |
© 2023 by the authors. Licensee MDPI, Basel, Switzerland. This article is an open access article distributed under the terms and conditions of the Creative Commons Attribution (CC BY) license (https://creativecommons.org/licenses/by/4.0/).
Share and Cite
Buškulić, P.; Parlov, J.; Kovač, Z.; Nakić, Z. Estimation of Nitrate Background Value in Groundwater under the Long-Term Human Impact. Hydrology 2023, 10, 63. https://doi.org/10.3390/hydrology10030063
Buškulić P, Parlov J, Kovač Z, Nakić Z. Estimation of Nitrate Background Value in Groundwater under the Long-Term Human Impact. Hydrology. 2023; 10(3):63. https://doi.org/10.3390/hydrology10030063
Chicago/Turabian StyleBuškulić, Patricia, Jelena Parlov, Zoran Kovač, and Zoran Nakić. 2023. "Estimation of Nitrate Background Value in Groundwater under the Long-Term Human Impact" Hydrology 10, no. 3: 63. https://doi.org/10.3390/hydrology10030063