
Reconstruction of Recharge and Discharge Pattern in the Polder Drainage Canal Network


Abstract
:1. Introduction
2. Materials and Methods
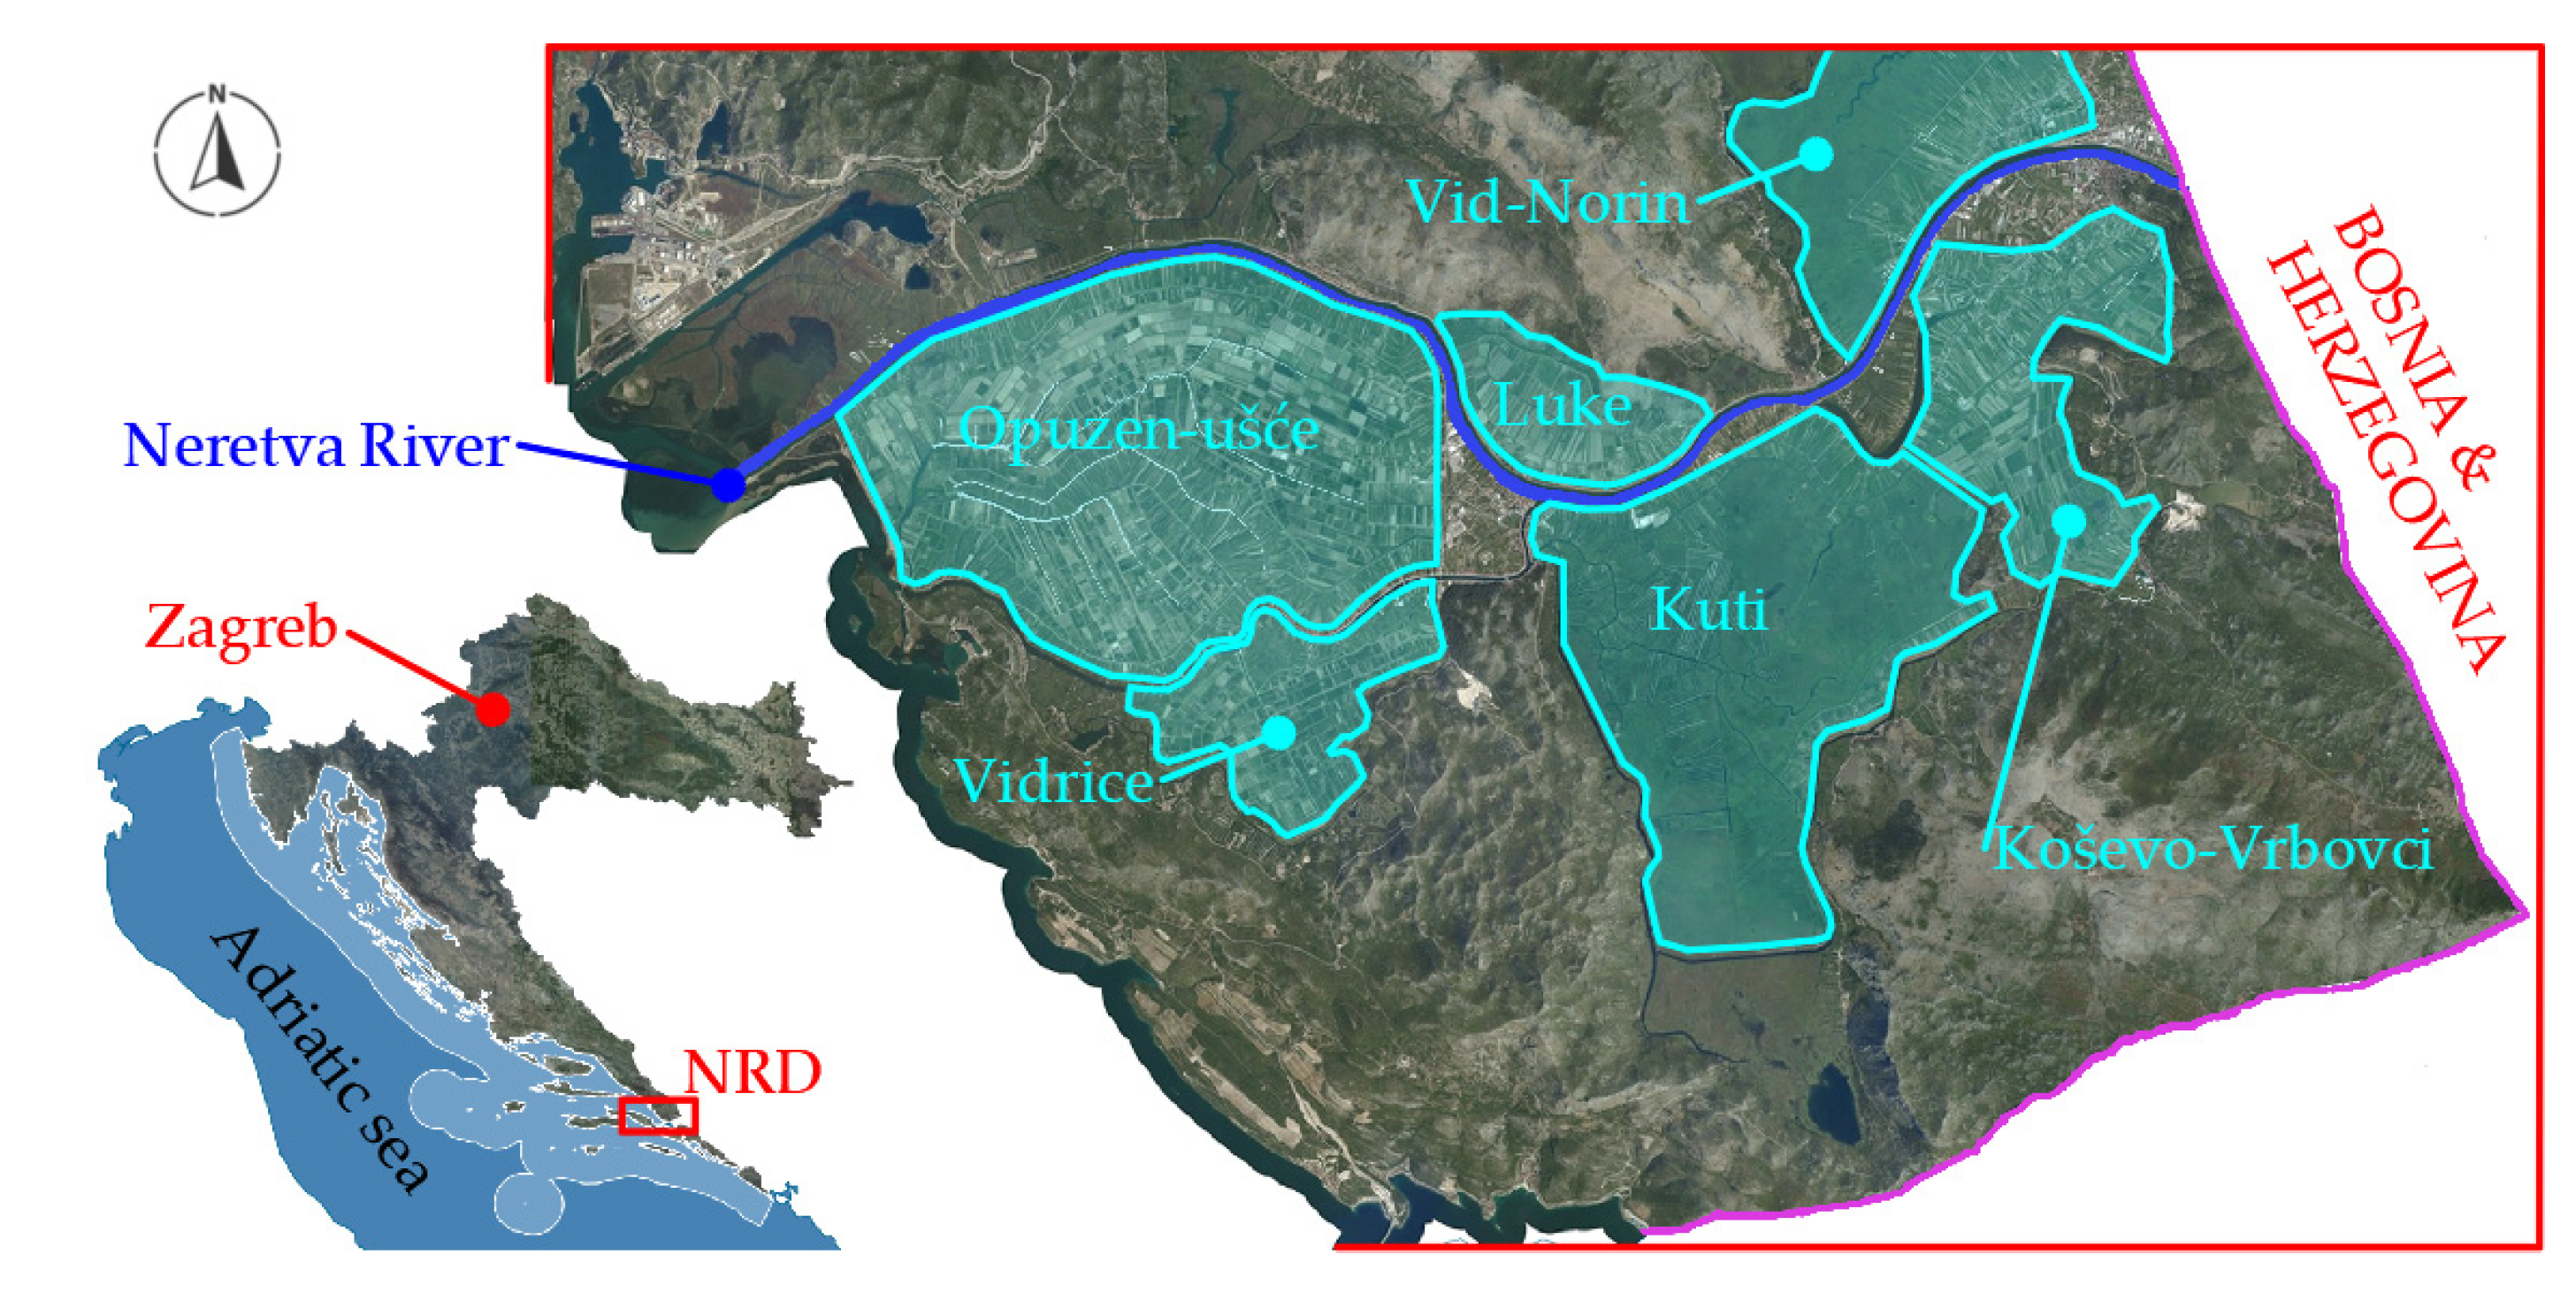
2.1. Study Area
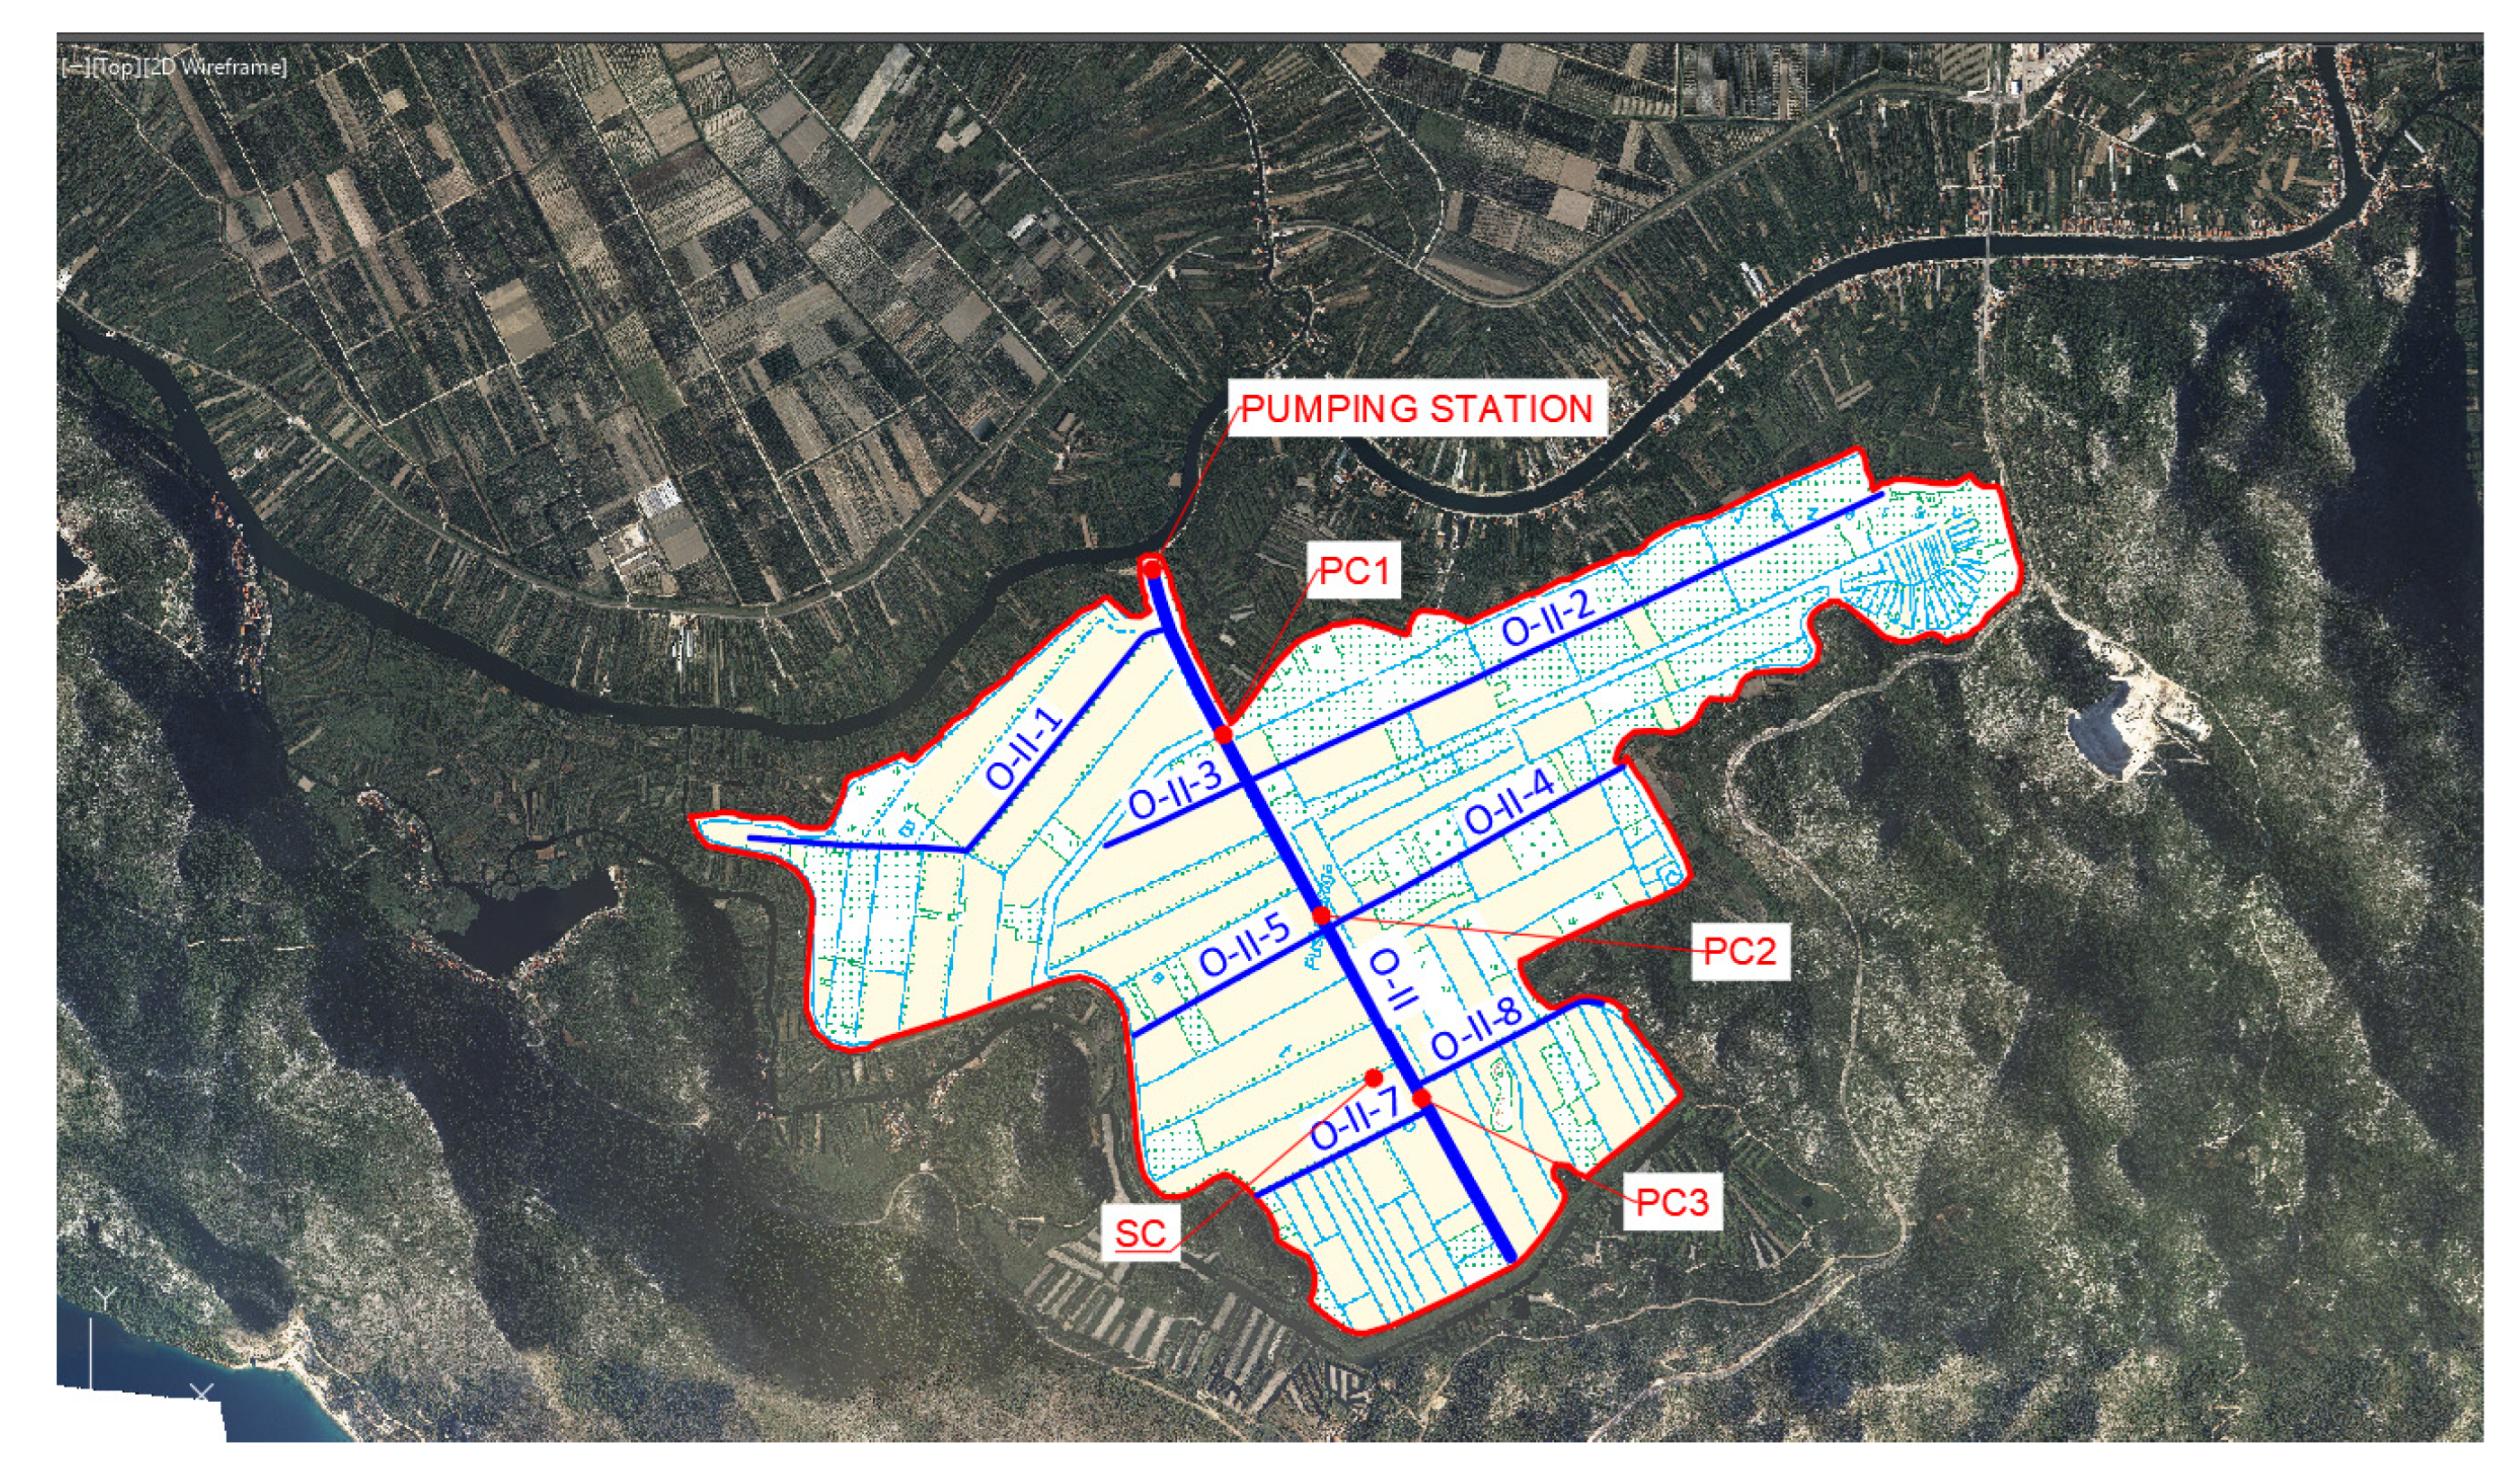
2.2. Drainage Canal Network
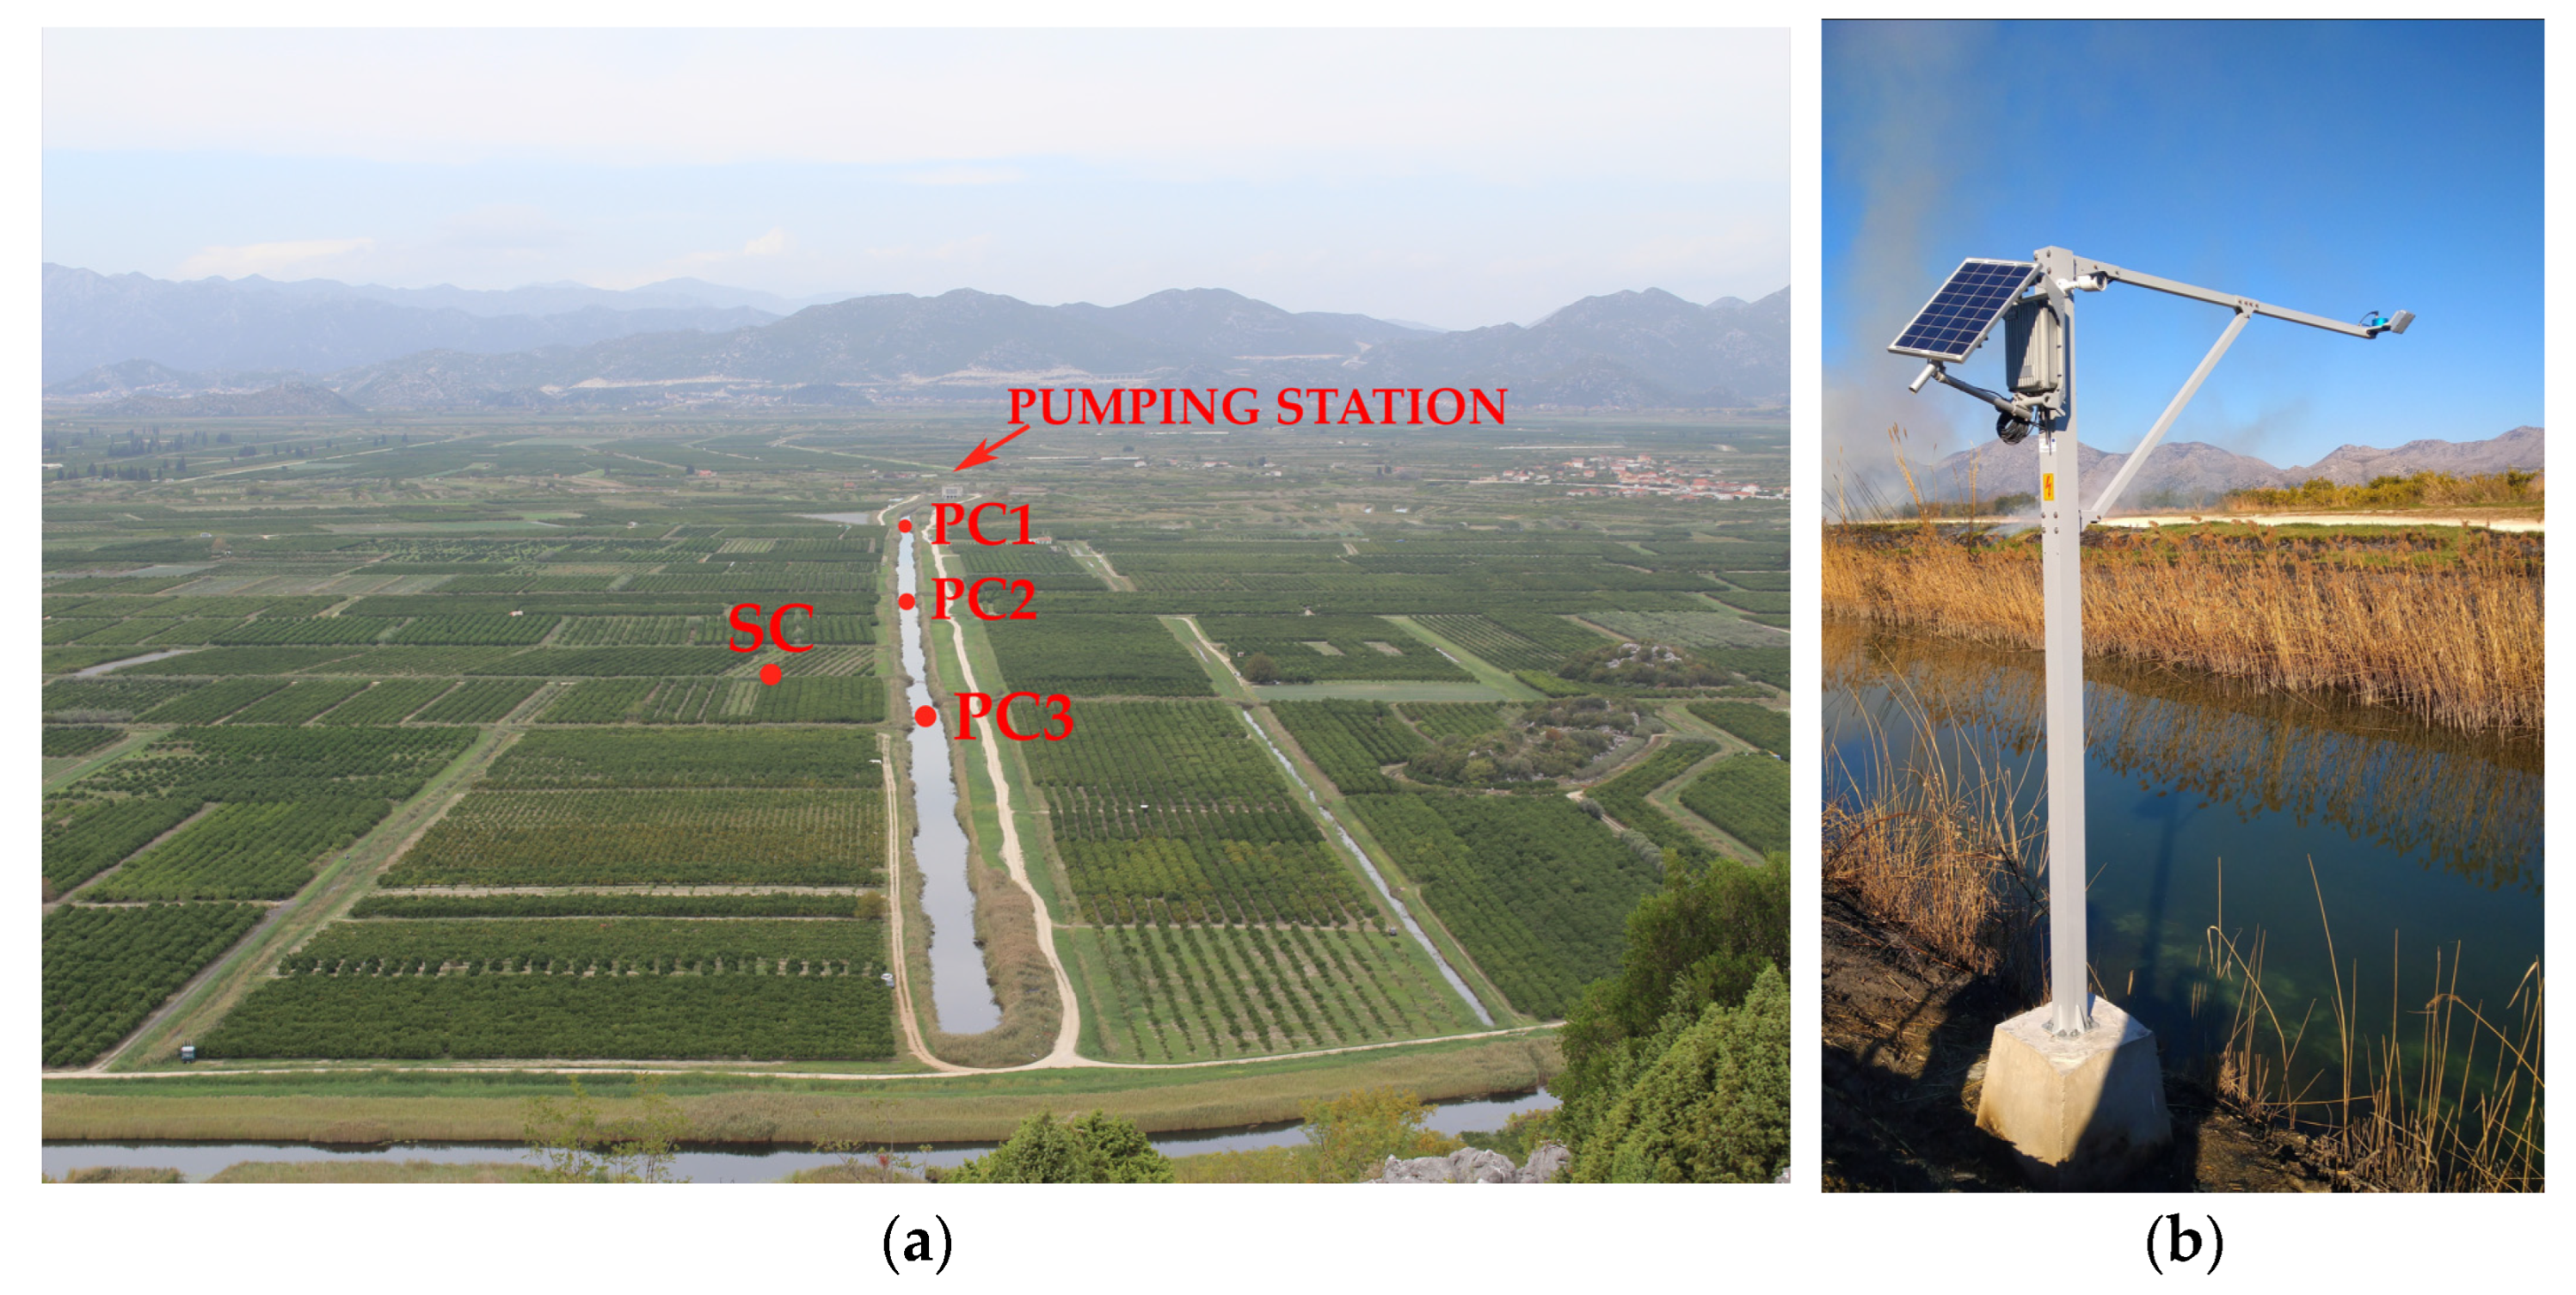
2.3. Surface Water Monitoring
2.4. Data Processing
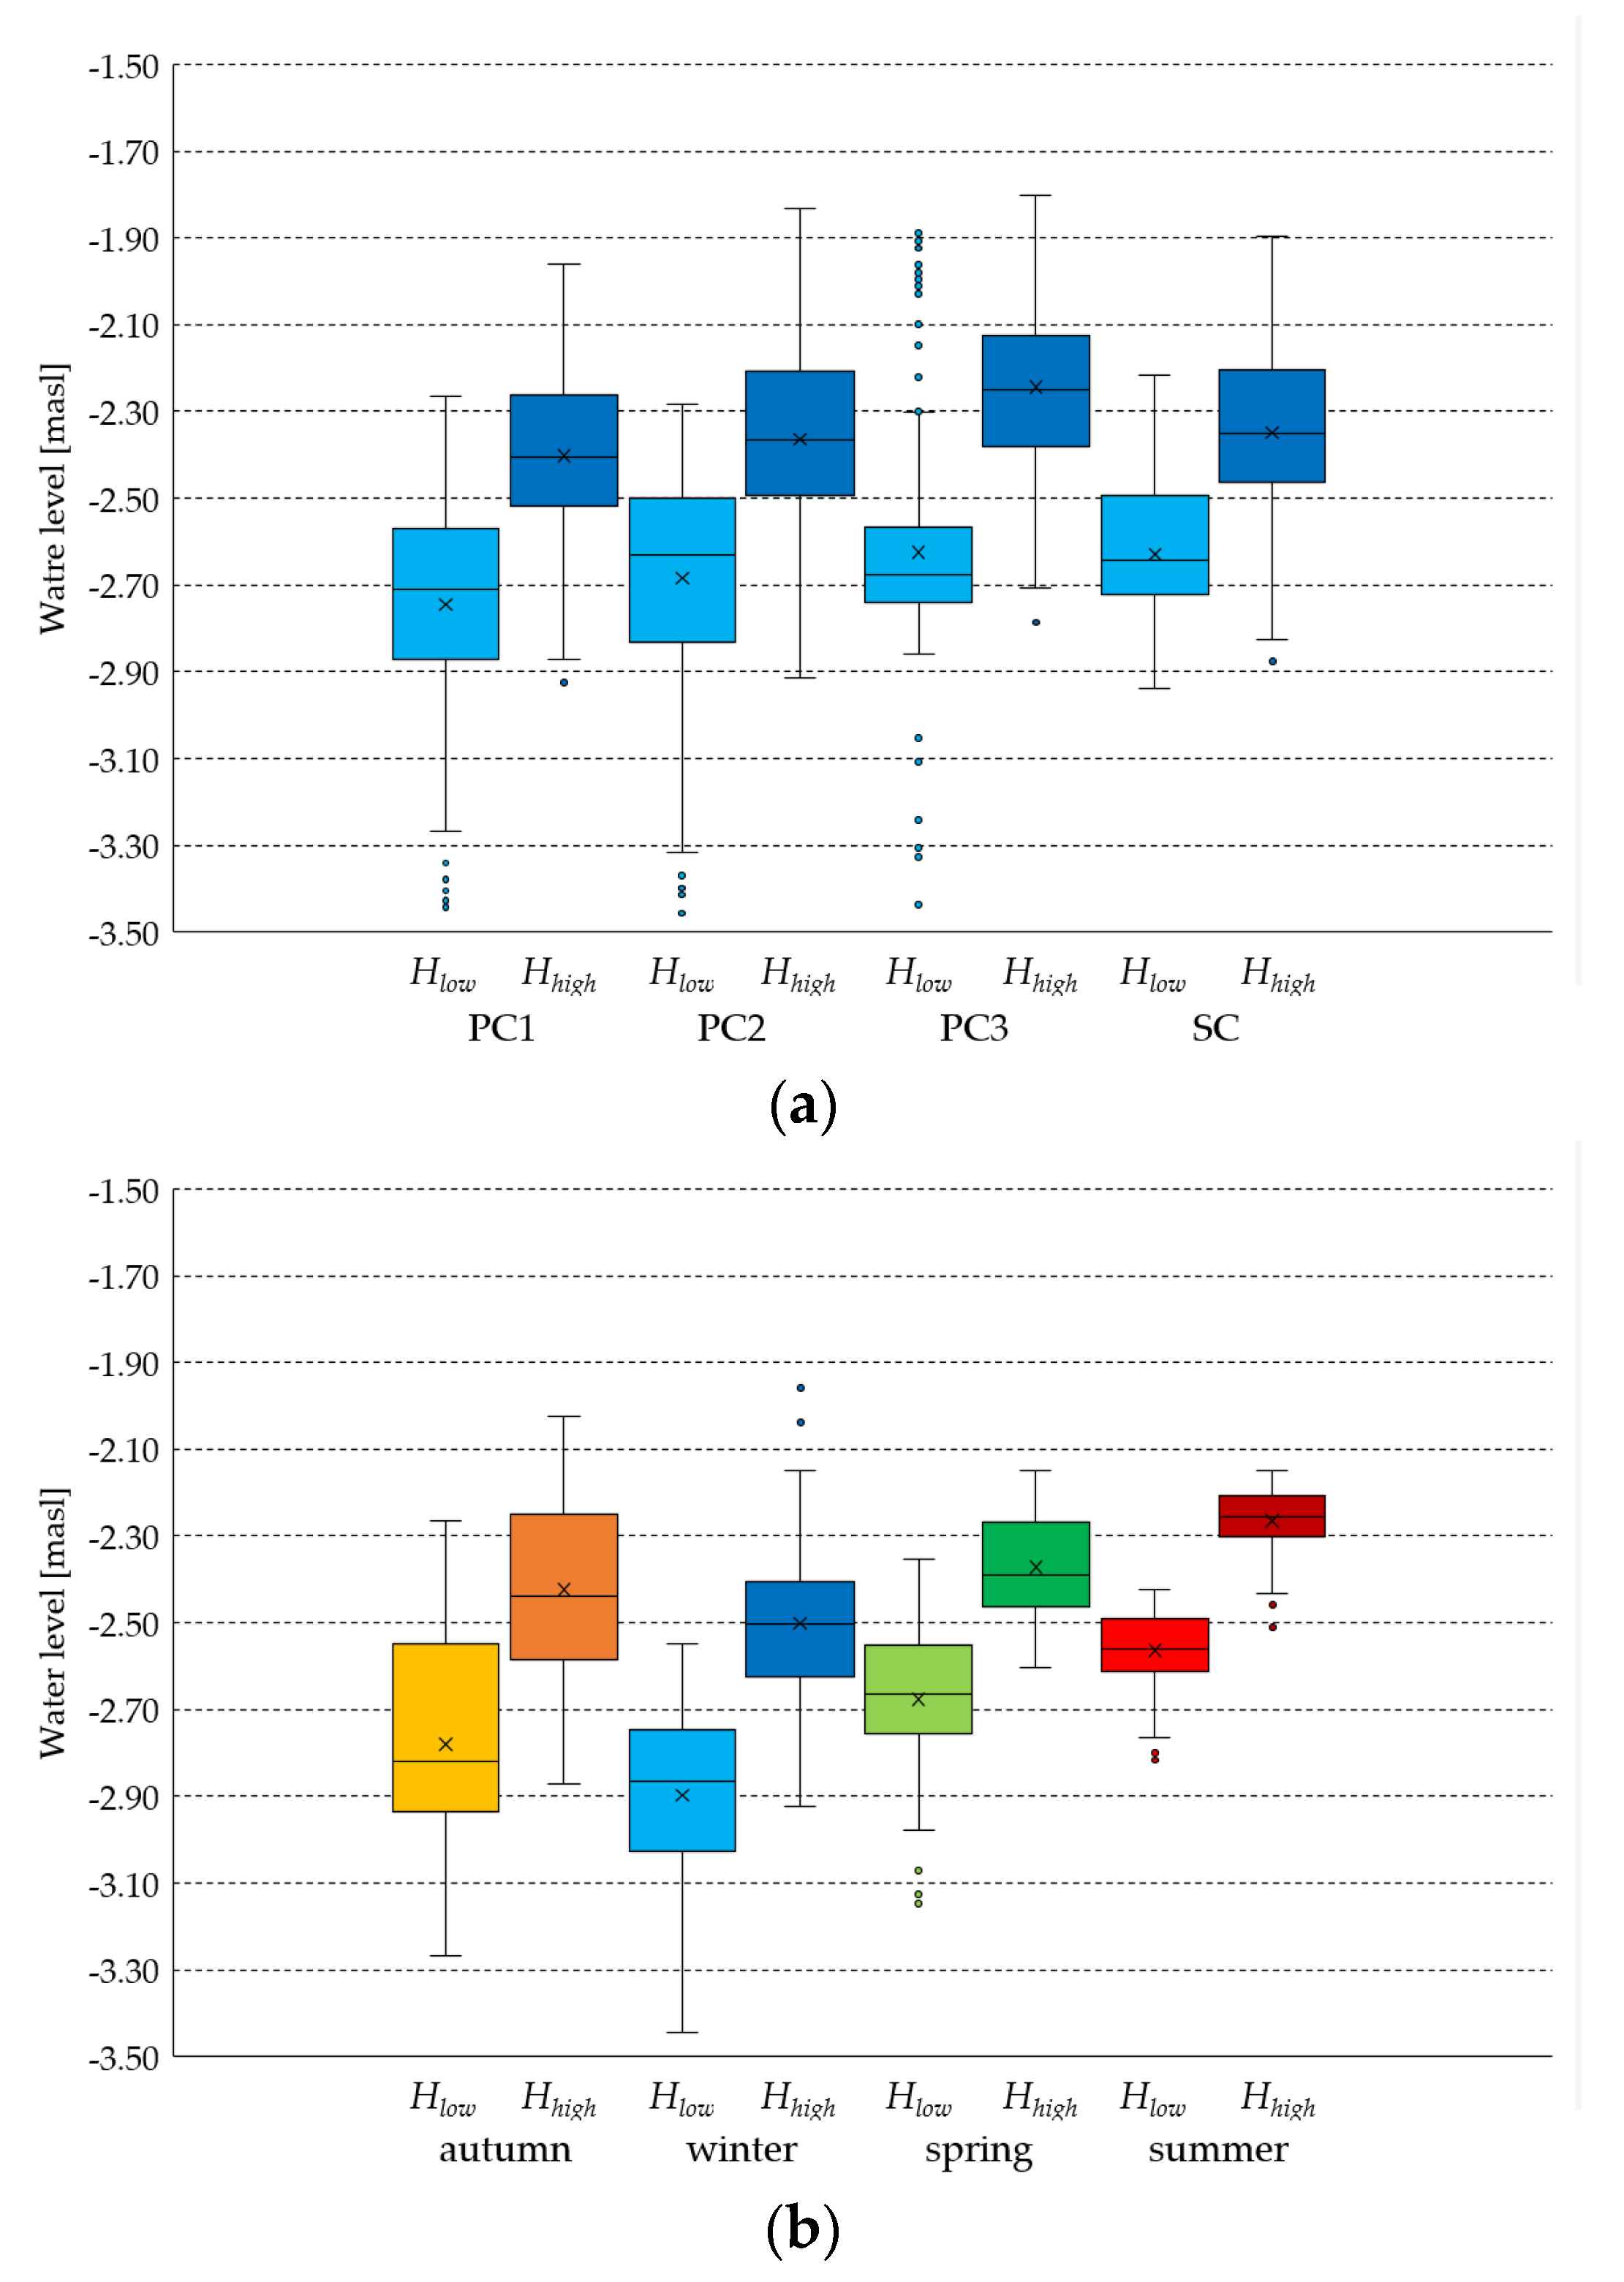
3. Results
4. Discussion
5. Conclusions
Author Contributions
Funding
Institutional Review Board Statement
Data Availability Statement
Acknowledgments
Conflicts of Interest
References
- Bilal, A.; Xie, Q.; Zhai, Y. Flow, Sediment, and Morpho-Dynamics of River Confluence in Tidal and Non-Tidal Environments. J. Mar. Sci. Eng. 2020, 8, 591. [Google Scholar] [CrossRef]
- Nordlund, L.M.; de la Torre-Castro, M.; Erlandsson, J.; Conand, C.; Muthiga, N.; Jiddawi, N.; Gullström, M. Intertidal Zone Management in the Western Indian Ocean: Assessing Current Status and Future Possibilities Using Expert Opinions. AMBIO 2014, 43, 1006–1019. [Google Scholar] [CrossRef] [PubMed] [Green Version]
- Osawa, T.; Mitsuhashi, H.; Ushimaru, A. River confluences enhance riparian plant species diversity. Plant Ecol. 2010, 209, 95–108. [Google Scholar] [CrossRef]
- Kumer Saha, C.; Alam, M. Popularizing farm machinery in the polder zones of Bangladesh. Polder Tidings 2021, 3, 10–11. [Google Scholar]
- Eden, J.M.; Kew, S.F.; Bellprat, O.; Lenderink, G.; Manola, I.; Omrani, H.; van Oldenborgh, G.J. Extreme precipitation in the Netherlands: An event attribution case study. Weather Clim. Extrem. 2018, 21, 90–101. [Google Scholar] [CrossRef]
- CHANGE WE CARE. Adaptation/Management Plan for Neretva River Delta. Climate cHallenges on coAstal and traNsitional chanGing arEas: WEaving a Cross-Adriatic Response; European Union: Maastricht, The Netherlands, 2021. [Google Scholar]
- Gajić-Čapka, M.; Güttler, I.; Cindrić, K.; Branković, Č. Observed and simulated climate and climate change in the lower Neretva river basin. J. Water Clim. Chang. 2018, 9, 124–136. [Google Scholar] [CrossRef]
- Vallejos, A.; Sola, F.; Pulido-Bosch, A. Processes Influencing Groundwater Level and the Freshwater-Saltwater Interface in a Coastal Aquifer. Water Resour. Manag. 2015, 29, 679–697. [Google Scholar] [CrossRef]
- Vranješ, M.; Prskalo; Džeba, T. Hydrology and hydrogeology of the Neretva and Trebišnjica basins, overview of the construction of part of the HE system-upper horizons. e-ZBORNIK Electron. Collect. Pap. Fac. Civ. Eng. 2013, 5, 1–13. [Google Scholar]
- Prajapati, R.; Upadhyay, S.; Talchabhadel, R.; Thapa, B.R.; Ertis, B.; Silwal, P.; Davids, J.C. Investigating the nexus of groundwater levels, rainfall and land-use in the Kathmandu Valley, Nepal. Groundw. Sustain. Dev. 2021, 14, 100584. [Google Scholar] [CrossRef]
- Wang, S.; Zhang, Q.; Wang, J.; Liu, Y.; Zhang, Y. Relationship between Drought and Precipitation Heterogeneity: An Analysis across Rain-Fed Agricultural Regions in Eastern Gansu, China. Atmosphere 2021, 12, 1274. [Google Scholar] [CrossRef]
- Lovrinović, I.; Bergamasco, A.; Srzić, V.; Cavallina, C.; Holjević, D.; Donnici, S.; Erceg, J.; Zaggia, L.; Tosi, L. Groundwater Monitoring Systems to Understand Sea Water Intrusion Dynamics in the Mediterranean: The Neretva Valley and the Southern Venice Coastal Aquifers Case Studies. Water 2021, 13, 561. [Google Scholar] [CrossRef]
- Šimunić, I.; Likso, T.; Orlović-Leko, P.; Ciglenečki, I.; Bubalo Kovačić, M.; Gilja, G.; Mustać, I. The influence of combined drainage on the stability of agricultural production in condition of climate change. Reliab. Theory Appl. 2022, 17, 82–87. [Google Scholar] [CrossRef]
- Mazibuko, N.; Antwil, M.; Rubhara, T. Agricultural infrastructure as the driver of emerging farmers’ income in South Africa. A stochastic frontier approach. Agron. Colomb. 2020, 38, 261–271. [Google Scholar] [CrossRef]
- Cosgrove, W.J.; Loucks, D.P. Water management: Current and future challenges and research directions. Water Resour. Res. 2015, 51, 4823–4839. [Google Scholar] [CrossRef] [Green Version]
- Nowak, B.; Ptak, M.; Bartczak, J.; Sojka, M. Hydraulic Structures as a Key Component of Sustainable Water Management at the Catchment Scale—Case Study of the Rgilewka River (Central Poland). Buildings 2022, 12, 675. [Google Scholar] [CrossRef]
- Bekić, D.; Halkijević, I.; Gilja, G.; Lončar, G.; Potočki, K.; Carević, D. Examples of trends in water management systems under influence of modern technologies. Građevinar 2019, 71, 833–842. [Google Scholar] [CrossRef]
- Jayaraman, P.P.; Yavari, A.; Georgakopoulos, D.; Morshed, A.; Zaslavsky, A. Internet of Things Platform for Smart Farming: Experiences and Lessons Learnt. Sensors 2016, 16, 1884. [Google Scholar] [CrossRef]
- AlMetwally, S.A.H.; Hassan, M.K.; Mourad, M.H. Real Time Internet of Things (IoT) Based Water Quality Management System. Procedia CIRP 2020, 91, 478–485. [Google Scholar] [CrossRef]
- dos Santos, U.J.L.; Pessin, G.; da Costa, C.A.; da Rosa Righi, R. AgriPrediction: A proactive internet of things model to anticipate problems and improve production in agricultural crops. Comput. Electron. Agric. 2019, 161, 202–213. [Google Scholar] [CrossRef]
- Gorji, T.; Sertel, E.; Tanik, A. Monitoring soil salinity via remote sensing technology under data scarce conditions: A case study from Turkey. Ecol. Indic. 2017, 74, 384–391. [Google Scholar] [CrossRef]
- Borah, S.; Kumar, R.; Mukherjee, S. Low-cost IoT framework for irrigation monitoring and control. Int. J. Intell. Unmanned Syst. 2020, 9, 63–79. [Google Scholar] [CrossRef]
- Morais, R.; Silva, N.; Mendes, J.; Adão, T.; Pádua, L.; López-Riquelme, J.A.; Pavón-Pulido, N.; Sousa, J.J.; Peres, E. mySense: A comprehensive data management environment to improve precision agriculture practices. Comput. Electron. Agric. 2019, 162, 882–894. [Google Scholar] [CrossRef]
- Vranješ, M.; Romić, D. Construction of the barrier in the Neretva River. In Proceedings of the 5th Croatian Water Conference with International Participation: Croatian Waters Facing the Challenge of Climate Changes, Opatija, Croatia, 18–21 May 2011. [Google Scholar]
- Krvavica, N.; Gotovac, H.; Lončar, G. Salt-wedge dynamics in microtidal Neretva River estuary. Reg. Stud. Mar. Sci. 2021, 43, 101713. [Google Scholar] [CrossRef]
- Ljubenkov, I.; Vranješ, M. Numerical model of stratified flow—Case study of the Neretva riverbed salination. Građevinar 2012, 64, 101–112. [Google Scholar] [CrossRef]
- Romić, D.; Zovko, M.; Romić, M.; Ondrašek, G.; Salopek, Z. Quality aspects of the surface water used for irrigation in the Neretva Delta (Croatia). J. Water Land Dev. 2008, 12, 59–70. [Google Scholar] [CrossRef] [Green Version]
- Palmer, M.D.; Domingues, C.M.; Slangen, A.B.A.; Dias, F.B. An ensemble approach to quantify global mean sea-level rise over the 20th century from tide gauge reconstructions. Environ. Res. Lett. 2021, 16, 044043. [Google Scholar] [CrossRef]
- Fox-Kemper, B.; Hewitt, H.T.; Xiao, C.; Aðalgeirsdóttir, G.; Drijfhout, S.S.; Edwards, T.L.; Golledge, N.R.; Hemer, M.; Kopp, R.E.; Krinner, G.; et al. Ocean, cryosphere, and sea level change. In Climate Change 2021: The Physical Science Basis. Contribution of Working Group I to the Sixth Assessment Report to the Intergovernmental Panel on Climate Change; Masson-Delmotte, V., Zhai, P., Pirani, A., Connors, S.L., Péan, C., Berger, S., Caud, N., Chen, Y., Goldfarb, L., Gomis, M.I., et al., Eds.; Cambridge University Press: Cambridge, UK, 2021. [Google Scholar]
- Margeta, J.; Fistanić, I. System management and monitoring at the Neretva river basin. Građevinar 2000, 52, 331–338. [Google Scholar]
- Romić, D.; Castrignanò, A.; Romić, M.; Buttafuoco, G.; Bubalo Kovačić, M.; Ondrašek, G.; Zovko, M. Modelling spatial and temporal variability of water quality from different monitoring stations using mixed effects model theory. Sci. Total Environ. 2020, 704, 135875. [Google Scholar] [CrossRef]
- Srzić, V.; Lovrinović, I.; Racetin, I.; Pletikosić, F. Hydrogeological Characterization of Coastal Aquifer on the Basis of Observed Sea Level and Groundwater Level Fluctuations: Neretva Valley Aquifer, Croatia. Water 2020, 12, 348. [Google Scholar] [CrossRef] [Green Version]
- Lovrinović, I.; Srzić, V.; Matić, I.; Brkić, M. Combined Multilevel Monitoring and Wavelet Transform Analysis Approach for the Inspection of Ground and Surface Water Dynamics in Shallow Coastal Aquifer. Water 2022, 14, 656. [Google Scholar] [CrossRef]
- Krvavica, N.; Ružić, I. Assessment of sea-level rise impacts on salt-wedge intrusion in idealized and Neretva River Estuary. Estuar. Coast. Shelf Sci. 2020, 234, 106638. [Google Scholar] [CrossRef] [Green Version]
- Gilja, G.; Kuspilić, N.; Romić, D.; Zovko, M.; Harasti, A. Advanced monitoring of soil salinization risk in the Neretva Delta agroecosystem. In Proceedings of the EGU General Assembly 2021, Wien, Austria, 19–30 April 2021. [Google Scholar] [CrossRef]
- Sung, J.H.; Baek, D.; Ryu, Y.; Seo, S.B.; Seong, K.-W. Effects of Hydro-Meteorological Factors on Streamflow Withdrawal for Irrigation in Yeongsan River Basin. Sustainability 2021, 13, 4969. [Google Scholar] [CrossRef]
- Deković, J. Interpretacija Mjerenja na Području Opuzen-Ušće i Vidrice iz 2014. Godine. Ph.D. Thesis, University of Split, Split, Croatia, 2015. [Google Scholar]
- Holjević, D. Zaštita od zaslanjivanja voda i tla u dolini Neretve. Hrvat. Vodoprivr. 2020, 230, 50–54. [Google Scholar]
- Samokovlija Dragičević, J. Irrigation problems in lower reaches of Neretva. Građevinar 2008, 60, 373–378. [Google Scholar]
- Gajić-Čapka, M. Oborina na širem dubrovačkom području. Hrvat. Vode 2010, 18, 305–312. [Google Scholar]
- Reljić, M.; Romić, M.; Romić, D.; Gilja, G.; Mornar, V.; Ondrasek, G.; Bubalo Kovačić, M.; Zovko, M. Advanced Continuous Moni-toring System—Tools for Water Resource Management and Decision Support System in Salt Affected Delta. Agriculture 2023, 13, 369. [Google Scholar] [CrossRef]
- Goring, D.; Nikora, V. Despiking Acoustic Doppler Velocimeter Data. J. Hydraul. Eng. 2002, 128, 117–126. [Google Scholar] [CrossRef] [Green Version]
- Baker, D.B.; Richards, R.P.; Loftus, T.T.; Kramer, J.W. A New Flashiness Index: Characteristics And Applications To Midwestern Rivers And Streams. JAWRA J. Am. Water Resour. Assoc. 2004, 40, 503–522. [Google Scholar] [CrossRef]
- Yu, L.; Rozemeijer, J.; van Breukelen, B.M.; Ouboter, M.; van der Vlugt, C.; Broers, H.P. Groundwater impacts on surface water quality and nutrient loads in lowland polder catchments: Monitoring the greater Amsterdam area. Hydrol. Earth Syst. Sci. 2018, 22, 487–508. [Google Scholar] [CrossRef] [Green Version]
- Bastiene, N.; Saulys, V. Maintanance peculiarities of polder systems in Lithuania during the last decade. In Proceedings of the International Scientific Conference: Research for Rural Development 2007, Jelgava, Latvia, 16–18 May 2007. [Google Scholar]
- Blinco, L.J.; Simpson, A.R.; Lambert, M.F.; Marchi, A. Comparison of Pumping Regimes for Water Distribution Systems to Minimize Cost and Greenhouse Gases. J. Water Resour. Plan. Manag. 2016, 142, 04016010. [Google Scholar] [CrossRef] [Green Version]
- Napierała, M. A Study on Improving Economy Efficiency of Pumping Stations Based on Tariff Changes. Energies 2022, 15, 799. [Google Scholar] [CrossRef]
- Aydin, B.E.; Oude Essink, G.H.P.; Delsman, J.R.; van de Giesen, N.; Abraham, E. Nonlinear model predictive control of salinity and water level in polder networks: Case study of Lissertocht catchment. Agric. Water Manag. 2022, 264, 107502. [Google Scholar] [CrossRef]
- Aydin, B.E.; Rutten, M.; Oude Essink, G.H.P.; Delsman, J. Polder Flushing: Model Predictive Control of Flushing Operations to Effective and Real Time Control of Salinity in Polders. Procedia Eng. 2016, 154, 94–98. [Google Scholar] [CrossRef] [Green Version]
- Horváth, K.; van Esch, B.; Vreeken, T.; Piovesan, T.; Talsma, J.; Pothof, I. Potential of model predictive control of a polder water system including pumps, weirs and gates. J. Process Control 2022, 119, 128–140. [Google Scholar] [CrossRef]
- O’Kane, J.P.; Migliori, L. The Hydrology and Hydraulics of a Pumped Polder in North Kerry. In Proceedings of the 2004 Irish National Hydrology Conference, London, UK, 10 November 2004. [Google Scholar]
- Yan, R.; Gao, J.; Huang, J. WALRUS-paddy model for simulating the hydrological processes of lowland polders with paddy fields and pumping stations. Agric. Water Manag. 2016, 169, 148–161. [Google Scholar] [CrossRef]
- Yan, R.; Li, L.; Gao, J. Modelling the regulation effects of lowland polder with pumping station on hydrological processes and phosphorus loads. Sci. Total Environ. 2018, 637–638, 200–207. [Google Scholar] [CrossRef]


| Monitoring Station | Number of Missing Data | Number of Outliers Removed by Filtering | Number of Data for the Entire Time Span |
|---|---|---|---|
| PC1 | 928 | 2 | 54,672 |
| PC2 | 807 | 5905 | |
| PC3 | 834 | 9588 | |
| SC | 453 | 0 |
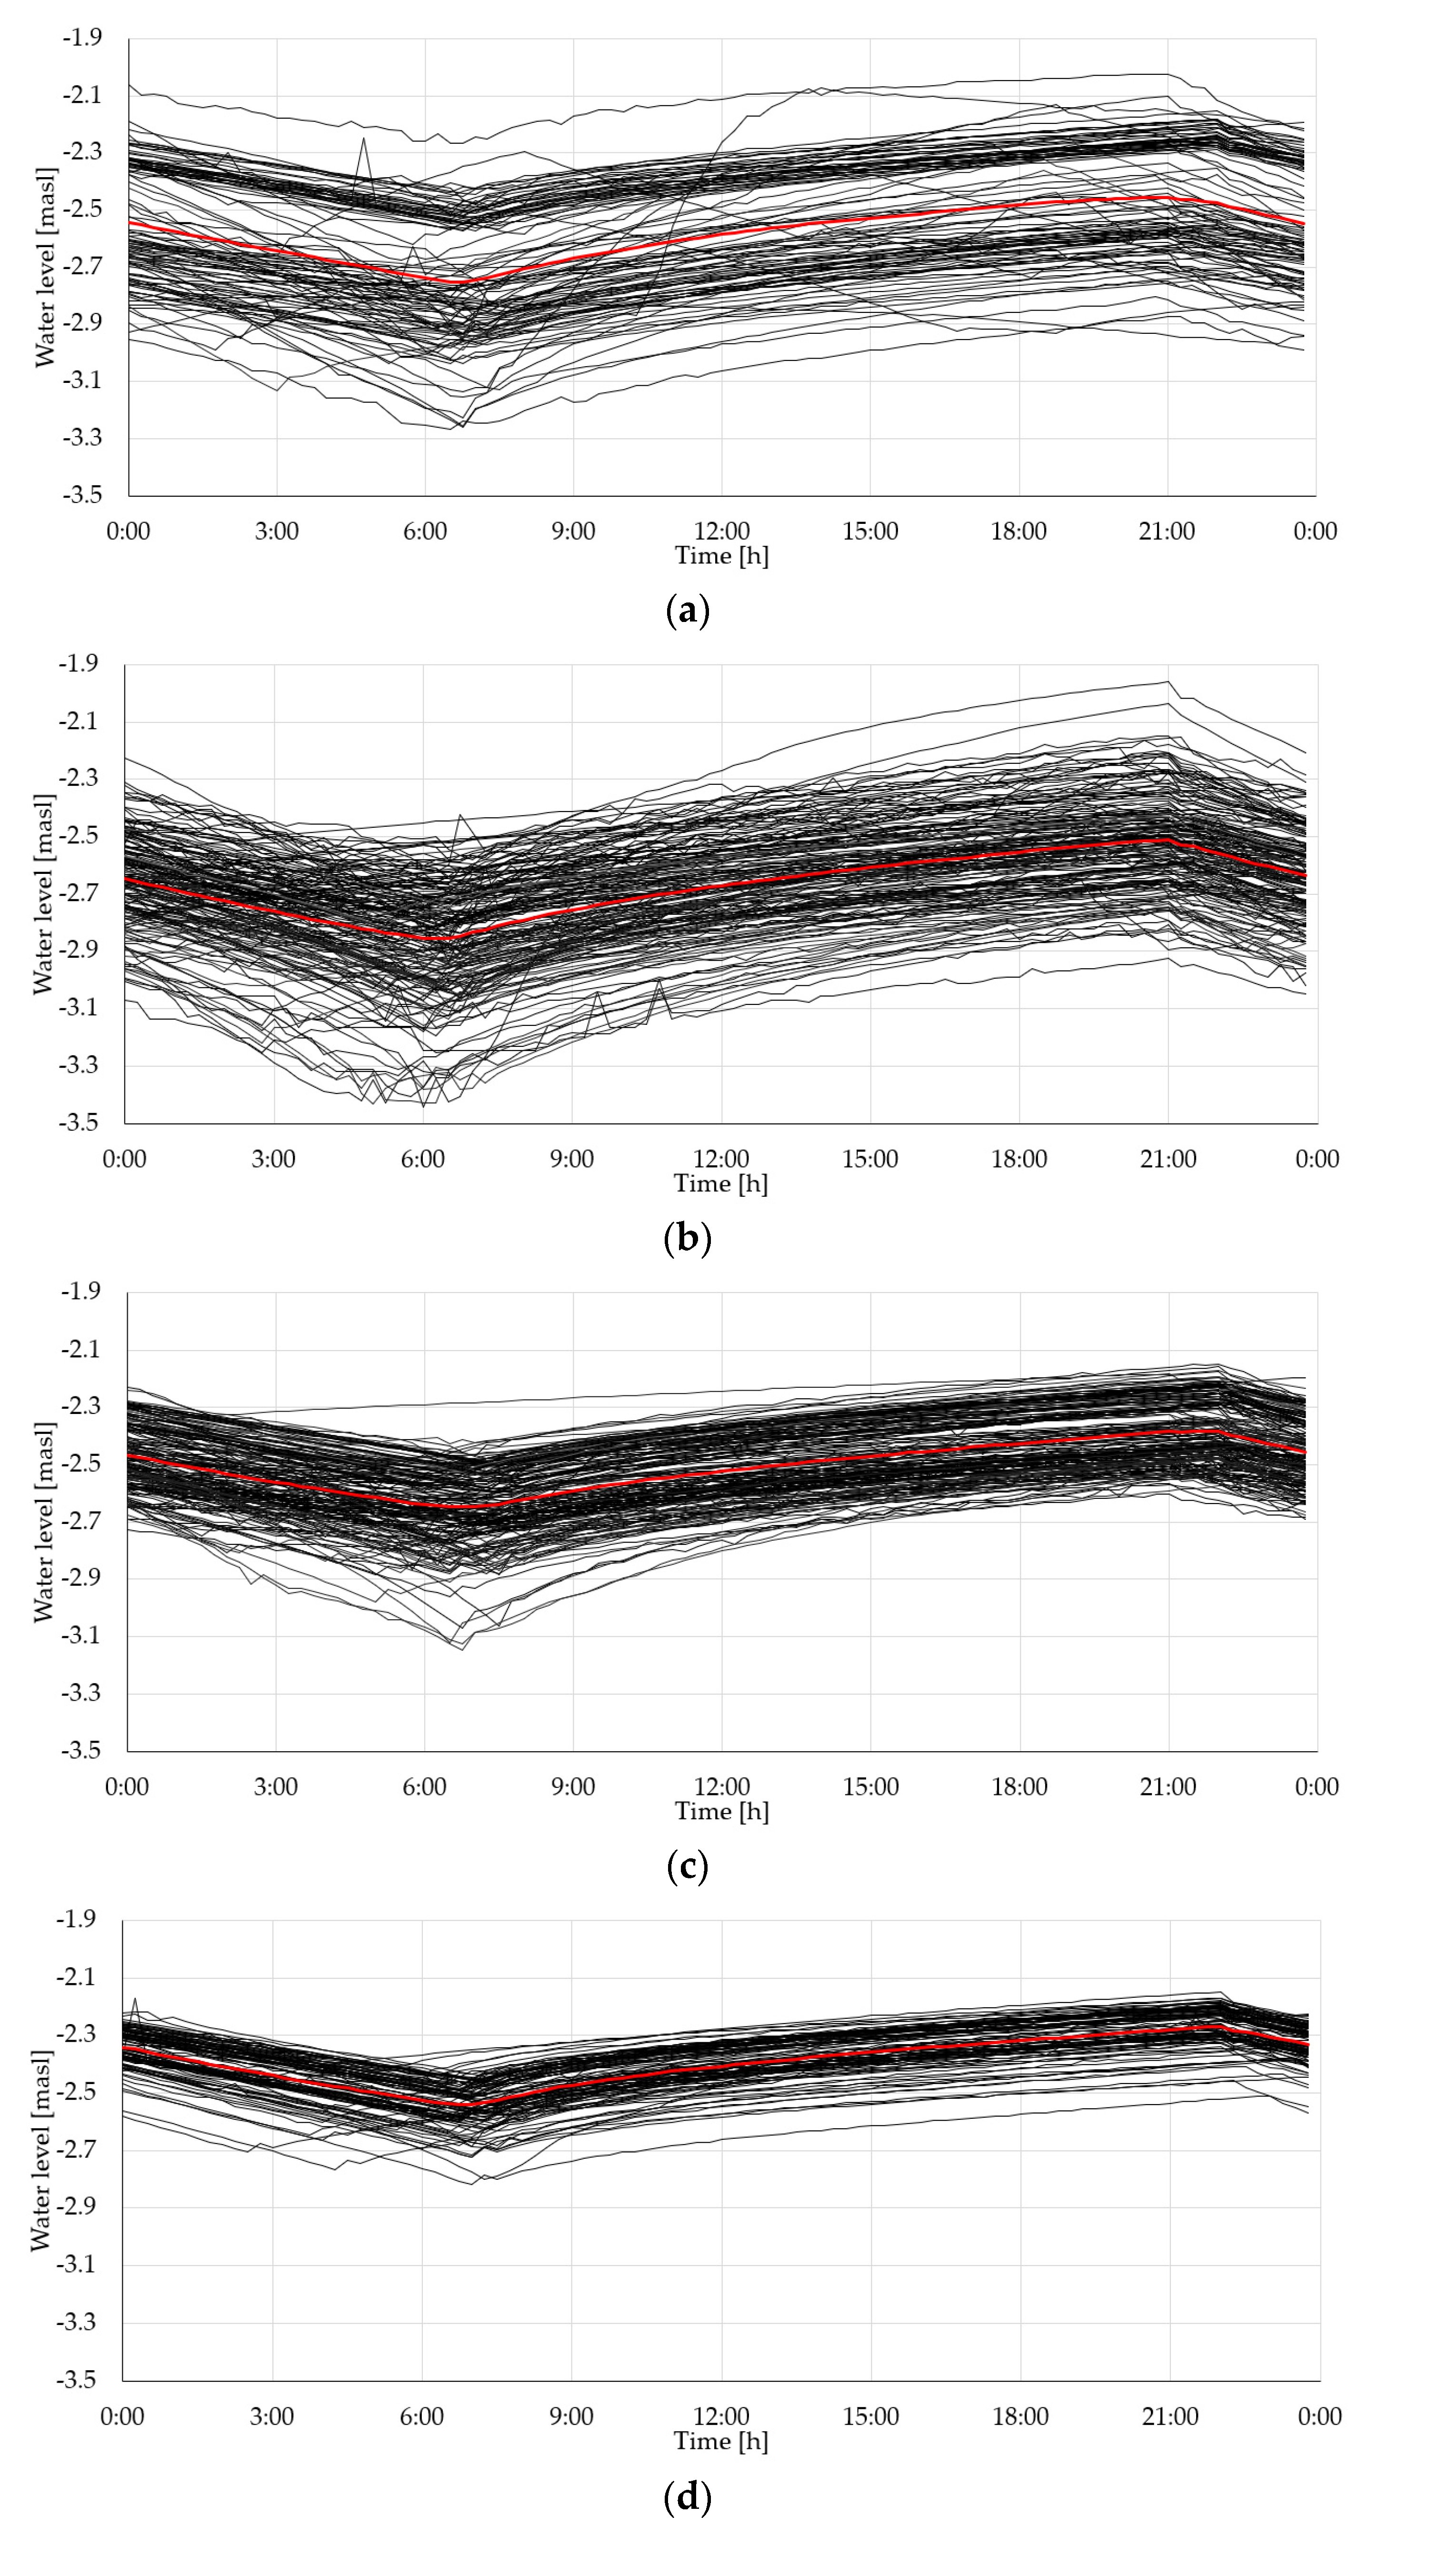
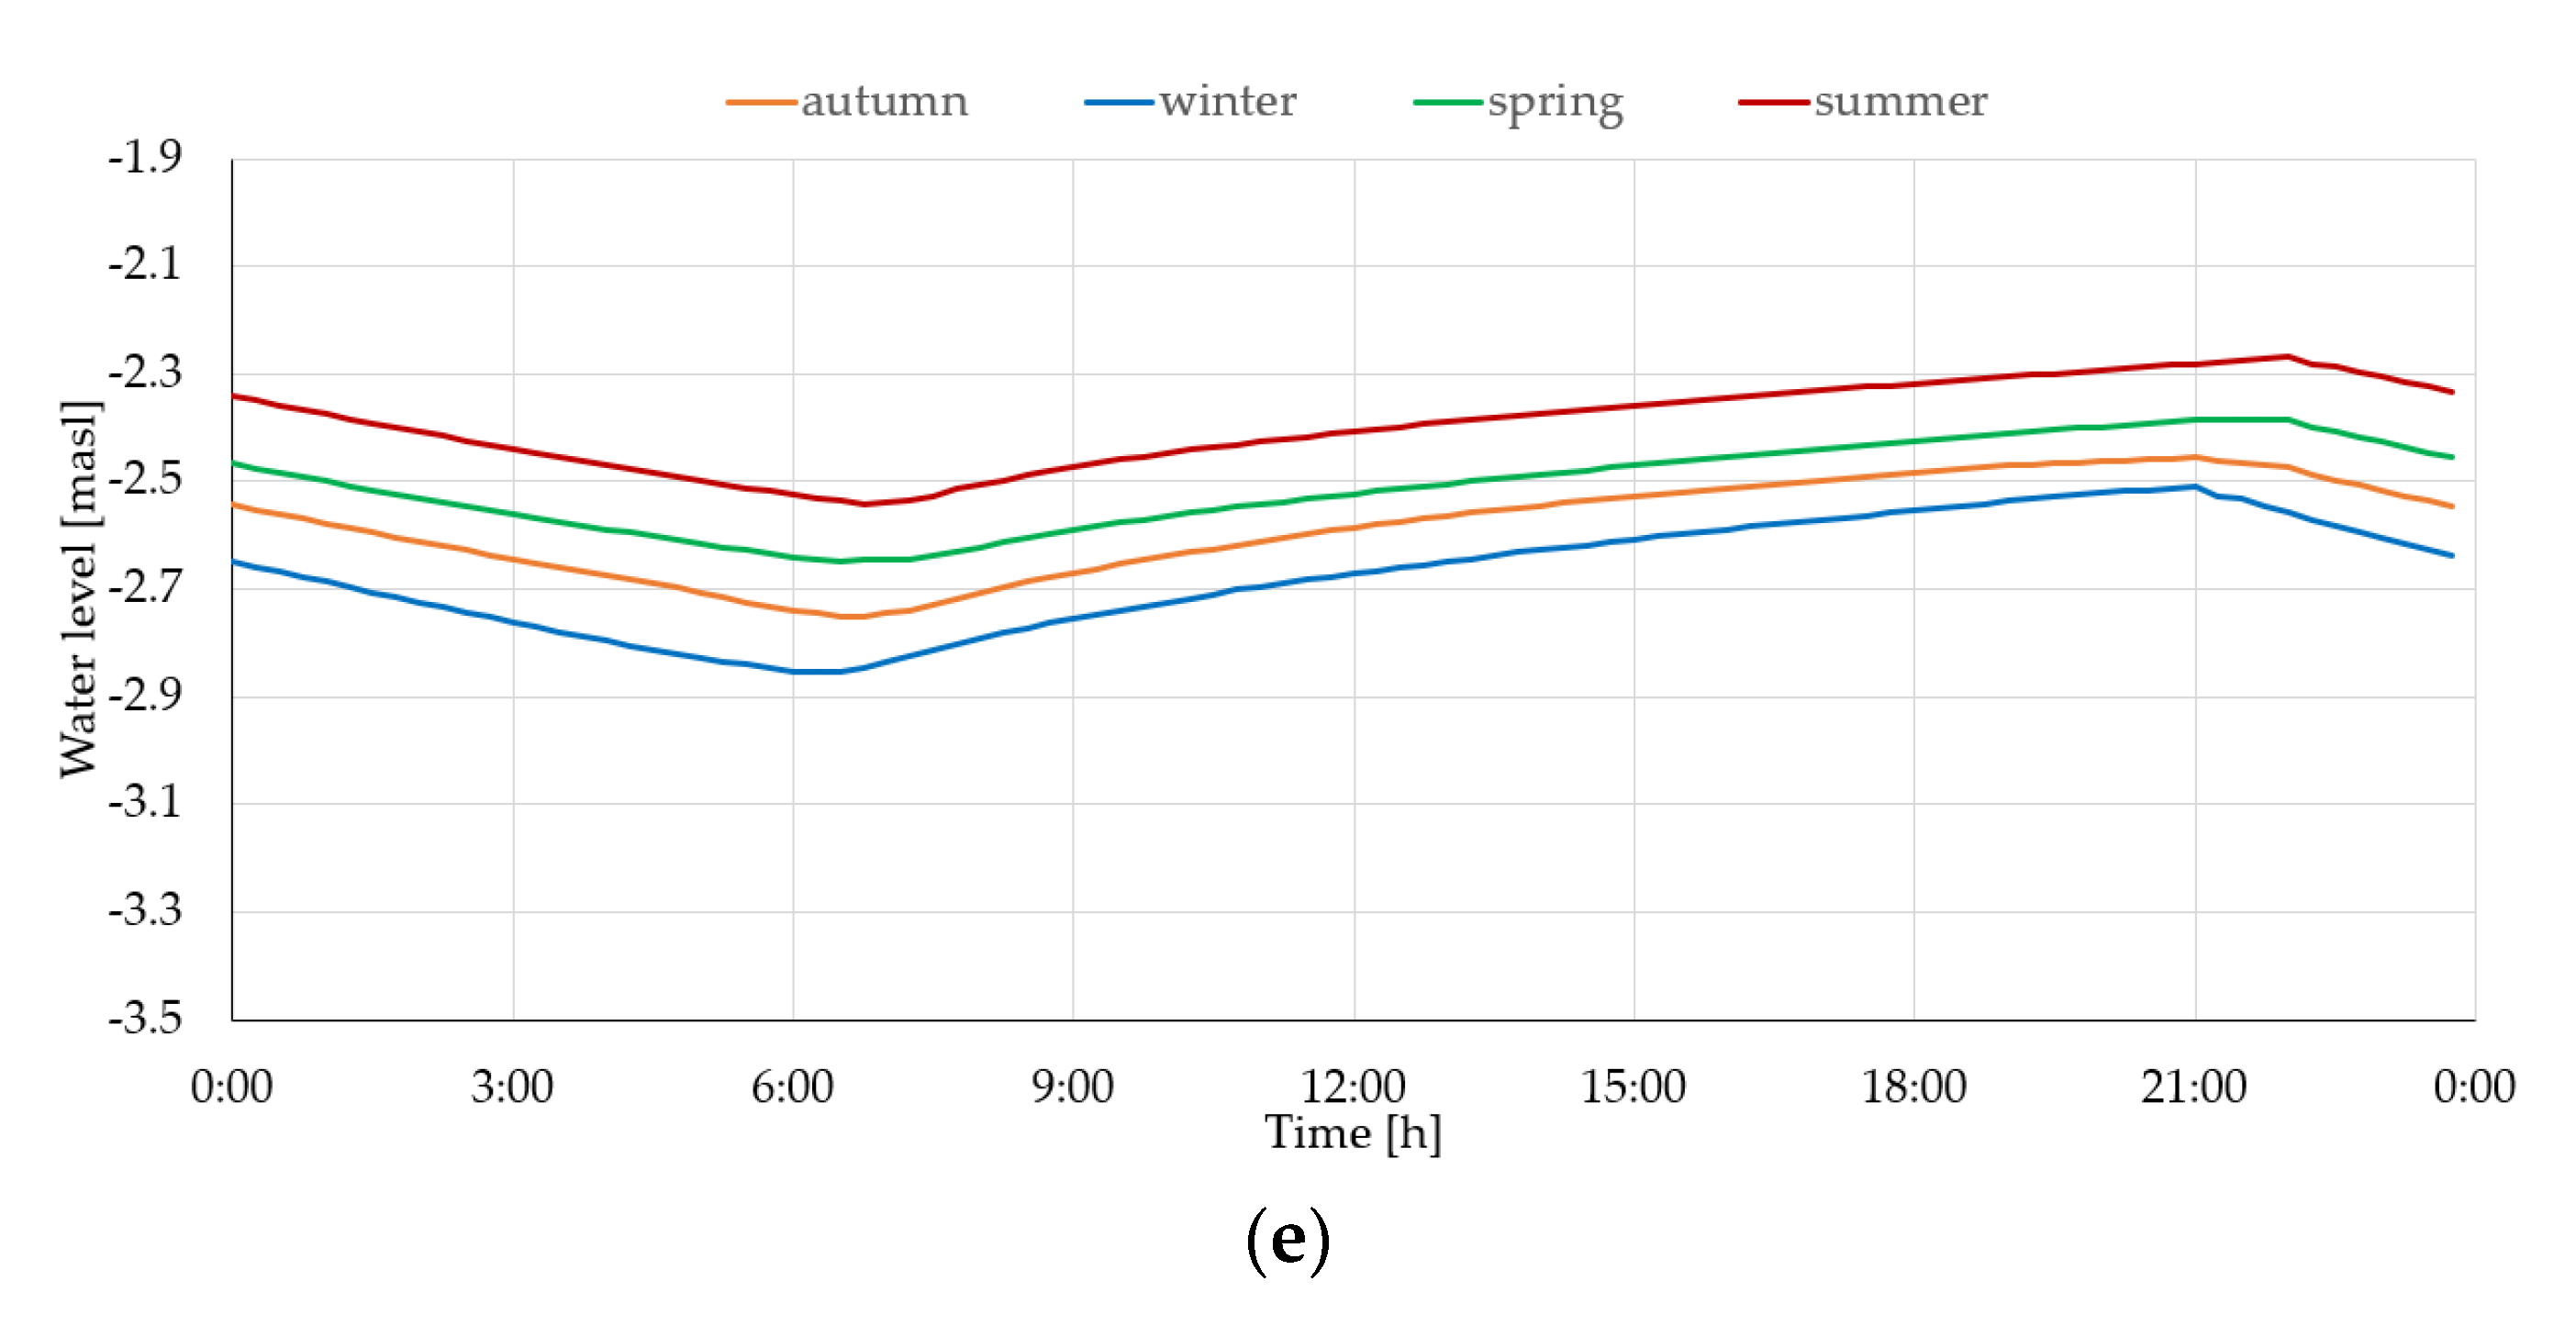
| Season | Water Level Fluctuation [cm] | Recharge Fluctuation [m3/s] | ||||
|---|---|---|---|---|---|---|
| ∆Hmin | ∆Havg | ∆Hmax | QR,min | QR,avg | QR,max | |
| all | 17.2 | 34.2 | 140.6 | 0.5 | 1.2 | 6.5 |
| autumn | 21.2 | 37.3 | 89.9 | 0.8 | 1.4 | 6.5 |
| winter | 21.2 | 42.7 | 140.6 | 0.8 | 1.3 | 4.2 |
| spring | 17.2 | 30.4 | 67.4 | 0.5 | 1.1 | 2.0 |
| summer | 24.0 | 29.8 | 57.1 | 0.8 | 1.1 | 2.1 |
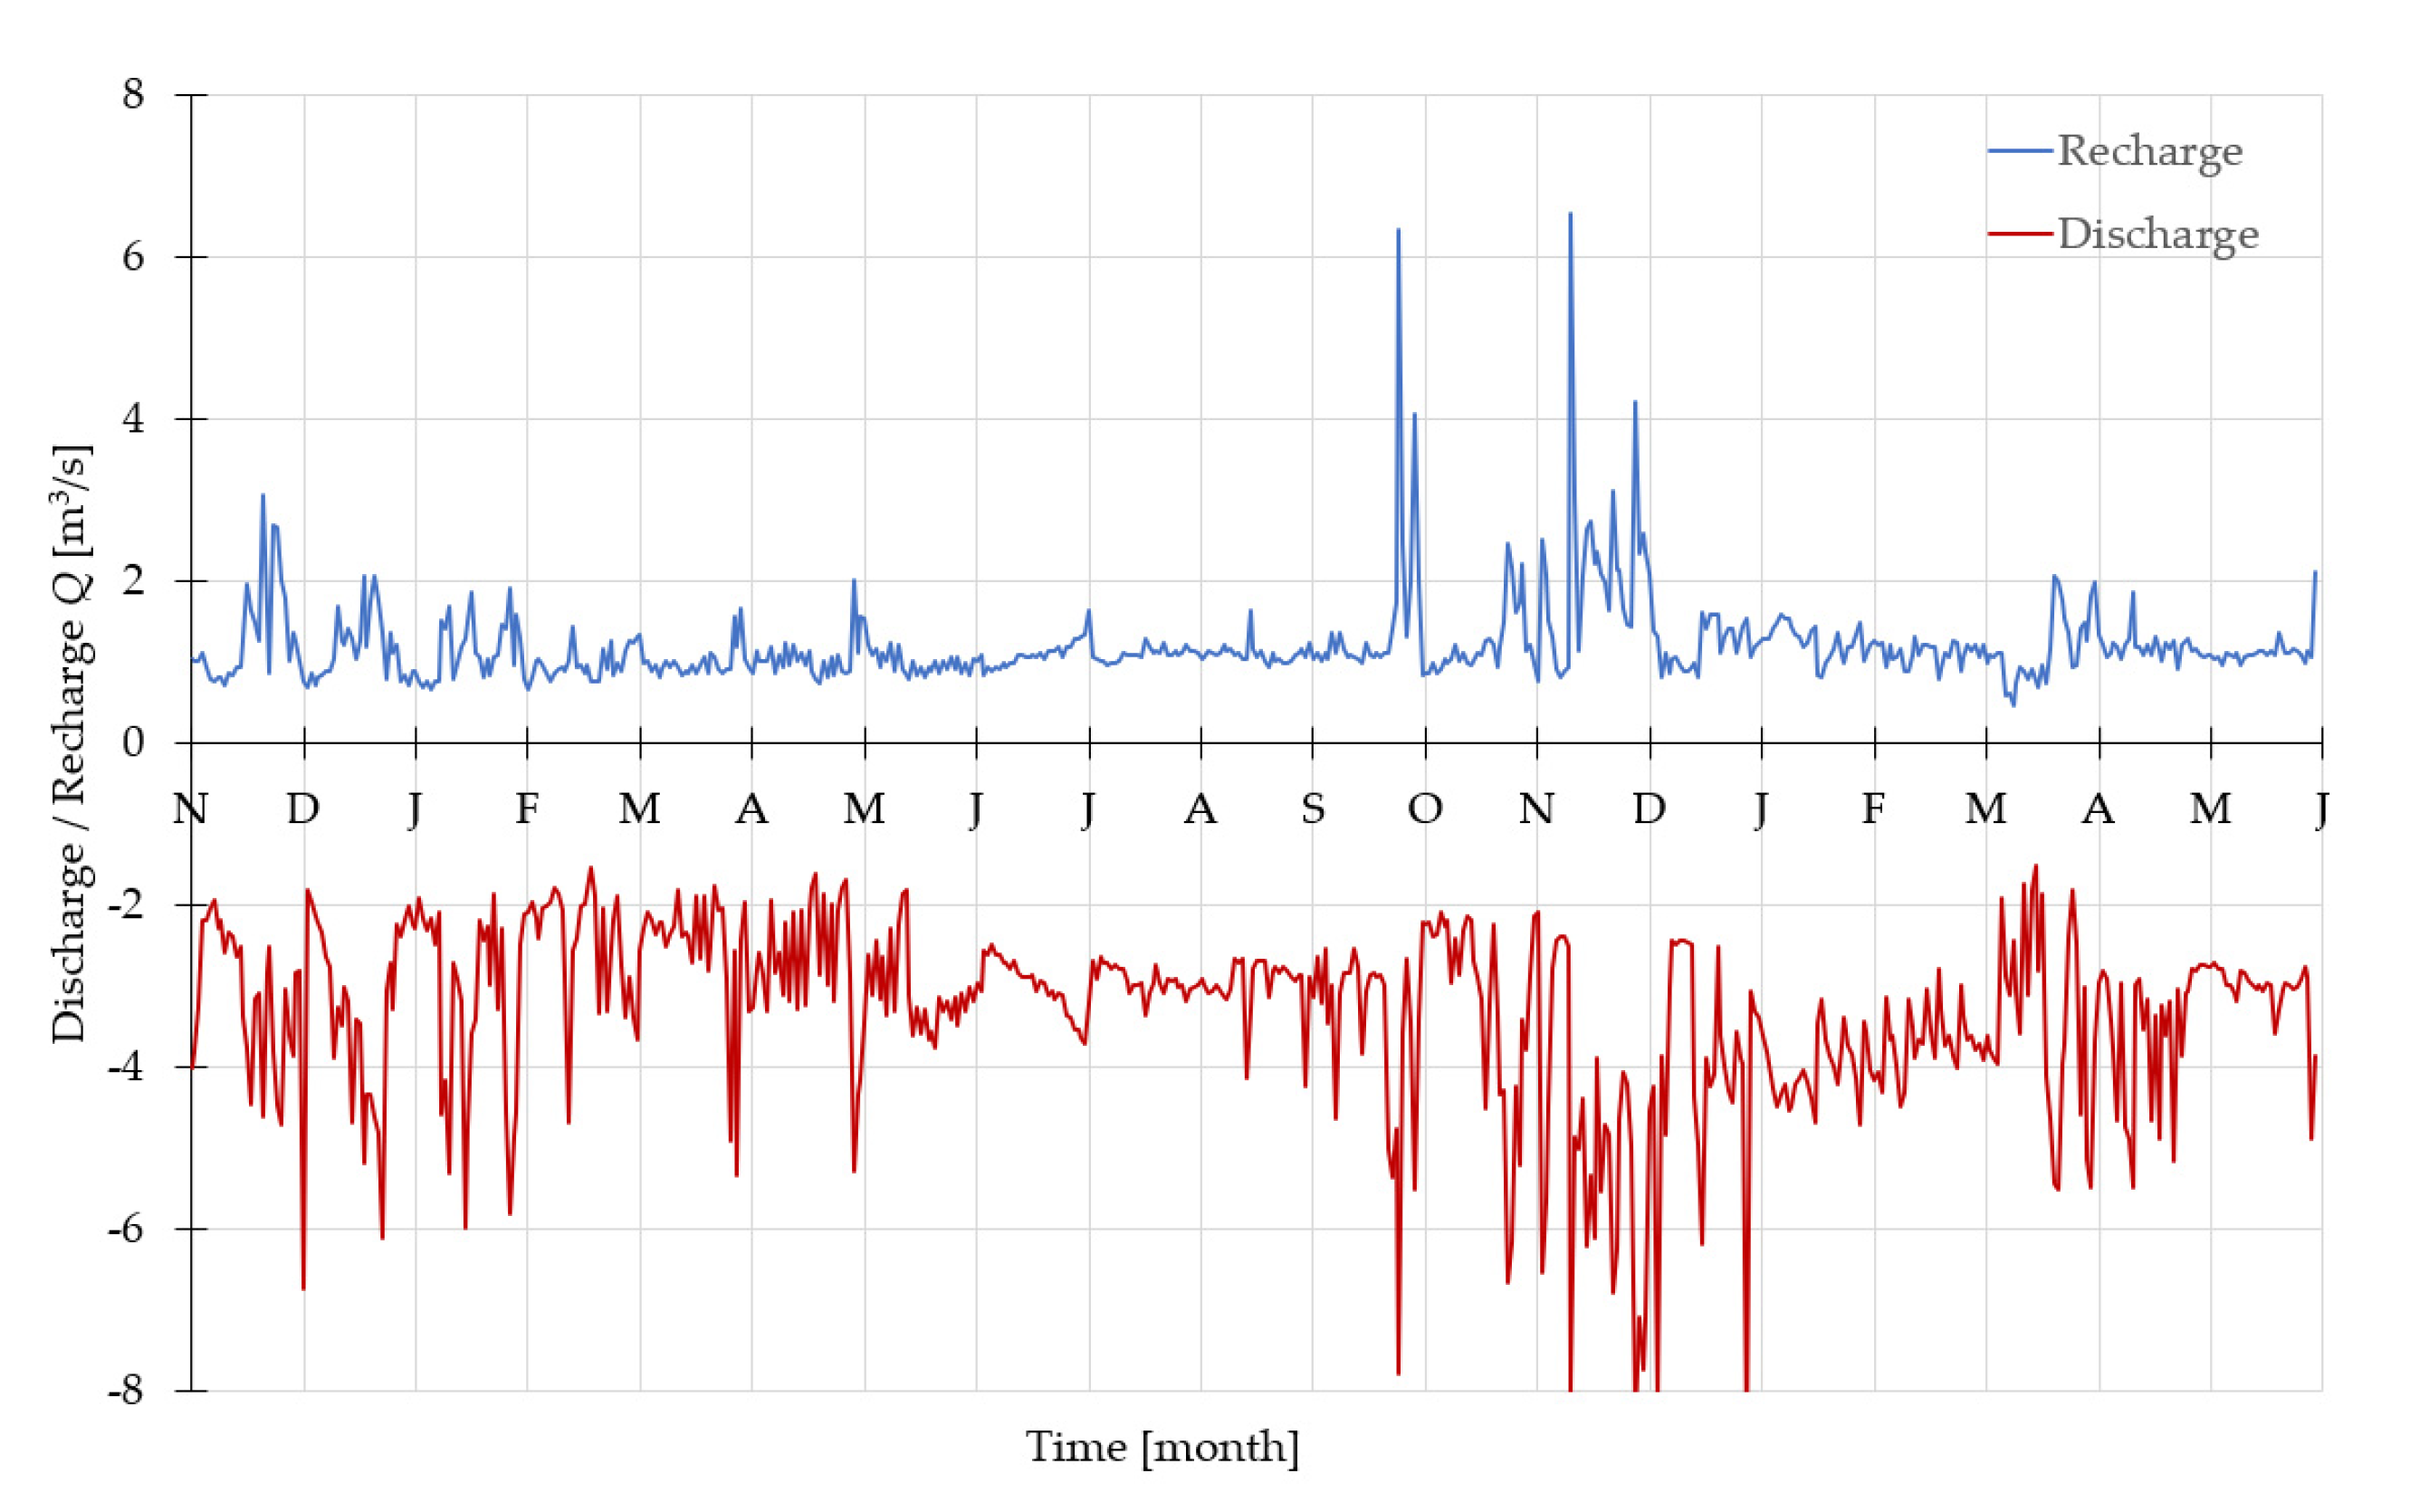
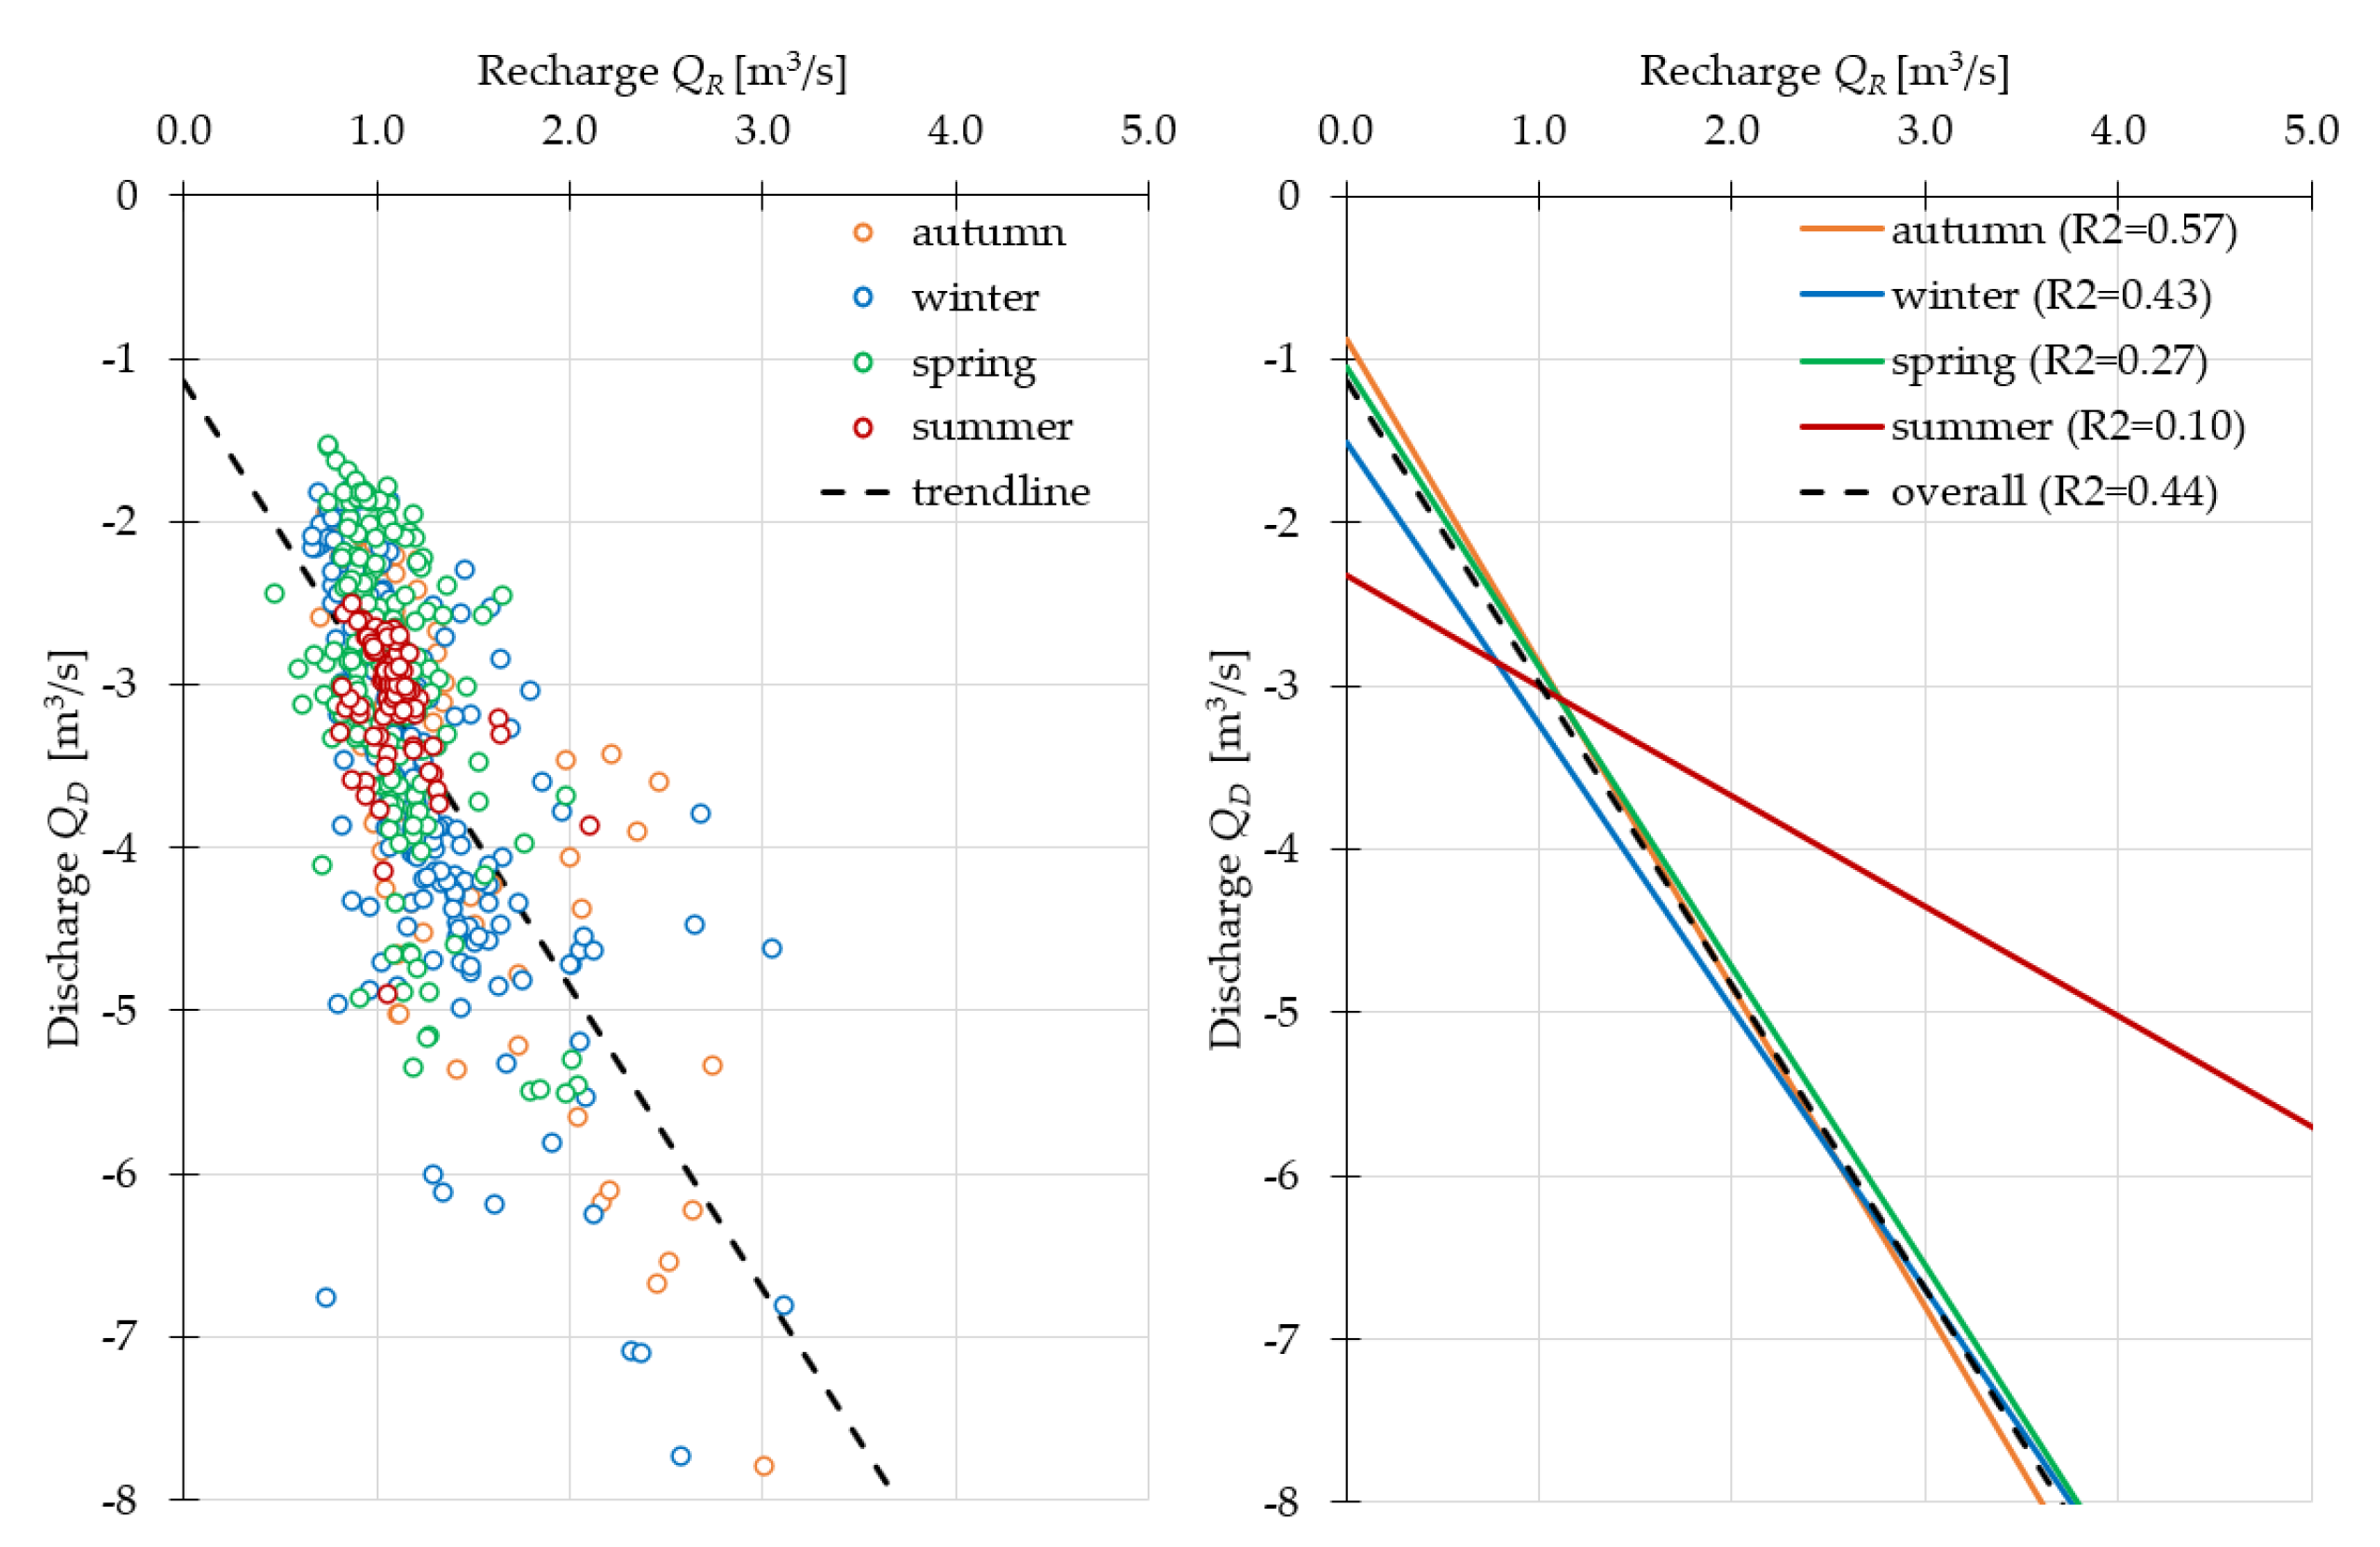
| Autumn | Winter | Spring | Summer | |||||||||
|---|---|---|---|---|---|---|---|---|---|---|---|---|
| P [mm] | QR [m3/s] | QD [m3/s] | P [mm] | QR [m3/s] | QD [m3/s] | P [mm] | QR [m3/s] | QD [m3/s] | P [mm] | QR [m3/s] | QD [m3/s] | |
| Total | 360 | / | / | 176 | / | / | 425 | / | / | / | / | |
| Minimum | / | 0.8 | −2.1 | / | 0.8 | −1.5 | / | 0.5 | −1.5 | / | 0.8 | −2.5 |
| Average | / | 1.4 | −3.4 | / | 1.3 | −4.0 | / | 1.1 | −3.0 | / | 1.1 | −3.1 |
| Maximum | 6.5 | −8.0 | 4.2 | −8.7 | 2.0 | −5.5 | 2.1 | −4.9 | ||||
| St. dev | / | 0.94 | 1.41 | / | 0.49 | 1.34 | / | 0.25 | 0.89 | / | 0.17 | 0.36 |
| R-Bindex | / | 0.24 | 0.34 | / | 0.23 | 0.32 | / | 0.17 | 0.35 | / | 0.08 | 0.10 |
Disclaimer/Publisher’s Note: The statements, opinions and data contained in all publications are solely those of the individual author(s) and contributor(s) and not of MDPI and/or the editor(s). MDPI and/or the editor(s) disclaim responsibility for any injury to people or property resulting from any ideas, methods, instructions or products referred to in the content. |
© 2023 by the authors. Licensee MDPI, Basel, Switzerland. This article is an open access article distributed under the terms and conditions of the Creative Commons Attribution (CC BY) license (https://creativecommons.org/licenses/by/4.0/).
Share and Cite
Gilja, G.; Kuspilić, N.; Lacko, M.; Romić, D. Reconstruction of Recharge and Discharge Pattern in the Polder Drainage Canal Network. Hydrology 2023, 10, 60. https://doi.org/10.3390/hydrology10030060
Gilja G, Kuspilić N, Lacko M, Romić D. Reconstruction of Recharge and Discharge Pattern in the Polder Drainage Canal Network. Hydrology. 2023; 10(3):60. https://doi.org/10.3390/hydrology10030060
Chicago/Turabian StyleGilja, Gordon, Neven Kuspilić, Martina Lacko, and Davor Romić. 2023. "Reconstruction of Recharge and Discharge Pattern in the Polder Drainage Canal Network" Hydrology 10, no. 3: 60. https://doi.org/10.3390/hydrology10030060