Article

A Novel Approach to Optimize the Industrial Process of Membrane Concentration of Grape Musts

1
Department of Agricultural and Environmental Science, University of Bari Aldo Moro, Via Amendola 165/A, 70126 Bari, Italy
2
Department of Biosciences and Territory (DiBT), University of Molise, Via Francesco De Sanctis, 86090 Pesche, Italy
3
CTS s.r.l.-Spin Off, University of Molise, Via Francesco De Sanctis, 86100 Campobasso, Italy
4
Department of Agriculture, Environment and Food (DiAAA), University of Molise, Via Francesco De Sanctis, 86100 Campobasso, Italy
5
F.L. Via Piscitelli, 13, 80128 Napoli, Italy
6
Department of Medicine and Health Sciences “Vincenzo Tiberio”, University of Molise, Via Francesco De Sanctis, 86100 Campobasso, Italy
*
Author to whom correspondence should be addressed.
ChemEngineering 2023, 7(3), 48; https://doi.org/10.3390/chemengineering7030048
Submission received: 8 April 2023 / Revised: 7 May 2023 / Accepted: 12 May 2023 / Published: 17 May 2023

Abstract

:
Nanofiltration and reverse osmosis are used in the concentration of grape musts in winemaking. Both technologies offer an effective way to concentrate the grape musts, reducing the volume and the solids content to achieve desired characteristics in the final wine. The choice between nanofiltration and reverse osmosis depends on the specific needs of the winemaker and the desired characteristics. It is important to carefully consider the properties of the grape musts and the performance of the selected membranes to optimize the concentration process and ensure the desired outcome. Herein, we present a novel approach that allows us to choose a suitable membrane for an optimal industrial process for the concentration of musts, both in reverse osmosis and nanofiltration. The proposed method consists of combining the fitting equations of laboratory results with the balance equations on the industrial plant. Specifically, a full-scale plant has been designed and assembled with which grape musts of Trebbiano, Verdeca, Black Bombino, and White Bombino varieties have been concentrated through the selected best-performing membranes. Results of the proposed approach show that grape musts with sugar content commercially appreciated when the membranes work at high pressure can be obtained.

1. Introduction

When the atmospheric conditions do not allow a perfect ripening of the grapes, the resulting musts have low sugar content, making a table wine of inferior quality and insufficient alcohol content to meet legal requirements (Regulation (EU) 2019/33). Since alcohol gives a direct sensory perception of sweetness, bitterness, and a certain heat perception, increasing ethanol is a common practice in many wine regions worldwide, especially in Europe, where the traditional practice is to add sucrose [1]. In addition, concentrated grape must or rectified grape must concentrate can be used to enhance the alcohol content [2]. A very attractive alternative method to increase the alcohol content is to concentrate the must by partly extracting water. Such water extraction is usually performed by nanofiltration (NF) [3] or reverse osmosis (RO) [4] membranes. Unfortunately, due to the high volumes pumped and high viscosity of musts, membrane fouling severely limits the lifetime and accuracy of the process [5,6]. As a result, there has been considerable research in recent years into the factors that connect membrane operation to the final product quality [7,8,9]. Tests for the amelioration of must, carried out on a pilot plant with RO membranes, suggest that at fixed transmembrane pressure (60 bar), the membrane performance is a function of the feed flow rate [10]. Measurements concentration by RO filtration of different musts on an industrial plant showed that it could be used without altering the sensory properties of the wine [2]. Furthermore, an integrated ultrafiltration/reverse osmosis system was also investigated for the bilge water treatment [11]. In order to determine the membrane to use for sugar enrichment of some Italian grape juices, a mini-plant with NF or RO membranes was set up. The study revealed that the key parameter for having a quality wine is the transmembrane pressure [12]. Although many studies, both on the membrane fouling mechanism [1,7,8,13], and the sugar enrichment of musts [14], have been undertaken, the underlying physical and chemical phenomena involved in the control are not fully understood. This can be attributed to the complexity of the membrane-filtration mechanisms. For instance, in applications involving polysaccharides or proteins, the membrane is decoupled from the substrate using a biocompatible lipid bilayer [15,16]. More importantly, developing strategies to control fouling need to be investigated in order to guarantee the long-term operation of the system. Herein we present research concerning the sugar enrichment of Black Bombino, White Bombino, Verdeca, and Trebbiano musts by means of several NF and RO membranes. Black Bombino, also known as Bombino Nero, is a black grape variety that is also grown in Southern Italy. It tends to have a higher sugar content than White Bombino and is known for producing wines with soft tannins and a fruity character. White Bombino, also known as Bombino Bianco, is a white grape variety that is primarily grown in Southern Italy, particularly in the Puglia region. It typically has a low to moderate sugar content and is known for its high acidity. Verdeca is a white grape variety that is primarily grown in the Puglia region of southern Italy. Verdeca must refers to the freshly pressed juice of the Verdeca grapes, which is the first step in the winemaking process. Trebbiano is a white grape variety that is widely used in winemaking, particularly in Italy. Trebbiano must refers to the freshly pressed juice of the Trebbiano grapes, which is the first step in the winemaking process. The aim of the article is to show how the experimental results can be conveniently used, on completely different types of musts, to derive the parameters of a suitable fouling model. Furthermore, the parameters combined with the balance equations of the industrial process provide data for the optimal design of the plant and inform the choice of the most suitable membrane for the particular must concentration process. In short, the proposed operational approach provides a useful tool for assembling an oenological plant to produce a wine with the desired qualities, regardless [17,18] of the type of must.

2. Material and Methods

2.1. Materials

Experiments were carried out with grape musts from the 2020 vintage. Three different grape musts, Black Bombino, Verdeca, White Bombino, and Trebbiano, from the Italian region of Apulia were obtained by “Antica Cantina” (S. Severo Figgia, Italy). Fourier-transform infrared spectroscopy (FTIR) was used according to OIV/OENO Resolution 390/2010 (International Organization of Vine and Wine, 2010) using FOSS WineScan FT 120 FT-MIR (FOSS, Padua, Italy) to determine sugar content (°Bx), dry extract (gdm−3), density (kgm−3), and potential alcohol gradation (vol %). All tests were in triplicate. The main chemical-physical characteristics of the musts investigated are collected in Table 1.

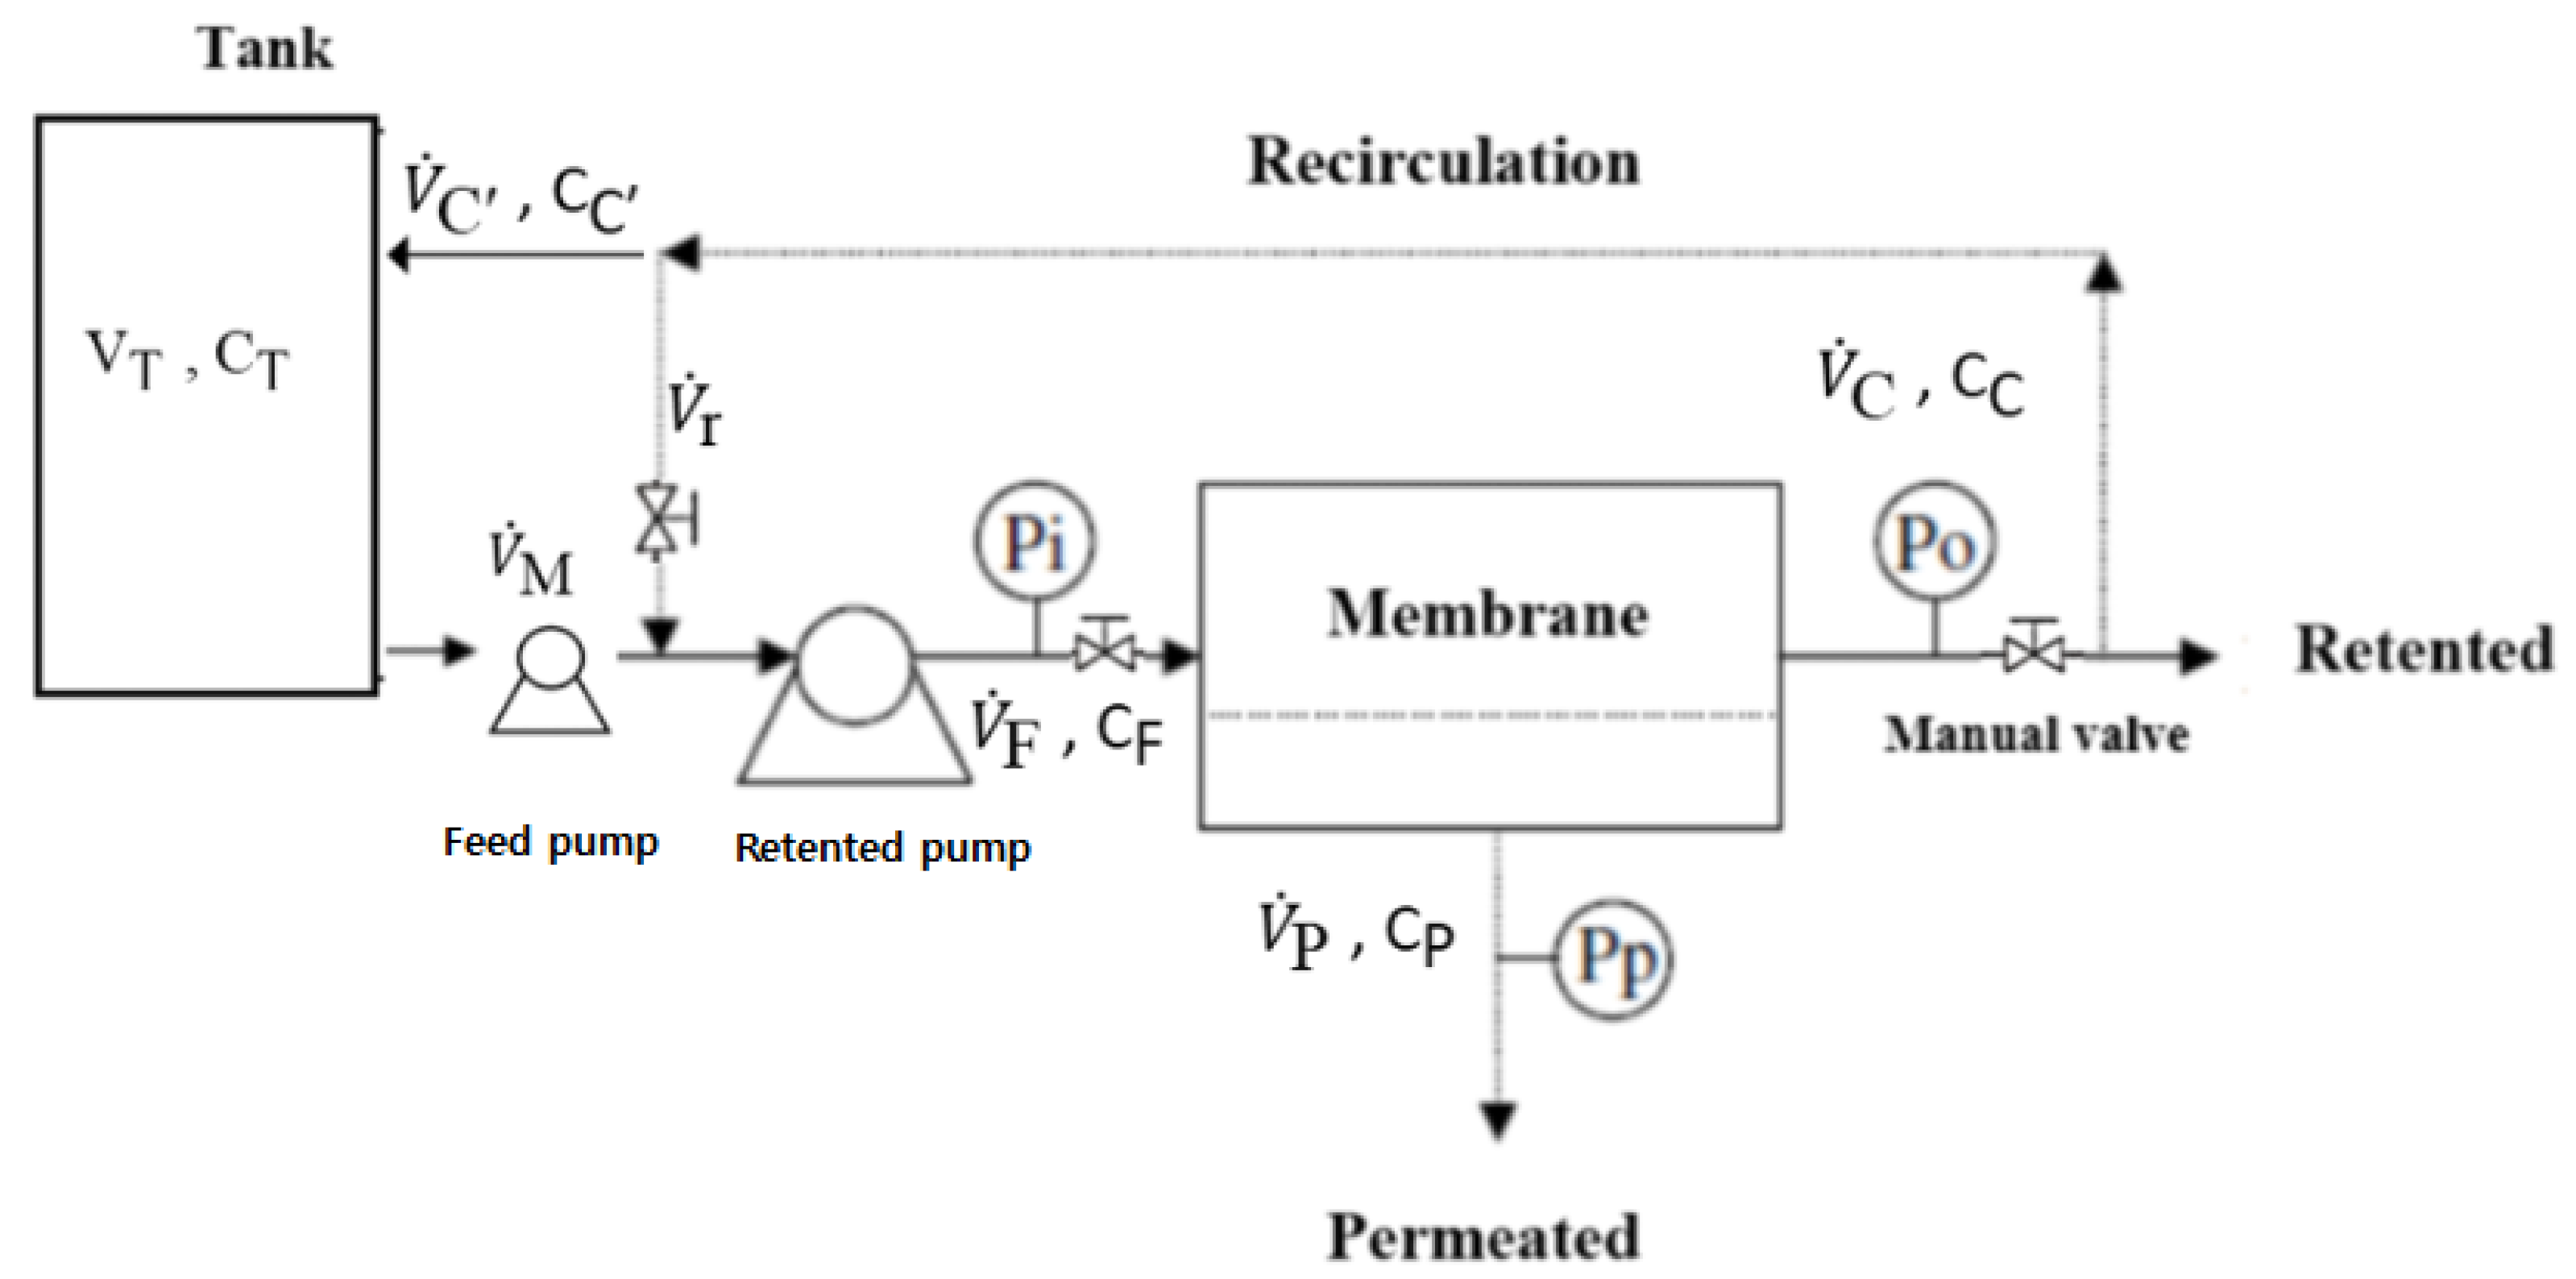
2.2. Membrane Lab-Scale Plants

To determine the characteristics of the membranes, three laboratory-scale plants were set up by ITEST s.r.l. (Corato, Italy) at the Antica Cantina winery in S. Severo Foggia, Italy, during the 2020 vintage. All the plants operated in batches with a 100 L tank loaded with Apulian grape musts, i.e., Verdeca and Black Bombino, and the temperature was kept at 25 °C with a spiral heat exchanger.
  • Pretretment
A plant loaded with a ceramic membrane (TAMI) and operating at 1.5 bar was used for pretreating musts in order to reduce the concentration of coarse solids and the bacterial load.
  • Nanofiltration membranes
A portion of the prefiltered musts was fed to the lab-scale plant fitted with NF membranes. Four commercial NF membranes were investigated, i.e., DK4040F1020 (NF1), VINOPRO4040C30D (Osmonics) (NF2), TFC-S4(Koch) (NF3), and NF2704040 (Filmtech) (NF4), all operating at 40 bar. For each membrane, three tests were carried out.
  • Reverse osmosis membranes
Another portion of the prefiltered musts was fed to a lab-scale plant operating with reverse osmosis (RO) membranes.
  • Industrial-scale plant fitted with NF or RO membranes

Industrial-Scale Plant Fitted with NF or RO Membranes

Based on the laboratory results, a plant with recirculating batch-flow for the treatment of 8000 L of must was designed according to the flowchart of Figure 1.
Table 2 collects the operating parameters of the plant.

2.3. Fouling Mechanisms

According to Hermans and Bredée the constant-pressure filtration process can be described by the differential equation [7]:
d 2 t d V P 2 = k d t d V P n
where d t / d V P = 1 / V ˙ P is the resistance of the membrane, V P is the permeate volume at time t, n defines the mode of filtration occurring, and k acts as an empirical constant, which, for a particular mode of filtration, depends on the system, the filter medium and conditions of filtration. This equation states that the rate of change of membrane resistance depends on the mode of filtration.
The general solution of Equation (1) is found to be
V ˙ P = V ˙ P 0 1 + ( 2 n ) t τ s 1 2 n
with
1 τ n = k V ˙ P 0 2 n
where V ˙ P 0 is the initial volume flow rates and τ n is a mean lifetime of the filtration process [19]. Integration of Equation (2) results in
V P = V ˙ P 0 τ n 1 1 ( n 2 ) t τ n 1 n 2
Generally speaking Equation (1) is suitable for describing any filtration process, on assumption of separate physical mechanisms of pore plugging. Indeed, n = 0 describes the cake mode filtration, n = 1 the intermediate blocking mode, n = 1.5 the standard blocking mode, and n = 2 the complete blocking mode of filtration. Furthermore, we notice that the parameter τ n depends both on the operating conditions of the membrane via V ˙ P 0 and on the system via k. Interestingly, for n = 2 , τ 2 = 1 / k becomes independent of the initial conditions, and the flow rate assumes an exponential form
V ˙ P = V ˙ P 0 e t τ 2
A further integration of Equation (5), with the initial condition V P ( 0 ) = 0 , gives
V P ( t ) = V ˙ P 0 τ 2 1 e t τ 2
However, it must be pointed out that when the hypothesis of independence of the physical processes fails, the above models are no longer suitable for describing the membrane filtration process. Therefore, Ho and Zydney developed a model for dead-end filtration combining cake filtration modes of fouling [7]. They showed that the open and blocked pores of a membrane offer different resistances to flow, accordingly the total flow through the membrane is the sum of two contributions, i.e.,
V ˙ P = V ˙ P 0 e t τ m + R m R m + R P 1 e t τ m
where τ m is the lifetime of the open pore membrane, and R p is the resistence from cake formation.

2.4. Industrial Plant Modeling

The flow chart of the industrial plant used to concentrate the musts is shown in Figure 1. The continuity equation applied to the overall process is given by
d V T d t = V ˙ P
where V T is the tank volume and V ˙ P is the volume flow rate of the permeate.
The solution of this differential equation for which V T ( 0 ) = V T 0 and V P ( 0 ) = 0 is
V T ( t ) = V T 0 V P ( t )
Similarly, a overall material balance provides
d V T C T d t = V ˙ P C P
where C T and C P are the must concentration in the tank and permeate, respectively.
Making use of the continuity equation (Equation (8)), Equation (10) can be rewritten as
d ln V T d t = 1 C T C P d C T d t
Equation (11) gives the desired result derived from rigorous balance relations. To proceed further, it is necessary to make assumptions concerning the C T dependence of the permeate concentration. We assume, in agreement with the experimental evidence, that C P is an analytical function of C T . Thus, we can write
C P = C P 0 + α 1 ( C T C T 0 ) + k = 2 α k ( C T C T 0 ) k
where
α i = d i C P d C T i C T = C T 0
are constants. Now, we define the permeate concentration at C T = 0 as
C P 0 = C P 0 α 1 C T 0 + k = 2 ( 1 ) k α k C T 0 k
Equation (12) establishes a functional relationship between C P and C T which makes Equation (11) integrable.
The evaluation of the integral of Equation (11) according to the assumption α k = 0 for k 2 yields
( α 1 1 ) C T ( t ) = [ C P 0 + ( α 1 1 ) C T 0 ] V T ( t ) V T 0 ( α 1 1 )
This equation can be rearranged into a more computationally friendly form
C T C T 0 = 1 γ 1 1 V P V T 0 1 α 1 for α 1 1
where
γ = 1 p 1 α 1 , p = C P 0 / C T 0
We note that for α 1 = 1 , Equation (8) becomes
C P C T = C P 0 C T 0 = constant
Therefore, Equation (11) can be integrated directly to give
C T C T 0 = 1 + ( p 1 ) ln 1 V P V T 0
Equation (16) (or Equation (19)) is the result of a plant’s overall balance, which expresses the tank concentration as a function of the permeate volume. However, membrane performances are more commonly monitored by measuring the tank concentration as a function of time. This can be done provided that the fouling mechanism of the membrane is known. A general expression for C T ( t ) , valid for any fouling mechanism, is obtained by introducing Equation (2) into Equation (16).
Here, we explicitly consider the complete blocking mechanism ( n = 2 ). Then substitution of Equation (5) into Equation (16) yields
C T C T 0 = 1 γ 1 1 V ˙ P 0 τ 2 V T 0 1 e t τ 2 1 α 1
Finally, in order to relate the measured concentration to the transmembrane pressure drop, we assume that Darcy’s law is initially valid, i.e.
V ˙ P 0 = A K P ( Δ P 0 )
where A is the surface developed by the membrane, K P is an empirical constant that takes into account the membrane permeability, and Δ P 0 is the pressure drop initially present on the sides of the membrane. Equations (20) and (21) state that the higher the pressure drop, the greater the tank concentration, which will be reached much faster.

3. Results and Discussion

3.1. Test Selection of Membranes

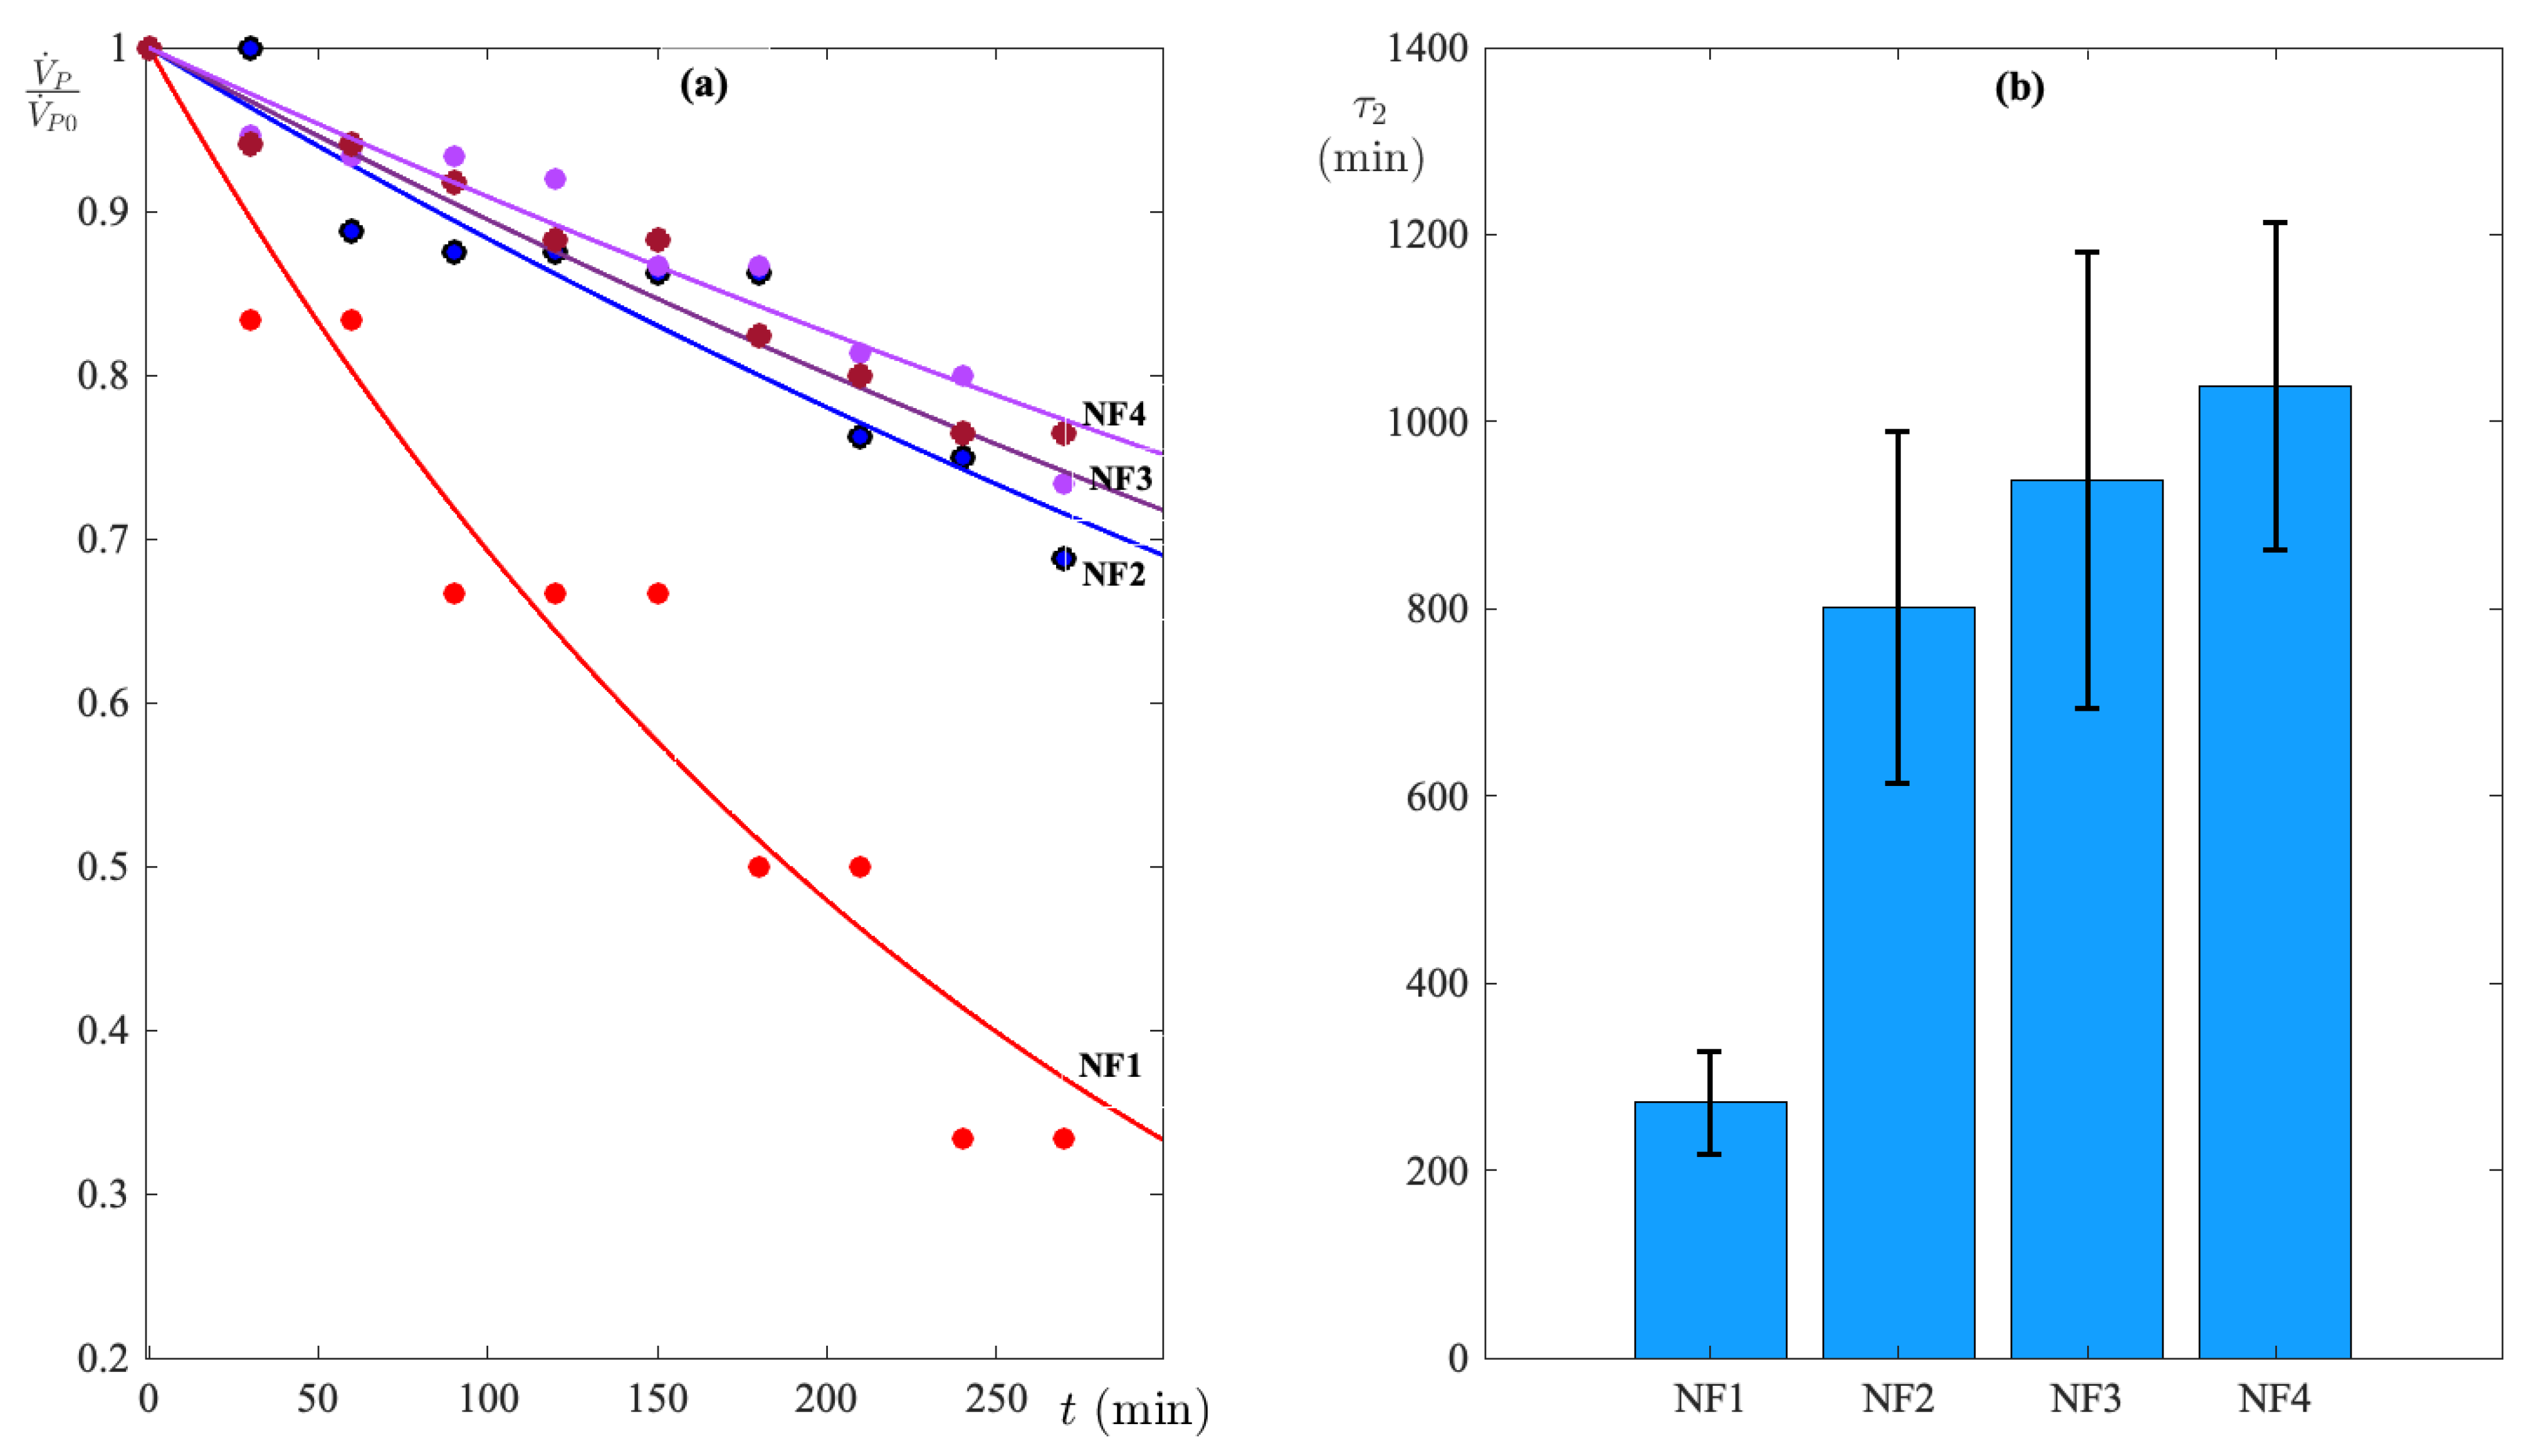
3.1.1. Nanofiltration

The nanofiltration experiments were focused on testing of filtration properties of four different membranes. Since the performance of a membrane also depends on the initial flow conditions, the experimental results of V ˙ P ( t ) were normalized to their initial value. In order to establish the filtration mode, experimental values were fitted to Equation (8) for n = 0 , 1, 1.5 , and 2. Using the Levenberg–Marquardt nonlinear least squares procedure for each n-value, the root mean squared error (RMSE) of the observed compared to the predict was computed [20]. The n-value corresponding to the smallest RMSE is considered to be the filtration mode.
Nanofiltration results of Bombino and Verdeca musts, by NF1, NF2, NF3, and NF4 membranes, are displayed in Figure 2 and Figure 3 where the quantity V ˙ P / V ˙ P 0 is plotted versus the filtration time. It is remarkable that the best-fit results of all investigated membranes exhibit a minimum RMSE for n = 2 ; namely, the membranes exhibit a complete blocking mechanism controlling fouling. Accordingly, the τ 2 -value extracted from experimental data is independent of the initial flow, but it is an intrinsic feature of membranes.
As one can see in Figure 2a, for Bombino must, the NF2, NF3, and NF4 membranes show almost equal lifetimes (15 h average time), while the lifetime of NF1 is significantly shorter ( 3.8 h). This aspect is highlighted in the bar plot of Figure 2b, where the experimental values of the single membranes and the relative fitting error can be found. For the Verdeca must (Figure 3a), the experimental results seem to highlight a situation almost similar to Bombino, although here the lifetimes of the individual membranes appear to be different from each other. Once again, the NF1 membrane shows a significantly shorter lifetime ( 5.8 h) than the other membranes. Figure 3b shows that the operating times of the individual membranes with the Verdeca must are conspicuously different from each other. All must samples were filtered under the same operating conditions; it follows that the experimental results displayed in Figure 2 and Figure 3 are to be attributed to the different surface properties of the membranes used for the separation. Indeed, from the technical sheets of each membrane supplied by the manufacturers, one obtains that the NF1 membrane develops a surface of 9.1 m2 while all the other NF membranes exhibit 7.4 m2. On the other hand, the surface developed by the membrane determines the amount of material that can pass through the membrane in a given time interval [21]. The greater the developed surface, the greater the amount of material that can be separated in a given time interval. Thus, the membrane with the larger surface area will allow the same amount of material to be processed in less time than the membrane with a smaller developed surface area. Furthermore, the Black Bombino has a higher content of polyphenols and anthocyanins compared to the Verdeca must, which gives it a higher viscosity and increases the filtration time [22].

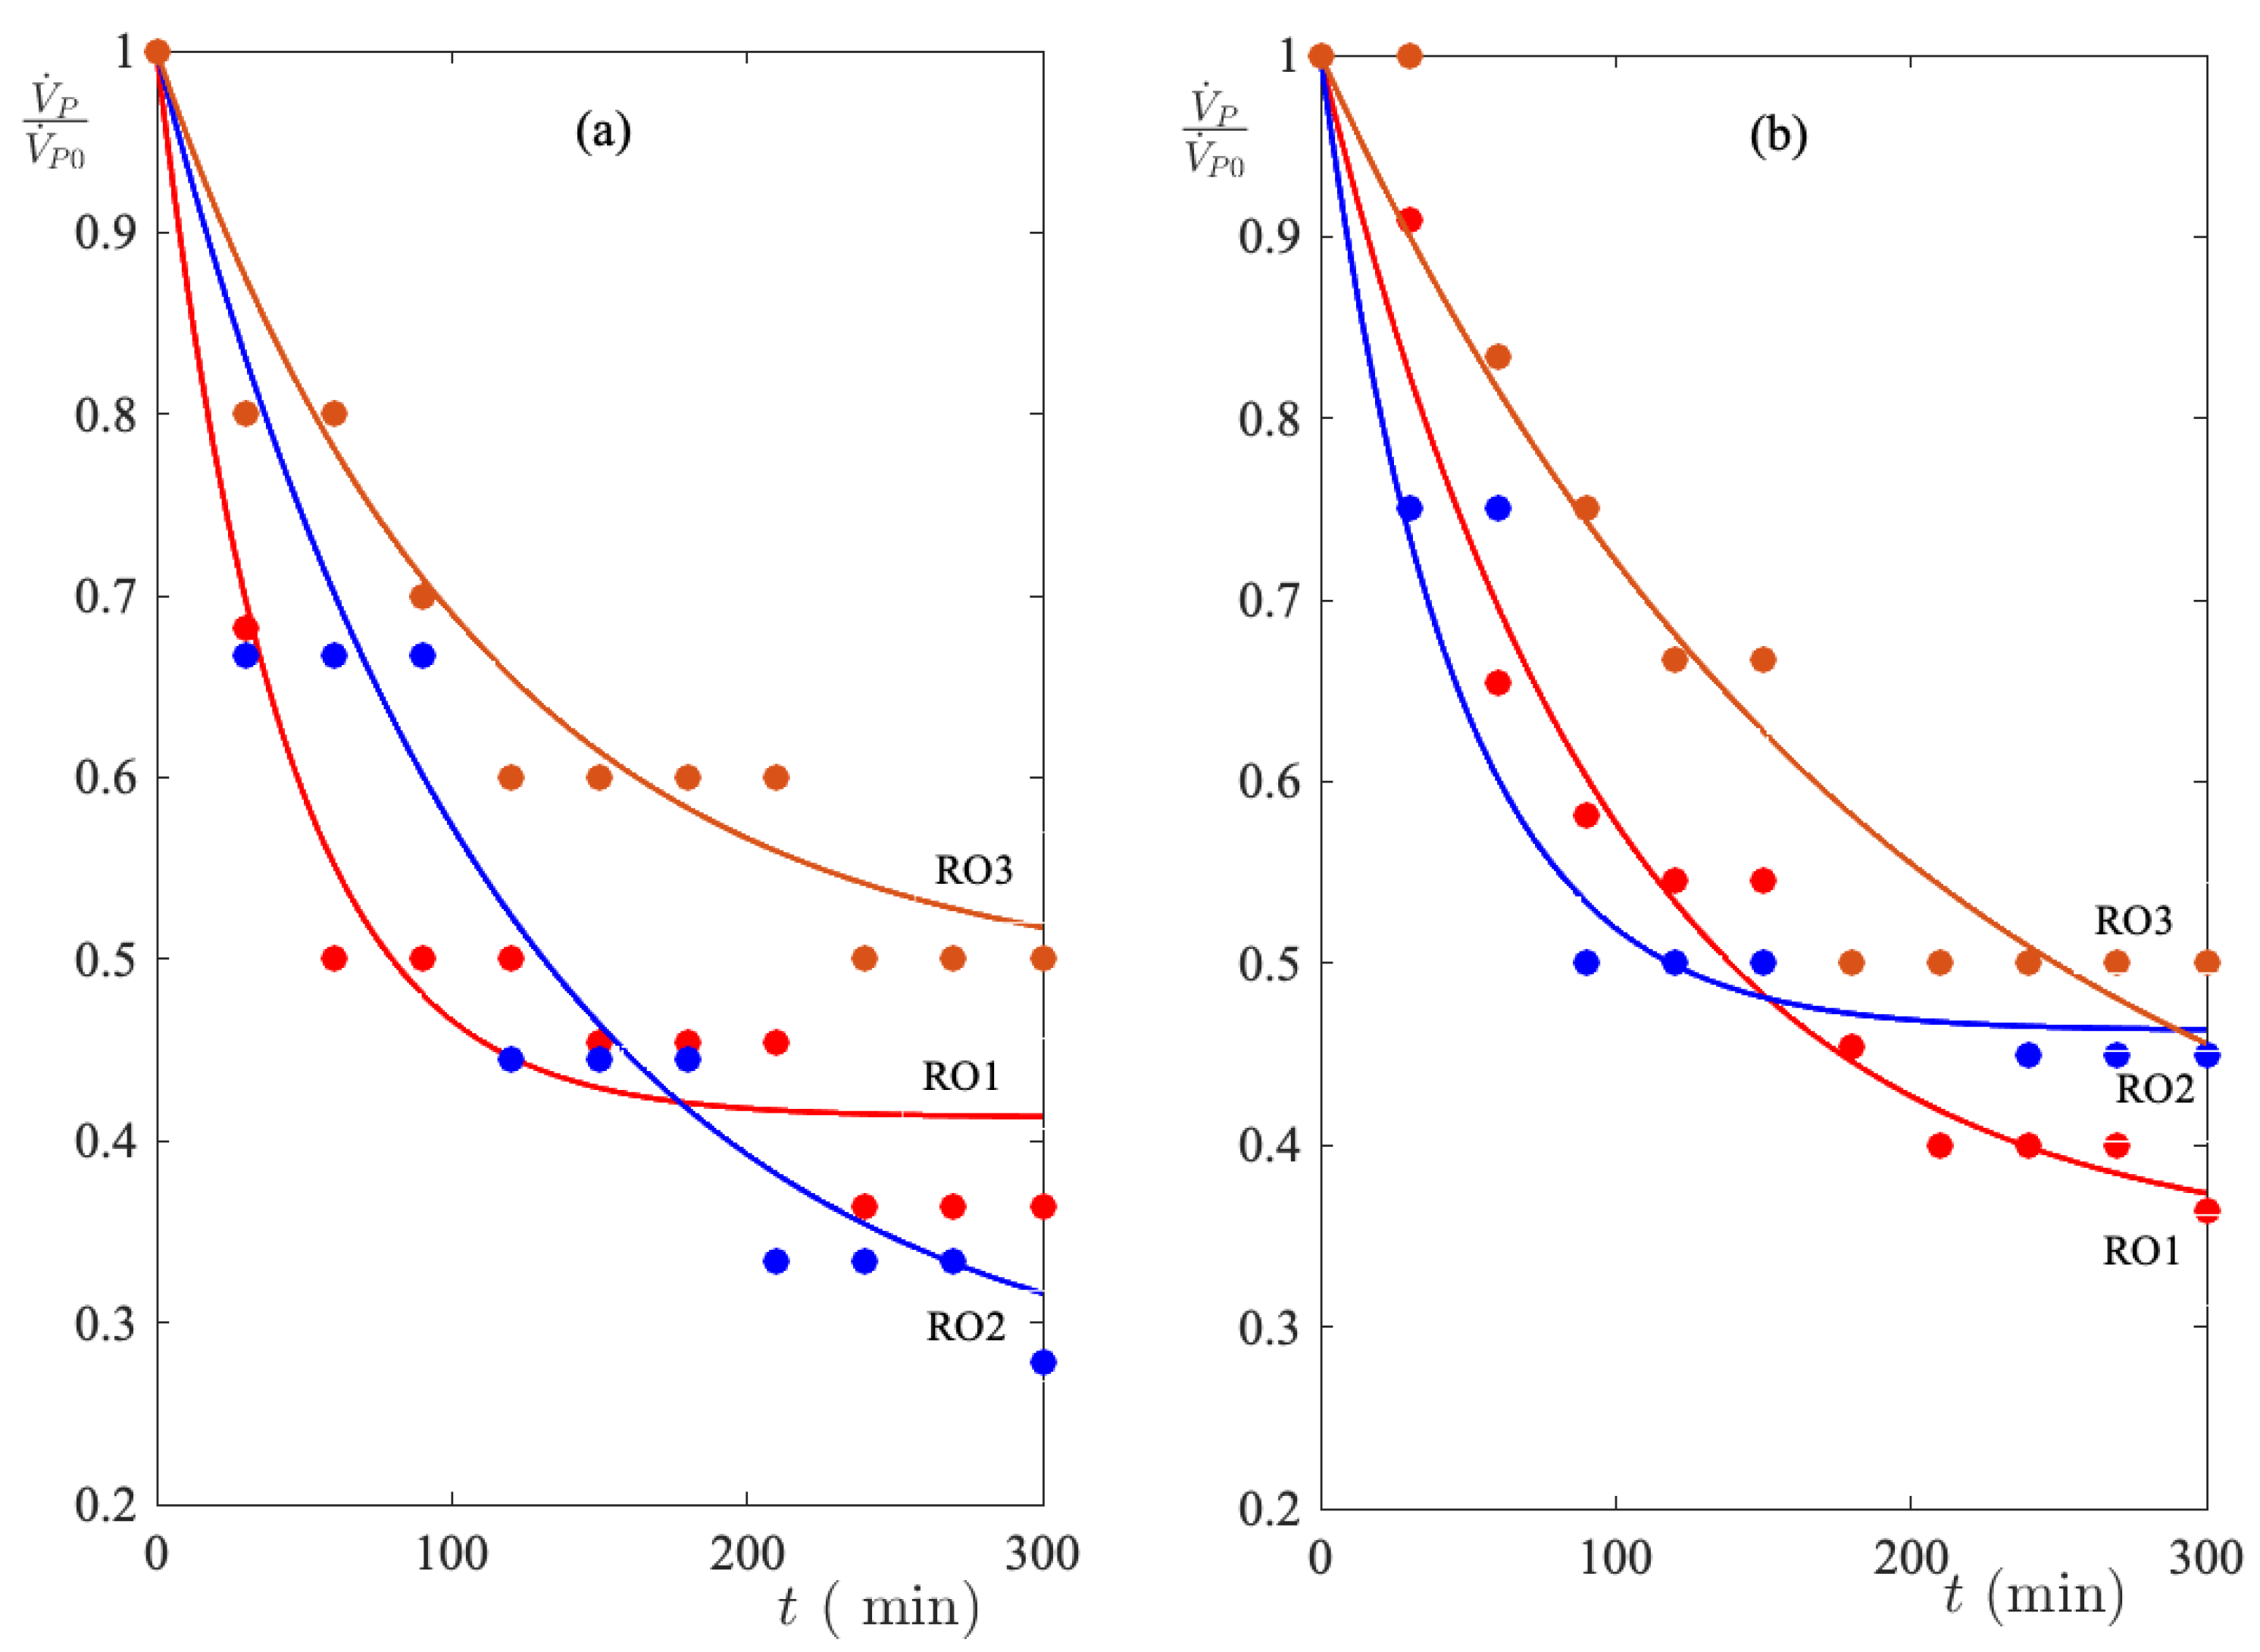
3.1.2. Reverse Osmosis

The method of calculation outlined above is employed here to evaluate the performance of RO membranes used to concentrate Bombino and Verdeca musts. It reveals that the investigated membranes can be divided into two groupings. The first, consisting of membranes RO4 and RO5, includes those membranes for which the experimental data V ˙ P can be interpreted by means of Equation (2). Furthermore, for all the cases analyzed, the best-fit of the experimental results is achieved, once again, for n = 2 (complete blockage fouling mechanism). Interestingly, for these membranes, regardless of whether they work on Bombino or Verdeca must, the same average lifetime of 357 ± 50 min is recorded. The second group, formed by the membranes RO1, RO2, and RO3, collects the membranes whose flow properties cannot be described by Equation (2). In other words, for these membranes, the fouling process takes place through mutually dependent mechanisms. It is remarkable that experimental curves V ˙ p vs. t are well-fitted to Equation (7), as it can be clearly seen in Figure 4. The membranes, although subject to the same fouling mechanism, exhibit different lifetimes. Indeed, the τ m value of the membranes working with Bombino is significantly lower than with Verdeca. The fitting parameters, i.e., τ m and R ¯ = R m / ( R m + R p ) , are collected in Table 3.
It immediately catches the eye that the R ¯ parameter is always close to 0.4 . This means that only 40% of the resistance to flow can be attributed to the membrane pores, while most can be attributed to the cake formation. This is because membrane filtration fouling is a complex process dependent on the internal morphology of the membrane and on the diffusion of particles in the pores [23].

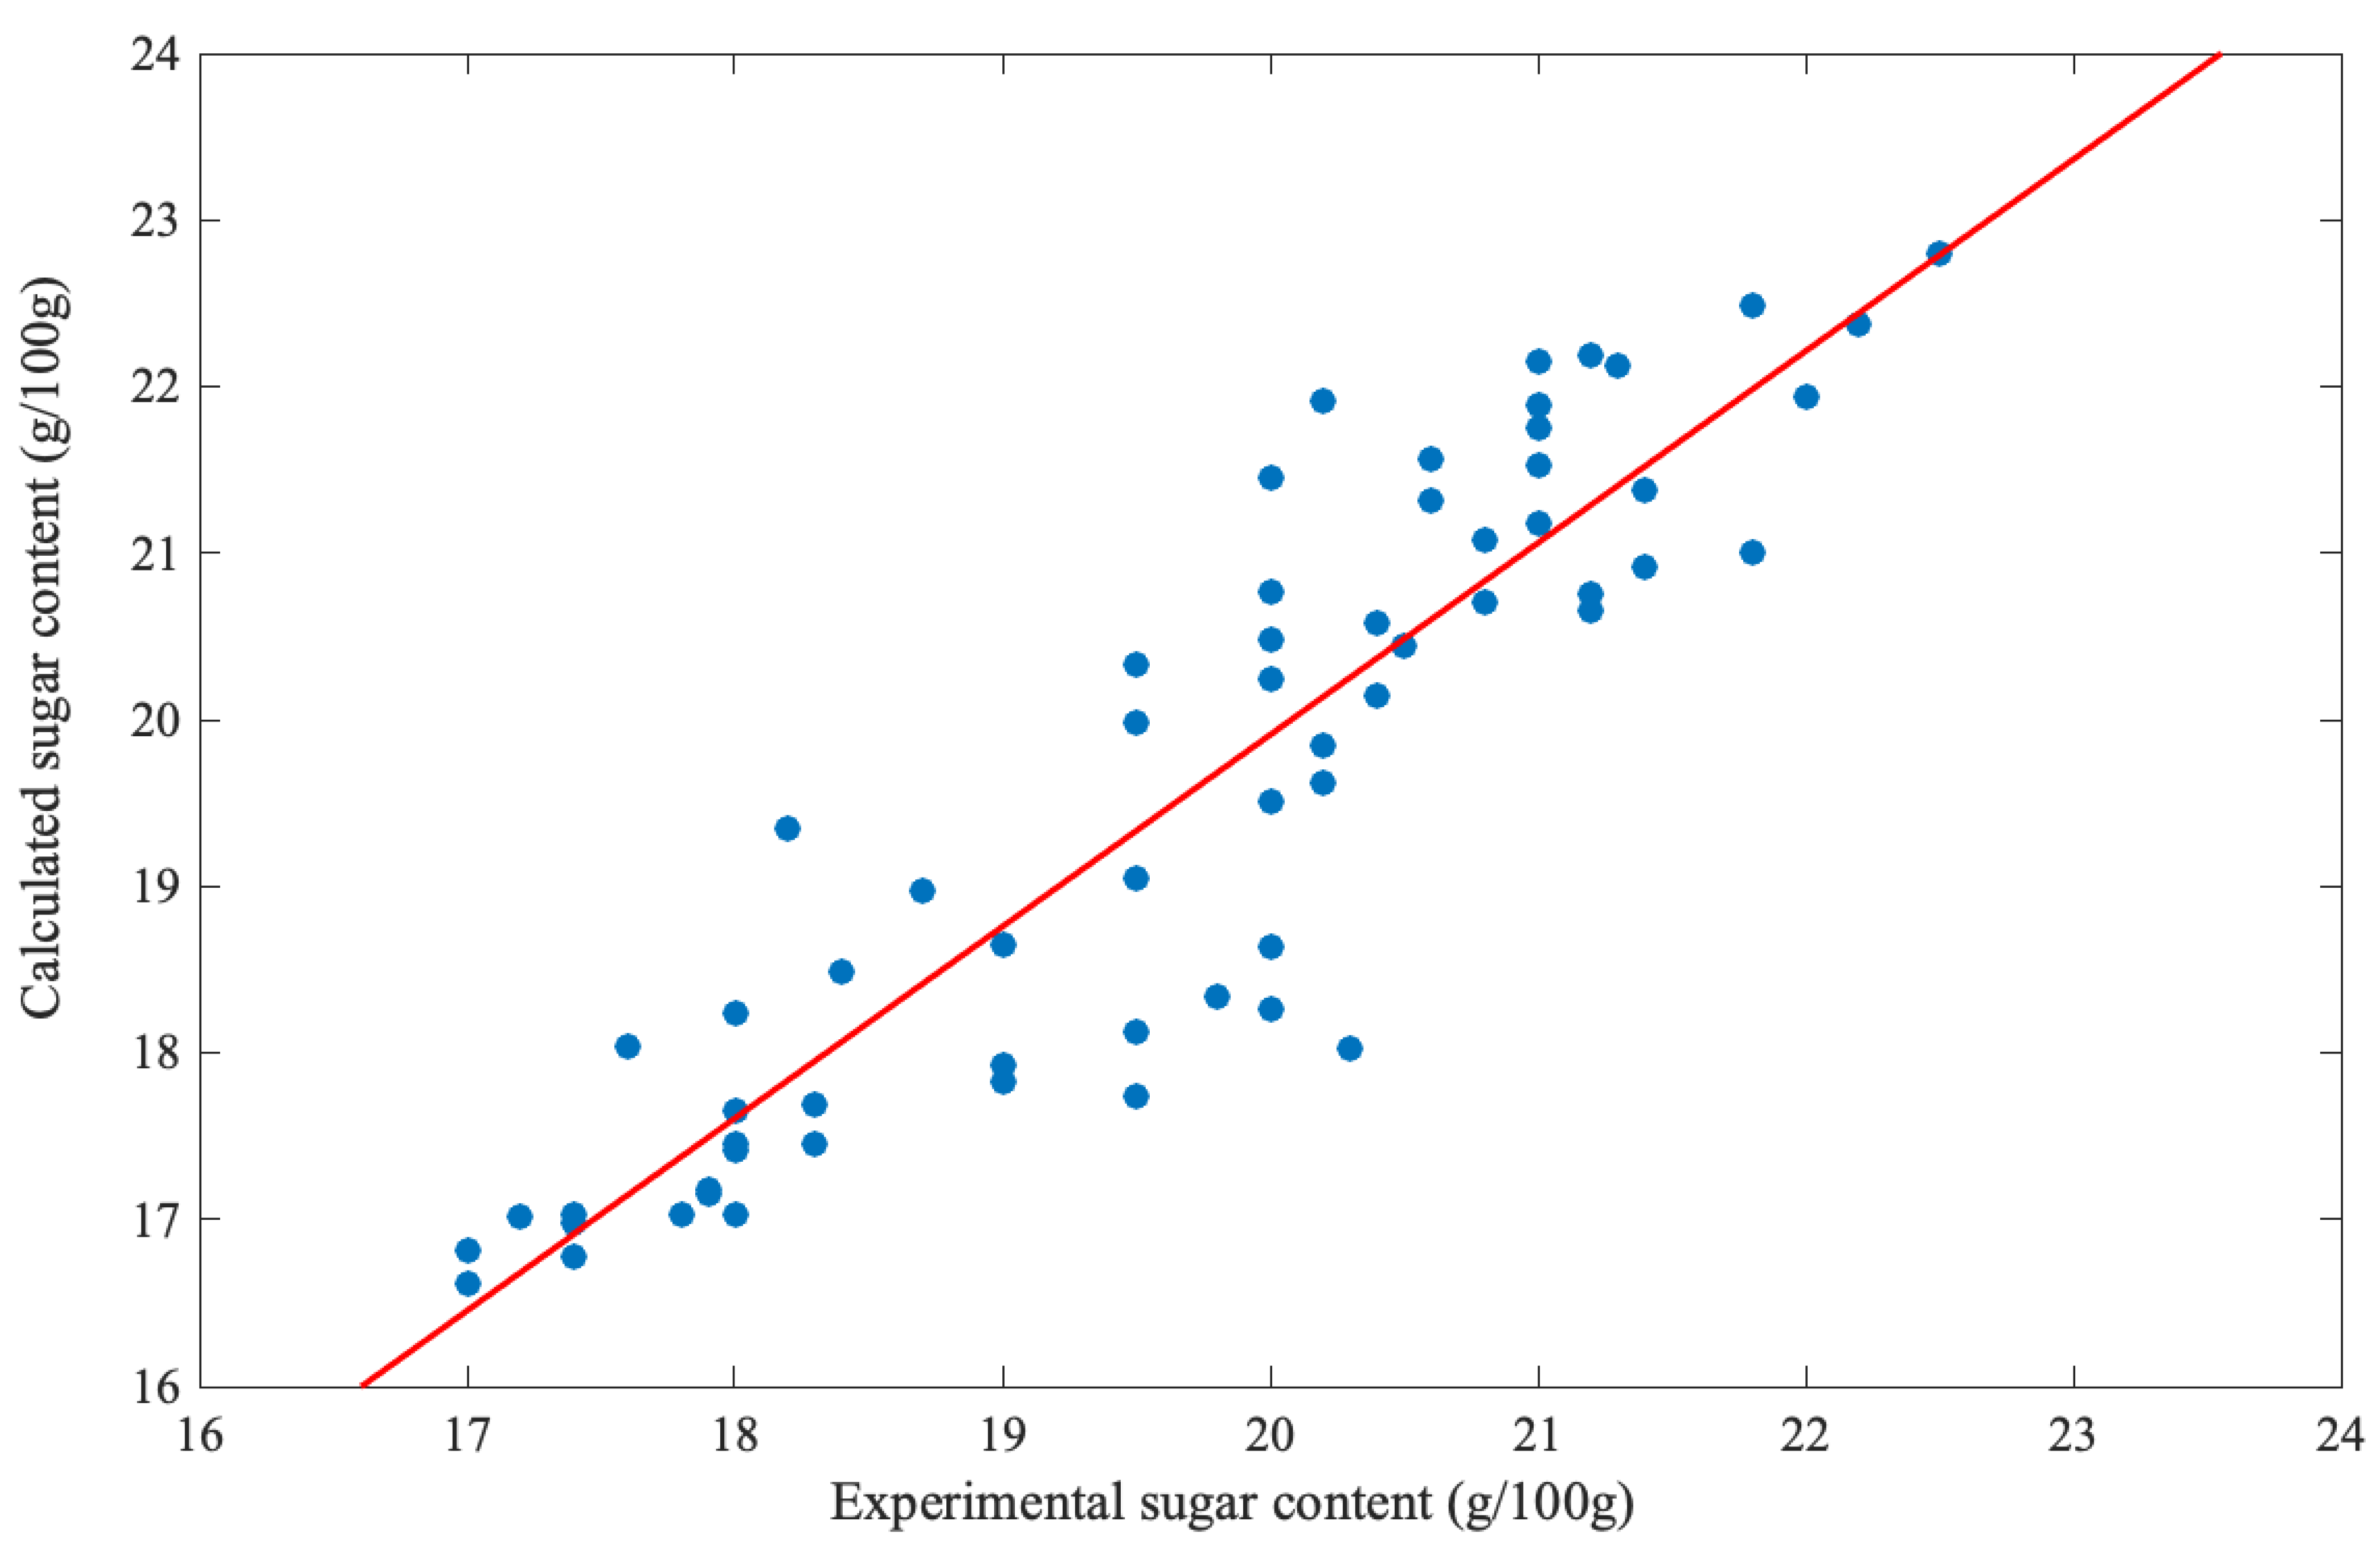
3.2. Test Results on the Industrial Plants

Solids suspended in the mixture(cake) to be filtered block the membrane pore in a very short time. The continuous iteration of the process results in the blinding of the filter medium, thus limiting the membrane useful life.
Accordingly, for the industrial treatment of must concentration NF2 and NF4 membranes were employed for nanofiltration and RO4 and RO5 for Reverse Osmosis. These membranes were chosen because laboratory tests had shown that for 12 hours of continuous operation, the flow is reduced to 37% of its initial value (see Figure 2). Results collected in Table 4 and Table 5 show how sugar content, dry extract, and alcohol potential reach commercially optimal values in both reverse osmosis and nanofiltration processes when the membranes operate under higher pressure, i.e., 60–70 bar for RO membranes and 30–40 bar for NF membranes. Since the selected membranes exhibited a complete block fouling mechanism during laboratory tests, Equation (20) was used to estimate the sugar concentration in the tank. The correlation plot of Figure 5, where C P calculated by Equation (20) is plotted versus experimental C P , is linear with R 2 = 0.90 . We note that experimental results provide α 1 = 0.013 . This implies that, within the experimental error, Equation (20) can be reduced. Indeed, for α 1 0 Equation (20) is transformed into
C T C T 0 = 1 ( 1 p ) V ˙ P 0 τ 2 V T 0 1 e t τ 2
For relatively short times this equation can be further simplified to give
C T C T 0 = 1 ( 1 p ) A K P ( Δ P 0 ) V T 0 t
where Equation (21) has been used.
In this form, one easily recognizes that C T is, the greater the more the membrane works at a higher pressure. Inspection of Table 4 and Table 5 reveals that this has occurred, indeed for all the investigated musts, both processed with RO and with NF, an increase in operating pressure produces an increase in sugar content, dry extract, and alcohol potential.
Comparing Black Bombino and Verdeca results obtained by RO membranes working at 70 bar, it is immediately recognized that RO5 membrane produces significantly higher values, compared to other RO membranes operating at the same pressure, although the alcohol potential increases slightly. Making a similar comparison between values obtained by NF membranes, one finds that the best results are reached with the NF4 membrane. Thus, for Black Bombino and Verdeca musts, which are very loaded with dispersed solids, filmtech membranes provide commercially more attractive results. Furthermore, the plant was used to treat musts less rich in solids such as White Bombino and Trebbiano. As one can see from Table 4 and Table 5 the filmtech membranes provide higher values of sugar concentration, dry extract, and alcoholic potential.
In order to monitor the functioning of the membranes, the concentration of sugars in the permeate was also monitored. Results in Table 6 show that filmtech membranes, when working at higher pressure, release higher quantities of sugar, both in reverse osmosis and nanofiltration. Their retention coefficient is independent of the initial conditions and is 62% for filmtech membranes and 30.8% for osmonics membranes.

4. Conclusions

Grape must is the juice obtained by crushing grapes and contains water, sugars, acids, and other organic and inorganic compounds. Concentrating grape must can be beneficial for several reasons, including adjusting the sugar levels to achieve desired alcohol content in wine, reducing transportation costs by removing excess water, and improving the efficiency of fermentation. Nanofiltration and reverse osmosis are both membrane-based separation technologies that can be used to concentrate grape musts. Both technologies are capable of removing water and concentrating the remaining solutes in grape must. Overall, the choice of membrane technology will depend on the specific goals of the concentration process and the desired characteristics of the final product. In this paper, we have shown how this aim may be achieved by combining the equations fitting the laboratory experimental results with an appropriate overall balance model on an industrial plant. In particular, the proposed approach was tested on different musts such as Trebbiano, Verdeca, Black Bombino, and White Bombino. Must treatment by nanofiltration leads to more sugar in the permeate, compared to treatment by reverse osmosis. Furthermore, nanofiltration membranes have the highest flows, both in terms of initial values and operating values, and are less influenced by the fouling phenomenon. This is visible in reverse osmosis membranes, especially in initial phases, even if 100% clogging of the membrane does not occur. Industrial trials confirm that musts treated with the chosen membranes were more concentrated and had very high retention coefficients of sugars when higher transmembrane pressures were used, requiring identical treatment times in both nanofiltration and reverse osmosis processes. This shows how there can be certain membrane characteristics that make them particularly appropriate for treatment with nanofiltration and reverse osmosis on musts, allowing for suitable flows for at least ten hours. This is also assessed by the fact that all the membranes chosen for industrial tests follow the standard model, particularly suitable when fouling occurs slowly.
The alcohol content of the concentrated musts obtained does not exceed 13%. Therefore, we can propose to apply nanofiltration first and reverse osmosis on the nanofiltration permeate, considering the greater release of sugars in the NF permeate and the higher flows obtained with NF. This allows appropriate evaluation of how to manage the concentrates, especially in wineries characterized by low quantity and high-quality productions. In conclusion, the discussed results indicate that NF membranes produce lower concentrations of sugars than RO membranes, but they work with a stable flow during the whole filtration process. A combination of both technologies may be used to achieve the desired concentration and quality. For the musts analyzed, a nanofiltration with NF1 and then a membrane filtration with RO1 could be proposed to obtain the high-quality product.

Author Contributions

Conceptualization, L.A. and B.M.; methodology, L.A. and B.B.; software, F.C.; investigation, F.G. and A.J.M.; data curation, B.B. and F.C. All authors have read and agreed to the published version of the manuscript.

Funding

This research received no external funding.

Data Availability Statement

Not applicable.

Conflicts of Interest

The authors declare no conflict of interest.

References

  1. Jiao, B.; Cassano, A.; Drioli, E. Recent advances on membrane processes for the concentration of fruit juices: A review. J. Food Eng. 2004, 63, 303–324. [Google Scholar] [CrossRef]
  2. Mietton-Peuchot, M.; Milisic, V.; Noilet, P. Grape must concentration by using reverse osmosis. Comparison with chaptalization. Desalination 2002, 148, 125–129. [Google Scholar] [CrossRef]
  3. Drioli, E.; Fontanova, E. Membrane technology and sustainable growth. Chem. Eng. Res. Des. 2004, 82, 1557–1562. [Google Scholar] [CrossRef]
  4. Gurak, P.D.; Cabral, L.M.C.; Rocha-Leão, M.H.M.; Matta, V.M.; Freitas, S.P. Quality evaluation of grape juice concentrated by reverse osmosis. J. Food Eng. 2010, 96, 421–426. [Google Scholar] [CrossRef]
  5. Grace, H.P.; Fontanova, E. Structure and performance of filter media. II. Performance of filter media in liquid service. AIChE J. 1956, 2, 316–336. [Google Scholar] [CrossRef]
  6. Hermia, J. Constant pressure blocking filtration laws: Application to power-law non-Newtonian fluids. Inst. Chem. Eng. 1982, 60, 183–187. [Google Scholar]
  7. Ho, C.-C.; Zydney, A.L. A combined pore blockage and cake filtration model for protein fouling during microfiltration. J. Colloid Interface Sci. 2000, 232, 389–399. [Google Scholar] [CrossRef] [PubMed]
  8. Iritani, E.; Katagiri, N. Developments of blocking filtration model in membrane filtration. KONA Powder Part. J. 2016, 33, 179–202. [Google Scholar] [CrossRef]
  9. Di Biasio, A.; Ambrosone, L.; Cametti, C. Numerical simulation of dielectric spectra of aqueous suspensions of non-spheroidal differently shaped biological cells. J. Phys. D Appl. Phys. 2008, 42, 025401–025410. [Google Scholar] [CrossRef]
  10. Notarnicola, B.; Tassielli, G.; Renzulli, P.A. Environmental and technical improvement of a grape must concentration system via a life cycle approach. J. Clean. Prod. 2015, 89, 87–98. [Google Scholar] [CrossRef]
  11. Tomaszewska, M.; Orecki, A.; Karakulski, K. Treatment of bilge water using a combination of ultrafiltration and reverse osmosis. Desalination 2005, 185, 203–212. [Google Scholar] [CrossRef]
  12. Pati, S.; La Notte, D.; Clodoveo, M.L.; Cicco, G.; Esti, M. Reverse osmosis and nanofiltration membranes for the improvement of must quality. Eur. Food Res. Technol. 2014, 239, 595–602. [Google Scholar] [CrossRef]
  13. Laganà, F.; Barbieri, G.; Drioli, E. Direct contact membrane distillation: Modelling and concentration experiments. J. Membr. Sci. 2000, 166, 1–11. [Google Scholar] [CrossRef]
  14. Mirsaeedghazi, H.; Emam-Djomeh, Z.; Mousavi, S.M.; Enjileha, V.; Navidbakhsh, M.; Mirhashemi, S.M. Mathematical modelling of mass transfer in the concentration polarisation layer of flat-sheet membranes during clarification of pomegranate juice. Int. J. Food Sci. Technol. 2010, 45, 2096–2100. [Google Scholar] [CrossRef]
  15. Mulligan, K.; Jakubek, Z.J.; Johnston, L. Supported lipid bilayers on biocompatible polysaccharide multilayers. Langmuir 2011, 27, 14352–14359. [Google Scholar] [CrossRef] [PubMed]
  16. Mosca, M.; Murgia, S.; Ceglie, A.; Monduzzi, M.; Ambrosone, L. Biocompatible lipid-based liquid crystals and emulsions. J. Phys. Chem. B 2006, 110, 25994–26000. [Google Scholar] [CrossRef] [PubMed]
  17. Kofránek, J.; Kulhánek, T.; Mateják, M.; Ježek, F.; Šilar, J. Integrative physiology in Modelica. In Proceedings of the 12th International Modelica Conference, Prague, Czech Republic, 15–17 May 2017; pp. 589–603. [Google Scholar]
  18. Bianchi, B.; Catalano, F.; Oliveto, R.; Ricciardi, S. Dynamic simulation driven design and management of production facilities in agricultural/food industry. Acta Hortic. 2021, 1311, 241–248. [Google Scholar] [CrossRef]
  19. Venditti, F.; Bufalo, G.; Lopez, F.; Ambrosone, L. Pollutants adsorption from aqueous solutions: The role of the mean lifetime. Chem. Eng. Sci. 2011, 66, 5922–5929. [Google Scholar] [CrossRef]
  20. Minó, A.; Zeppa, L.; Ambrosone, L. Excess Absorbance as a Novel Approach for Studying the Self-Aggregation of Vital Dyes in Liquid Solution. Int. J. Mol. Sci. 2023, 24, 1645. [Google Scholar] [CrossRef] [PubMed]
  21. Matsuura, T. Synthetic Membranes and Membrane Separation Processes, 1st ed.; Taylor & Francis: London, UK, 1993. [Google Scholar]
  22. Jackson, R.S. Wine Science: Principles and Applications, 3rd ed.; Academic Press: Boston, MA, USA, 2008. [Google Scholar]
  23. Ambrosone, L.; D’Errico, G.; Sartorio, R.; Vitagliano, V. Analysis of velocity cross-correlation and preferential solvation for the system N-methylpyrrolidone–water at 20 °C. J. Chem. Soc. Faraday Trans. 1995, 91, 1339–1344. [Google Scholar] [CrossRef]
Figure 1. Flowchart of the industrial scale plant to concentrate musts with either NF or RO membranes.
Chemengineering 07 00048 g001
Figure 2. Nanofiltration laboratory test on Black Bombino must. (a) Normalized flow rates in operation of membrane operation time. (b) Lifetime of the single membranes, obtained from the best-fit of the experimental results.
Chemengineering 07 00048 g002
Figure 3. Nanofiltration laboratory test on Verdeca must. (a) Normalized flow rates in the operation of membrane operation time. (b) Lifetime of the single membranes, obtained from the best-fit of the experimental results.
Chemengineering 07 00048 g003
Figure 4. Reverse osmosis laboratory test. The fitting curves show that, for the membranes reported in the plot, the fouling mechanism is the superimposition of different effects. (a) Normalized flow rates for Black Bombino must. (b) Normalized flow rates for Verdeca must.
Chemengineering 07 00048 g004
Figure 5. The correlation plot, between C P calculated by Equation (20) and experimental C P ( R 2 = 0.90 ), for all filtration measurements, regardless of the process used.
Chemengineering 07 00048 g005
Table 1. Main chemical-physical characteristic of musts used in tests (data expressed as means of three replicates ± standard deviation).
MustsDensity
kgm 3
Sugars
°Bx
Dry Extract
gL 1
Black Bombino (lab. and industrial tests)1088 ± 1 18.9 ± 0.1181 ± 3
Verdeca (lab. and industrial tests)1079 ± 1 19.7 ± 0.1191 ± 2
Trebbiano (industrial tests)1062 ± 1 15.8 ± 0.1159 ± 4
Table 2. Main technical characteristics of the designed industrial plant.
Permeate Diameter Pipes
Dp (cm)
Retentate Diameter Pipes
Dc
Features Centrifugal PumpFeatures Volumetric PumpTotal Membrane Area
m2
1.743Flow: Q r up to 520 Lmin 1
Pressure: P m a x = 3.0 bar
Power: W = 3.0 kW
Flow: Q r up to 42 Lmin 1
Pressure: P m a x = 150 bar
Power: W = 11 kW
55
Table 3. Fitting parameters for RO membranes.
BombinoVerdeca
Membrane τ m R ¯ τ m R ¯
RO142 ± 200.41 ± 0.0697 ± 410.34 ± 0.08
RO2116 ± 930.30 ± 0.244 ± 300.46 ± 0.07
RO3109 ± 610.48 ± 0.09194 ± 1130.31 ± 0.2
Table 4. Physicochemical features of the concentrate at different operating concentrations during industrial reverse osmosis tests on Black Bombino and Verdeca musts (data expressed as the average of three replicates).
Black BombinoVerdeca
Membrane Δ P
(bar)
Density
(kgL 1 )
Sugars
(g/100 g)
DryExtract
(gL 1 )
Density
(kgL 1 )
Sugars
(g/100 g)
DryExtract
(gL 1 )
RO4401.085 ± 0.00119.5 ± 0.1187 ± 31.089 ± 0.00121.0 ± 0.2208 ± 2
501.086 ± 0.00120.0 ± 0.1191 ± 11.089 ± 0.00120.6 ± 0.1208 ± 1
601.087 ± 0.00120.0 ± 0.2195 ± 11.090 ± 0.00121.0 ± 0.2211 ± 3
701.088 ± 0.00120.2 ± 0.1198 ± 21.091 ± 0.00121.2 ± 0.2215 ± 1
RO5401.085 ± 0.00119.5 ± 0.3190 ± 21.088 ± 0.00120.6 ± 0.2205 ± 2
501.087 ± 0.00120.0 ± 0.1194 ± 11.090 ± 0.00121.0 ± 0.2210 ± 3
601.089 ± 0.00120.0 ± 0.3200 ± 21.092 ± 0.00121.3 ± 0.1218 ± 4
701.091 ± 0.00120.8 ± 0.1201 ± 21.093 ± 0.00121.8 ± 0.2220 ± 2
White BombinoTrebbiano
RO4401.078 ± 0.00117.6 ± 0.2179 ± 11.076 ± 0.00117.4 ± 0.1169 ± 2
501.080 ± 0.00118.4 ± 0.3181 ± 41.077 ± 0.00117.9 ± 0.2176 ± 4
601.080 ± 0.00118.7 ± 0.2182 ± 41.079 ± 0.00118.3 ± 0.3176 ± 2
701.086 ± 0.00118.2 ± 0.1183 ± 31.080 ± 0.00118.3 ± 0.1176 ± 6
RO5401.079 ± 0.00118.0 ± 0.2178 ± 31.076 ± 0.00117.9 ± 0.2169 ± 2
501.083 ± 0.00119.0 ± 0.2189 ± 31.079 ± 0.00118.0 ± 0.3176 ± 4
601.085 ± 0.00119.5 ± 0.1192 ± 31.082 ± 0.00119.5 ± 0.3176 ± 2
701.086 ± 0.00119.8 ± 0.3194 ± 41.084 ± 0.00120.3 ± 0.1183 ± 1
Table 5. Physicochemical features of the concentrate at different operating concentrations during industrial nanofiltration tests on Black Bombino and Verdeca musts (data expressed as the average of three replicates).
Black BombinoVerdeca
Membrane Δ P
(bar)
Density
(kgL 1 )
Sugars
(g/100 g)
DryExtract
(gL 1 )
Density
(kgL 1 )
Sugars
(g/100 g)
DryExtract
(gL 1 )
NF2251.088 ± 0.00120.2 ± 0.1194 ± 21.092 ± 0.00121.2 ± 0.1217 ± 5
301.089 ± 0.00120.2 ± 0.3196 ± 61.092 ± 0.00121.2 ± 0.2217 ± 3
351.090 ± 0.00120.4 ± 0.1199 ± 51.092 ± 0.00121.4 ± 0.2217 ± 3
401.091 ± 0.00120.5 ± 0.2200 ± 31.093 ± 0.00121.8 ± 0.3220 ± 2
NF4251.089 ± 0.00120.4 ± 0.2198 ± 41.092 ± 0.00121.4 ± 0.1215 ± 4
301.090 ± 0.00120.8 ± 0.1199 ± 31.095 ± 0.00122.0 ± 0.1219 ± 3
351.092 ± 0.00121.0 ± 0.2205 ± 21.097 ± 0.00122.2 ± 0.1222 ± 6
401.092 ± 0.00121.0 ± 0.1205 ± 21.099 ± 0.00122.5 ± 0.1229 ± 2
White BombinoTrebbiano
NF2251.074 ± 0.00117.2 ± 0.2163 ± 11.073 ± 0.00117.0 ± 0.2157 ± 4
301.075 ± 0.00117.4 ± 0.2166 ± 21.074 ± 0.00117.0 ± 0.3160 ± 2
351.076 ± 0.00117.8 ± 0.1169 ± 31.076 ± 0.00117.4 ± 0.2166 ± 3
401.077 ± 0.00118.0 ± 0.2172 ± 41.077 ± 0.00118.0 ± 0.1166 ± 4
NF4251.079 ± 0.00118.0 ± 0.2178 ± 31.078 ± 0.00118.0 ± 0.3173 ± 1
301.082 ± 0.00119.0 ± 0.3191 ± 61.084 ± 0.00119.0 ± 0.2188 ± 4
351.085 ± 0.00119.5 ± 0.2195 ± 21.087 ± 0.00120.0 ± 0.3197 ± 3
401.088 ± 0.00120.0 ± 0.2203 ± 21.087 ± 0.00120.0 ± 0.3197 ± 4
Table 6. Comparison, among all the investigated musts, of the sugar concentration (g/100 g) in the permeate recorded during the industrial tests, both in reverse osmosis and nanofiltration (data expressed as the average of three replicates).
Membrane Δ P
(bar)
Black BombinoVerdecaWhite BombinoTrebbiano
NF22515.8 ± 0.416.8 ± 0.212.7 ± 0.213.2 ± 0.3
3015.0 ± 0.316.8 ± 0.112.4 ± 0.112.6 ± 0.2
3514.0 ± 0.216.5 ± 0.212.0 ± 0.212.4 ± 0.3
4013.4 ± 0.216.6 ± 0.113.0 ± 0.111.4 ± 0.2
NF4259.4 ± 0.212.4 ± 0.38.2 ± 0.38.2 ± 0.3
308.4 ± 0.310.8 ± 0.27.5 ± 0.27.8 ± 0.2
358.0 ± 0.210.4 ± 0.17.2 ± 0.37.4 ± 0.1
407.2 ± 0.210.2 ± 0.16.8 ± 0.17.4 ± 0.2
RO4405.0 ± 0.217.2 ± 0.2163 ± 15.6 ± 0.3
503.8 ± 0.217.4 ± 0.2166 ± 22.4 ± 0.2
601.2 ± 0.117.8 ± 0.1169 ± 31.4 ± 0.2
701.0 ± 0.118.0 ± 0.2172 ± 41.2 ± 0.1
RO5401.079 ± 0.00118.0 ± 0.2178 ± 30.4 ± 0.1
501.082 ± 0.00119.0 ± 0.3191 ± 604 ± 0.1
601.085 ± 0.00119.5 ± 0.2195 ± 20.2 ± 0.1
701.088 ± 0.00120.0 ± 0.2203 ± 20.2 ± 0.1
Disclaimer/Publisher’s Note: The statements, opinions and data contained in all publications are solely those of the individual author(s) and contributor(s) and not of MDPI and/or the editor(s). MDPI and/or the editor(s) disclaim responsibility for any injury to people or property resulting from any ideas, methods, instructions or products referred to in the content.

