1. Introduction
Three-dimensional printing technology is a promising process for various polymers and metallic engineering materials. It is a time-saving operation and used to minimize waste and produce parts with various degrees of complexity and quality. It has been available since 1980, but it did not popularize until 2012, where it became a massively producible and marketable process. Many technologies stand under the umbrella of 3D printing such as fused deposition modeling (FDM), multi jet fusion (MJF), and stereolithography (SLA) [
1]. FDM is a commonly used process due to its simplicity, affordability, and utility in printing various materials [
2,
3,
4]. In this process, the printing nozzle moves and deposits a melted material on a predetermined track with respect to the 2D layer being built. The printing nozzle begins forming a new layer on top of the previous one as soon as a layer is completed in this deposition process. A significant weight reduction and cost saving is possible by producing hollow sections. In general, this technology comprises different parameters and variables that judge and control the final mechanical and surface properties. For example, printing speed, infill density, infill pattern, temperature, and layer thickness. The processing of eco-friendly plastic is highly encouraged to support sustainability [
5,
6]. The most commonly used 3D printing material is currently polylactic polymer (PLA), which is an environmental friendly and biodegradable material.
Numerous investigations were done in the field of 3D printing technology and its controllable parameters to improve the quality of the produced parts via identifying the most impacted parameters [
7,
8,
9]. For instance, the mechanical characteristics of ABS 3D-printed items were examined in terms of temperature, infill density, printing speed, and other factors. It was shown through examination of the specimen’s tensile strength and impact resistance that printing times for 100% infill were longer. Therefore, according to the applications and taking into account the load factors, the experiment’s findings pointed out that the 100% infill density is the better percentage [
10]. The mechanical properties of low-density cellular PLA material were investigated by Lubombo et al. [
11]. The cellular items were processed with one and three shells at three different infill densities and patterns. The results showed that strength and stiffness were improved up to 82 and 2%, respectively.
Tanikella [
12] examined the mechanical properties for a wide range of materials processed by an open-source 3D printer. The 3D-printed items were checked exteriorly and interiorly to identify the optimum layer and under extrusion conditions based on the measured specimen mass. Comparable work was performed to find the mechanical properties of PLA material based on the IV standard of ASTM D638. It involves testing the strength of PLA tensile specimens with a tensile machine and verifying the achieved results with the FEM-based simulation [
13].
The response of the bio-polymer utilized in medical gadgets to different infill structures was investigated [
14]. The mechanical and electrical properties of biodegradable PLA material were improved by carbon nanoparticles for antistatic packaging purposes [
15]. Additionally, PLA+ material was subjected to mechanical evaluation under different infill densities and orientation [
16]. The effect of wood filament content and deposition angles on the mechanical properties of PLA composite materials was evaluated [
17]. The PLA material was strengthened with 15 wt% and 25 wt% and was deposited at 0°, 90°, 15°, 30°, 45°, 60°, and 75° crossed angles. The finding showed a direct correlation and mutual dependency between input and output parameters and also a higher effect for 25 wt% wood filament.
For the modeling of PLA materials via fusion deposition, the optimum infill patterns were found. The mechanical characteristics of the PLA-printed items are revealed by tension and three-point bending testing, which showed a considerable variation in the mechanical characteristics depending on printing speed, feed rate, and orientation [
18]. Additionally, the PLA material was 3D printed using FDM at 200 °C with a rate of 200 mm/s to deposit 30 layers at 0.2 mm each. The specimens were subjected to low-speed impact and compression testing to evaluate their mechanical properties. Different patterns were applied, such as grid, triangle, tri-hexagon, and quarter cubic. The infill density was kept at 60%. The maximum compressive strength of 72 MPa was obtained with grid structure. In contrast, the maximum stiffness of 0.68 GPa and an impact resistance of 7.5 J were achieved with a triangle pattern [
19].
The topology optimization was applied to another method of shell-infill structures. Using this method, gradient infills were used in place of the fixed-distance infills. The 3D-printed products have exceptional mechanical properties, and the printing time was minimized [
20,
21,
22]. Fused deposition modeling was applied to print ammonium perchlorate-PLA composite for the first time with complex geometry and a combustible pattern. The capabilities of the structural and energetic composite were demonstrated [
23].
The response of the tri-hexagon infill structure for the cubic PLA geometry was investigated at different infill densities ranging from 20 to 60%. The upper level of infill density maintained a maximum printing time of 227 min [
24]. The mechanical characteristics of the 3D-printed fused deposition pieces were influenced by the printing settings, orientation, raster angle, and materials. The right adjustments to the printing parameters resulted in a noticeably higher tensile strength. The ideal factor settings were varied from the factor levels [
25].
The cited works above reveal that the most 3D-printed material is PLA and the common investigated properties are mechanical properties. Furthermore, the number of examined infill patterns does not exceed four pattern structures. Thus, this study aims to investigate the influence of fourteen different pattern structures on the mechanical properties as well as the surface characteristics of the three different materials, namely PLA, PLA+, and PETG.
2. Materials and Procedures
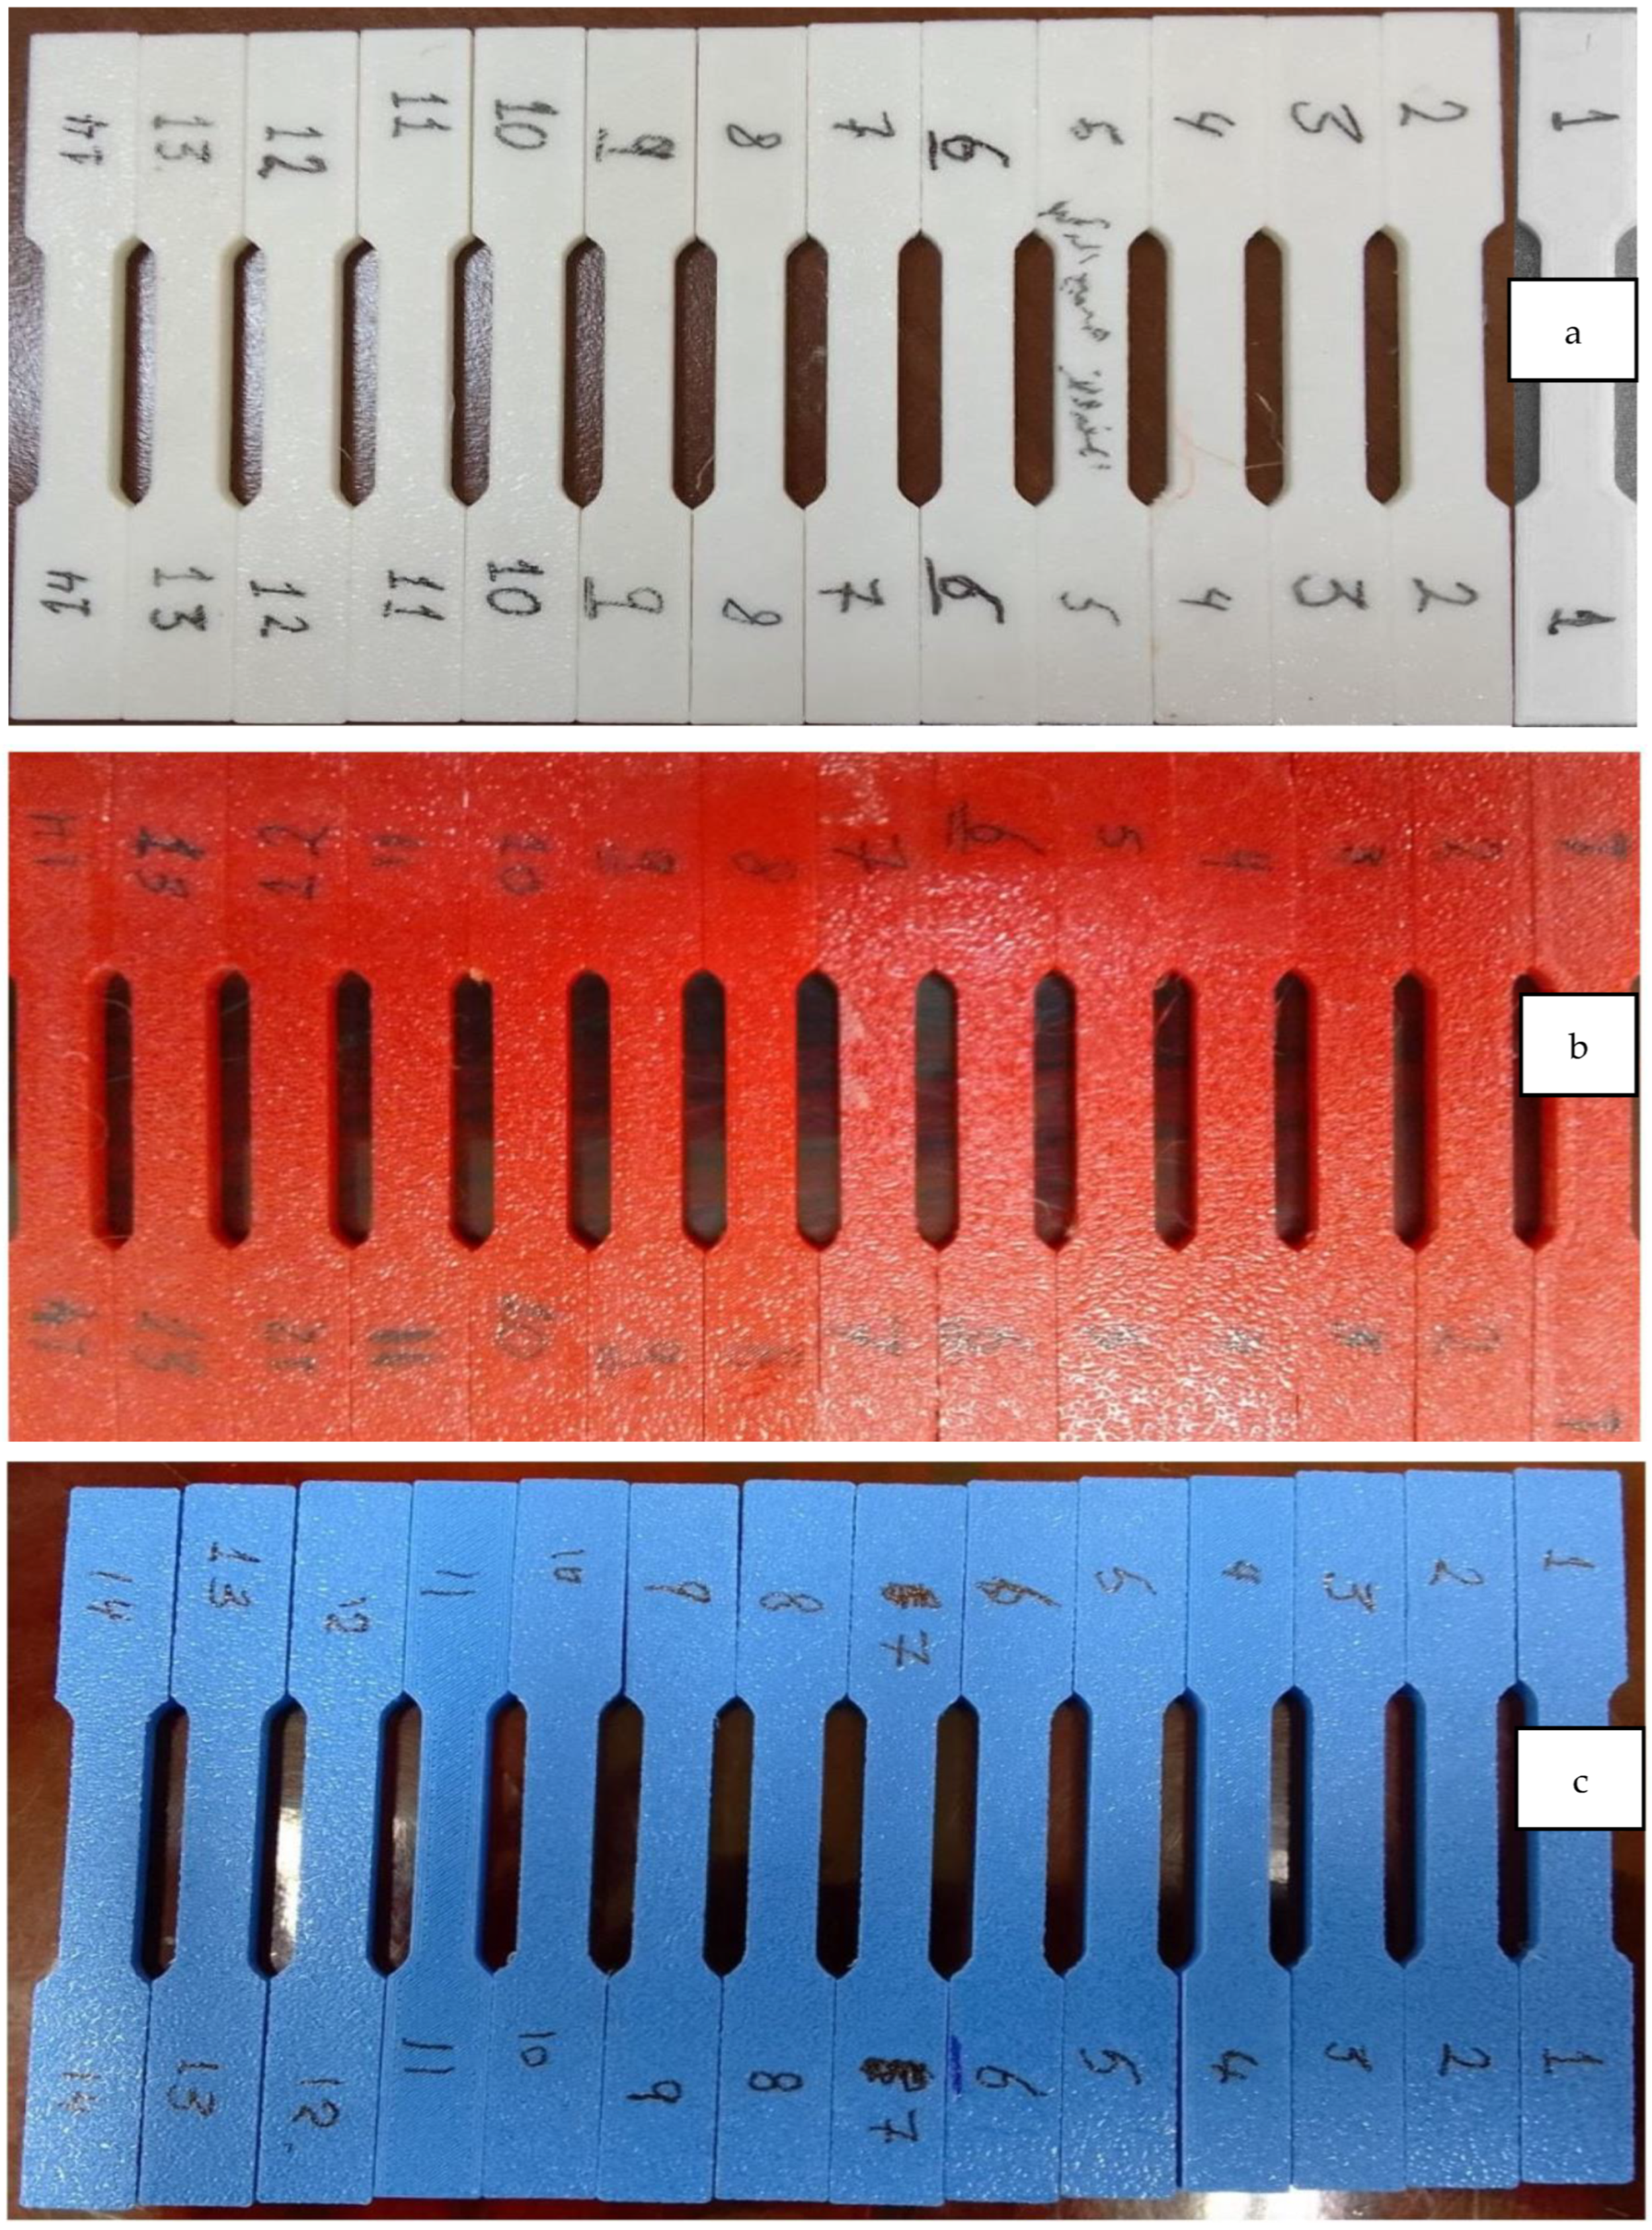
In this study, a 3D printer was utilized to carry out the printing of PLA, PLA+, and PETG materials with fourteen different patterns. The brands PLA and PLA+ are manufactured by the Hello 3D Chinese company having a 1.75 mm filament diameter with a white and blue color, respectively. In contrast, the brand PETG is processed by the Ai Sing Di Chinese Company with a red color and the same size of PLA and PLA+. The PLA is a bio-degradable polymeric material, generally processed from sugar cane or corn starch. Therefore, it is affordable and easy to print, making it the leading material in the 3D printing world. On the other side, the PLA had been improved with different additives by various manufactures to produce the PLA+ version that is also called tough PLA and pro PLA. The improvement has taken different directions, such as impact and thermal resistances, quality, and layer adhesion. In contrast, polyethylene terephthalate glycol (PETG) material is a polyethylene terephthalate (PET) modified by adding a glycol to improve the polymerization through minimizing the fragility and enhancing the durability and printability. PETG is also a commonly used filament by the FDM process and it exhibits better resistance to moisture, heat, and chemicals than PLA. A 3D printer (model Ender3 Pro) was used to apply the printing process. The three different materials (PLA, PLA+, and PETG) were printed in the tensile specimen form according to the ASTM D628 Standard. Three specimens were printed for each pattern.
Figure 1 shows the printed specimens where white, blue, and red colors refer to the PLA, PLA+, and PETG printed materials. The specimens were subjected to two tests, namely the tensile test and surface roughness testing, in order to evaluate their mechanical properties and surface characteristics.
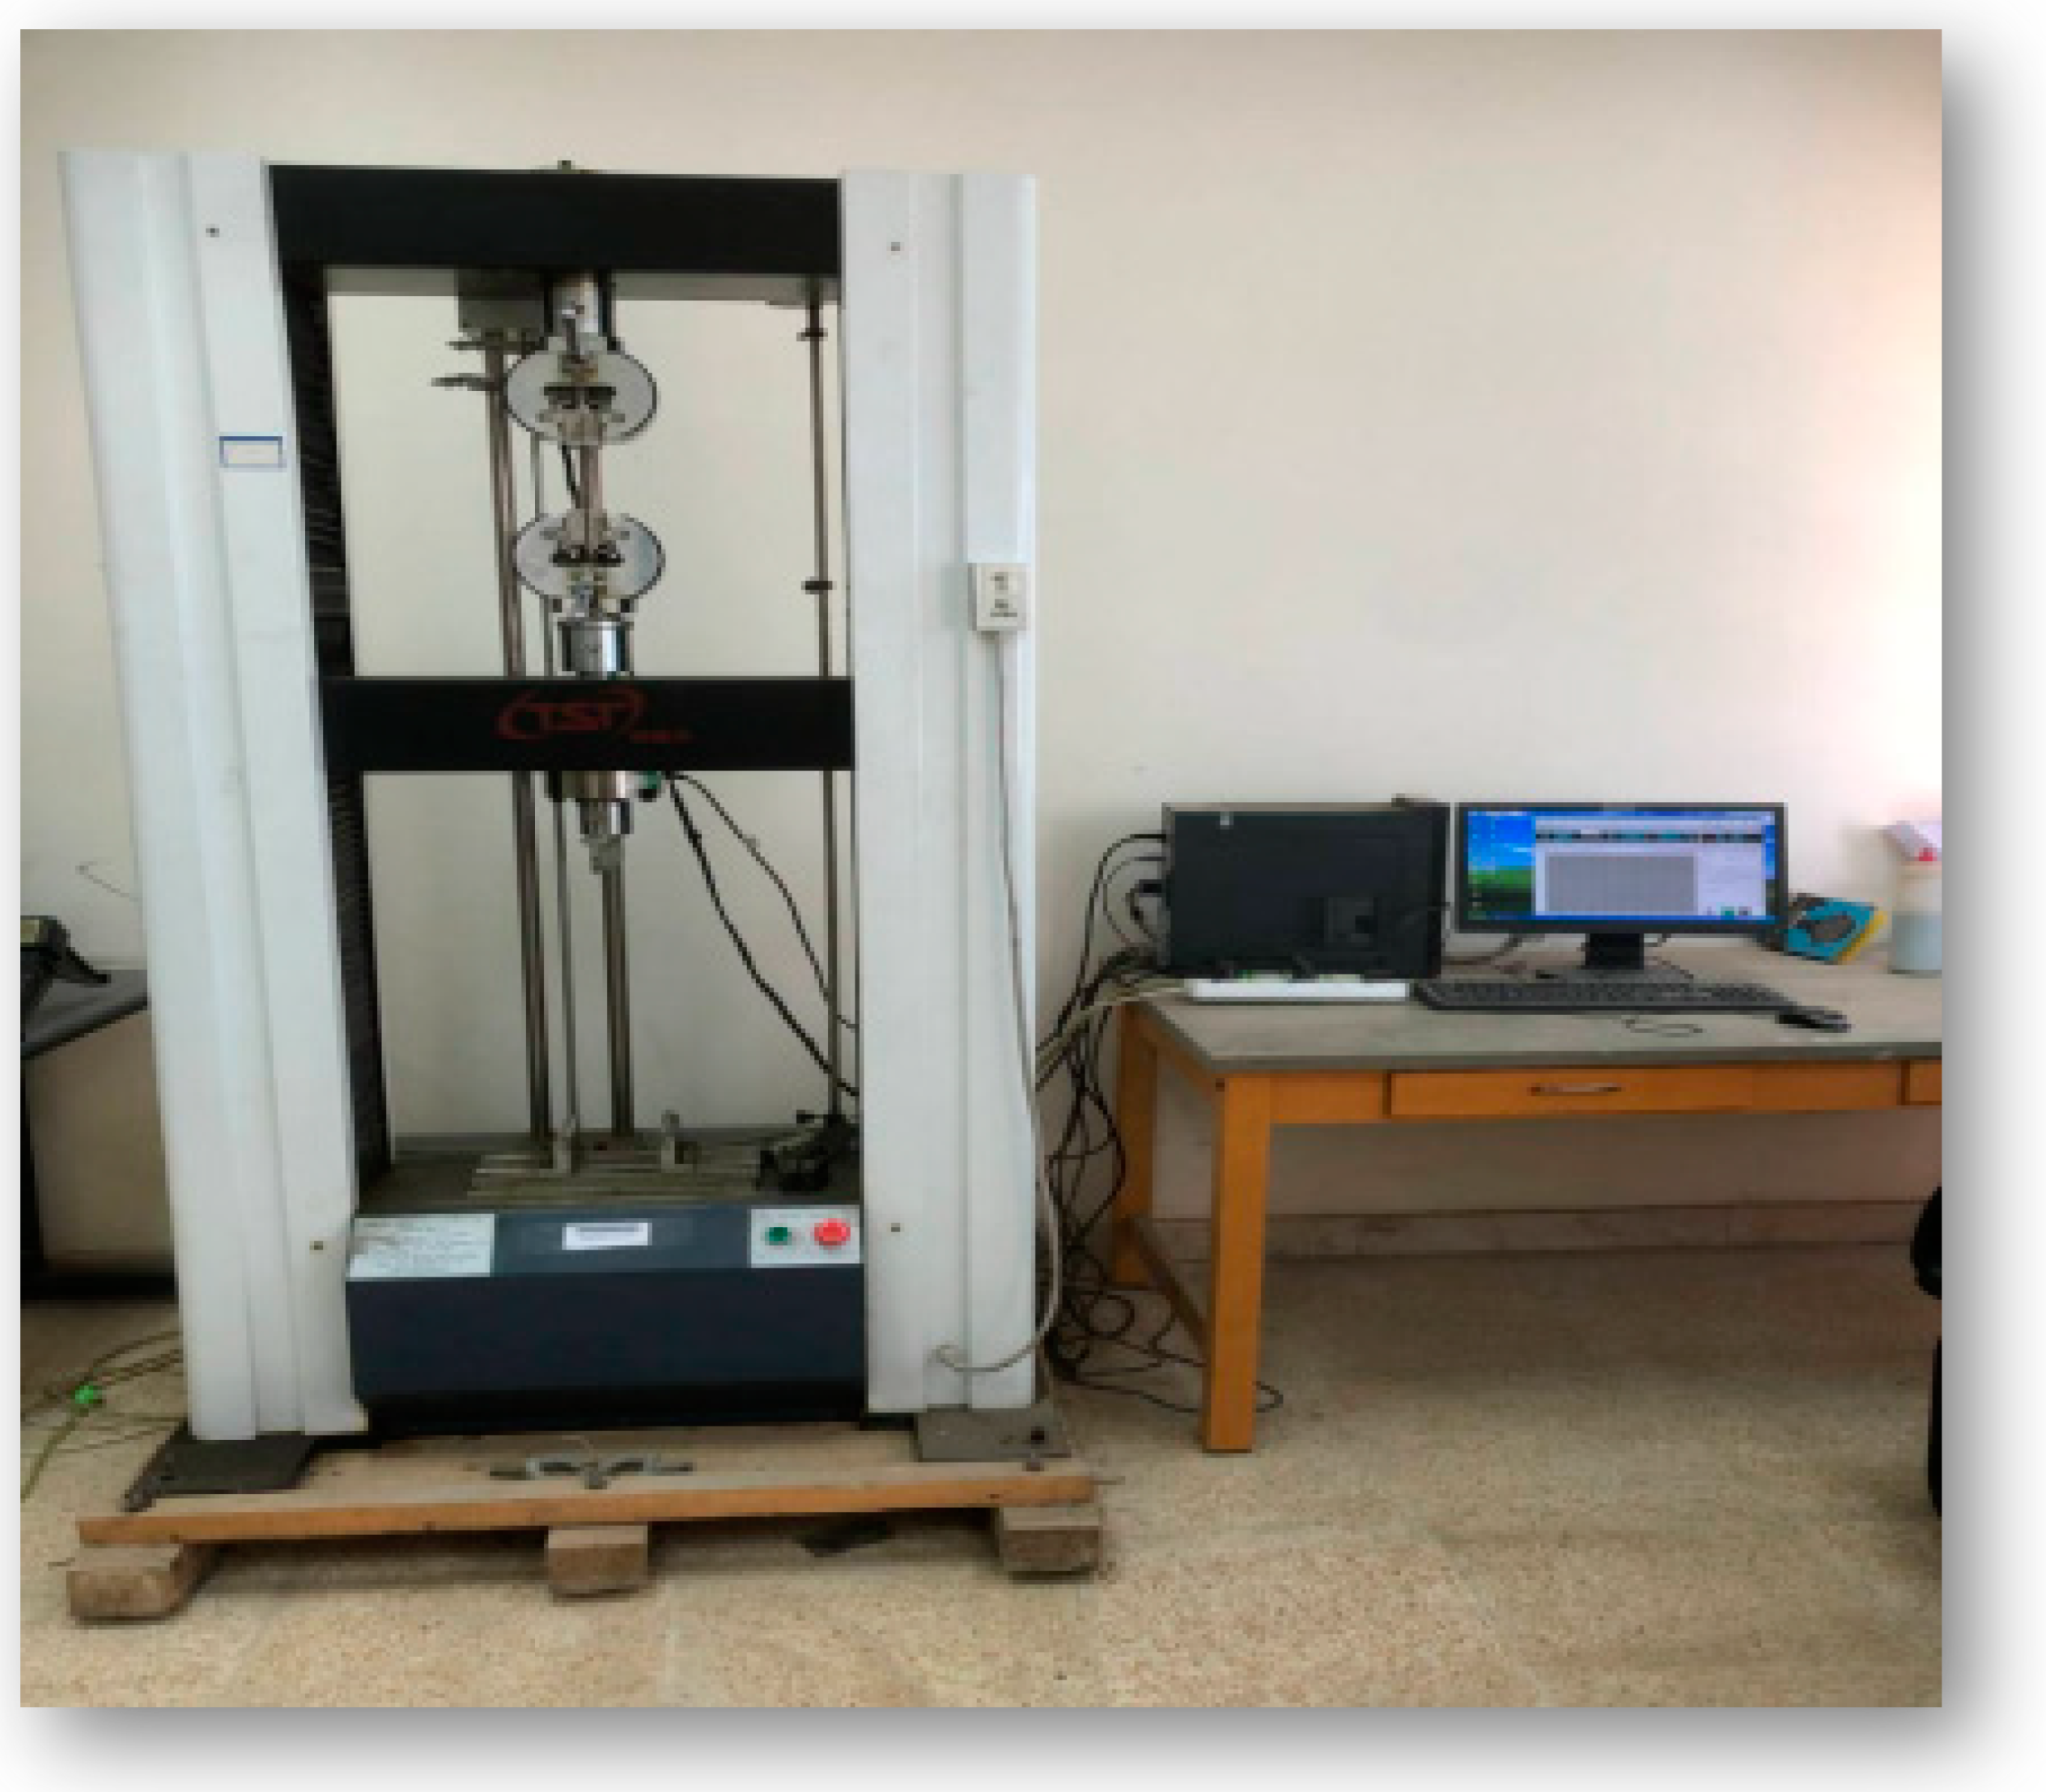
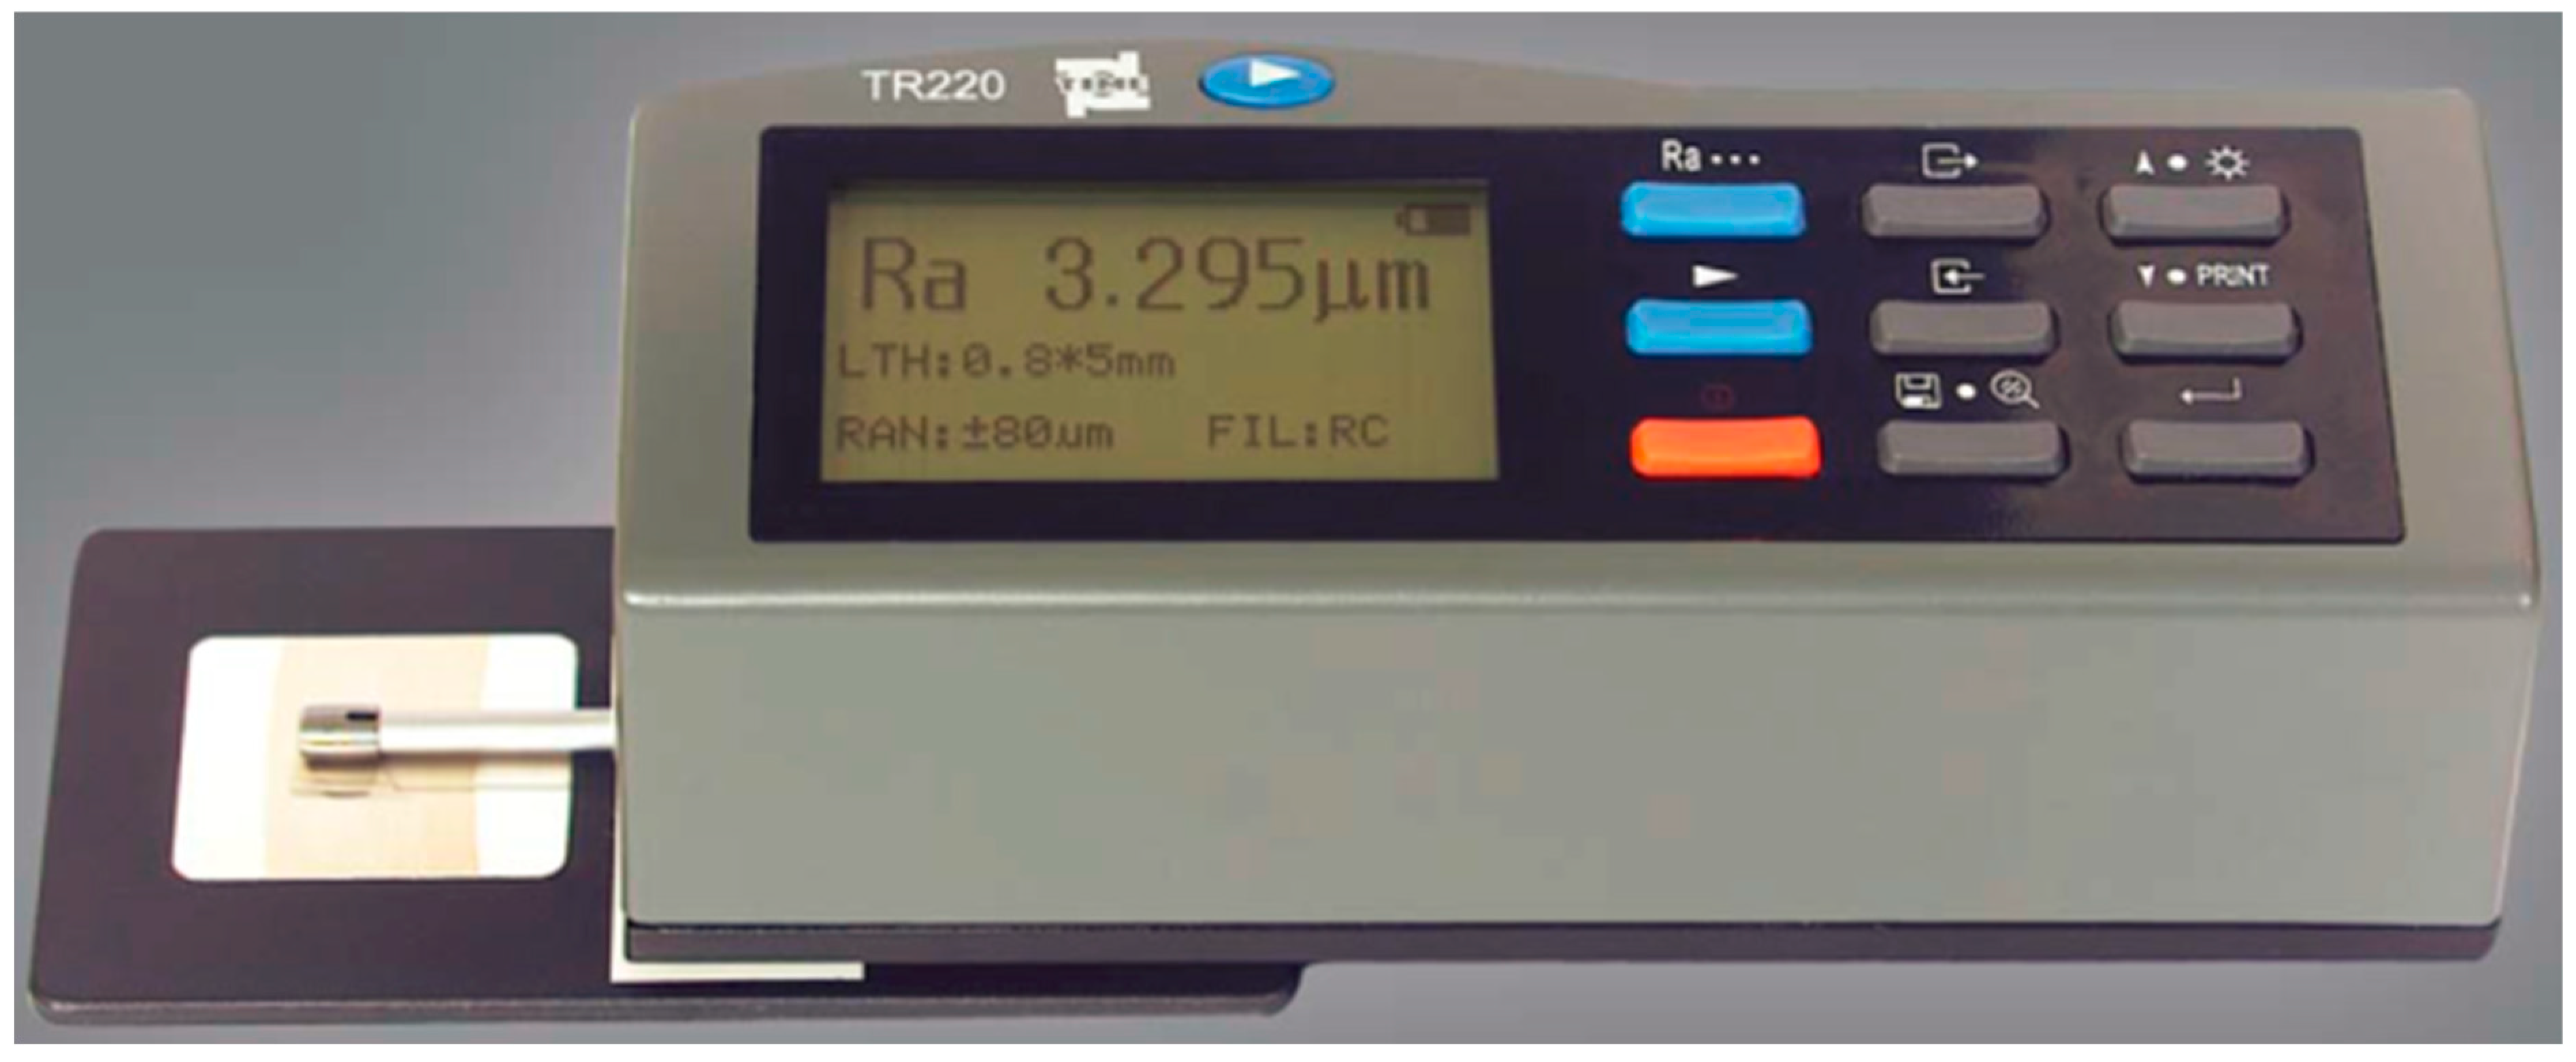
Figure 2 depicts the universal tensile test machine while the surface roughness tester (model Tr-220) is shown in
Figure 3. The two ends of the tensile test specimen are mounted carefully in the gripers and 0.5 mm/min was chosen as the speed of the moving cross head, and the specimen is pulled uniaxially until fracture. Three mechanical properties were calculated for each specimen: ultimate tensile strength, Young’s modulus, and strain at break %. These values are calculated automatically by the machine software. In contrast, average roughness, maximum roughness, and the total height of profiles (Ra, Rz, and Rt) were measured before carrying out the tensile test.
Table 1 shows the fourteen different patterns and other printing parameters which were kept constant for all patterns of all materials. The filament and nozzle diameters are 1.75 mm and 0.4 mm, while the table temperature is 60 °C.
3. Results and Discussion
This section presents the collected results and discusses the effect of different patterns on the mechanical and surface characteristics of the PLA, PLA+, and PETG 3D-printed parts. Each material set consists of 14 experiments based on fourteen different patterns, where each pattern represents one experiment. Thus, a total of 42 experiments were carried out.
3.1. Mechanical Properties of PLA, PLA+, and PETG 3D Printed Materials
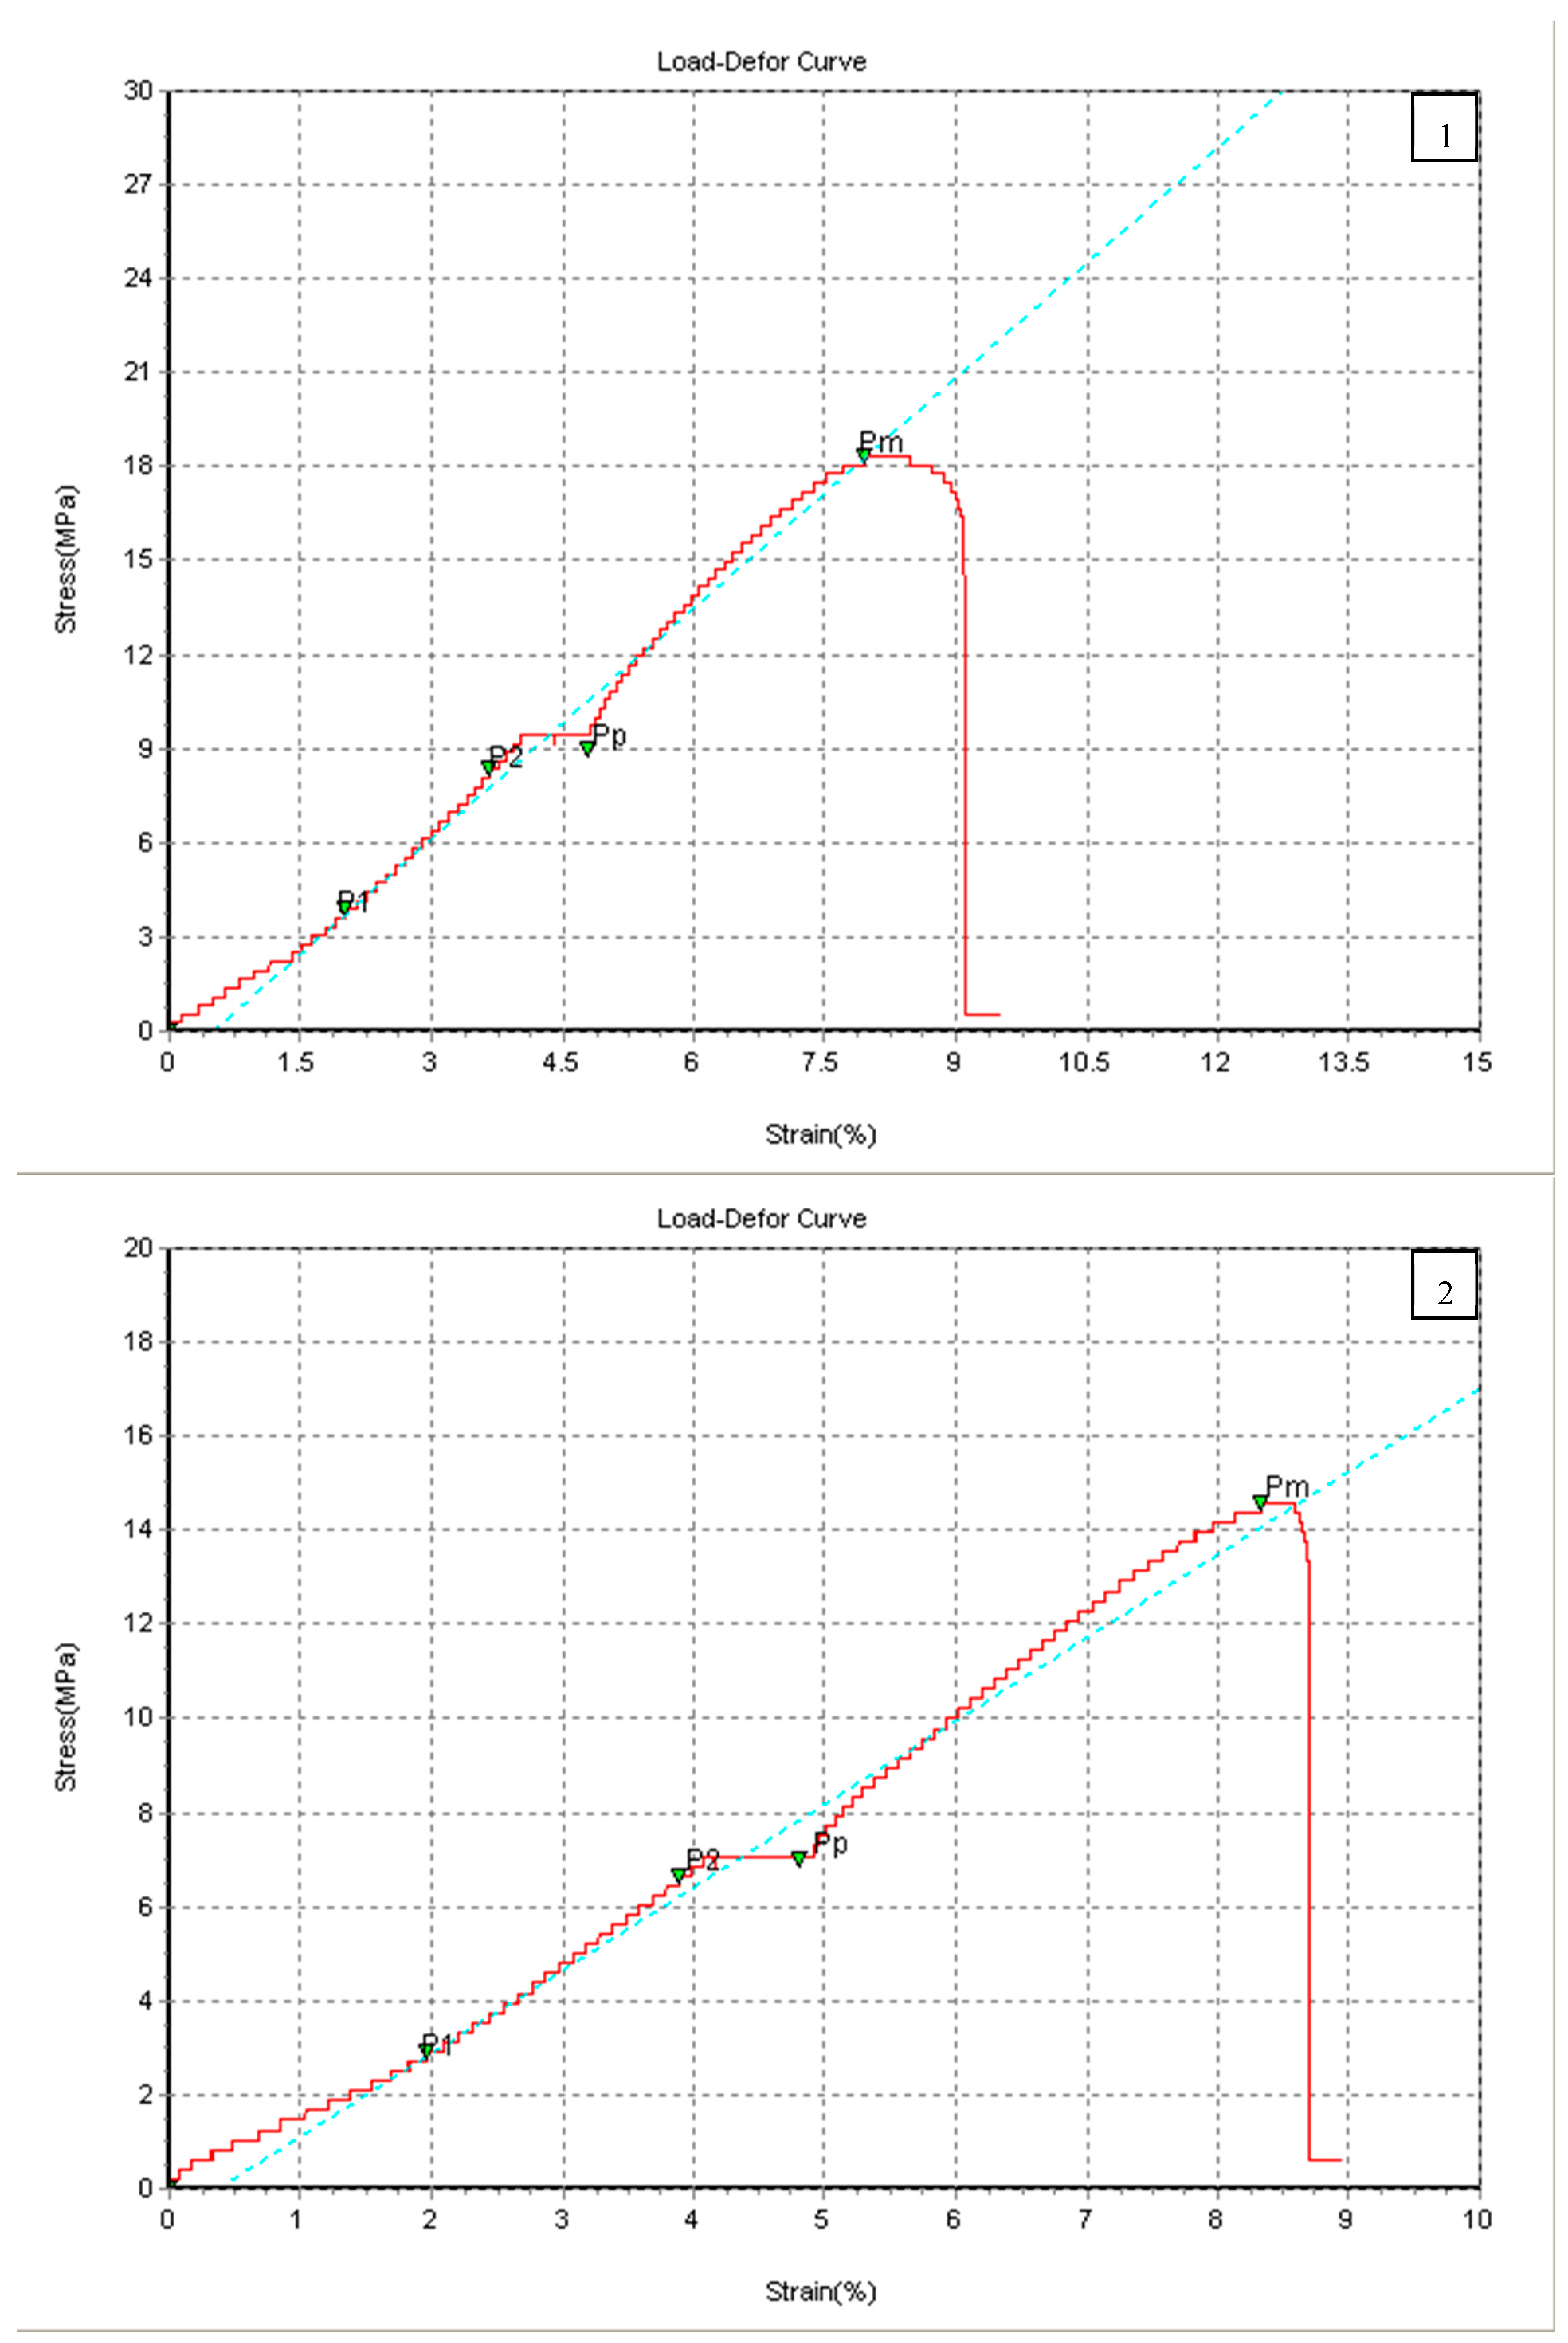
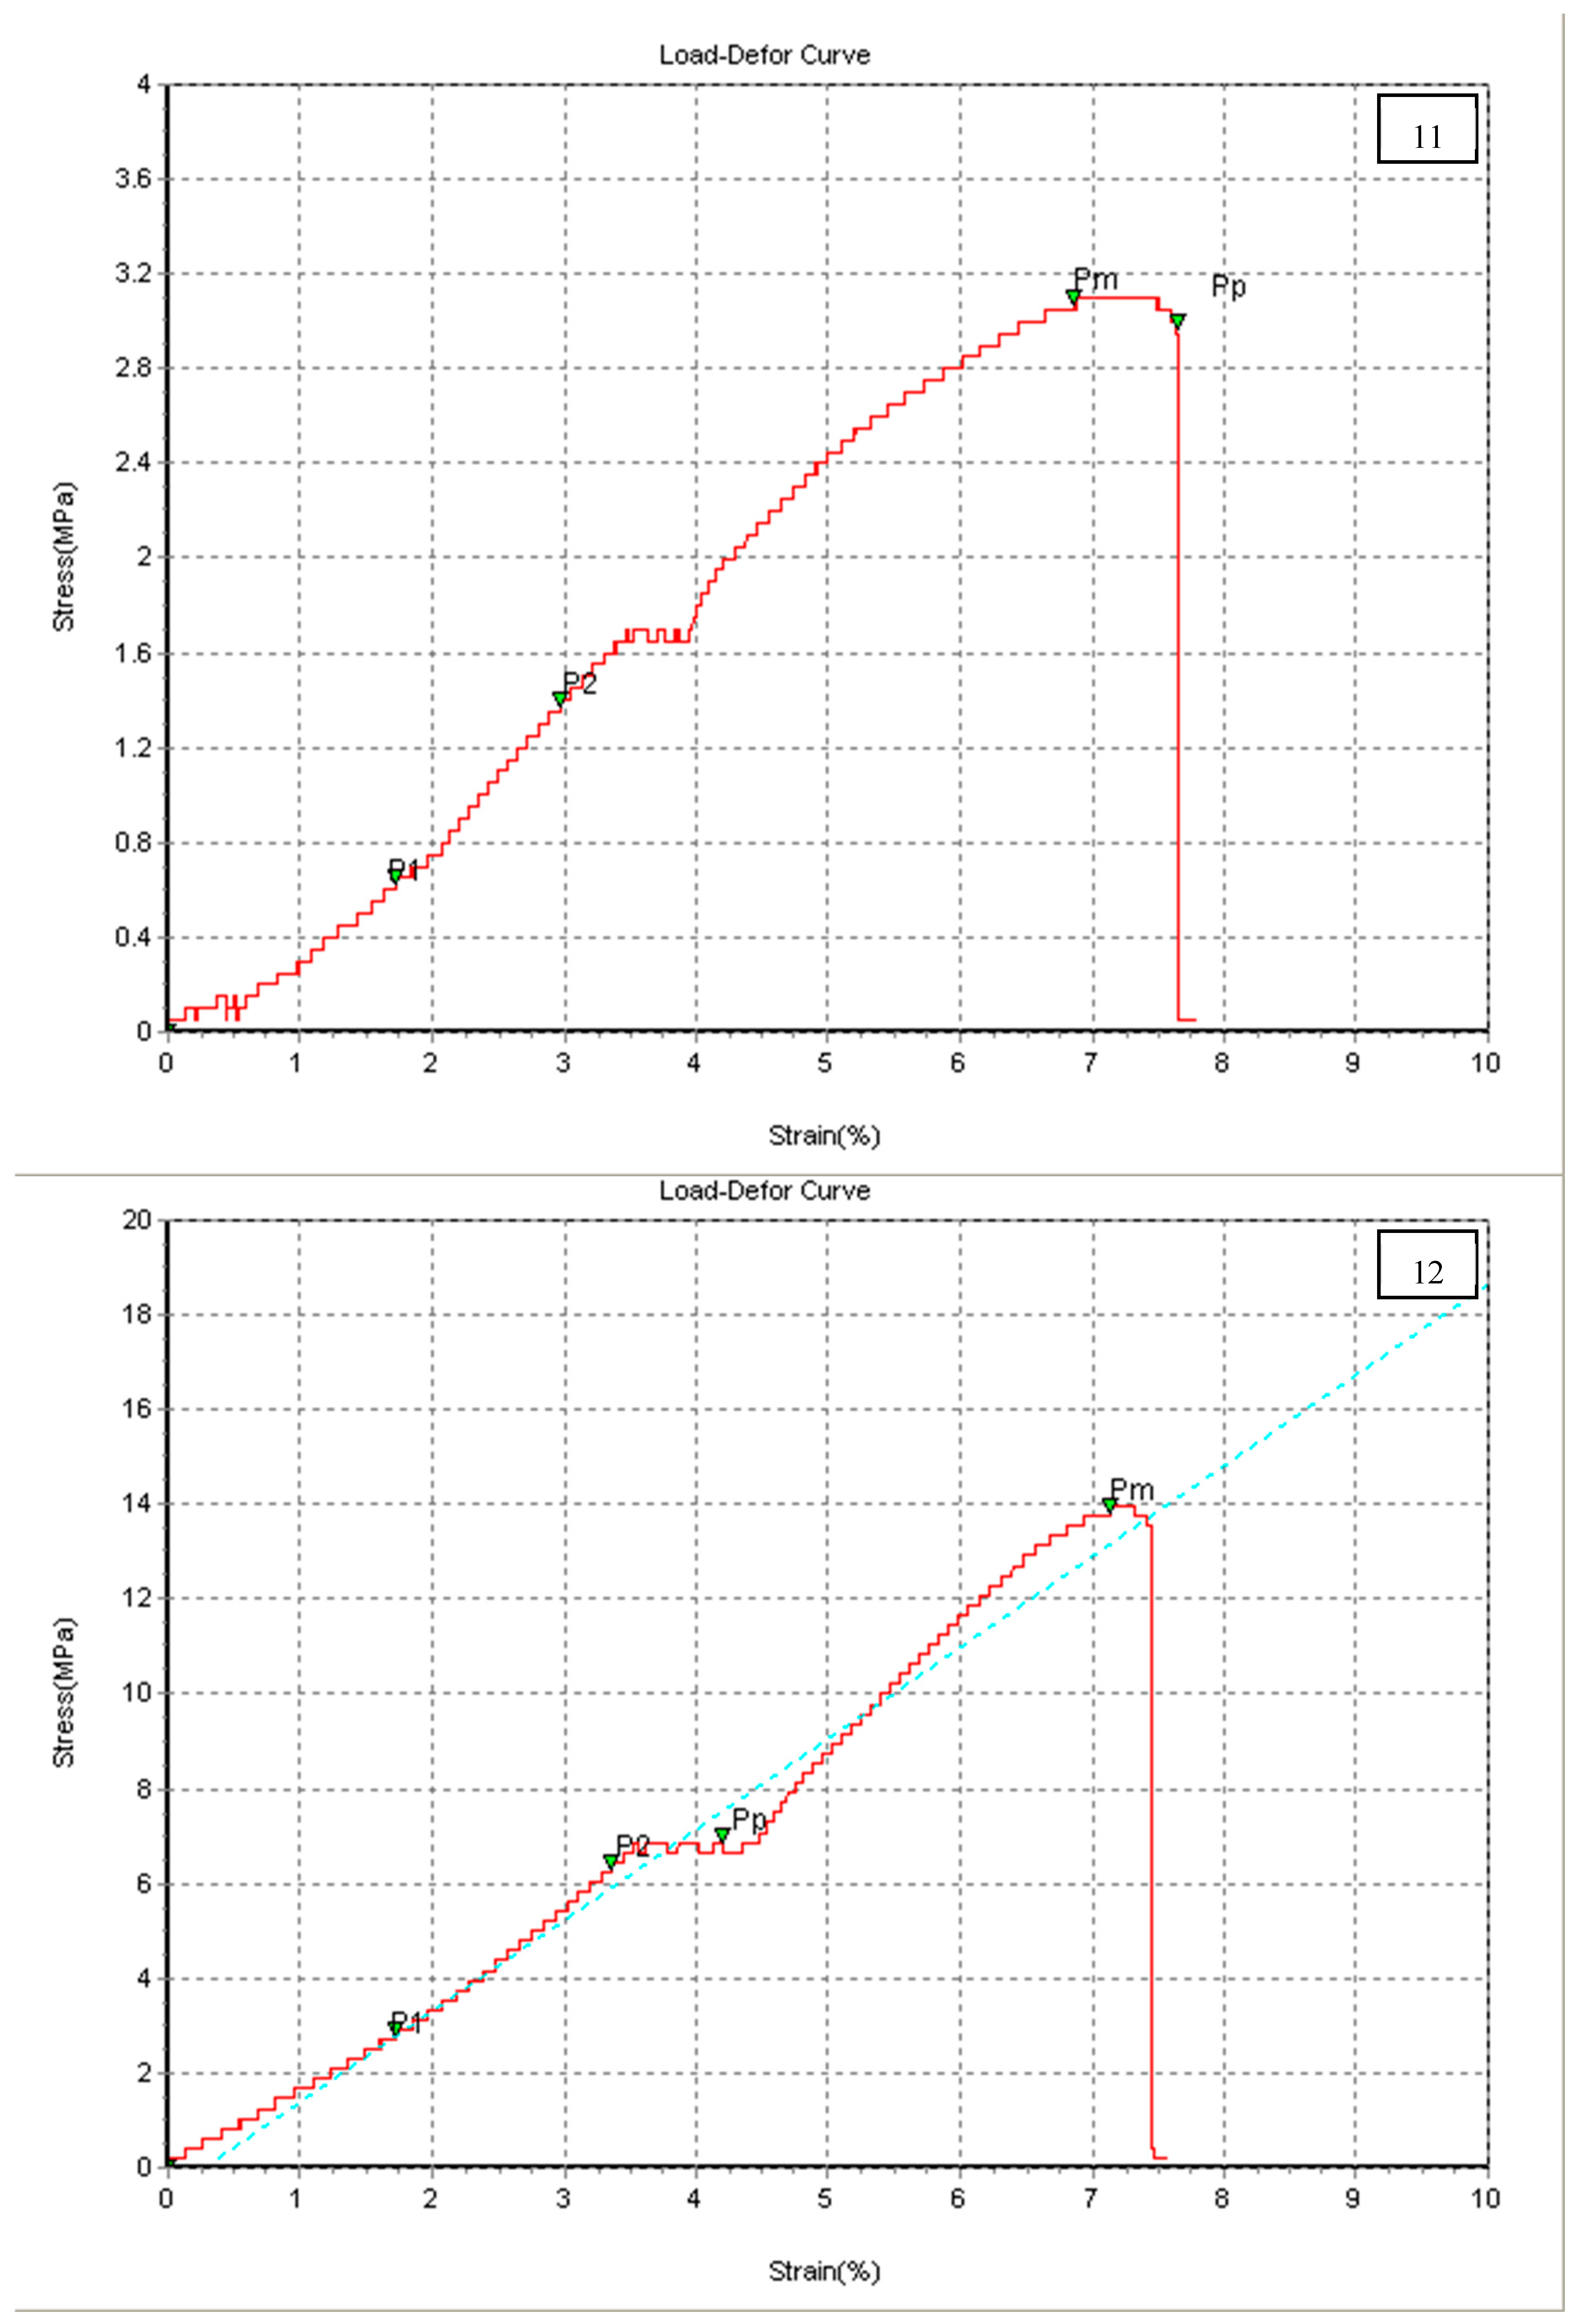
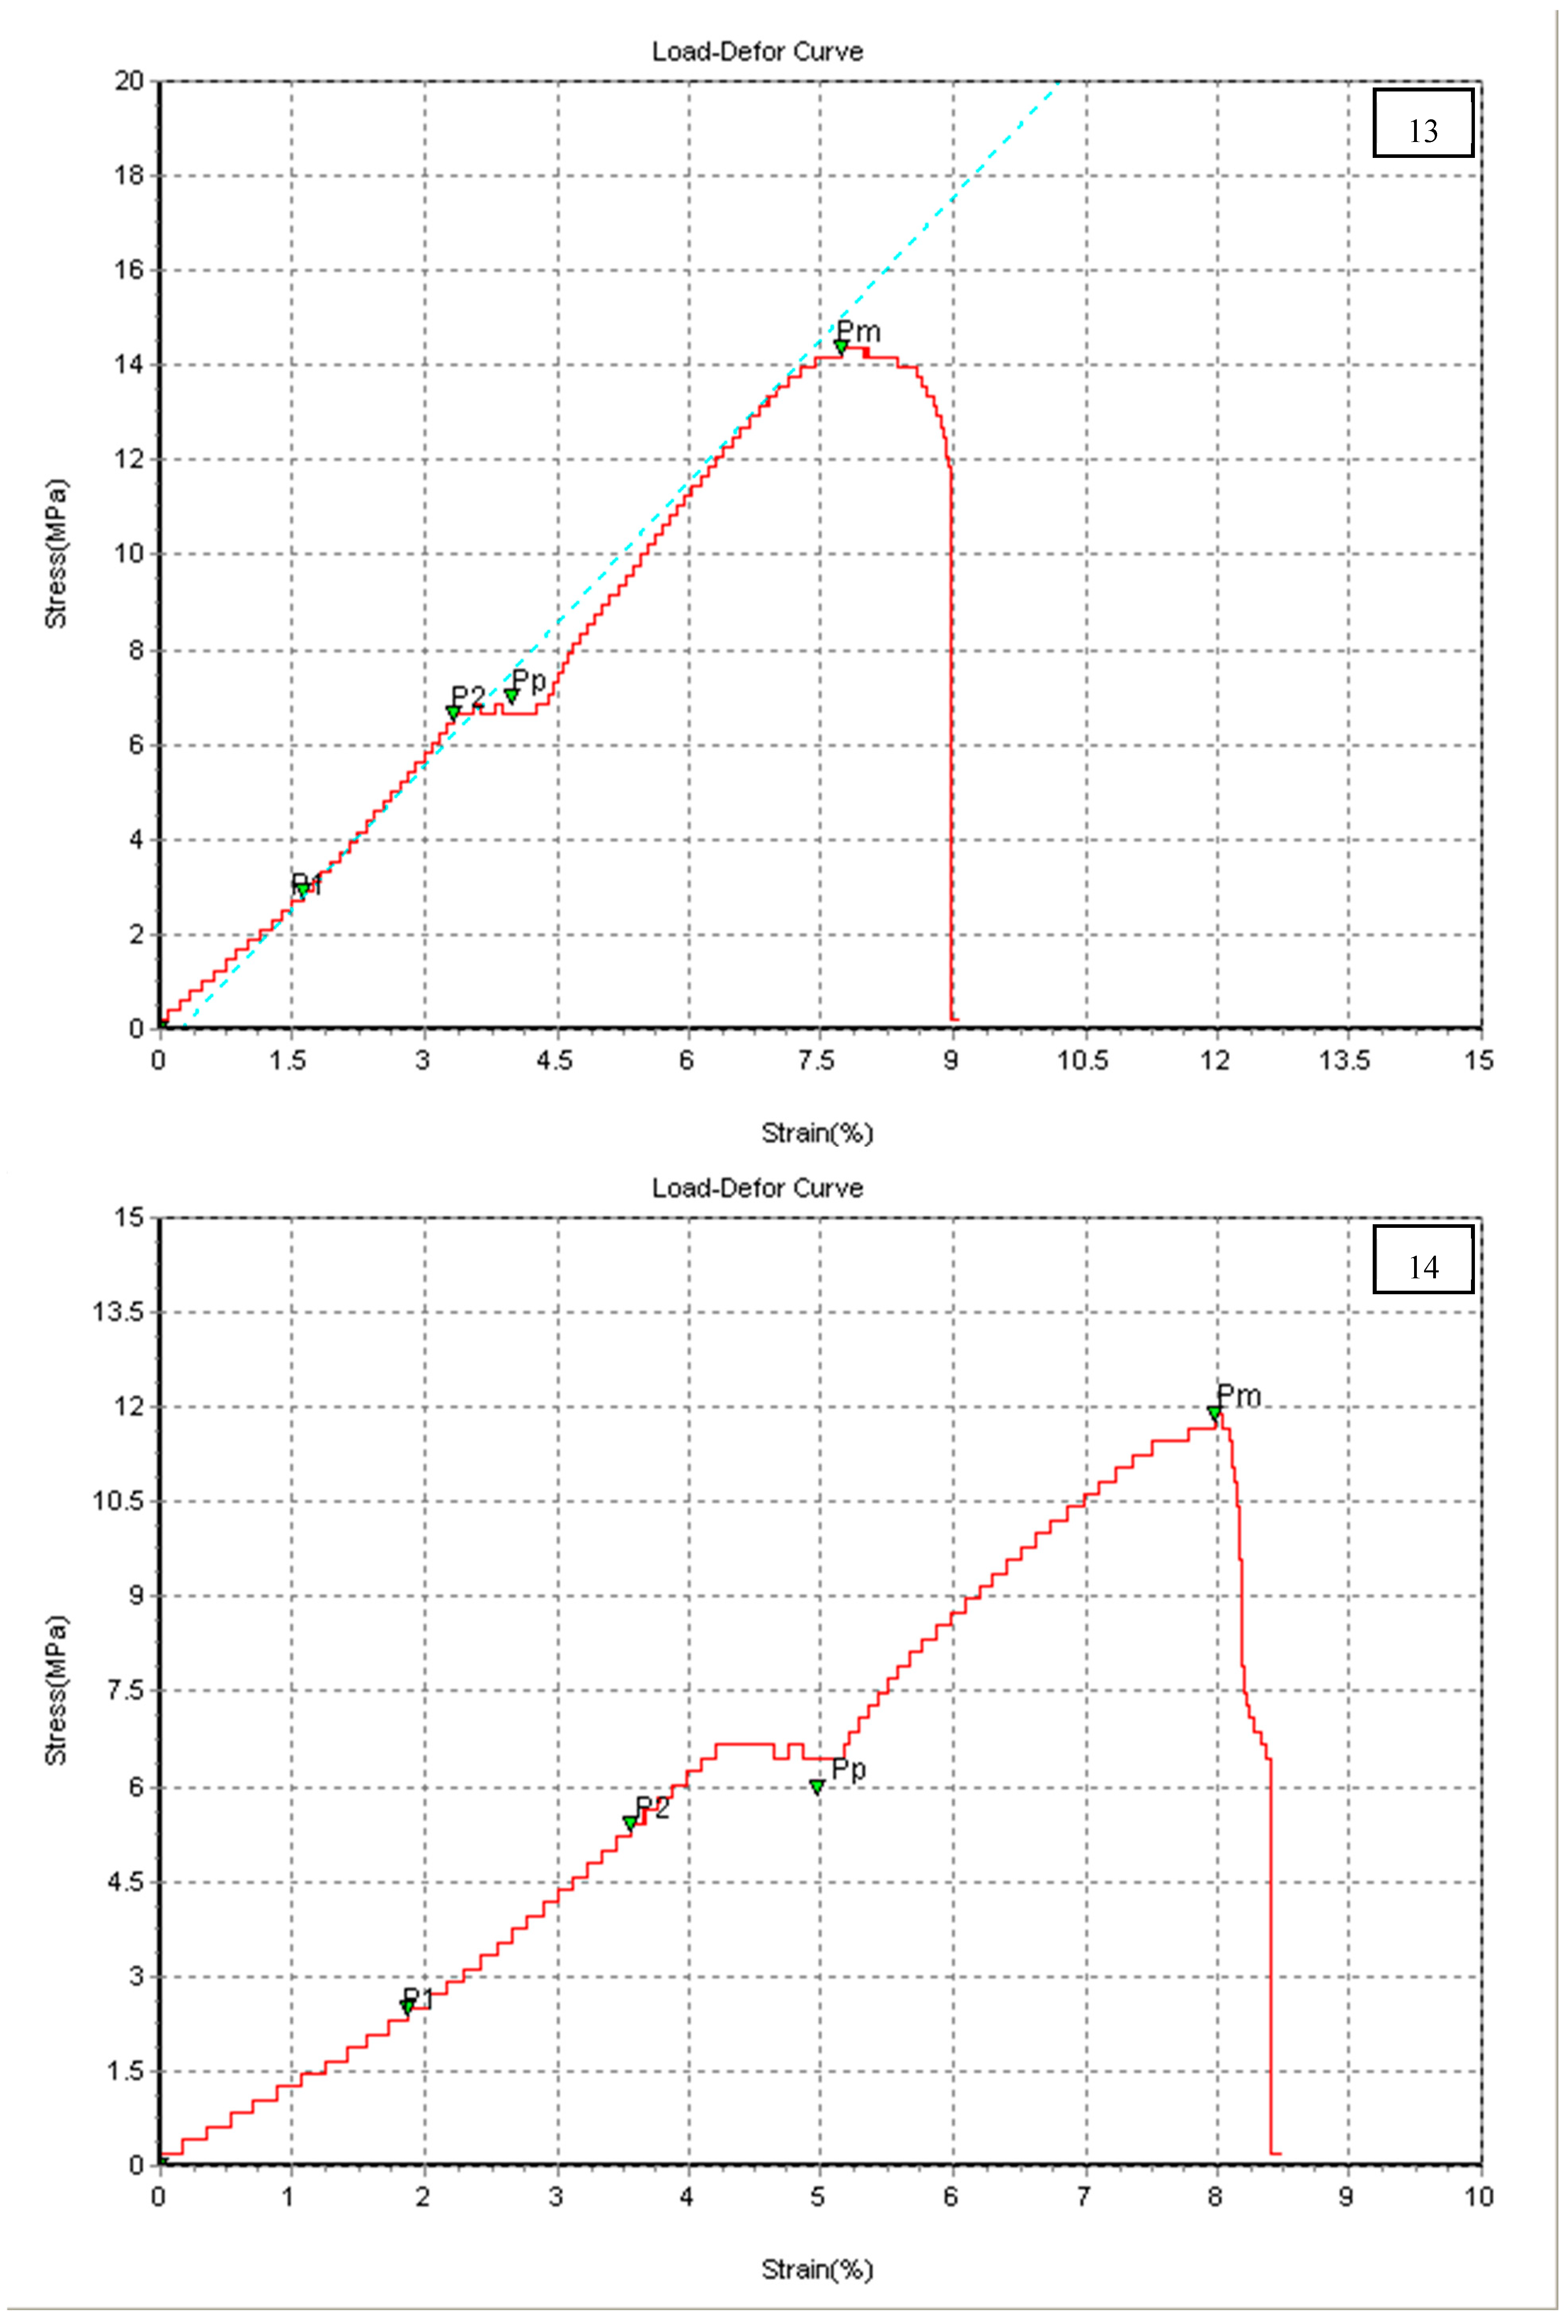
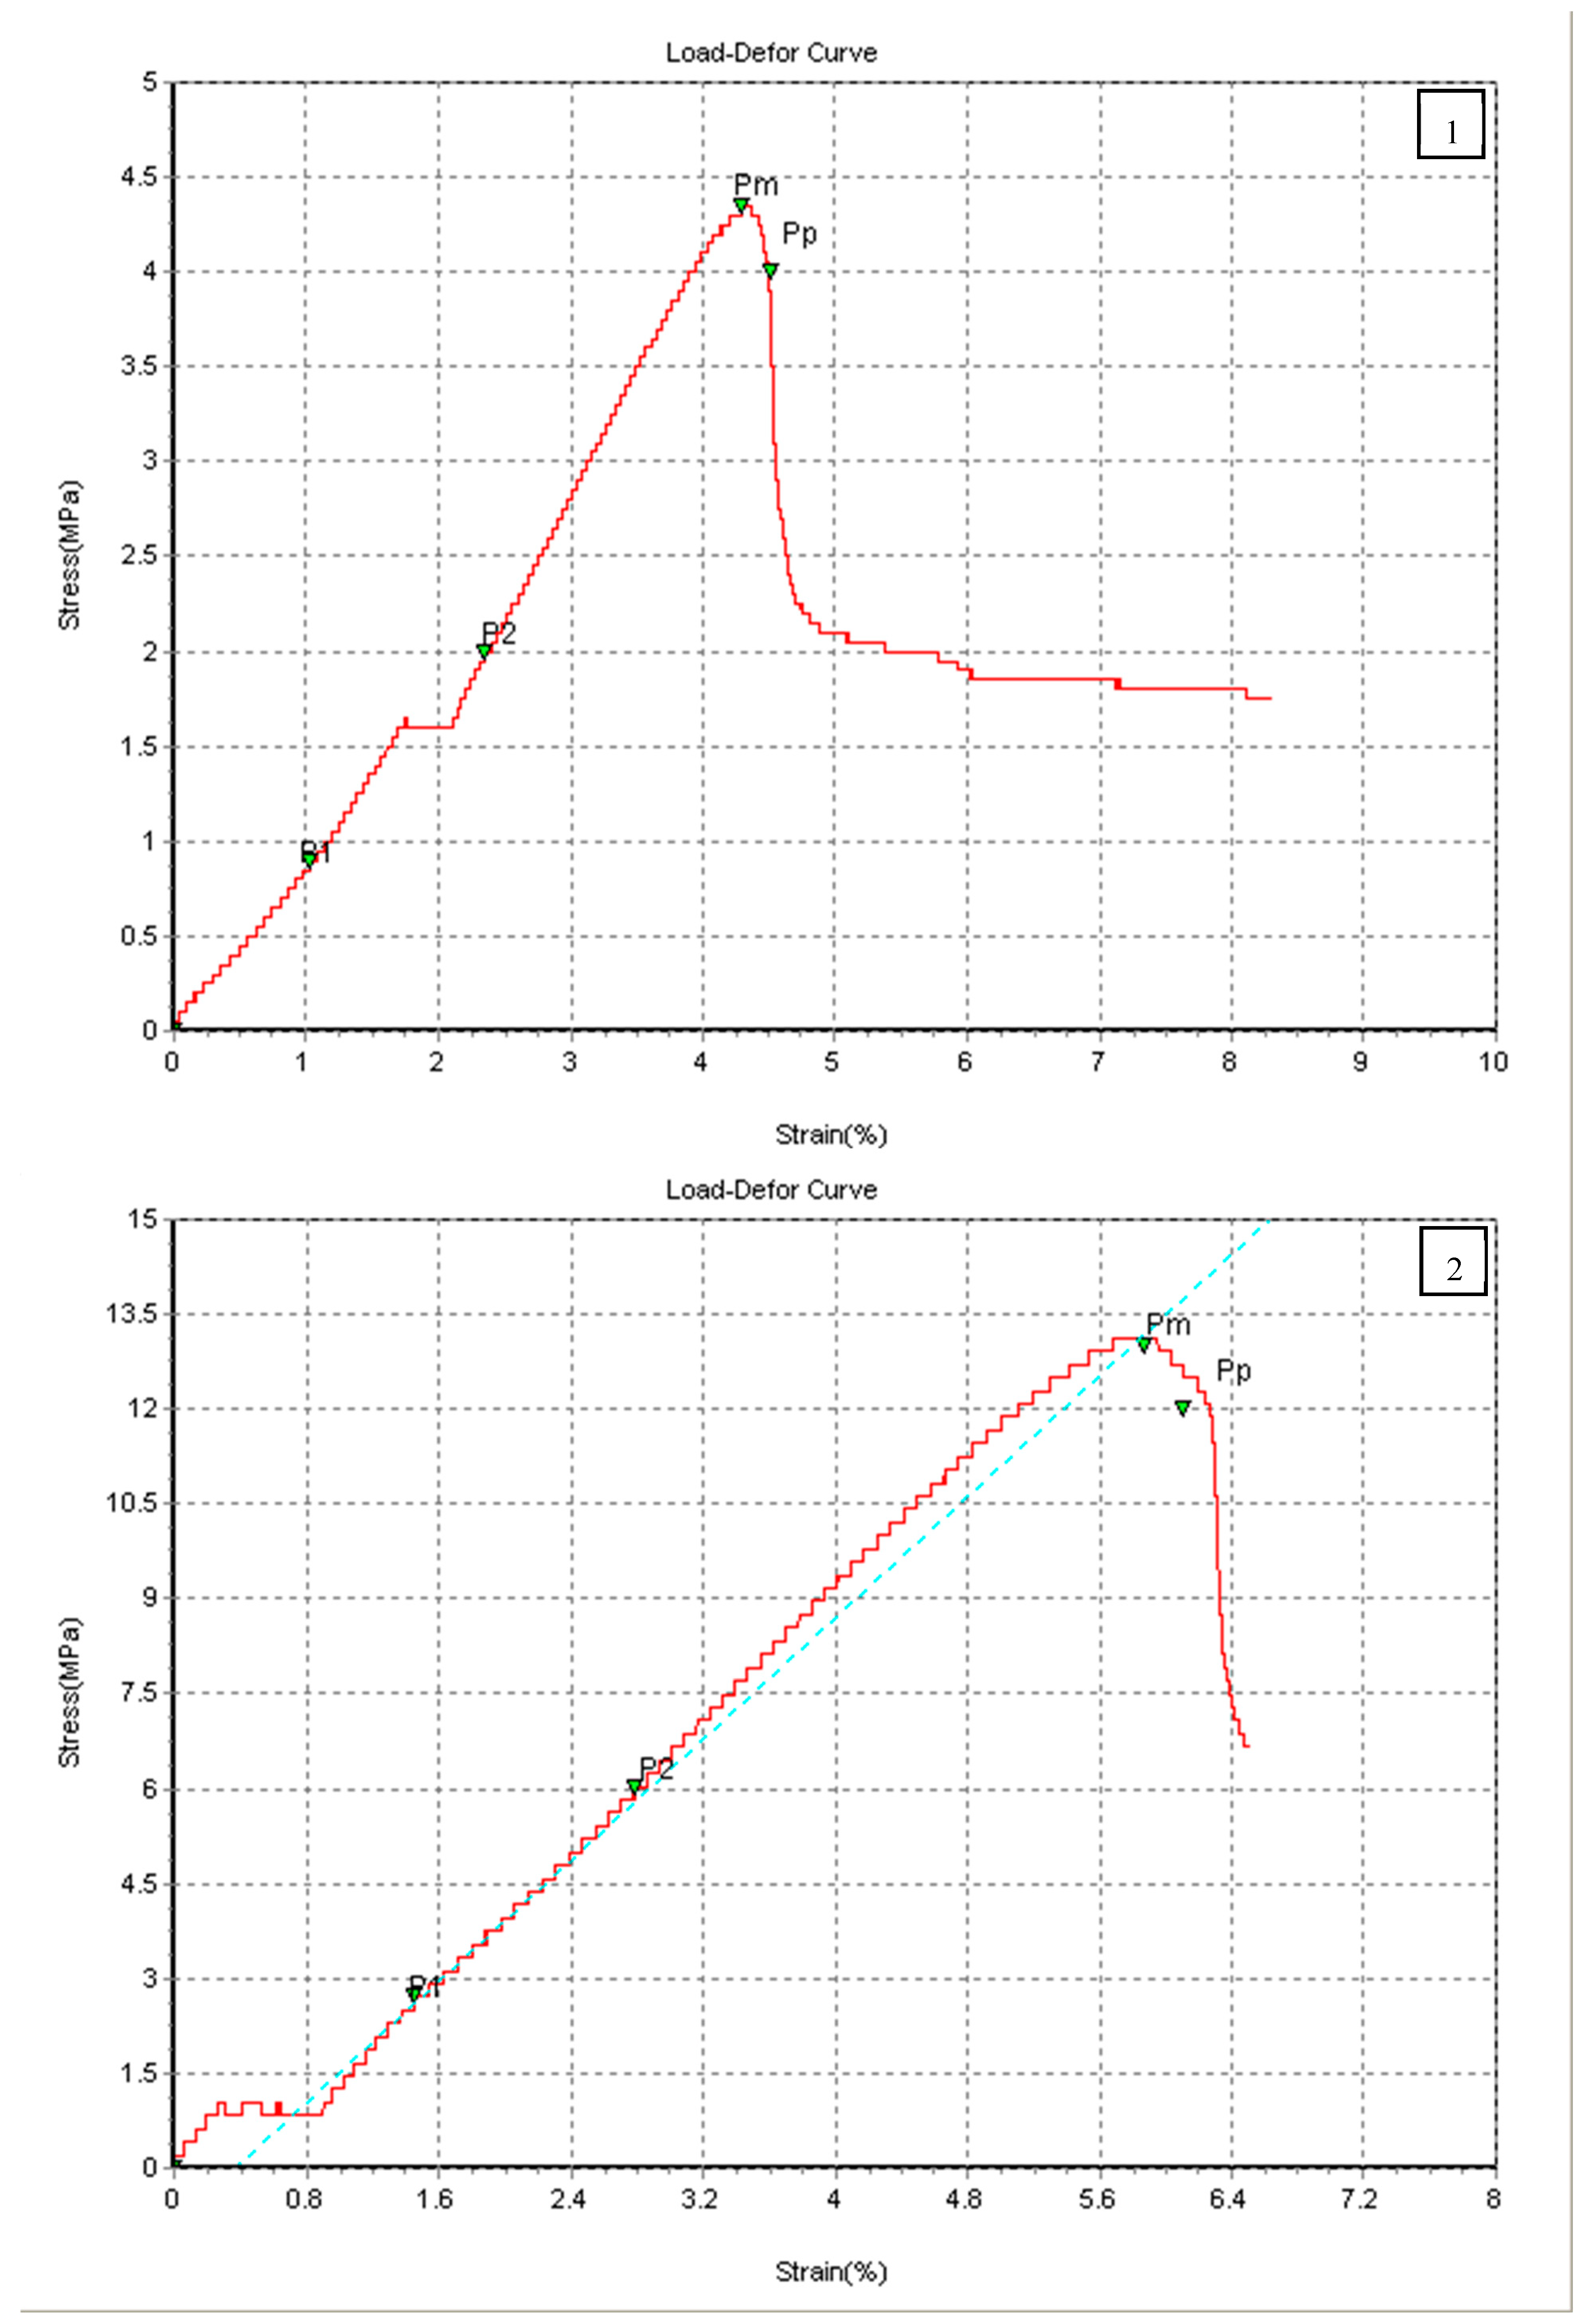
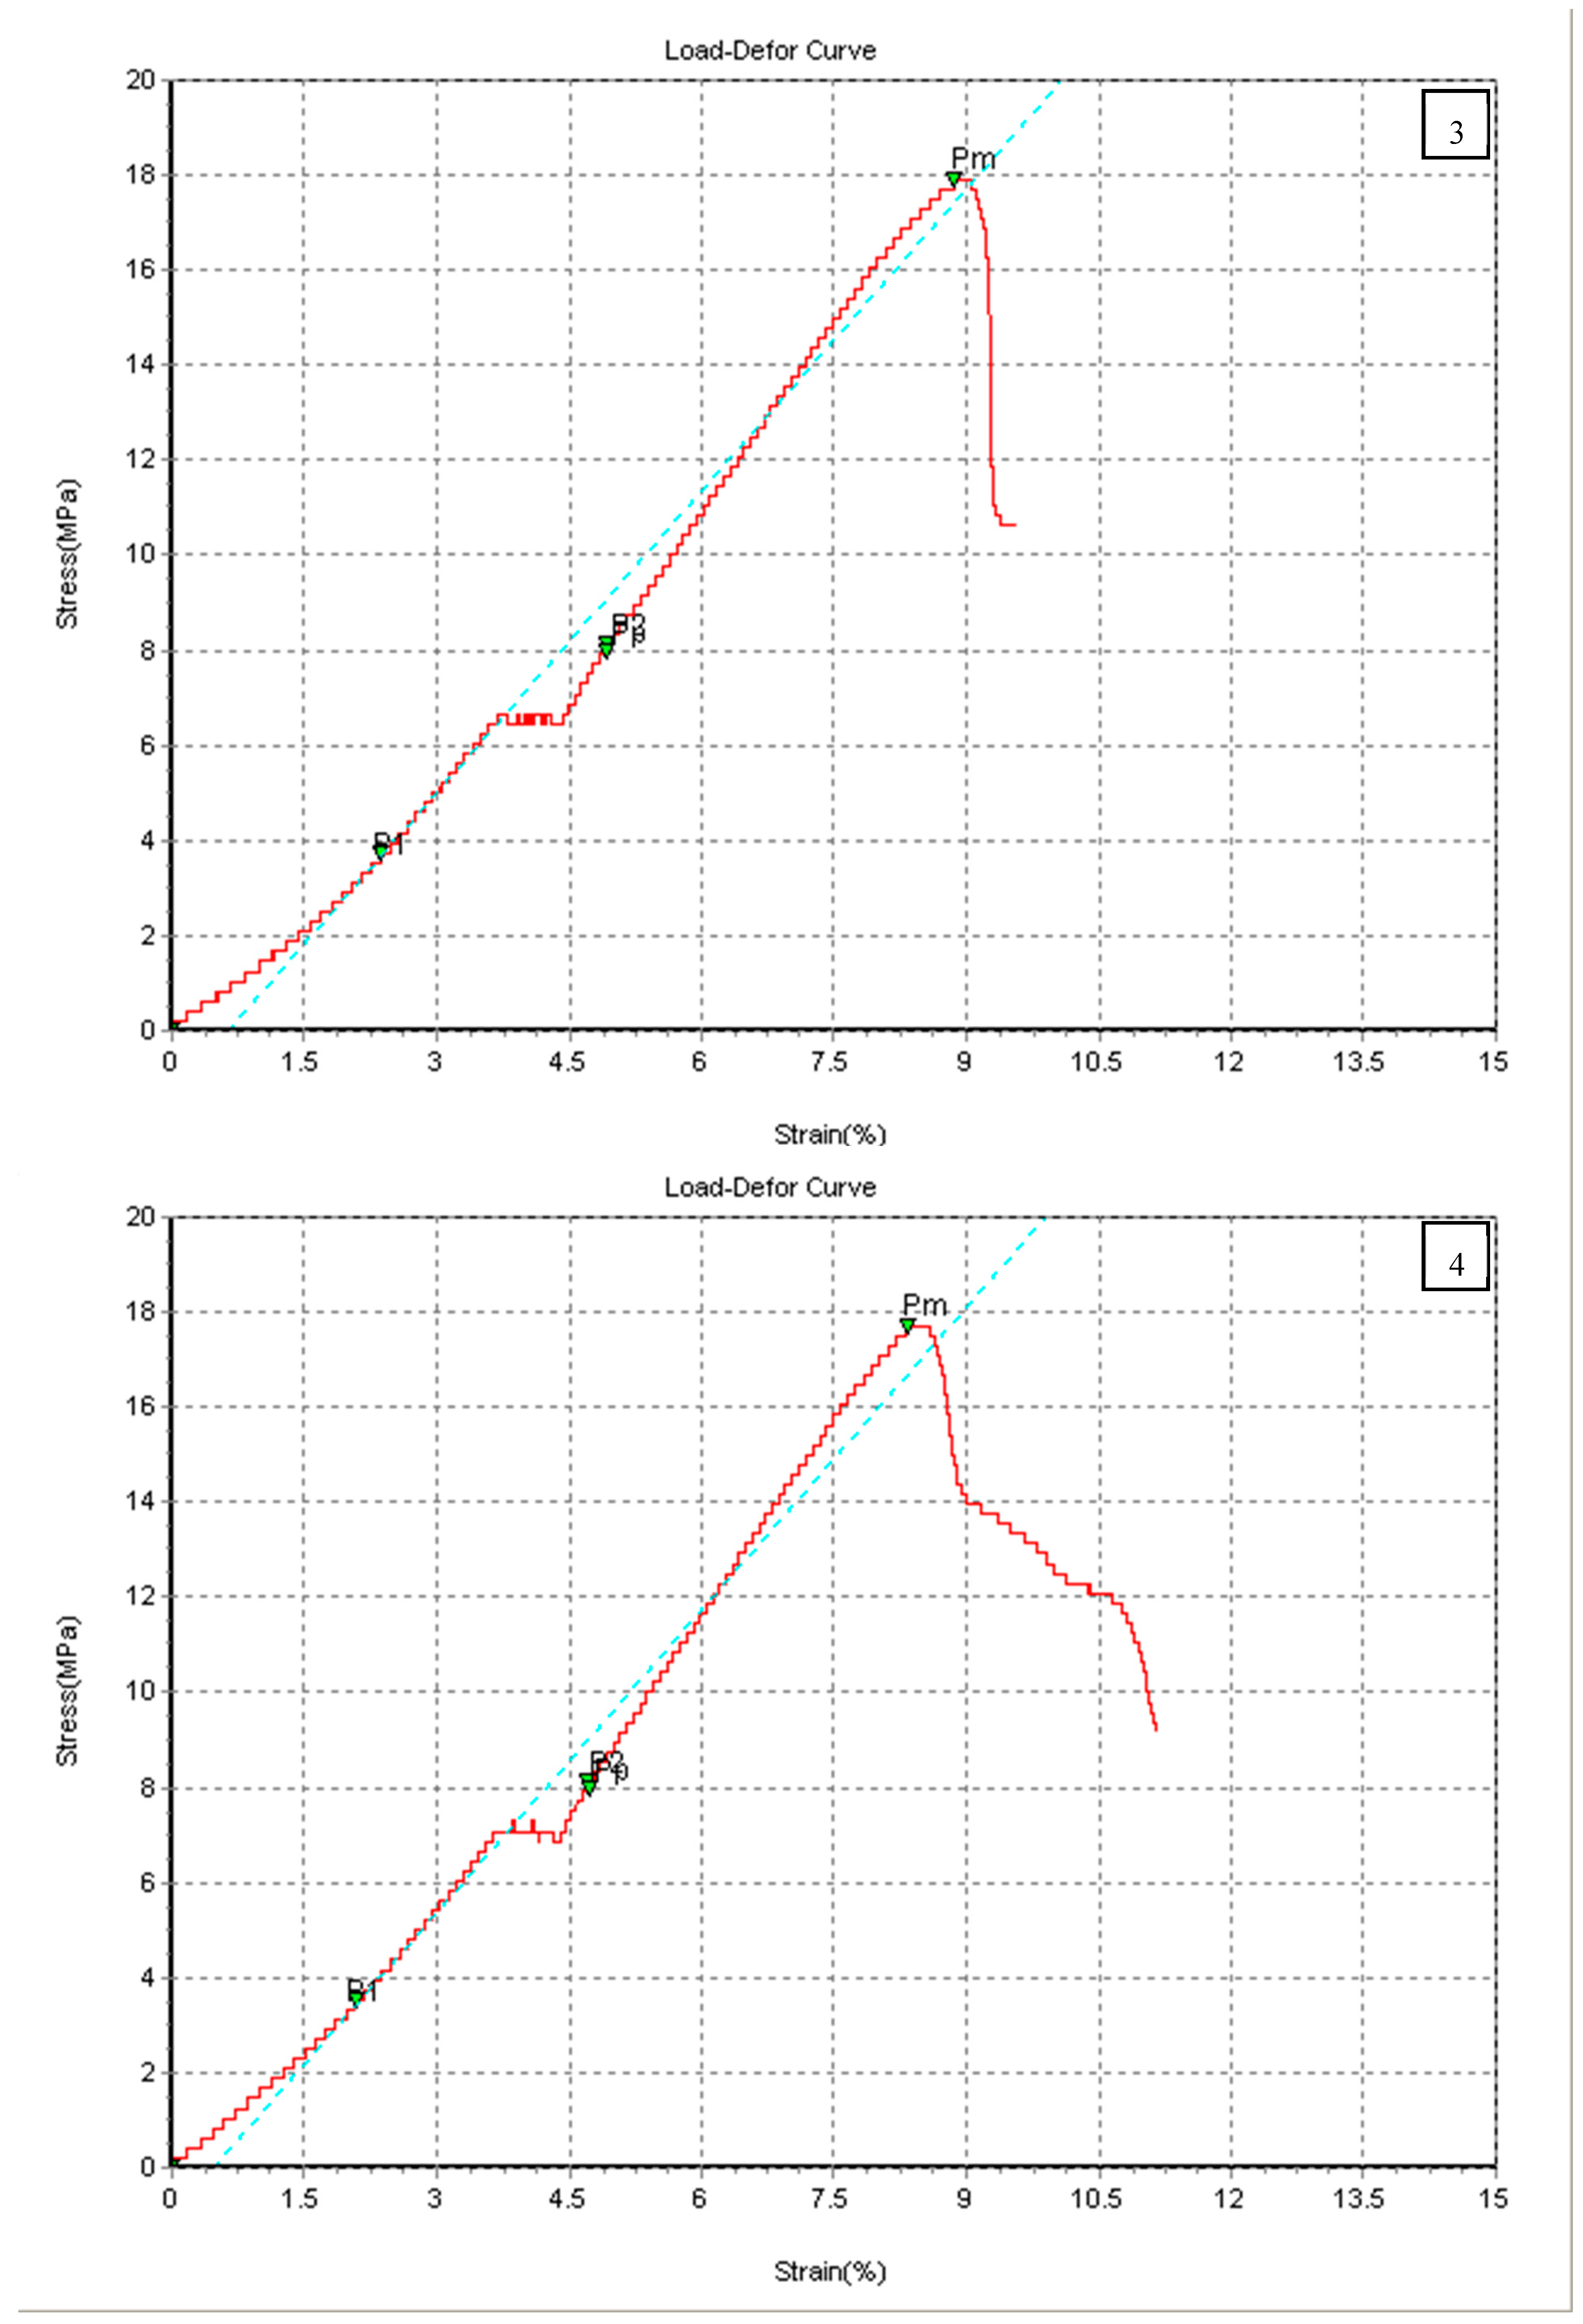
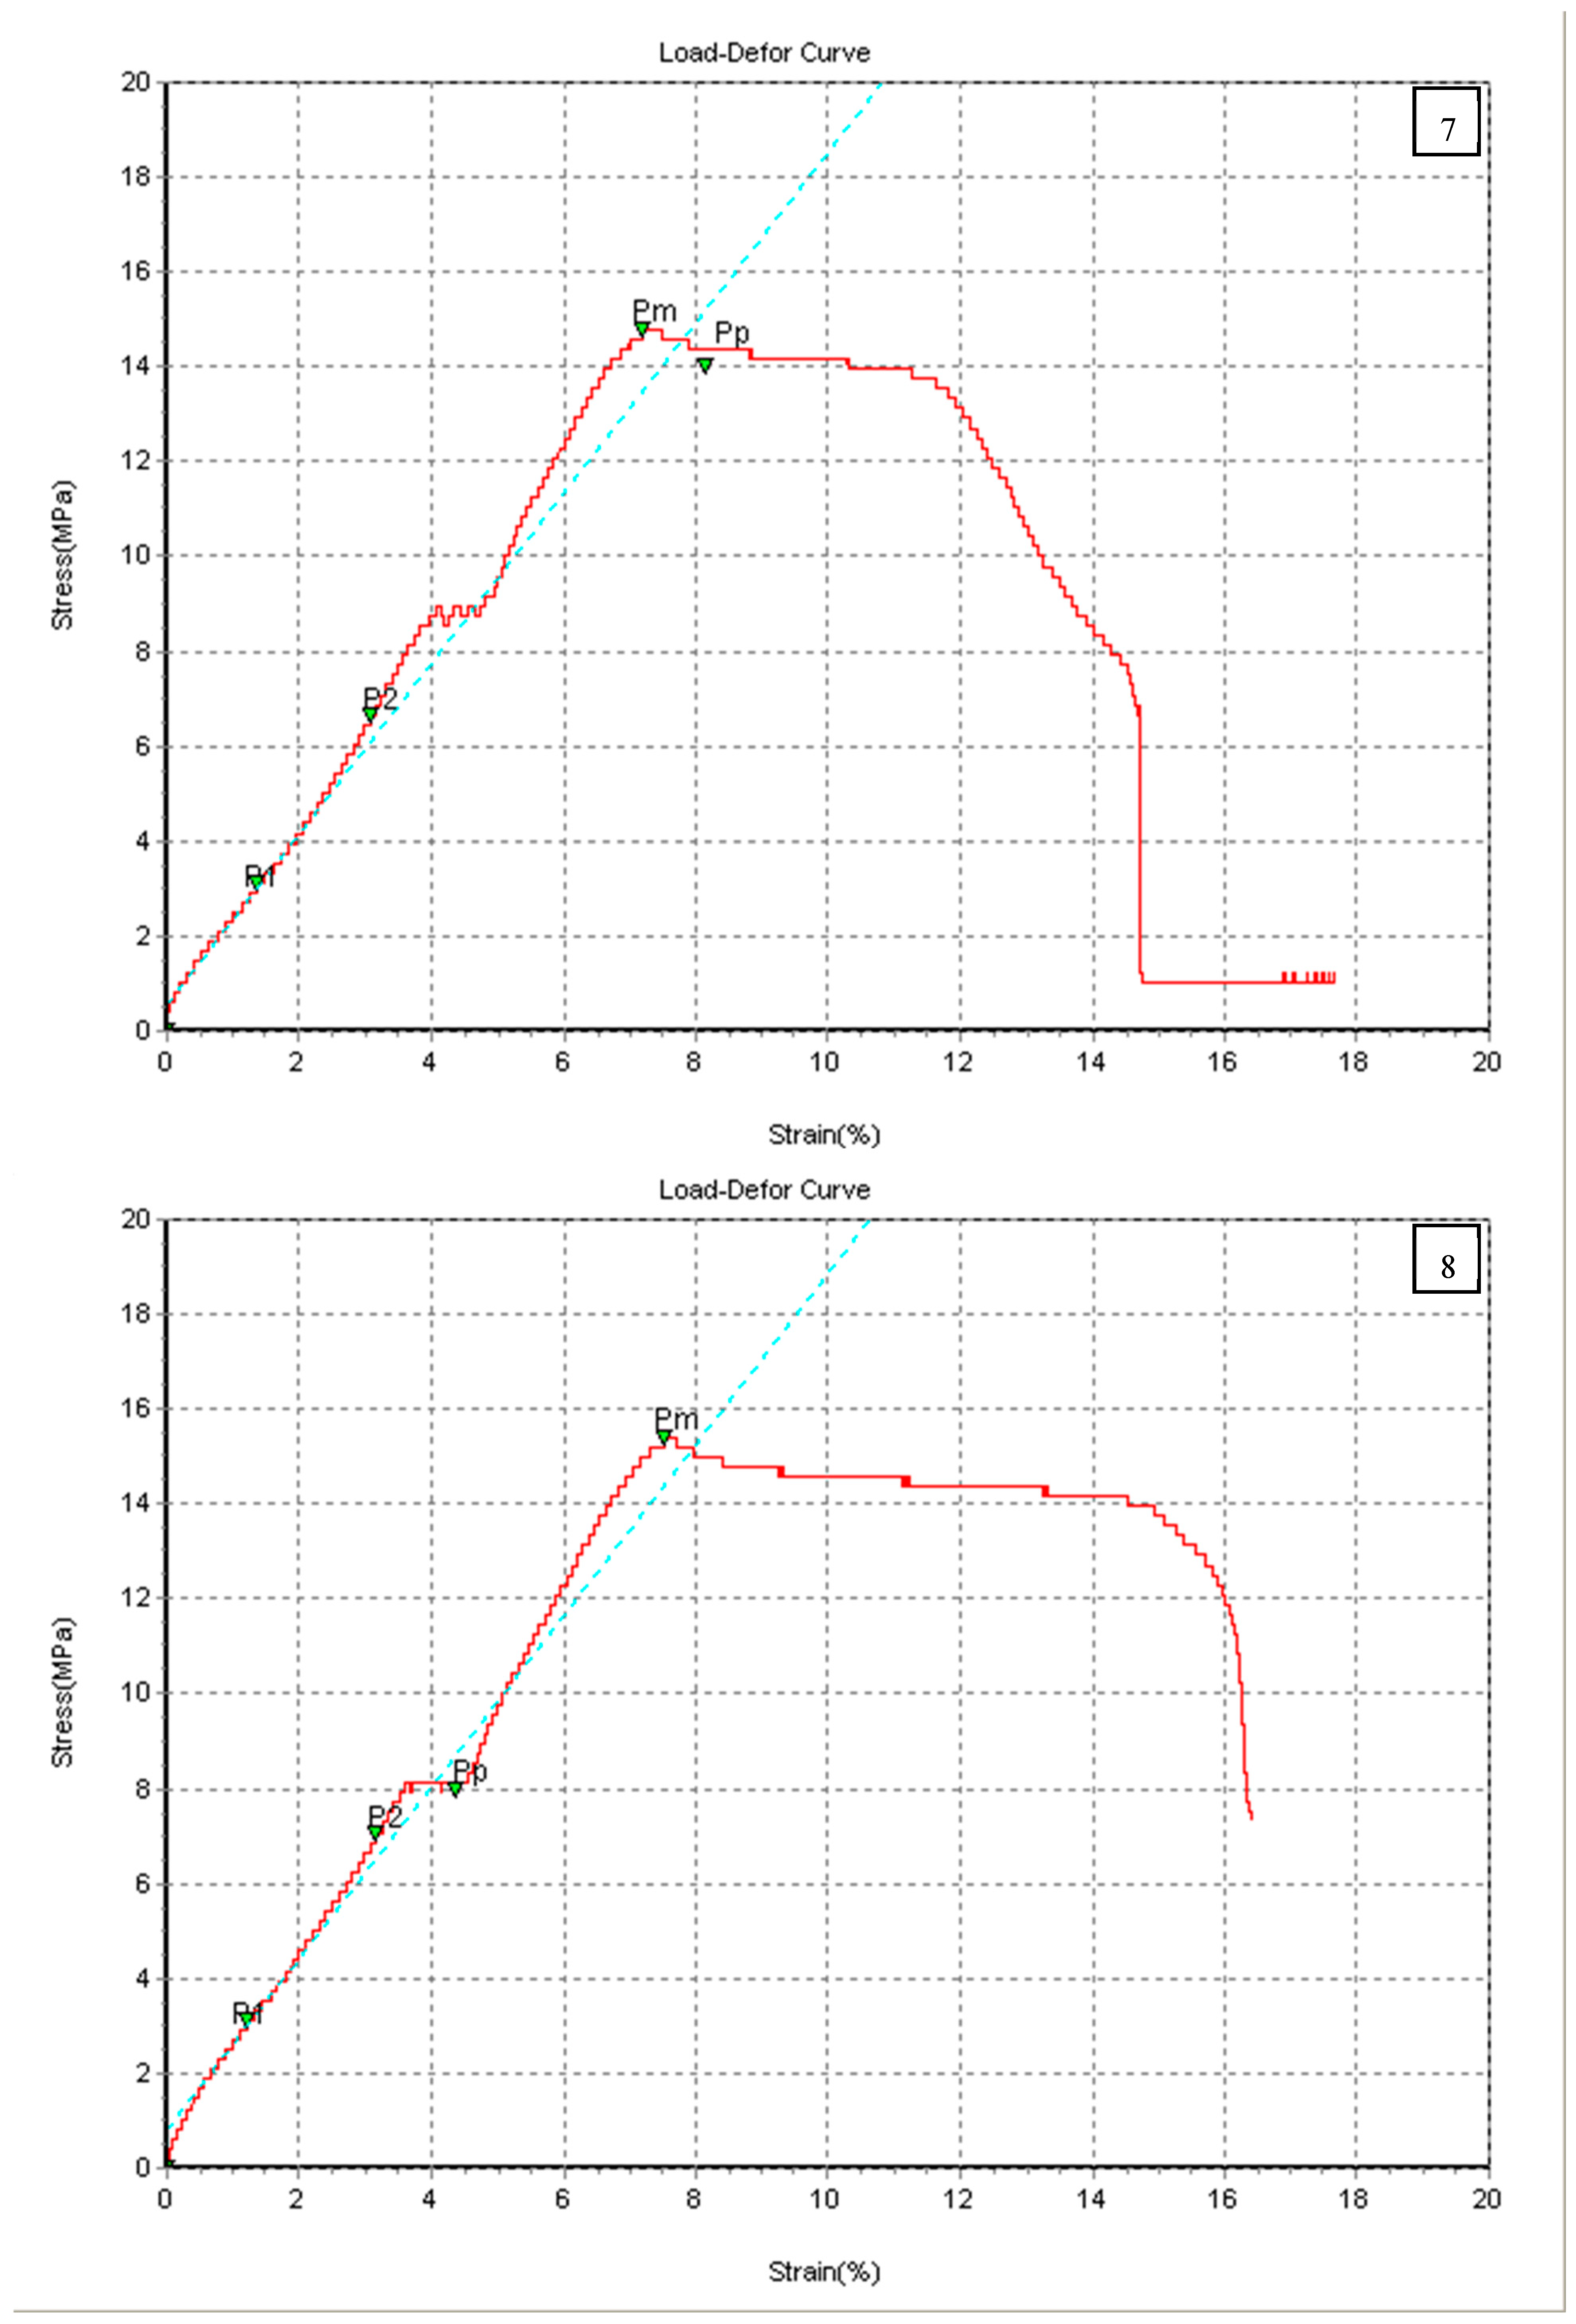
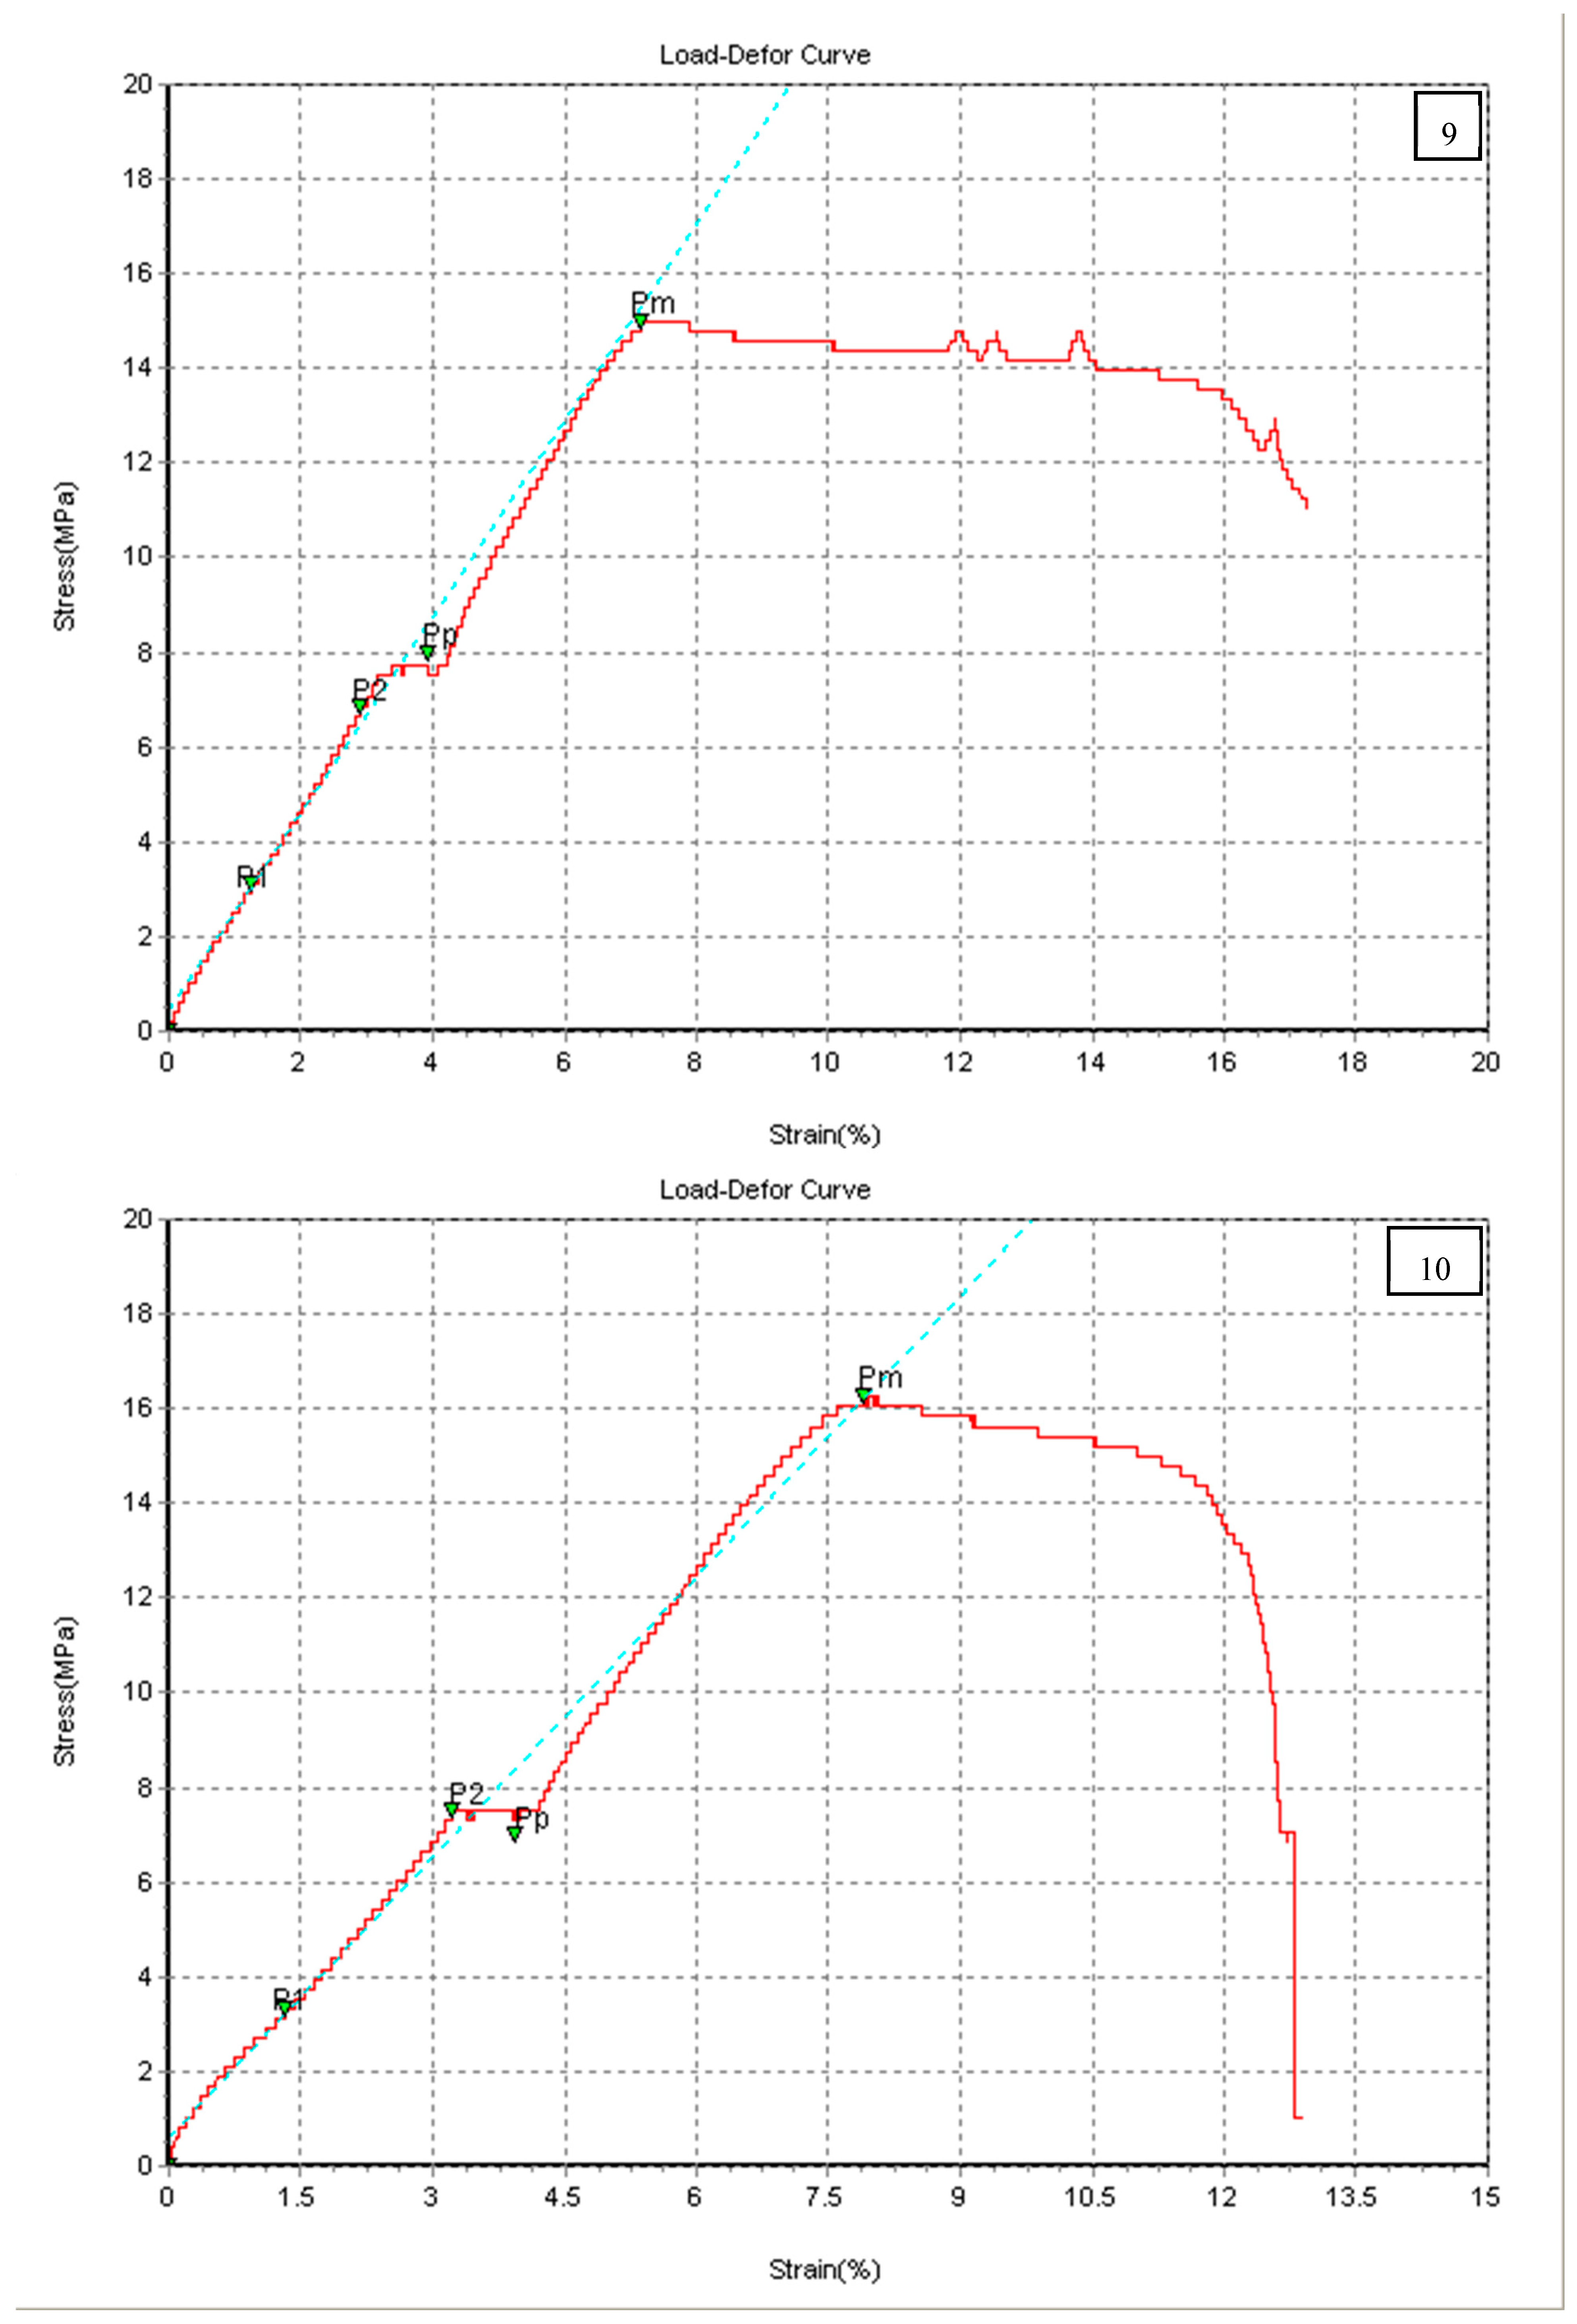
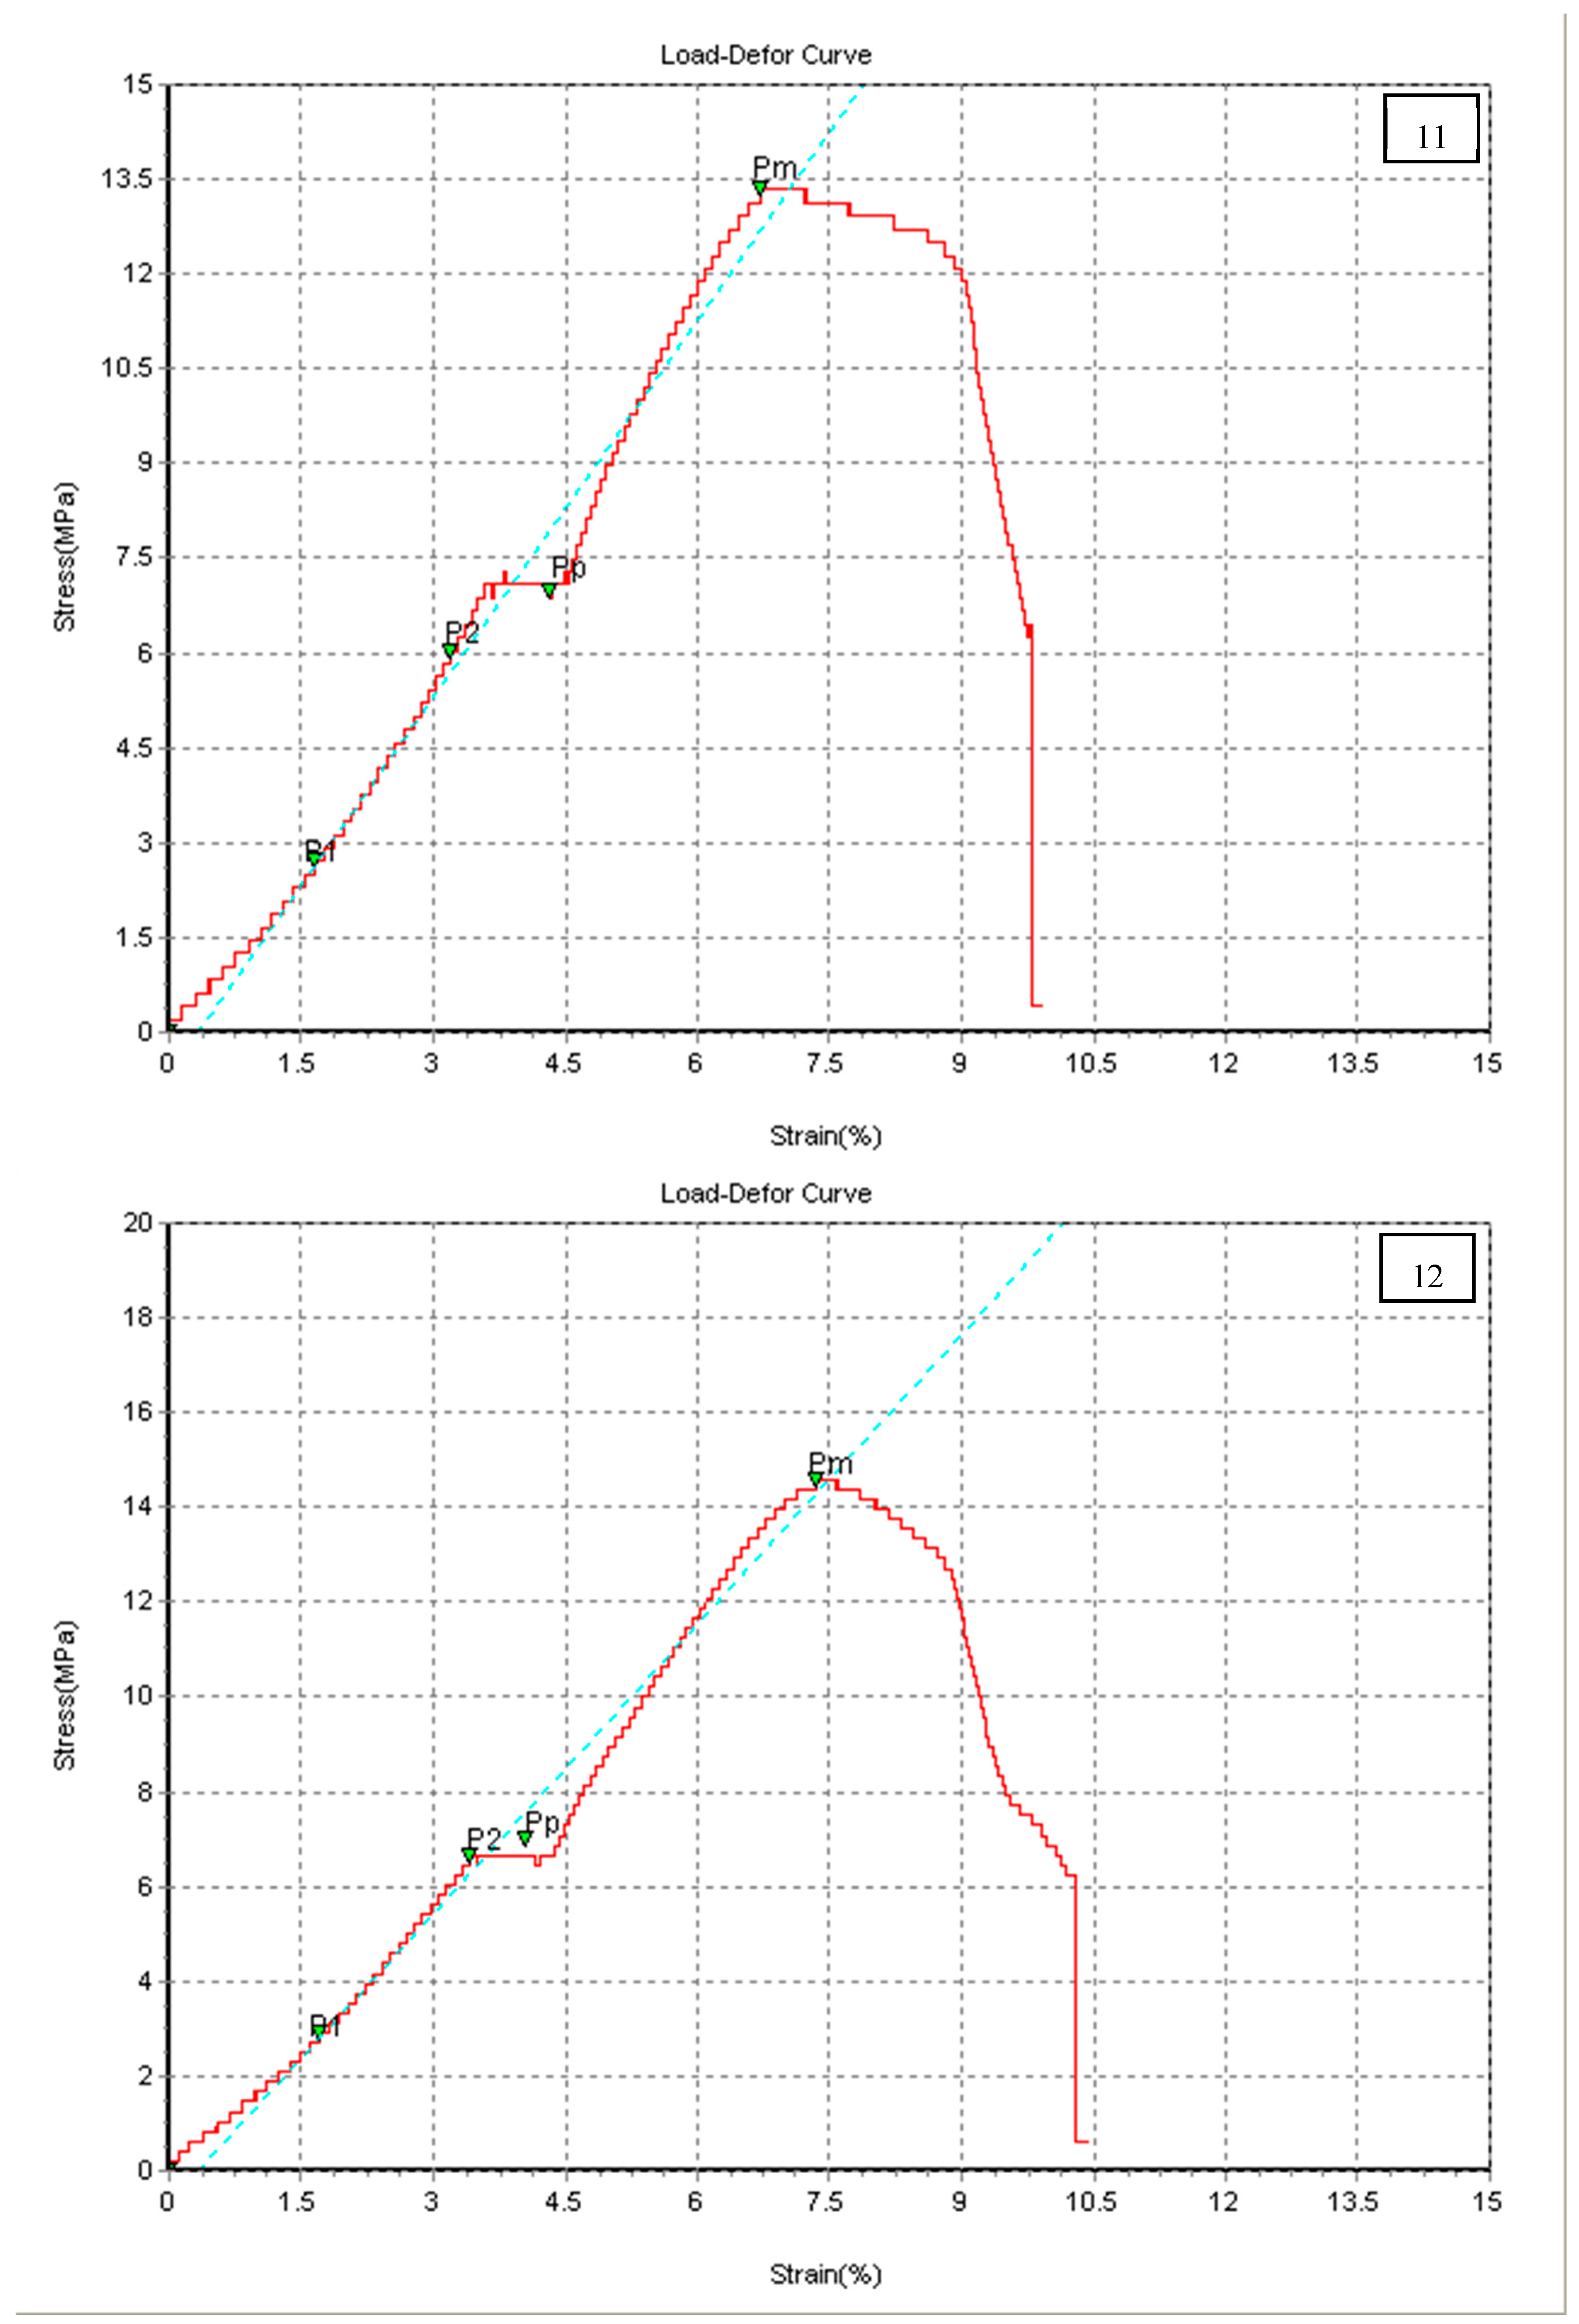
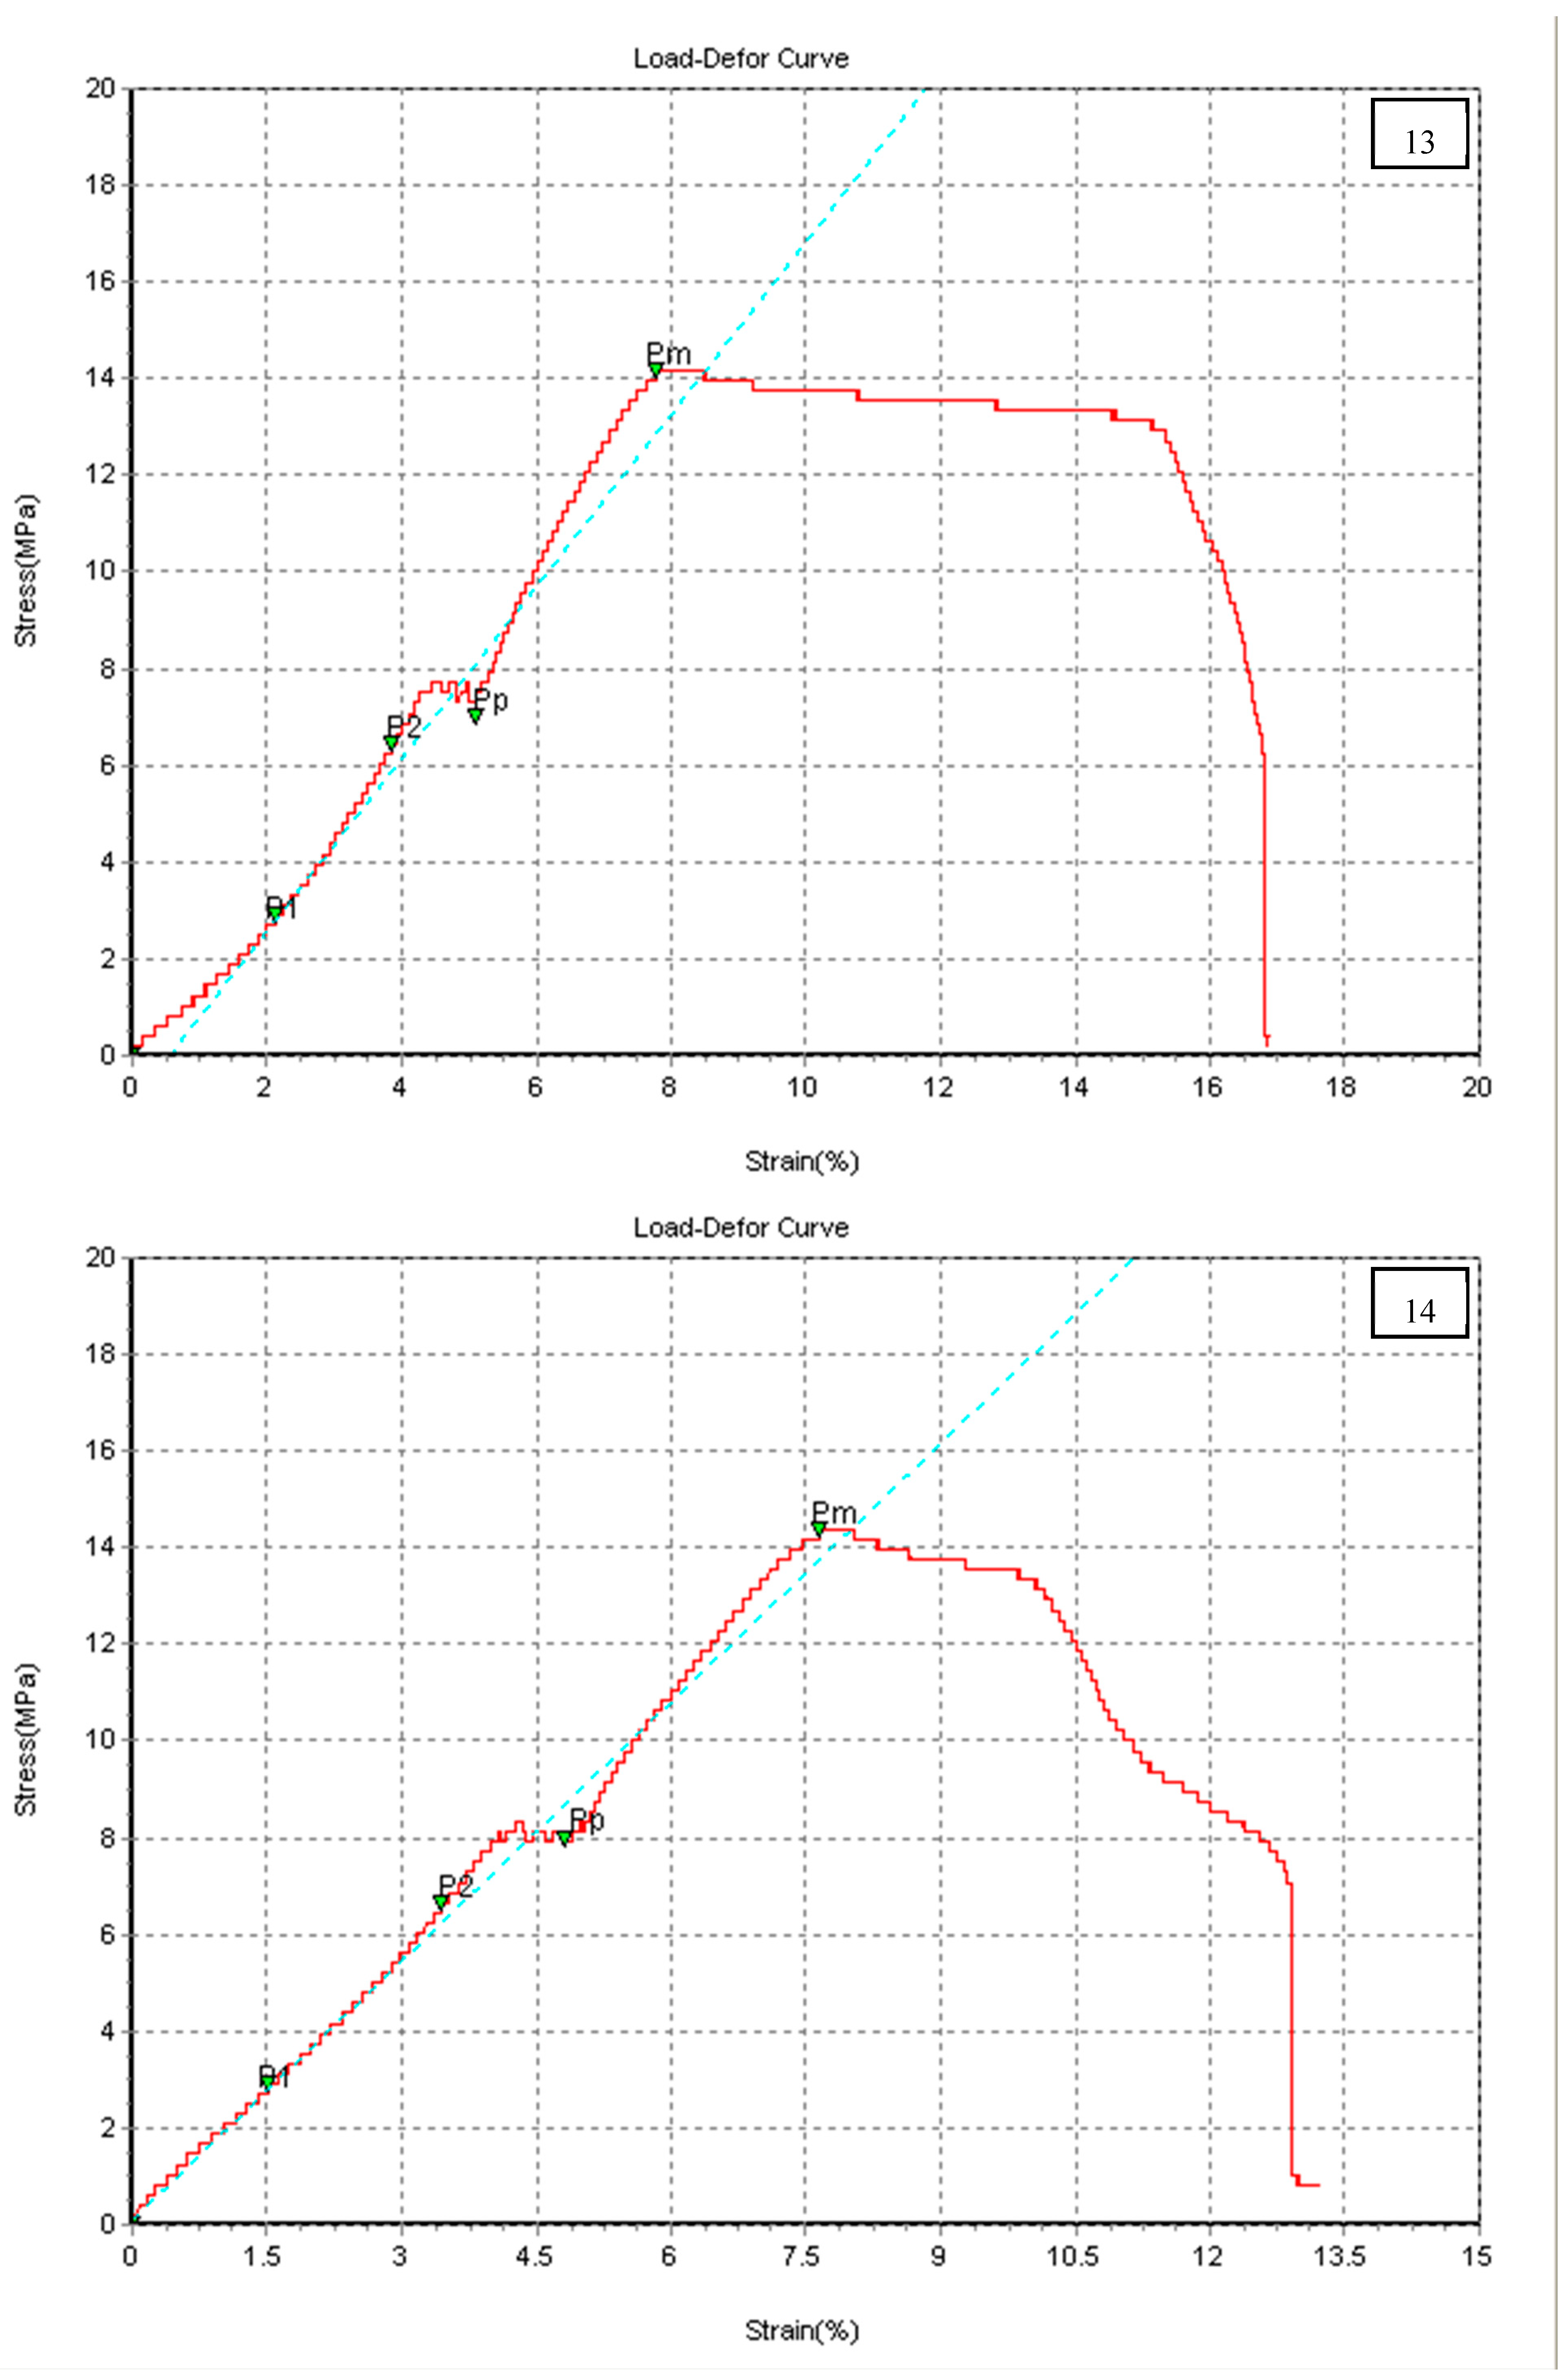
The mechanical properties of the 3D-printed specimens were measured by carrying out a tensile test using the universal tensile testing machine. The stress strain curves were constructed for all specimens.
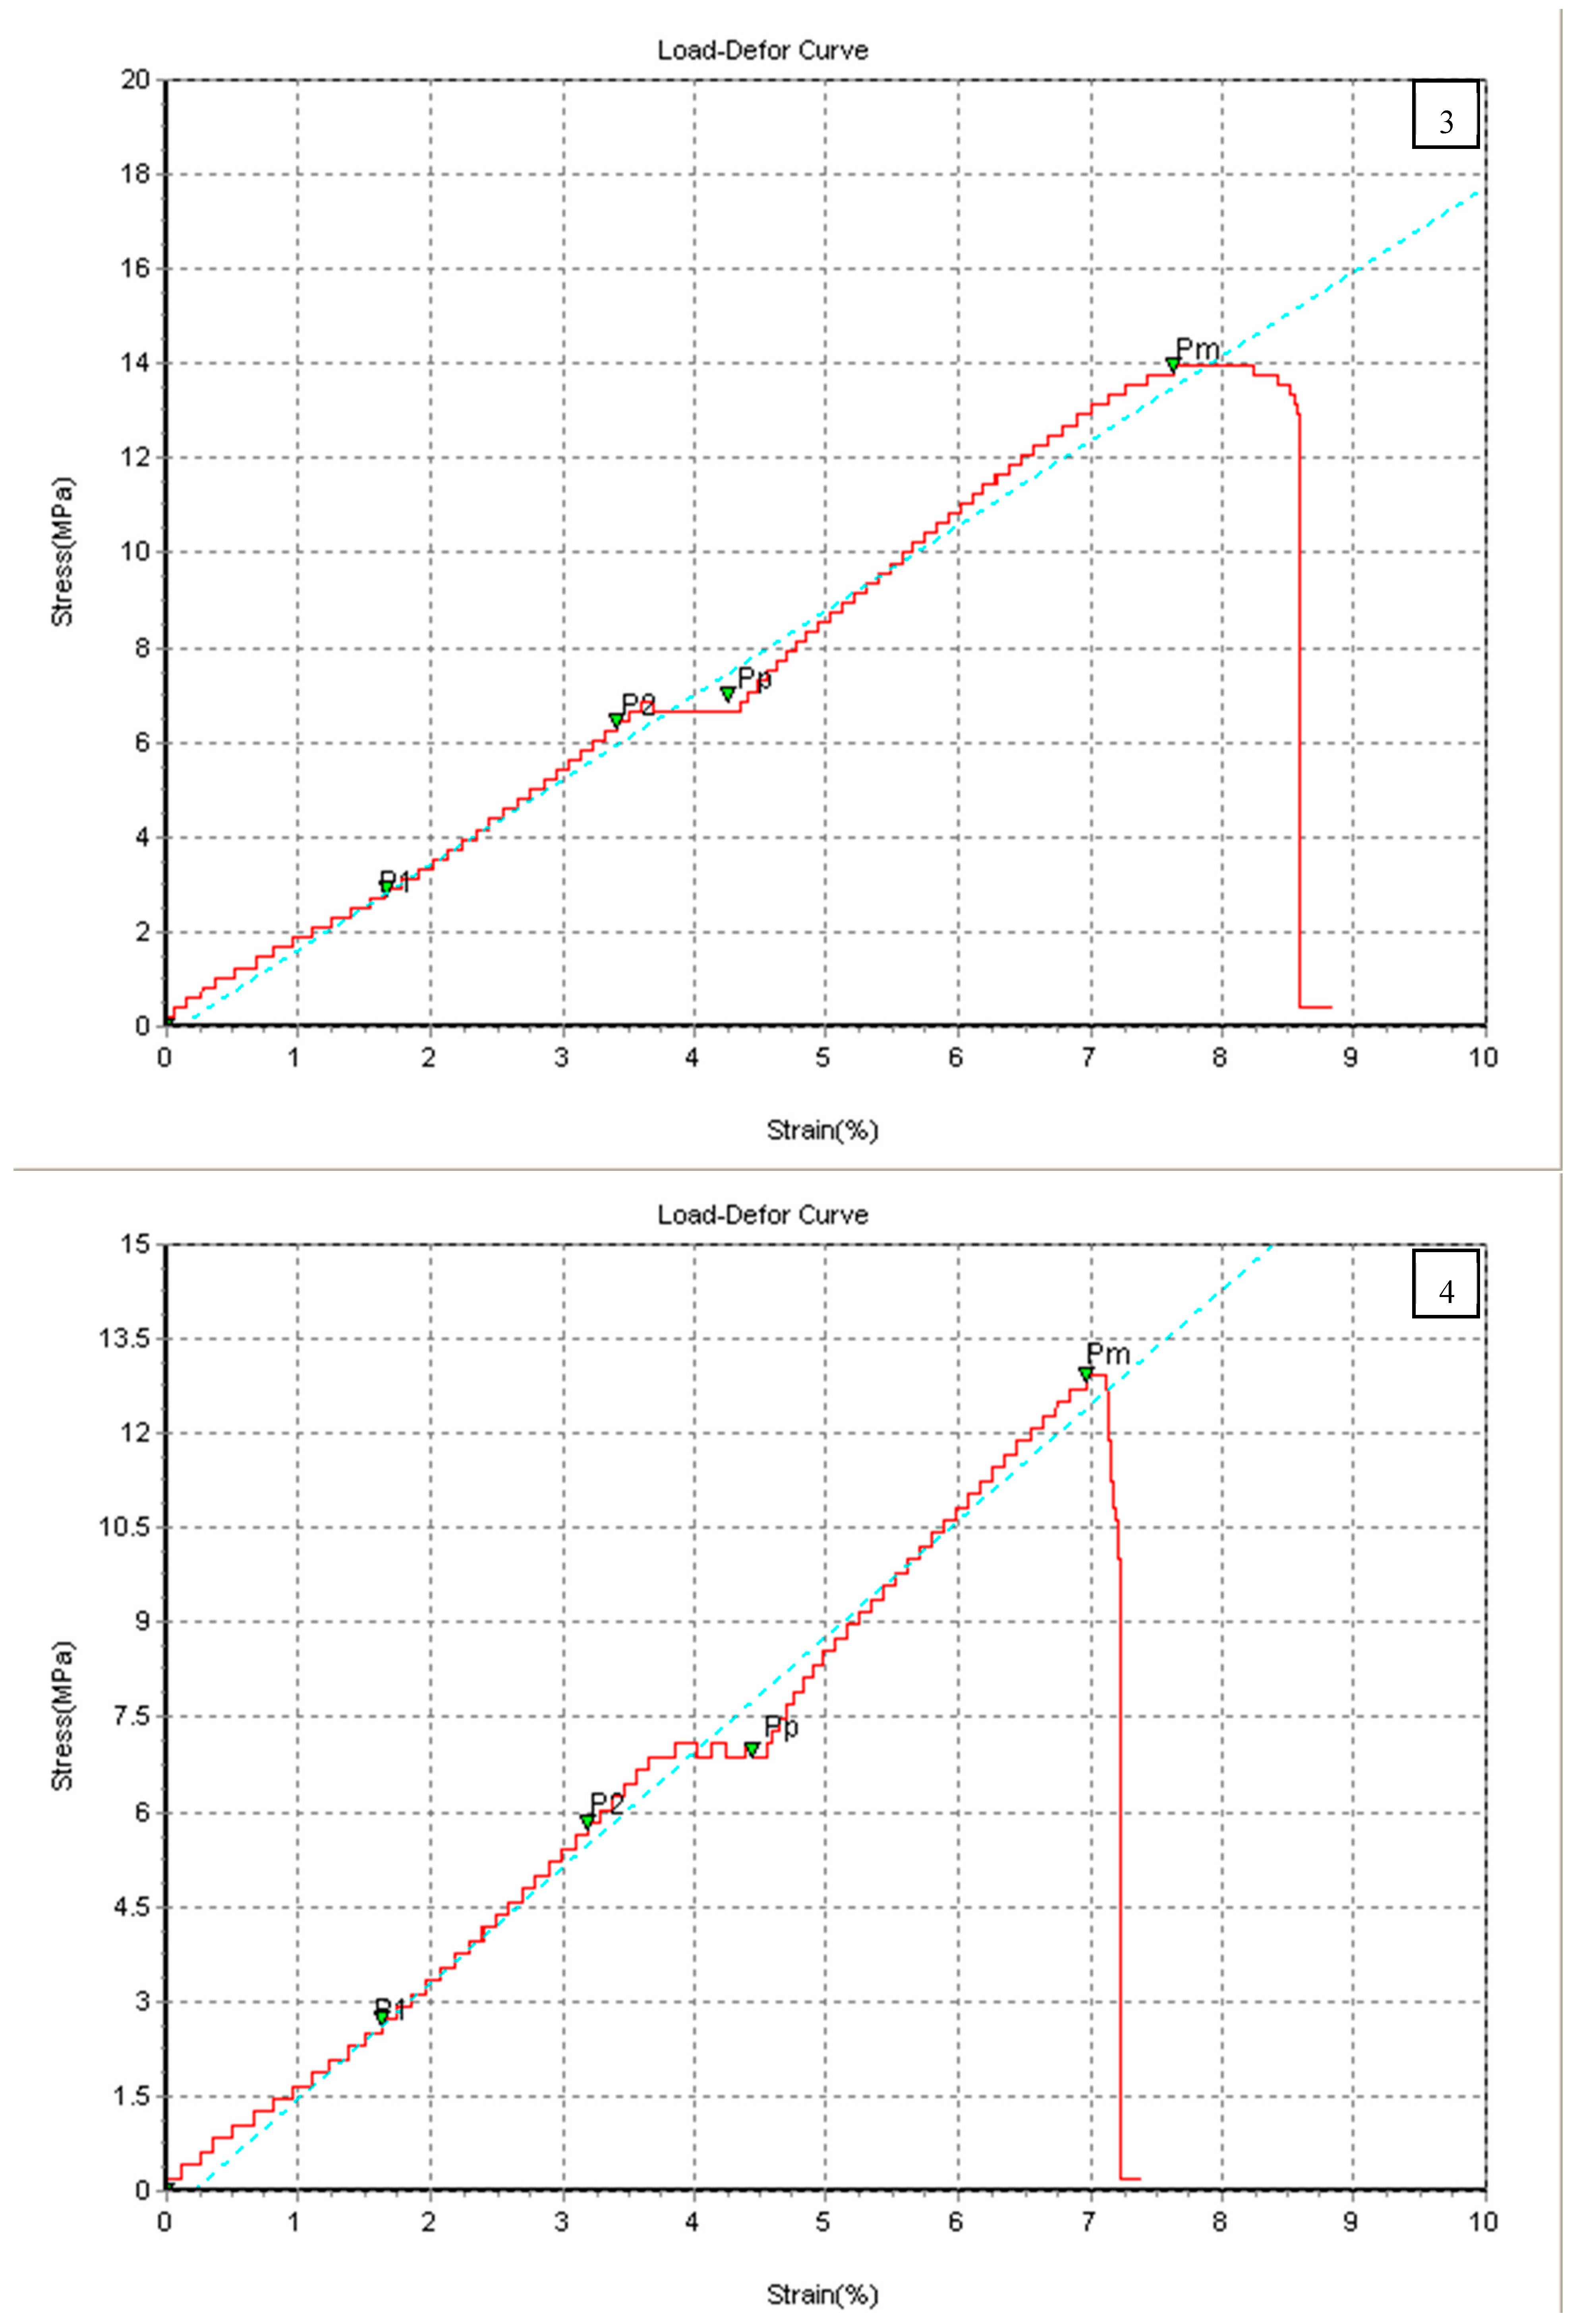
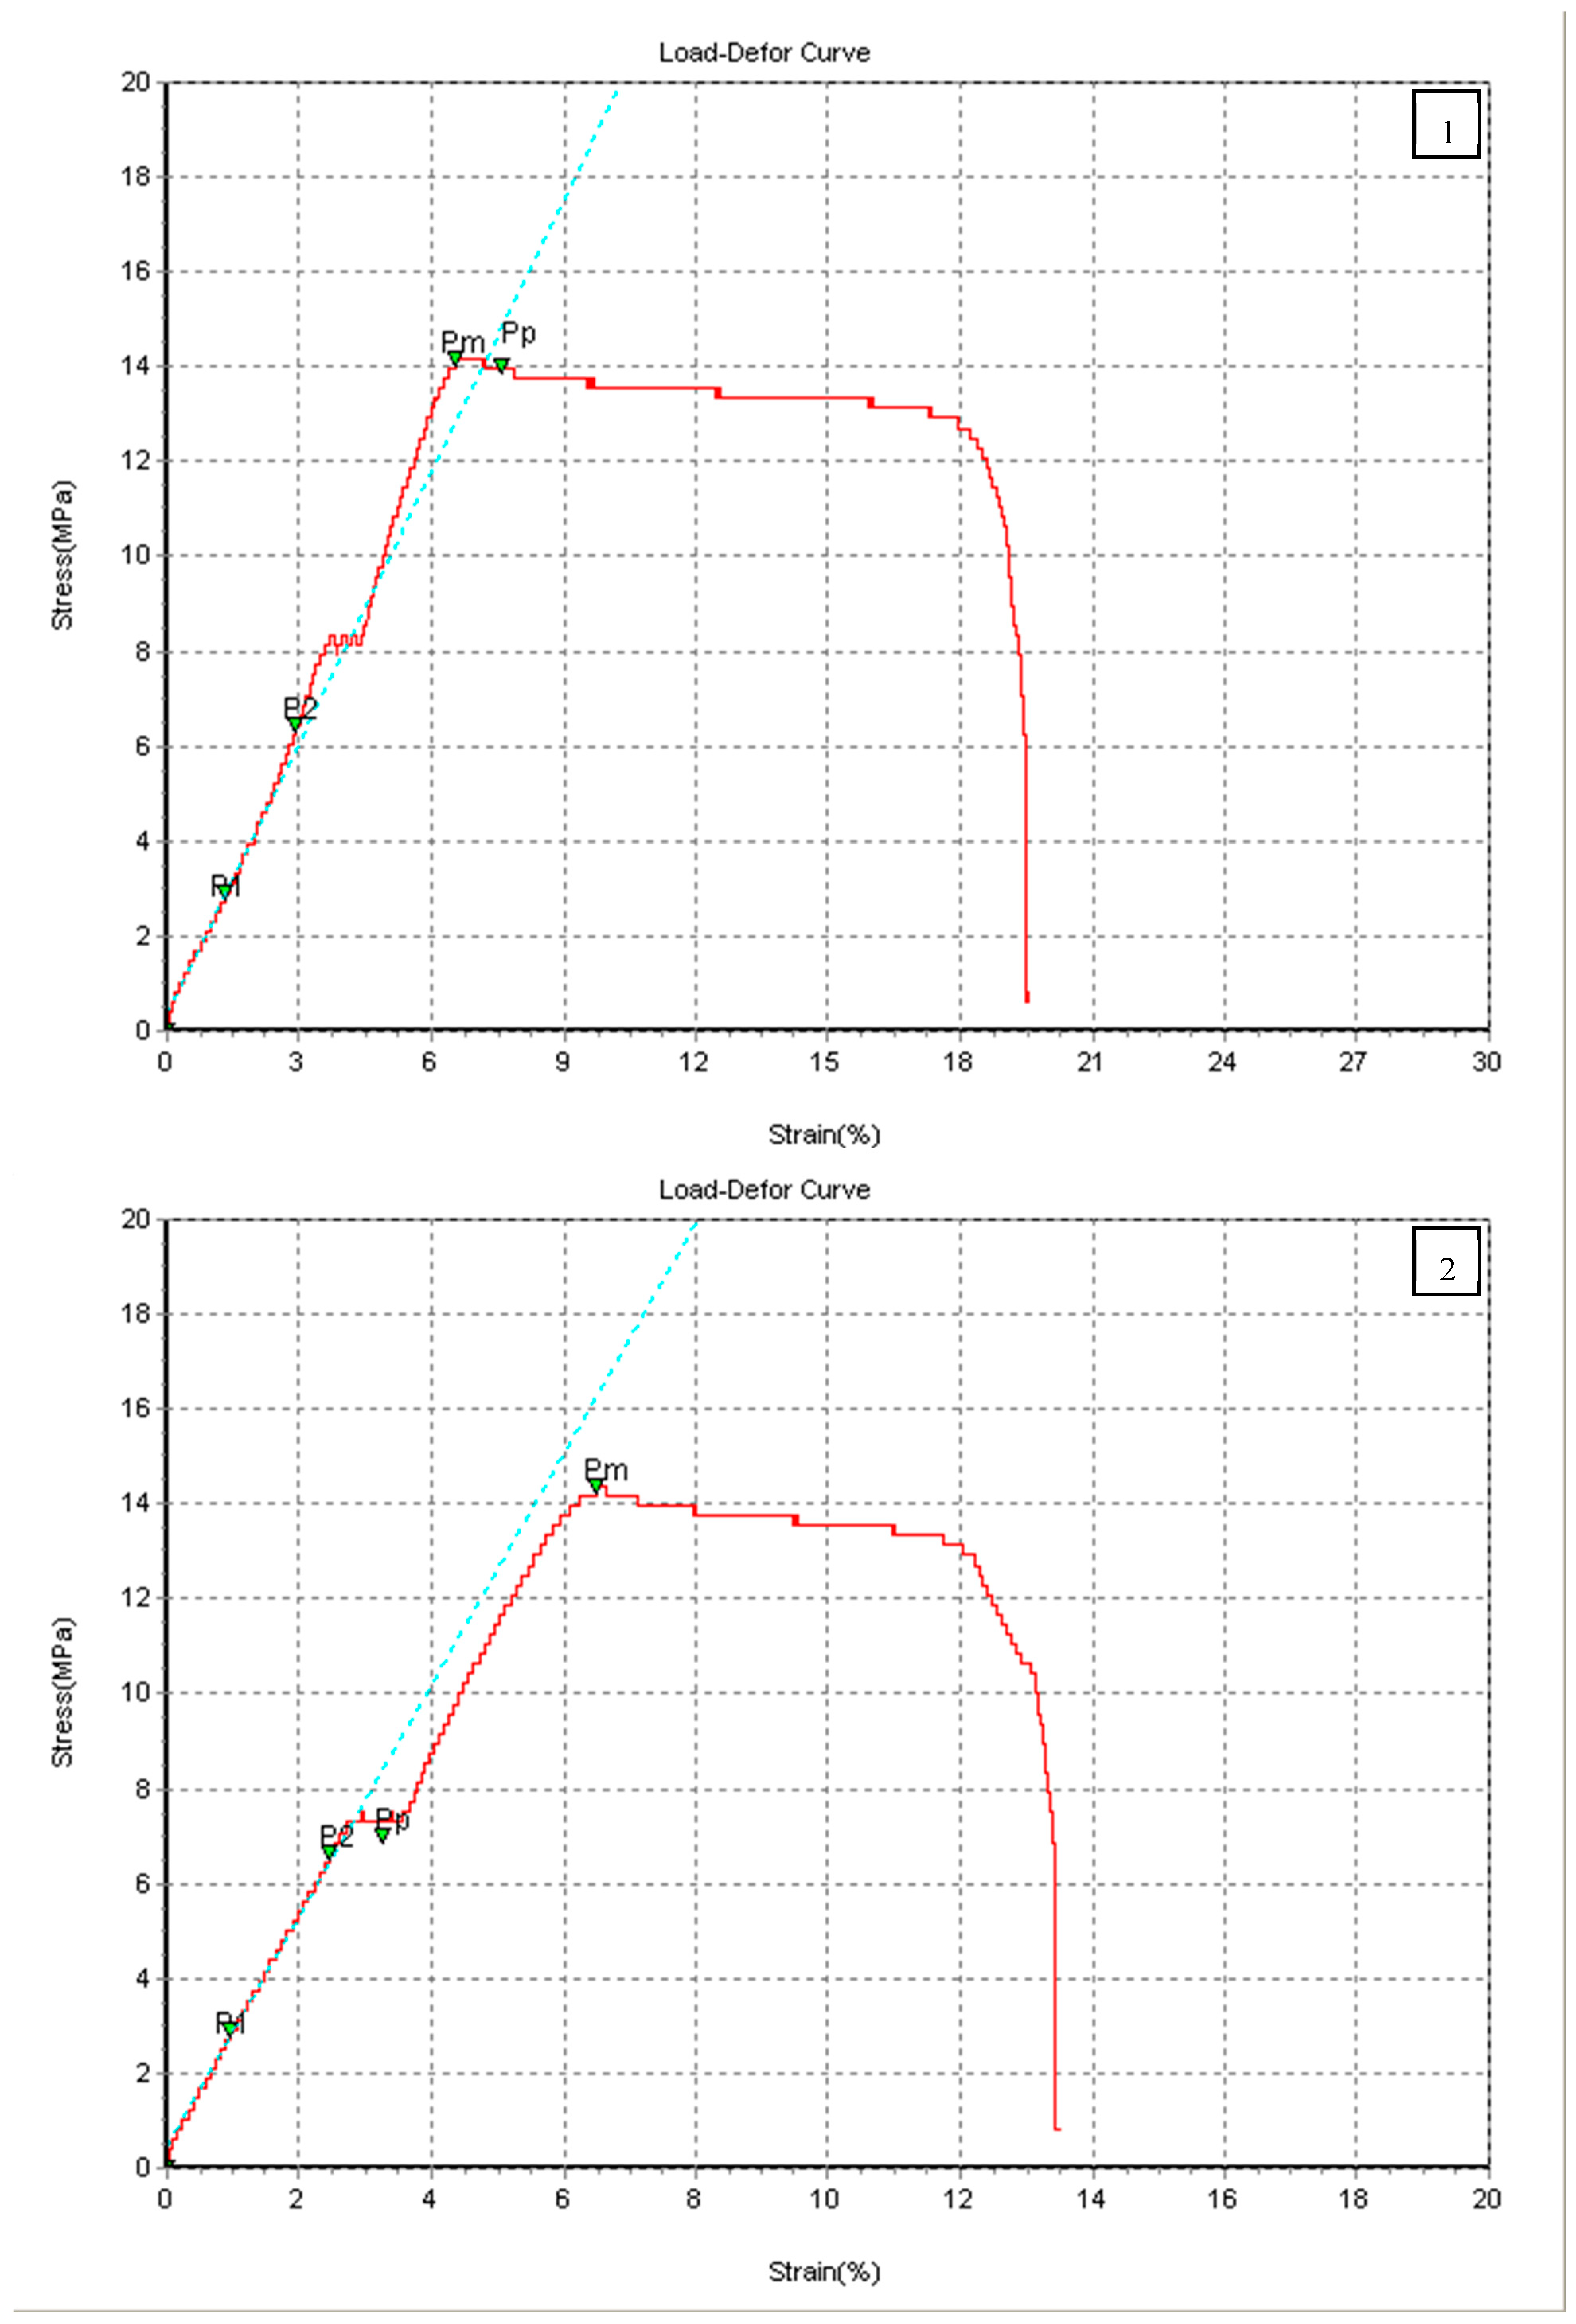
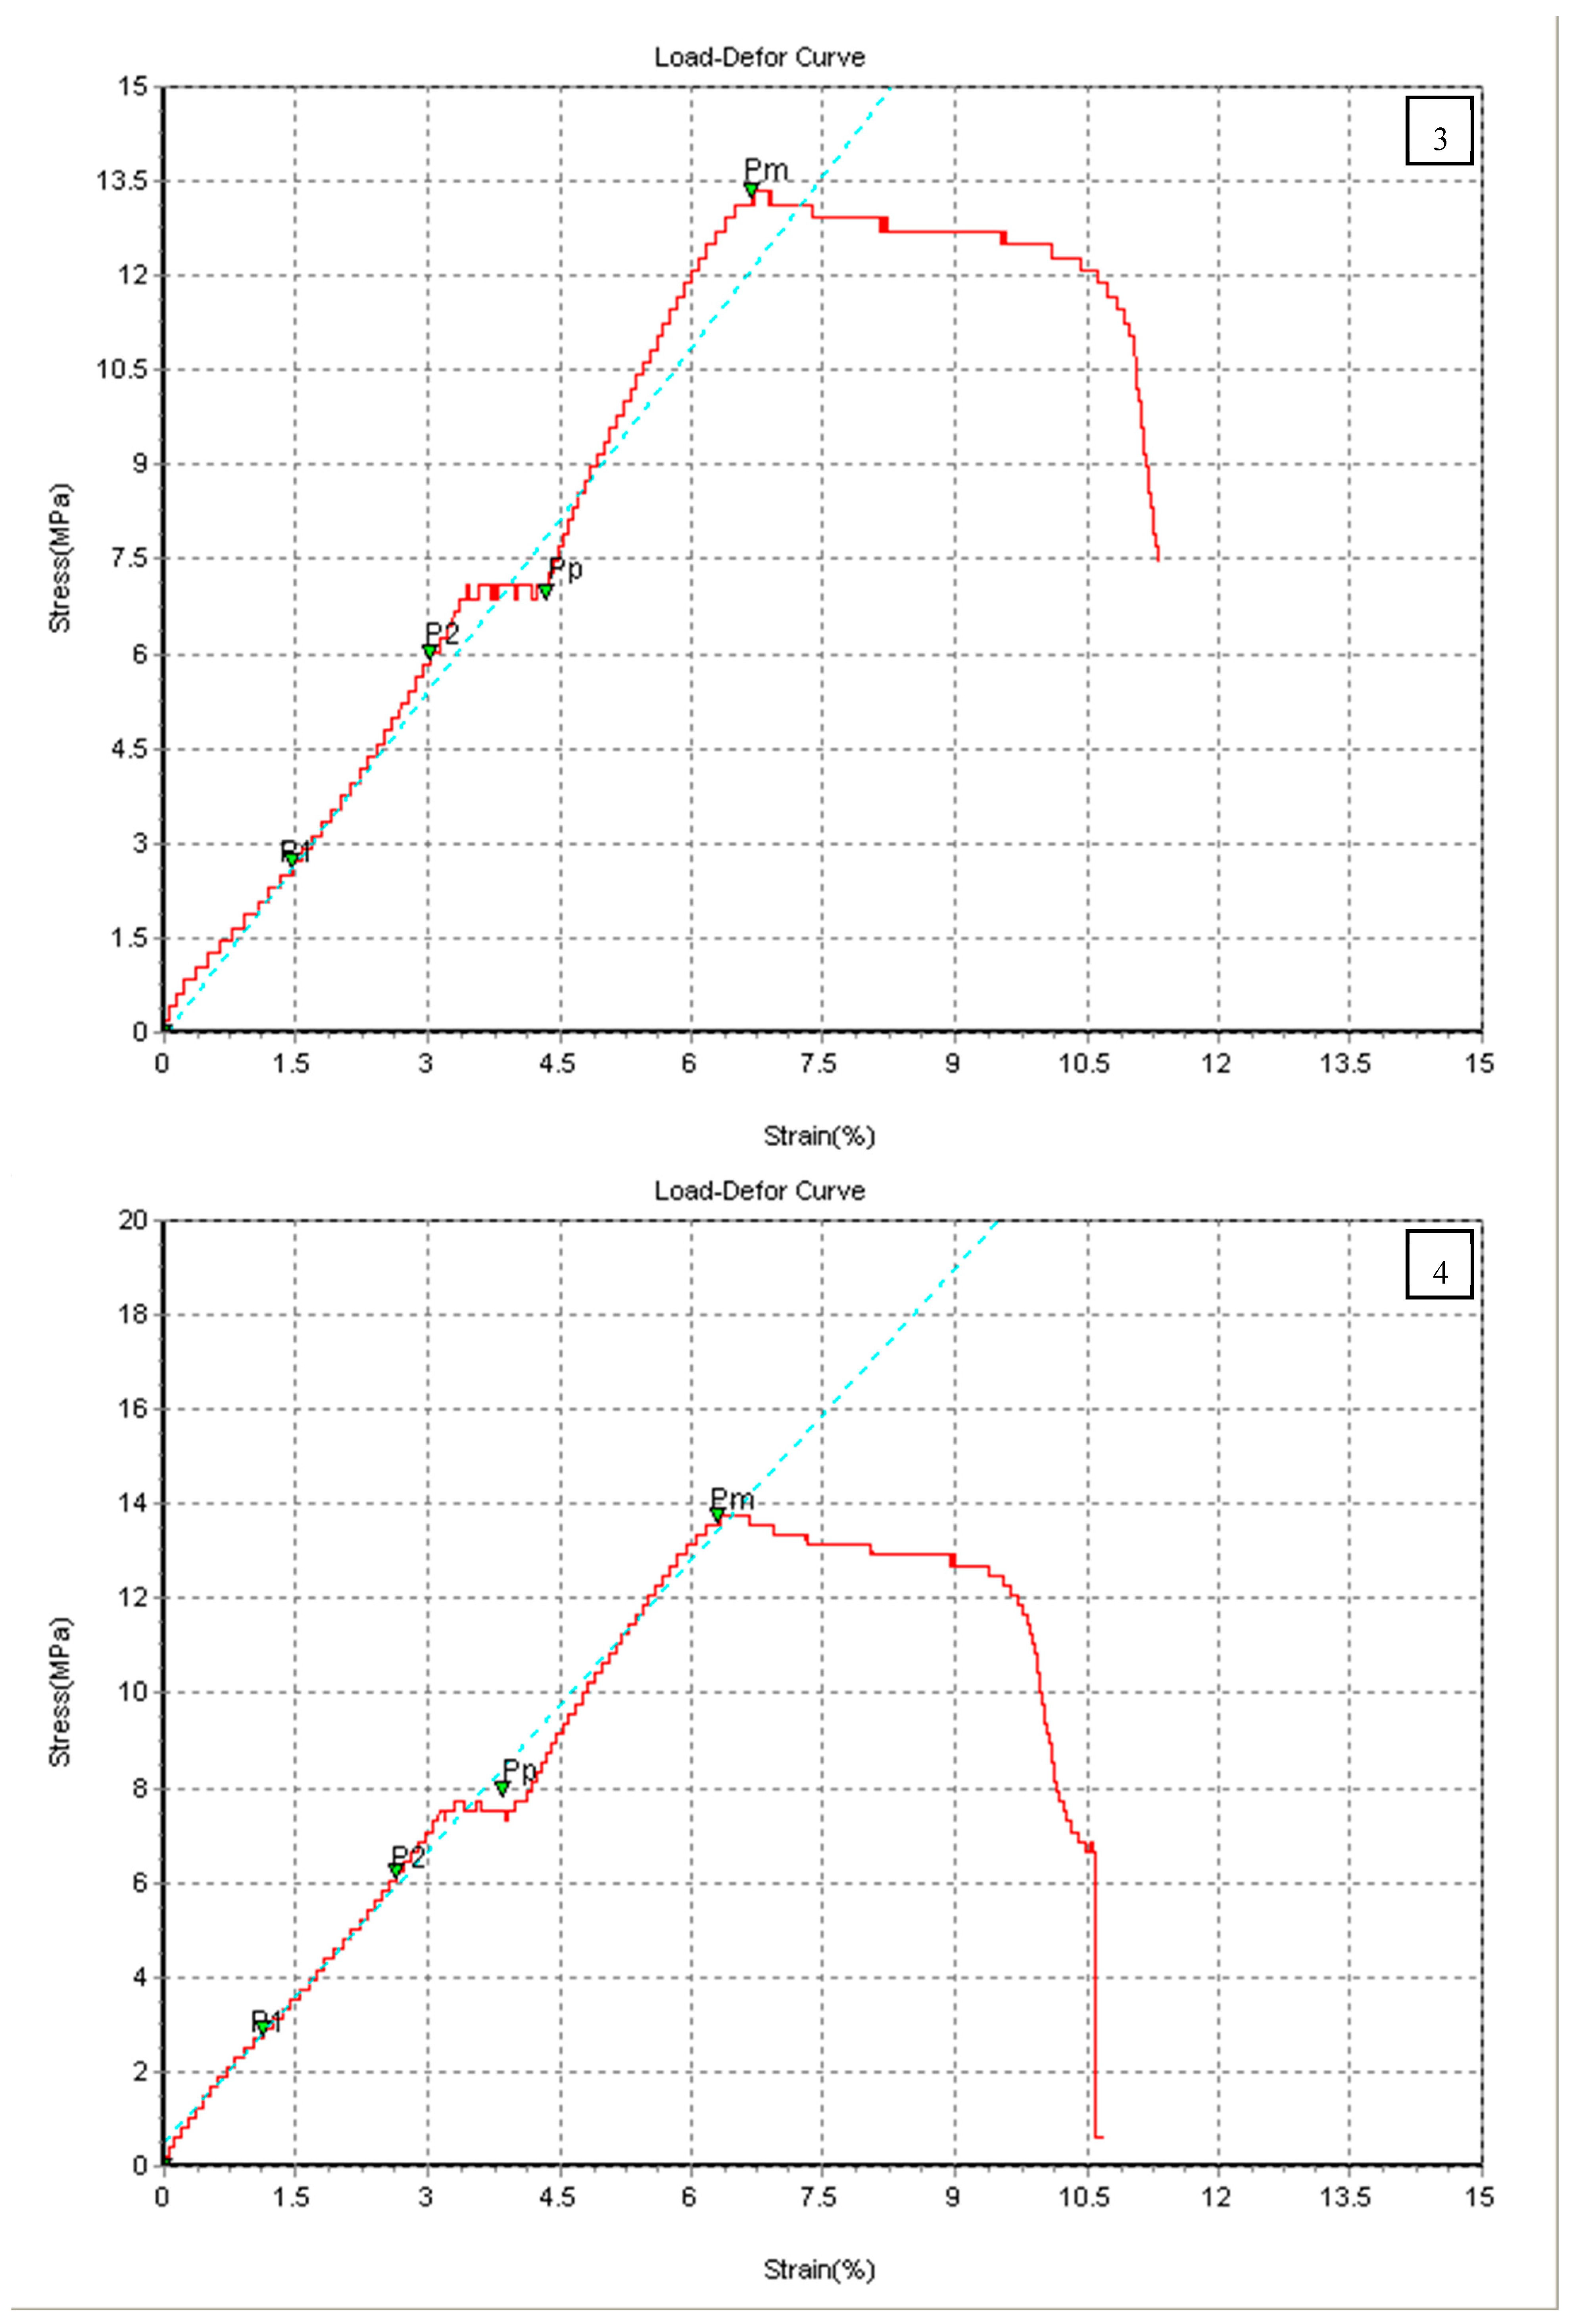
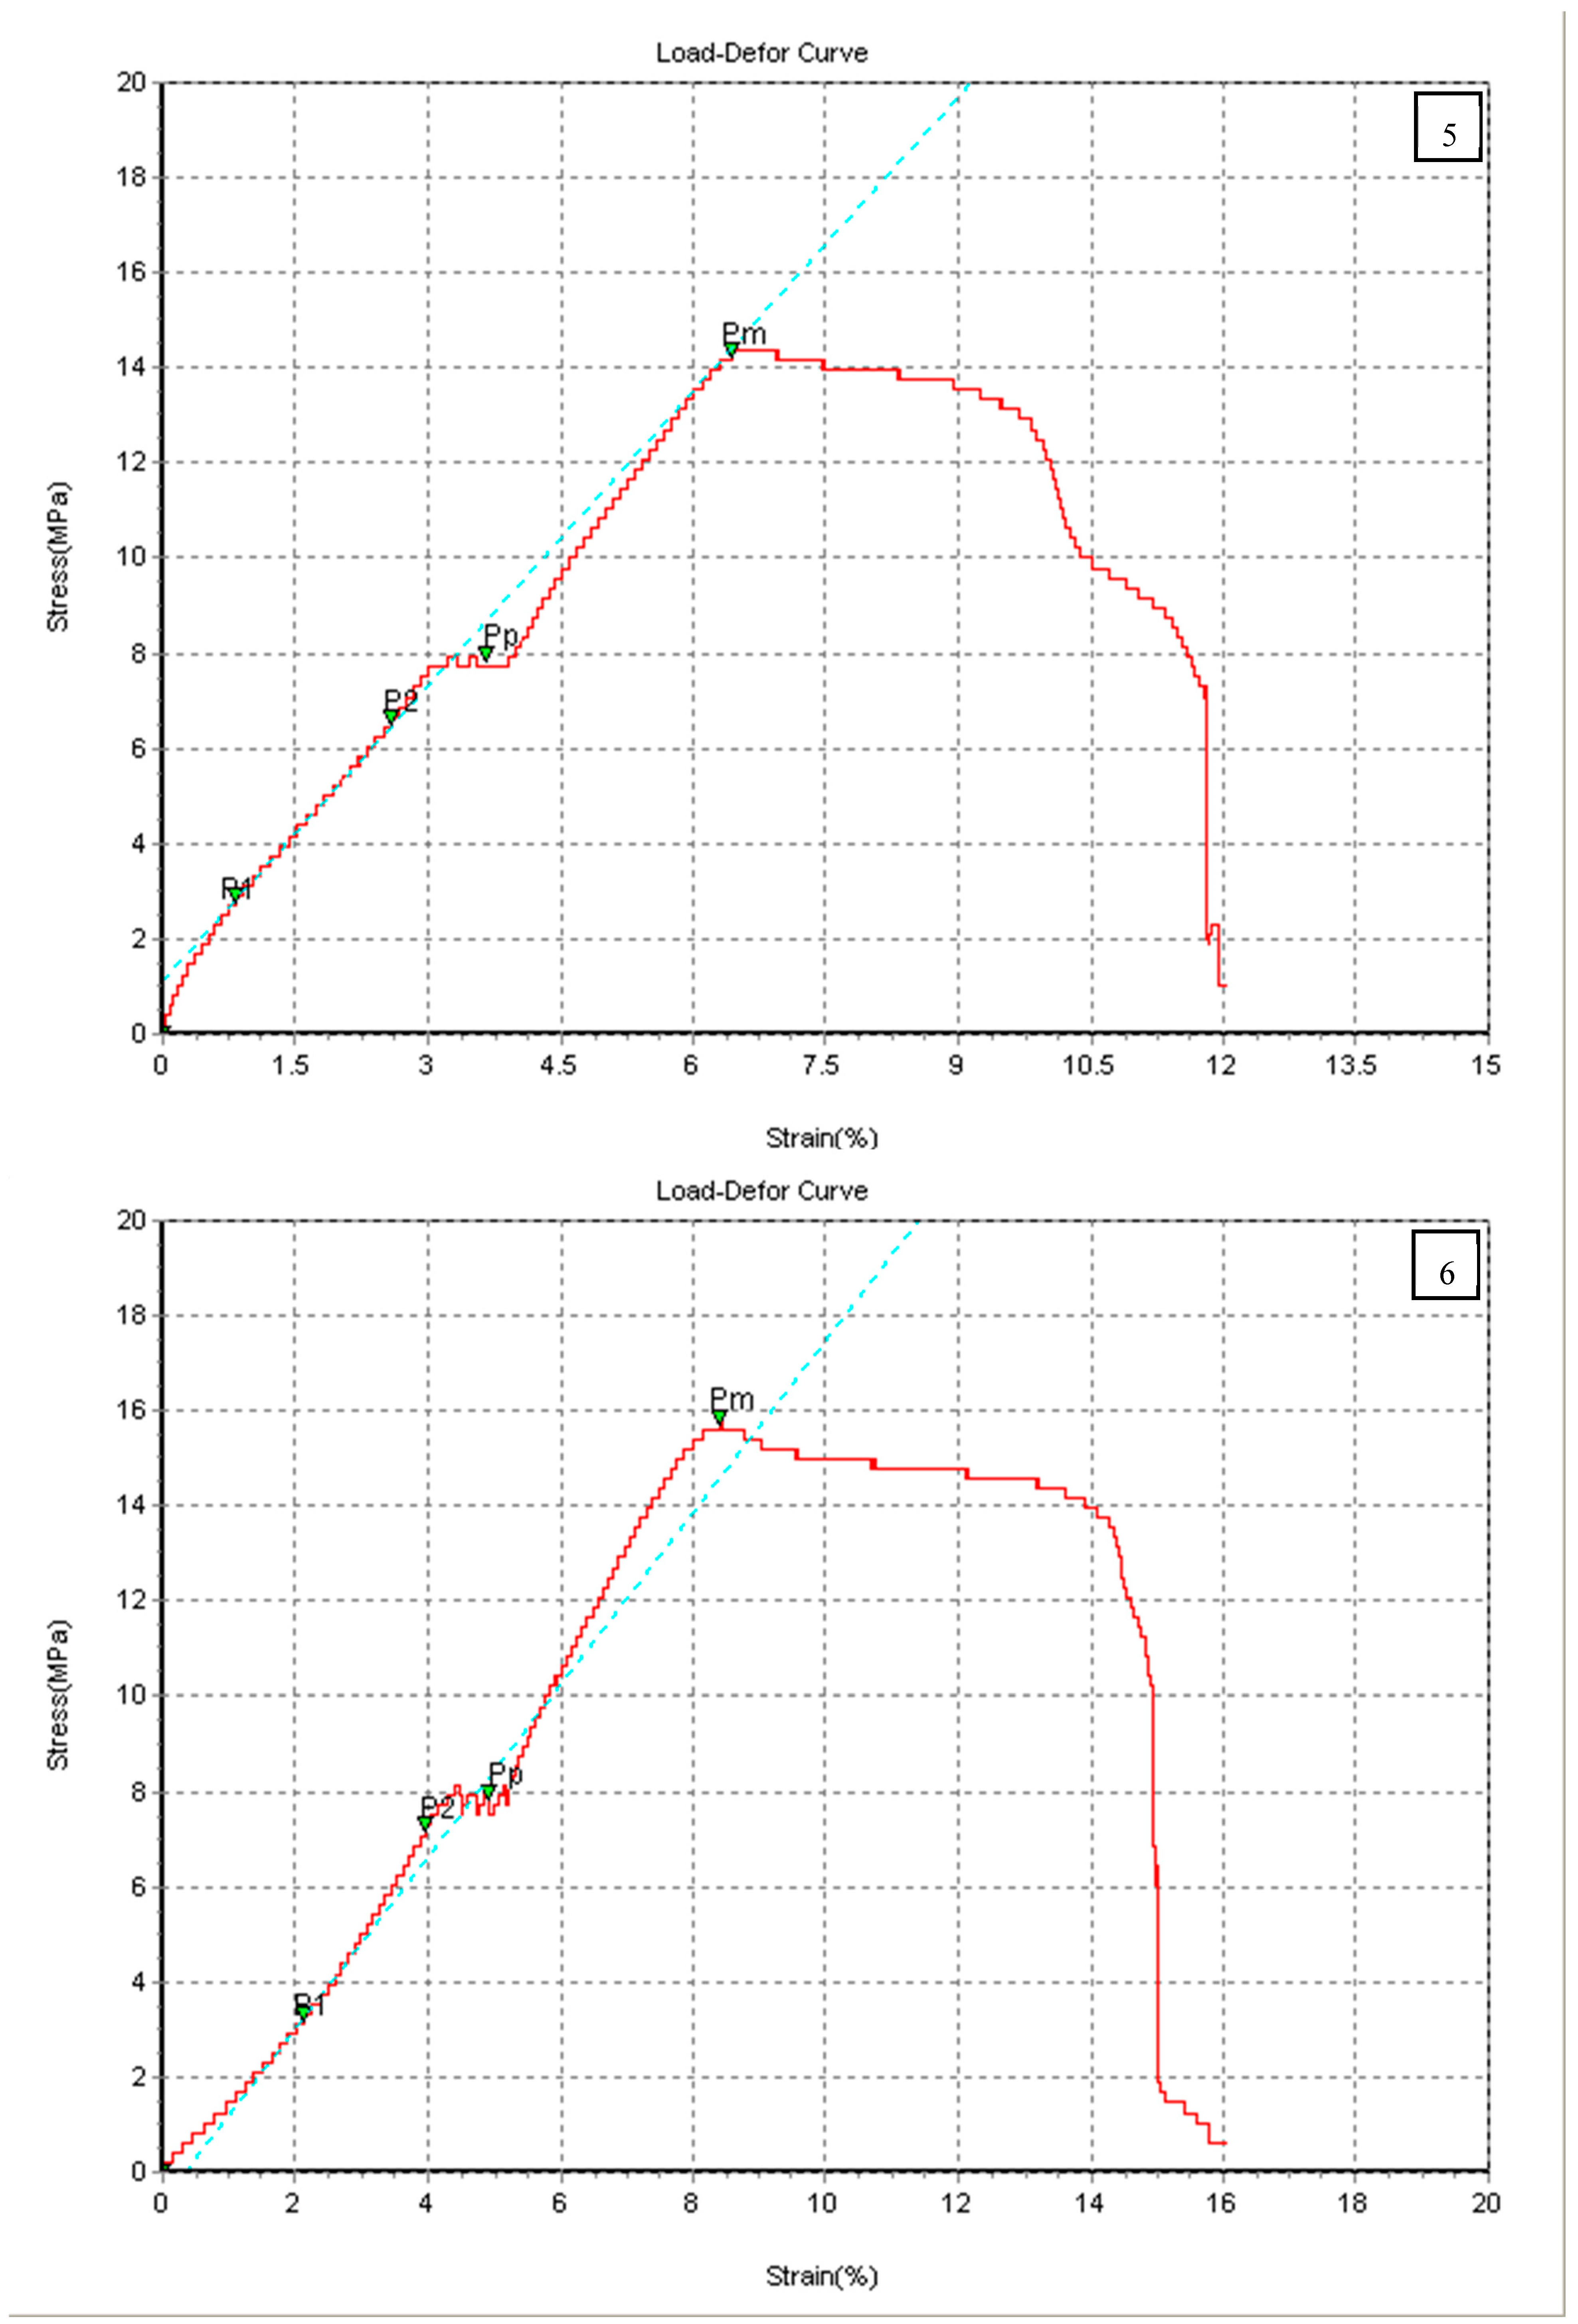
The first group subjected to the tensile test was the PLA group. As mentioned above, it consists of 14 specimens. Each specimen represents an independent structure pattern with constant 3D printing parameters.
Table 2 presents the ultimate tensile strength, Young’s modulus, and strain at break % that were constructed directly from the achieved stress–strain curves, which all are combined in
Figure 4. The cubic pattern (specimen 5) maintained the maximum ultimate strength with a good Young’s modulus and tensile strength. In contrast, the concentric pattern exhibited bad performance, where it produced the lowest mechanical properties compared with other patterns. In addition, specimen 2 was the stiffest with the lines pattern, while the cubic subdivision pattern achieved the maximum strain at the break % (specimen 6). As a reminder, all specimens were printed with a 20% infill density.
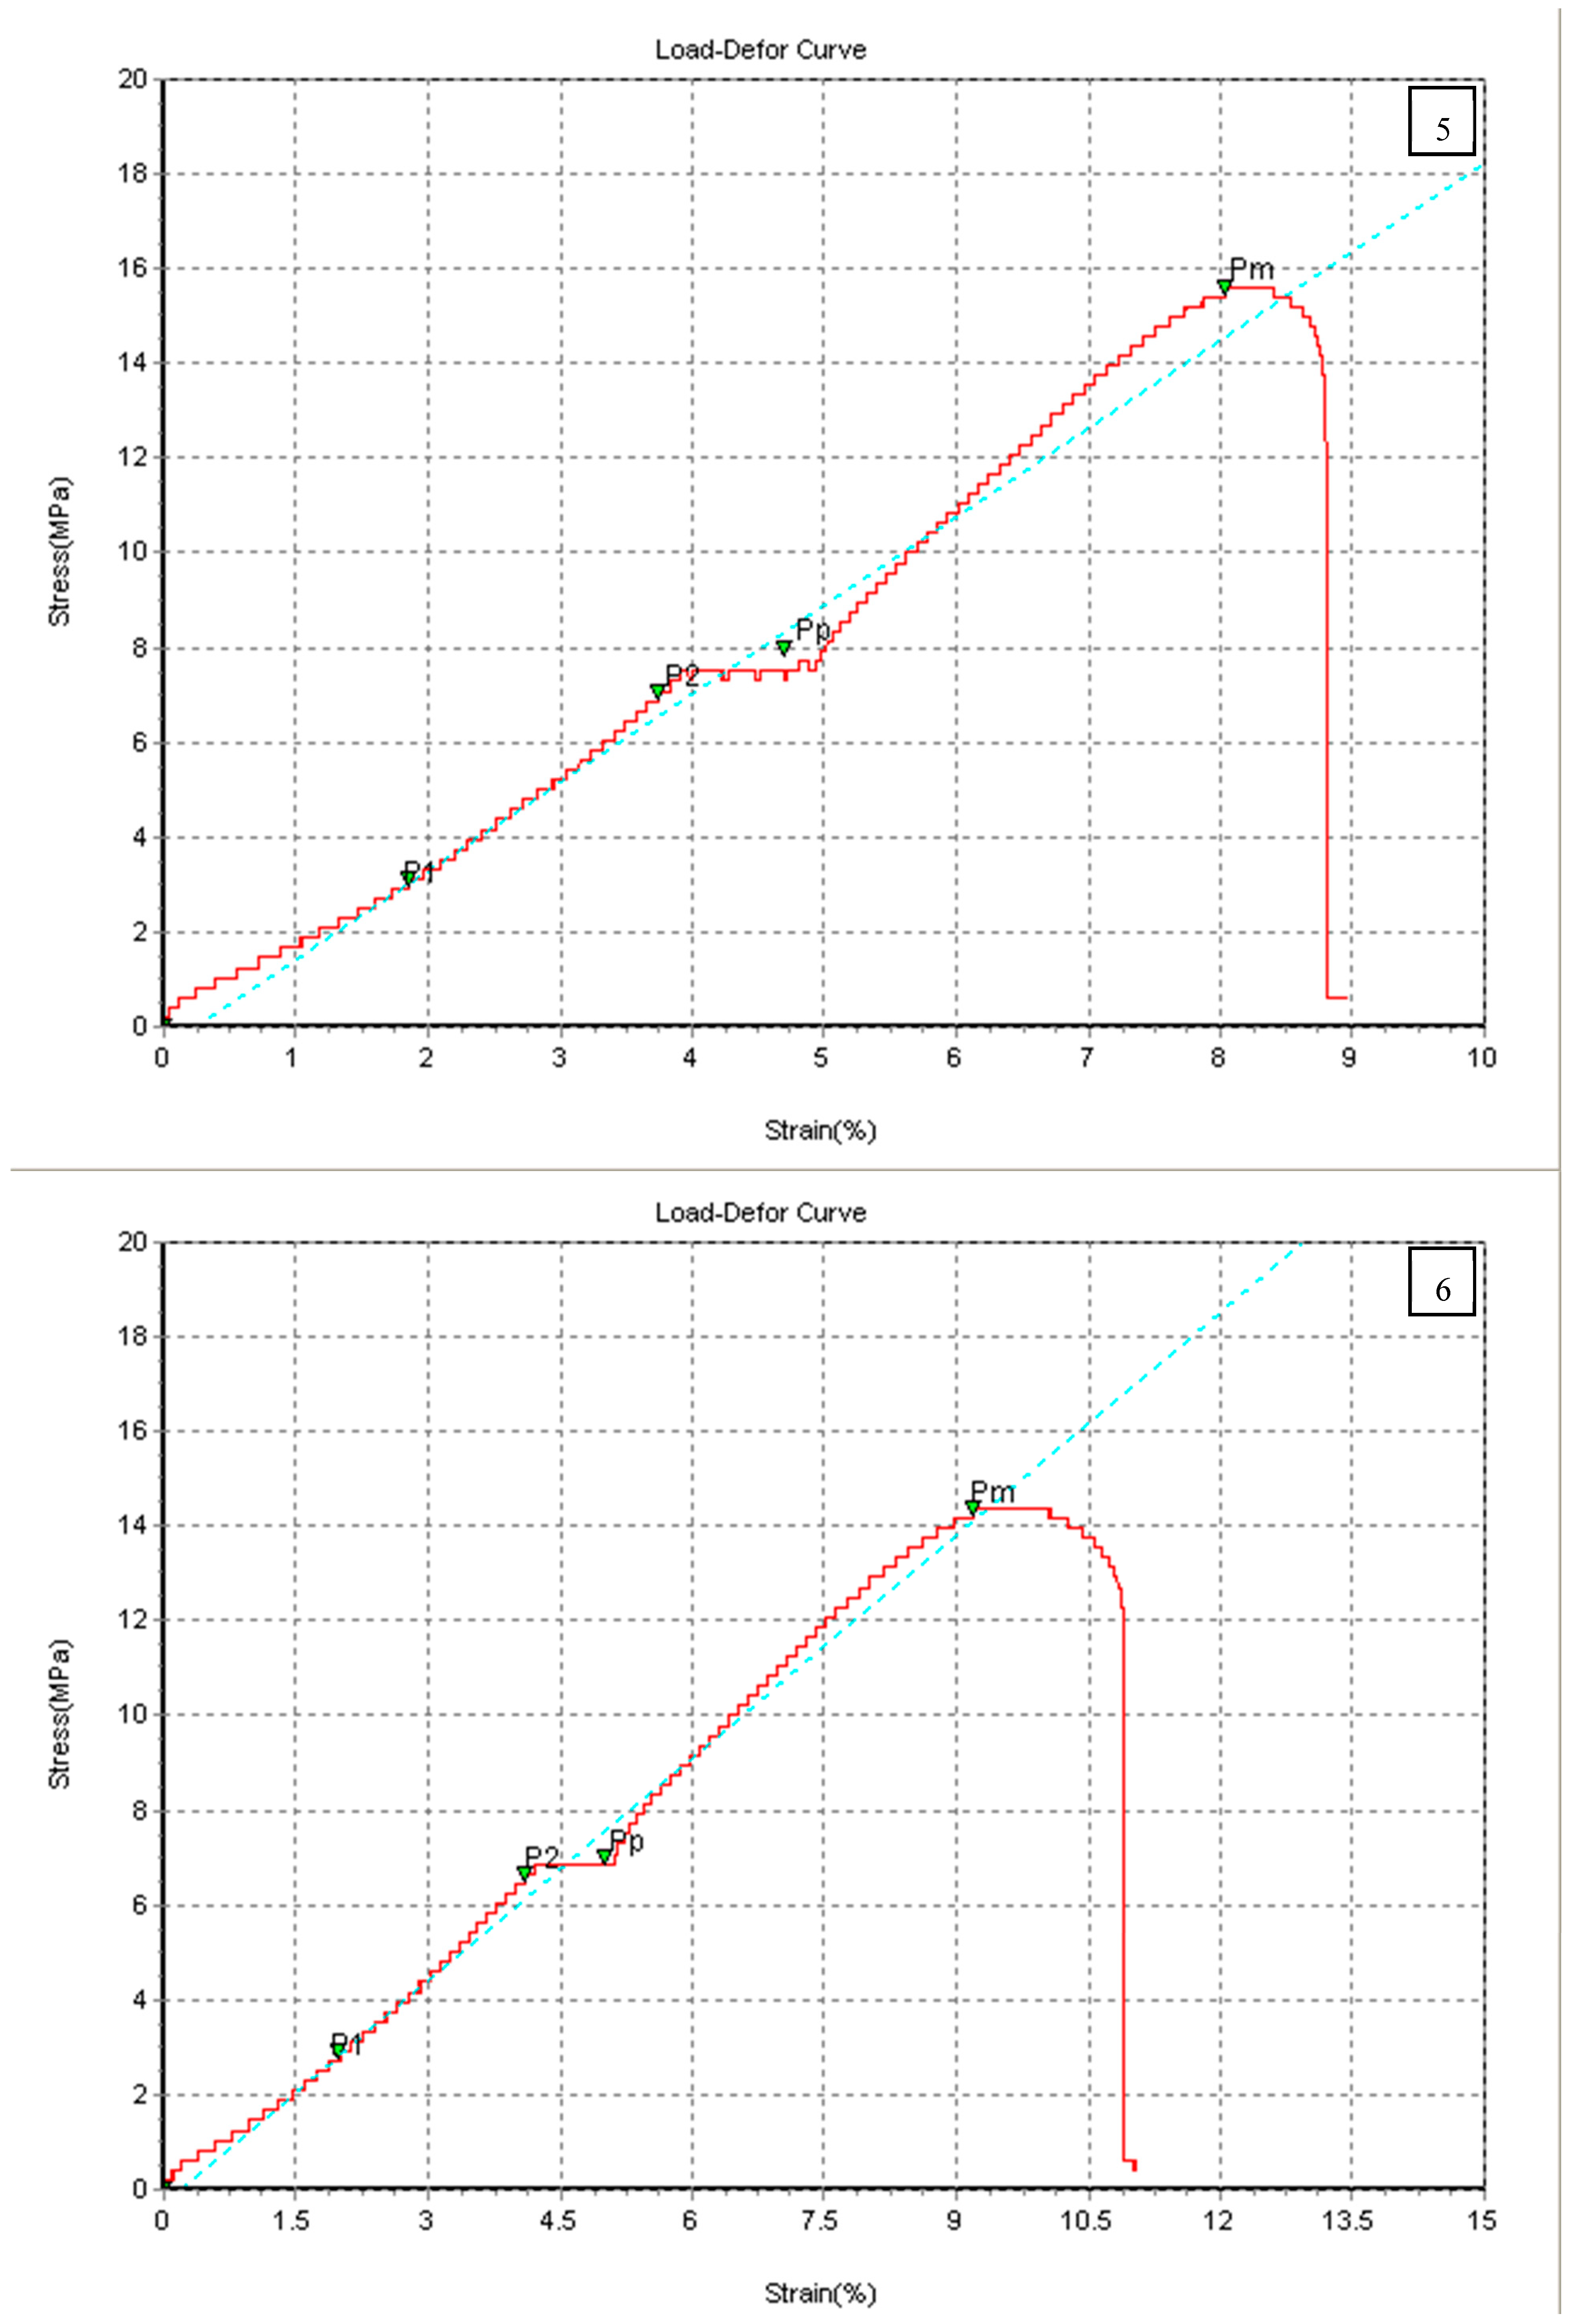
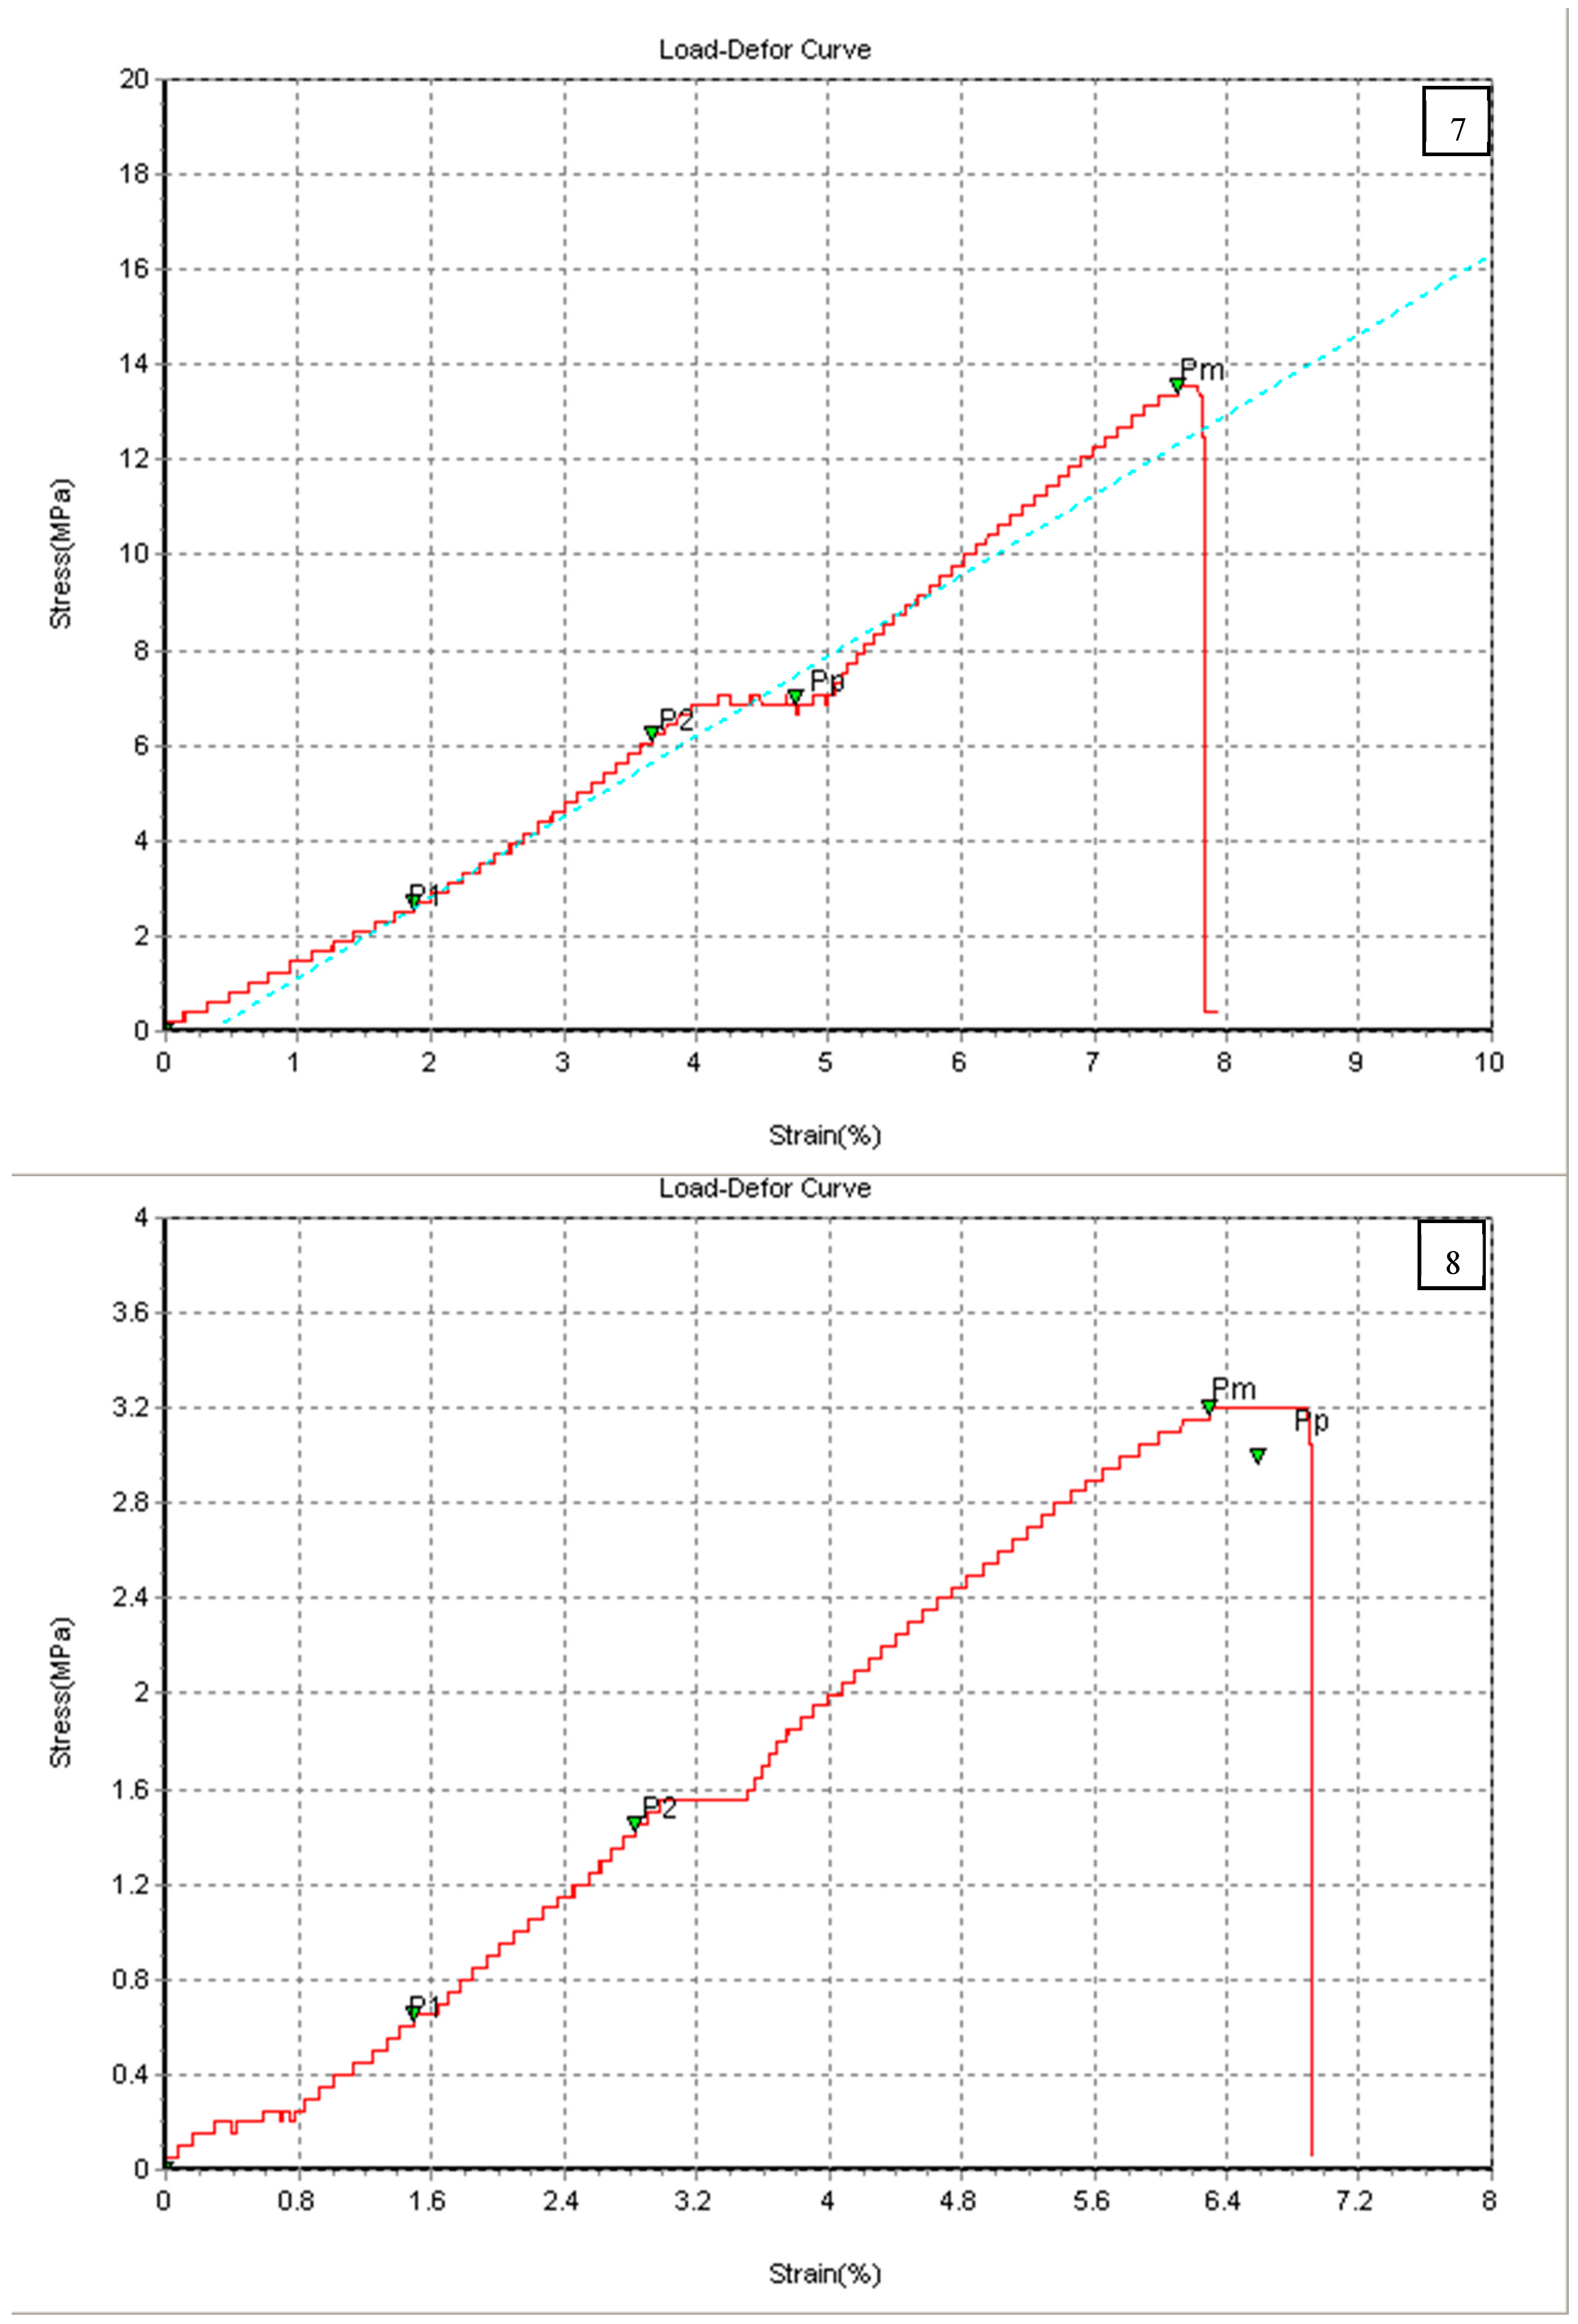
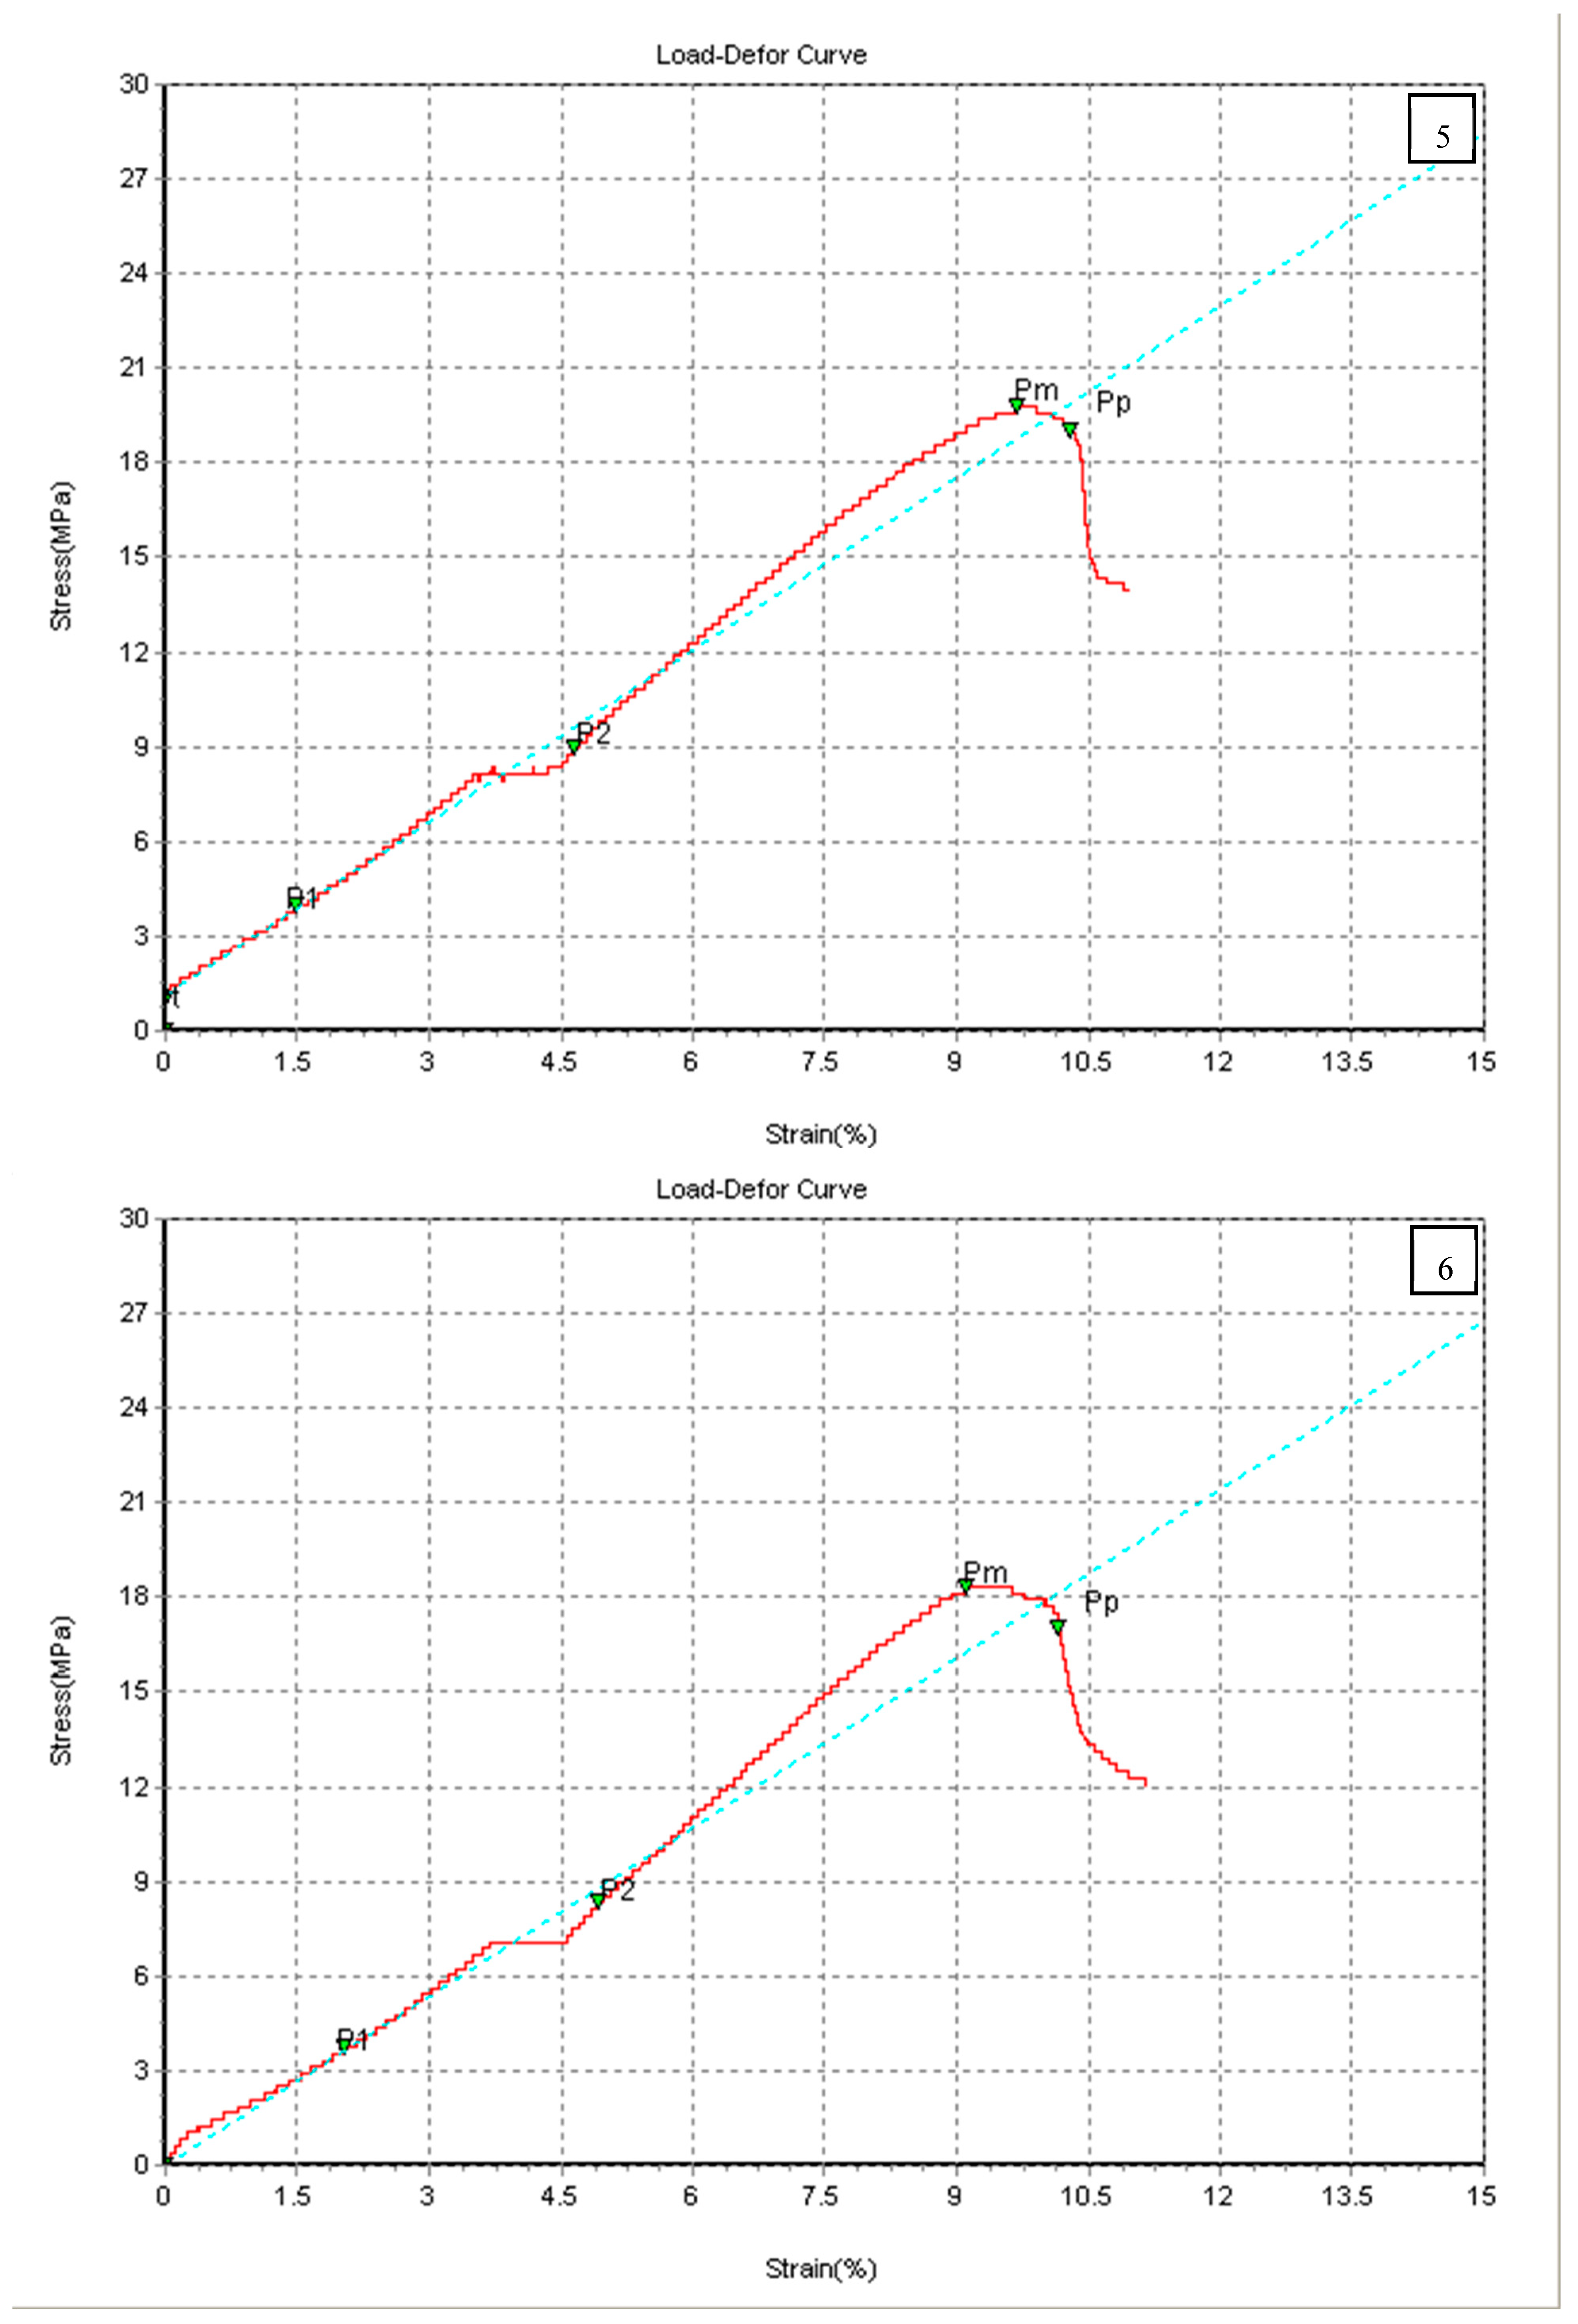
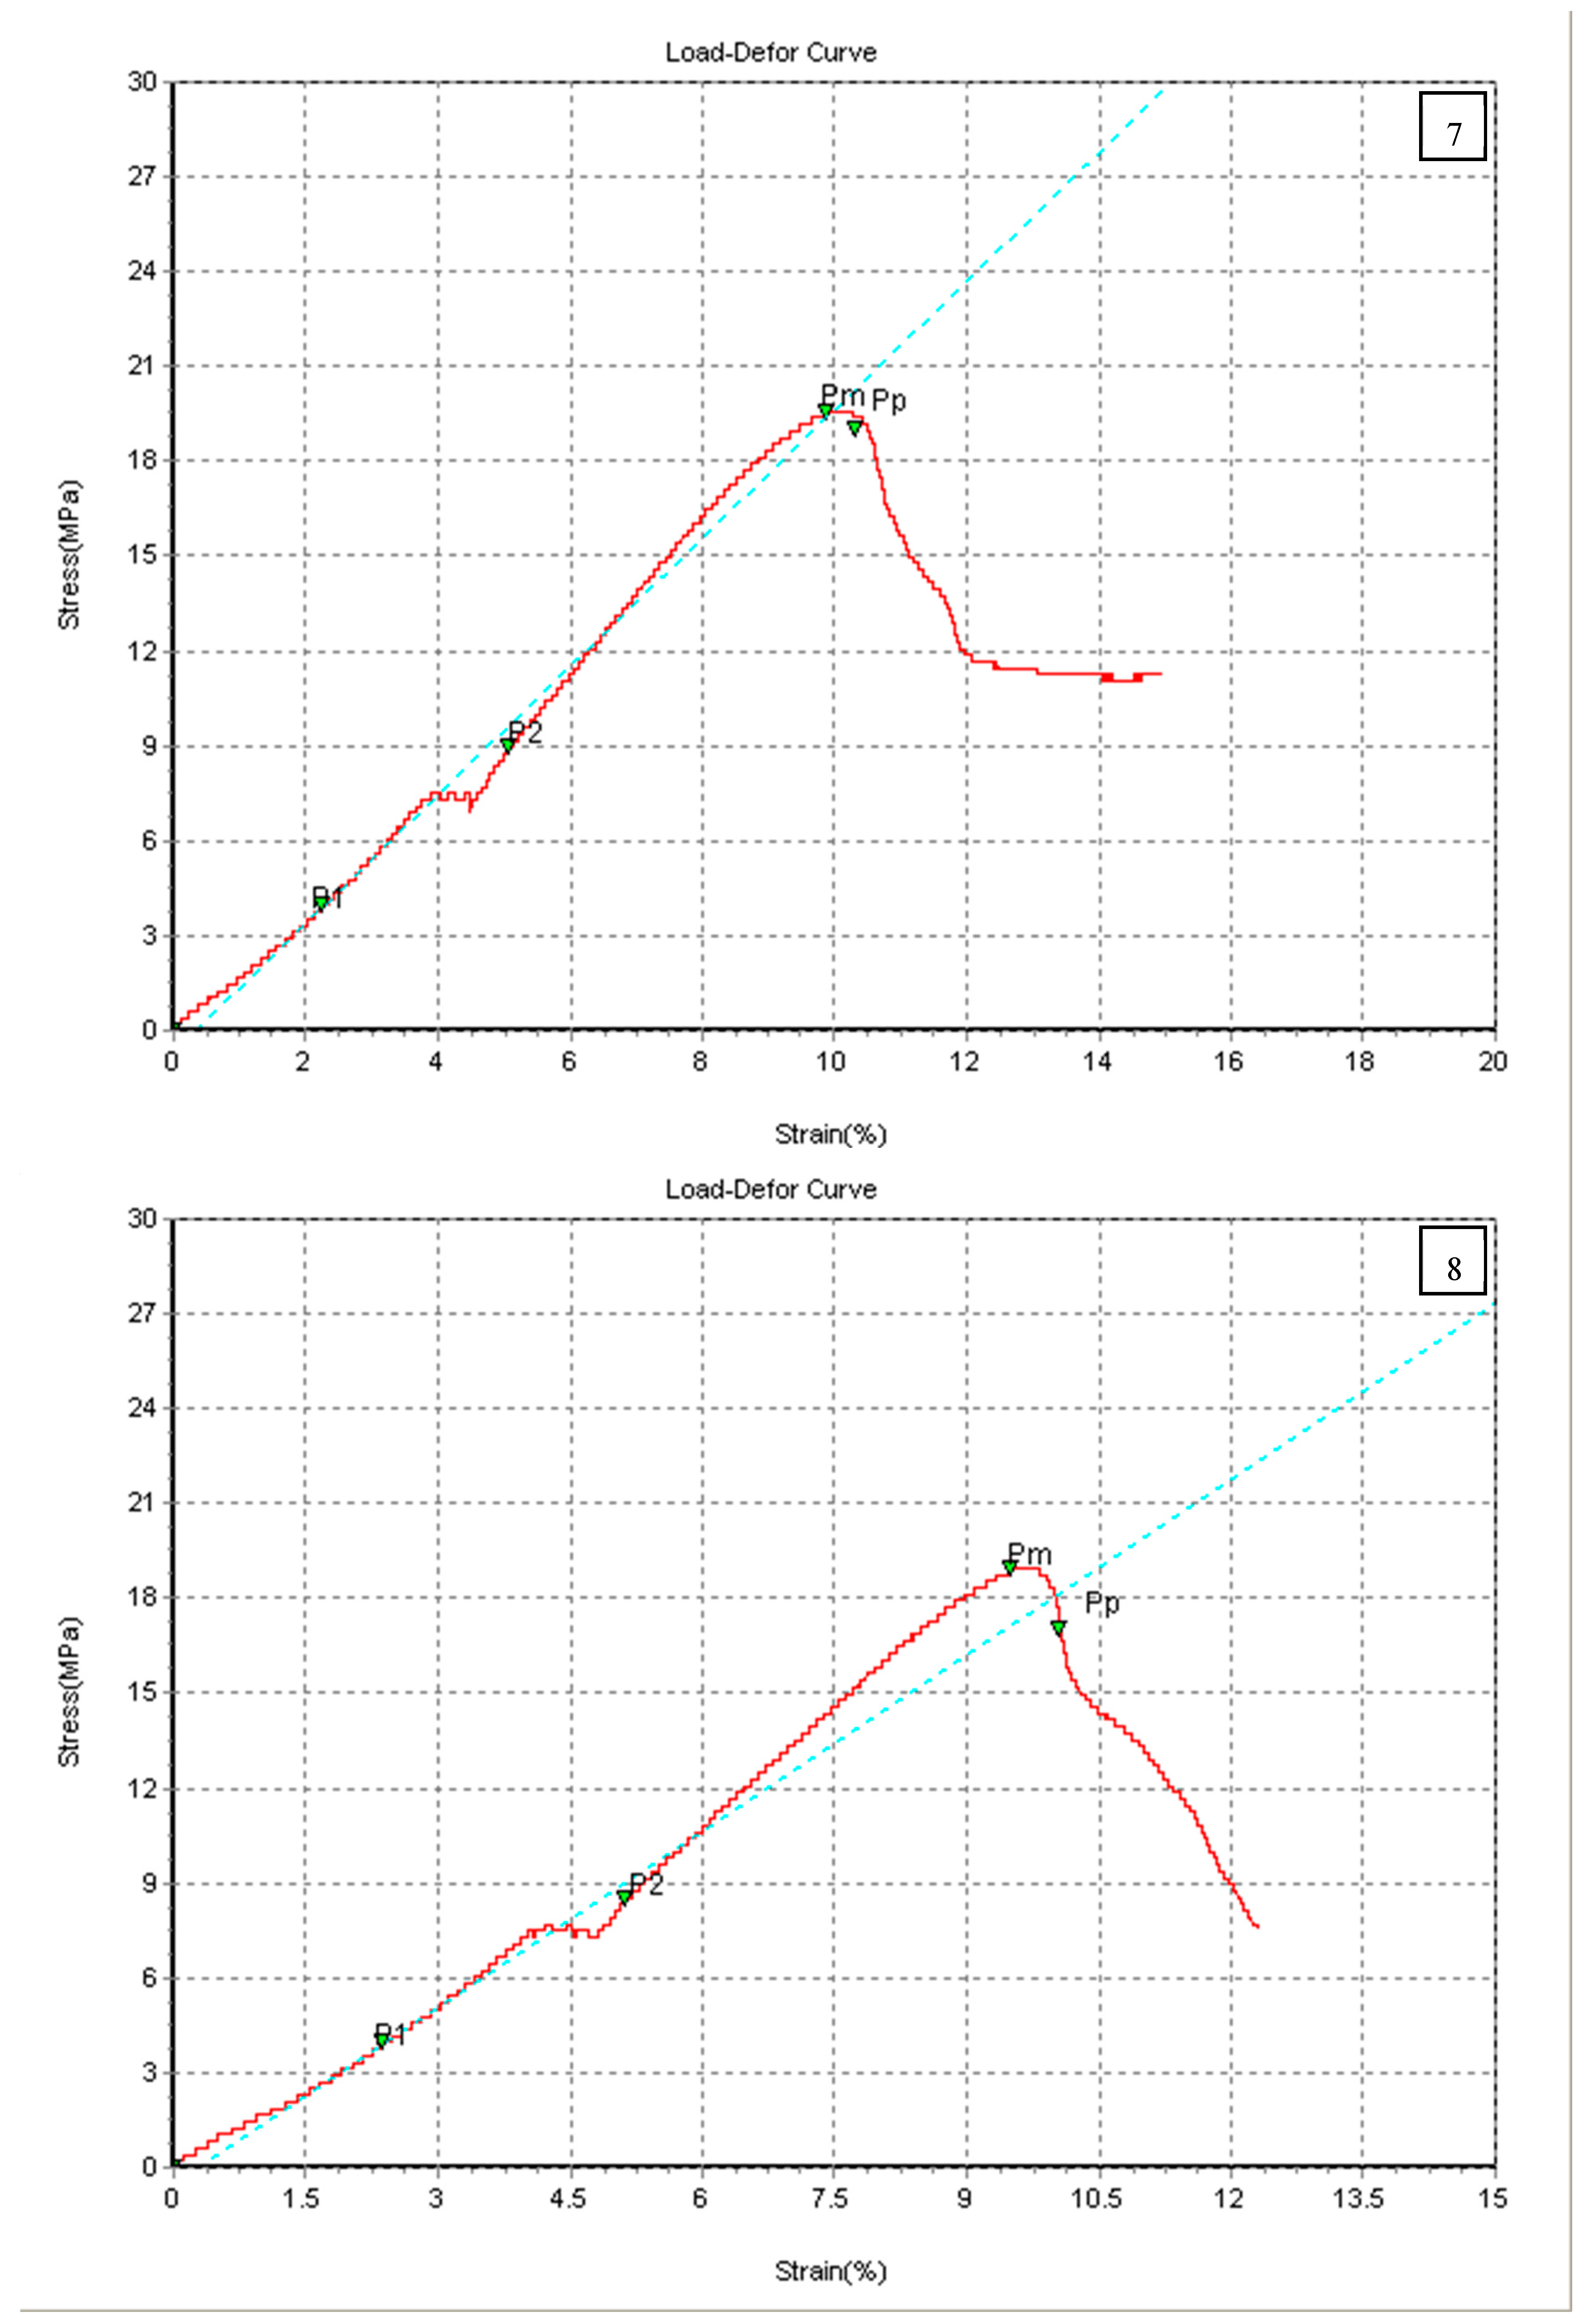
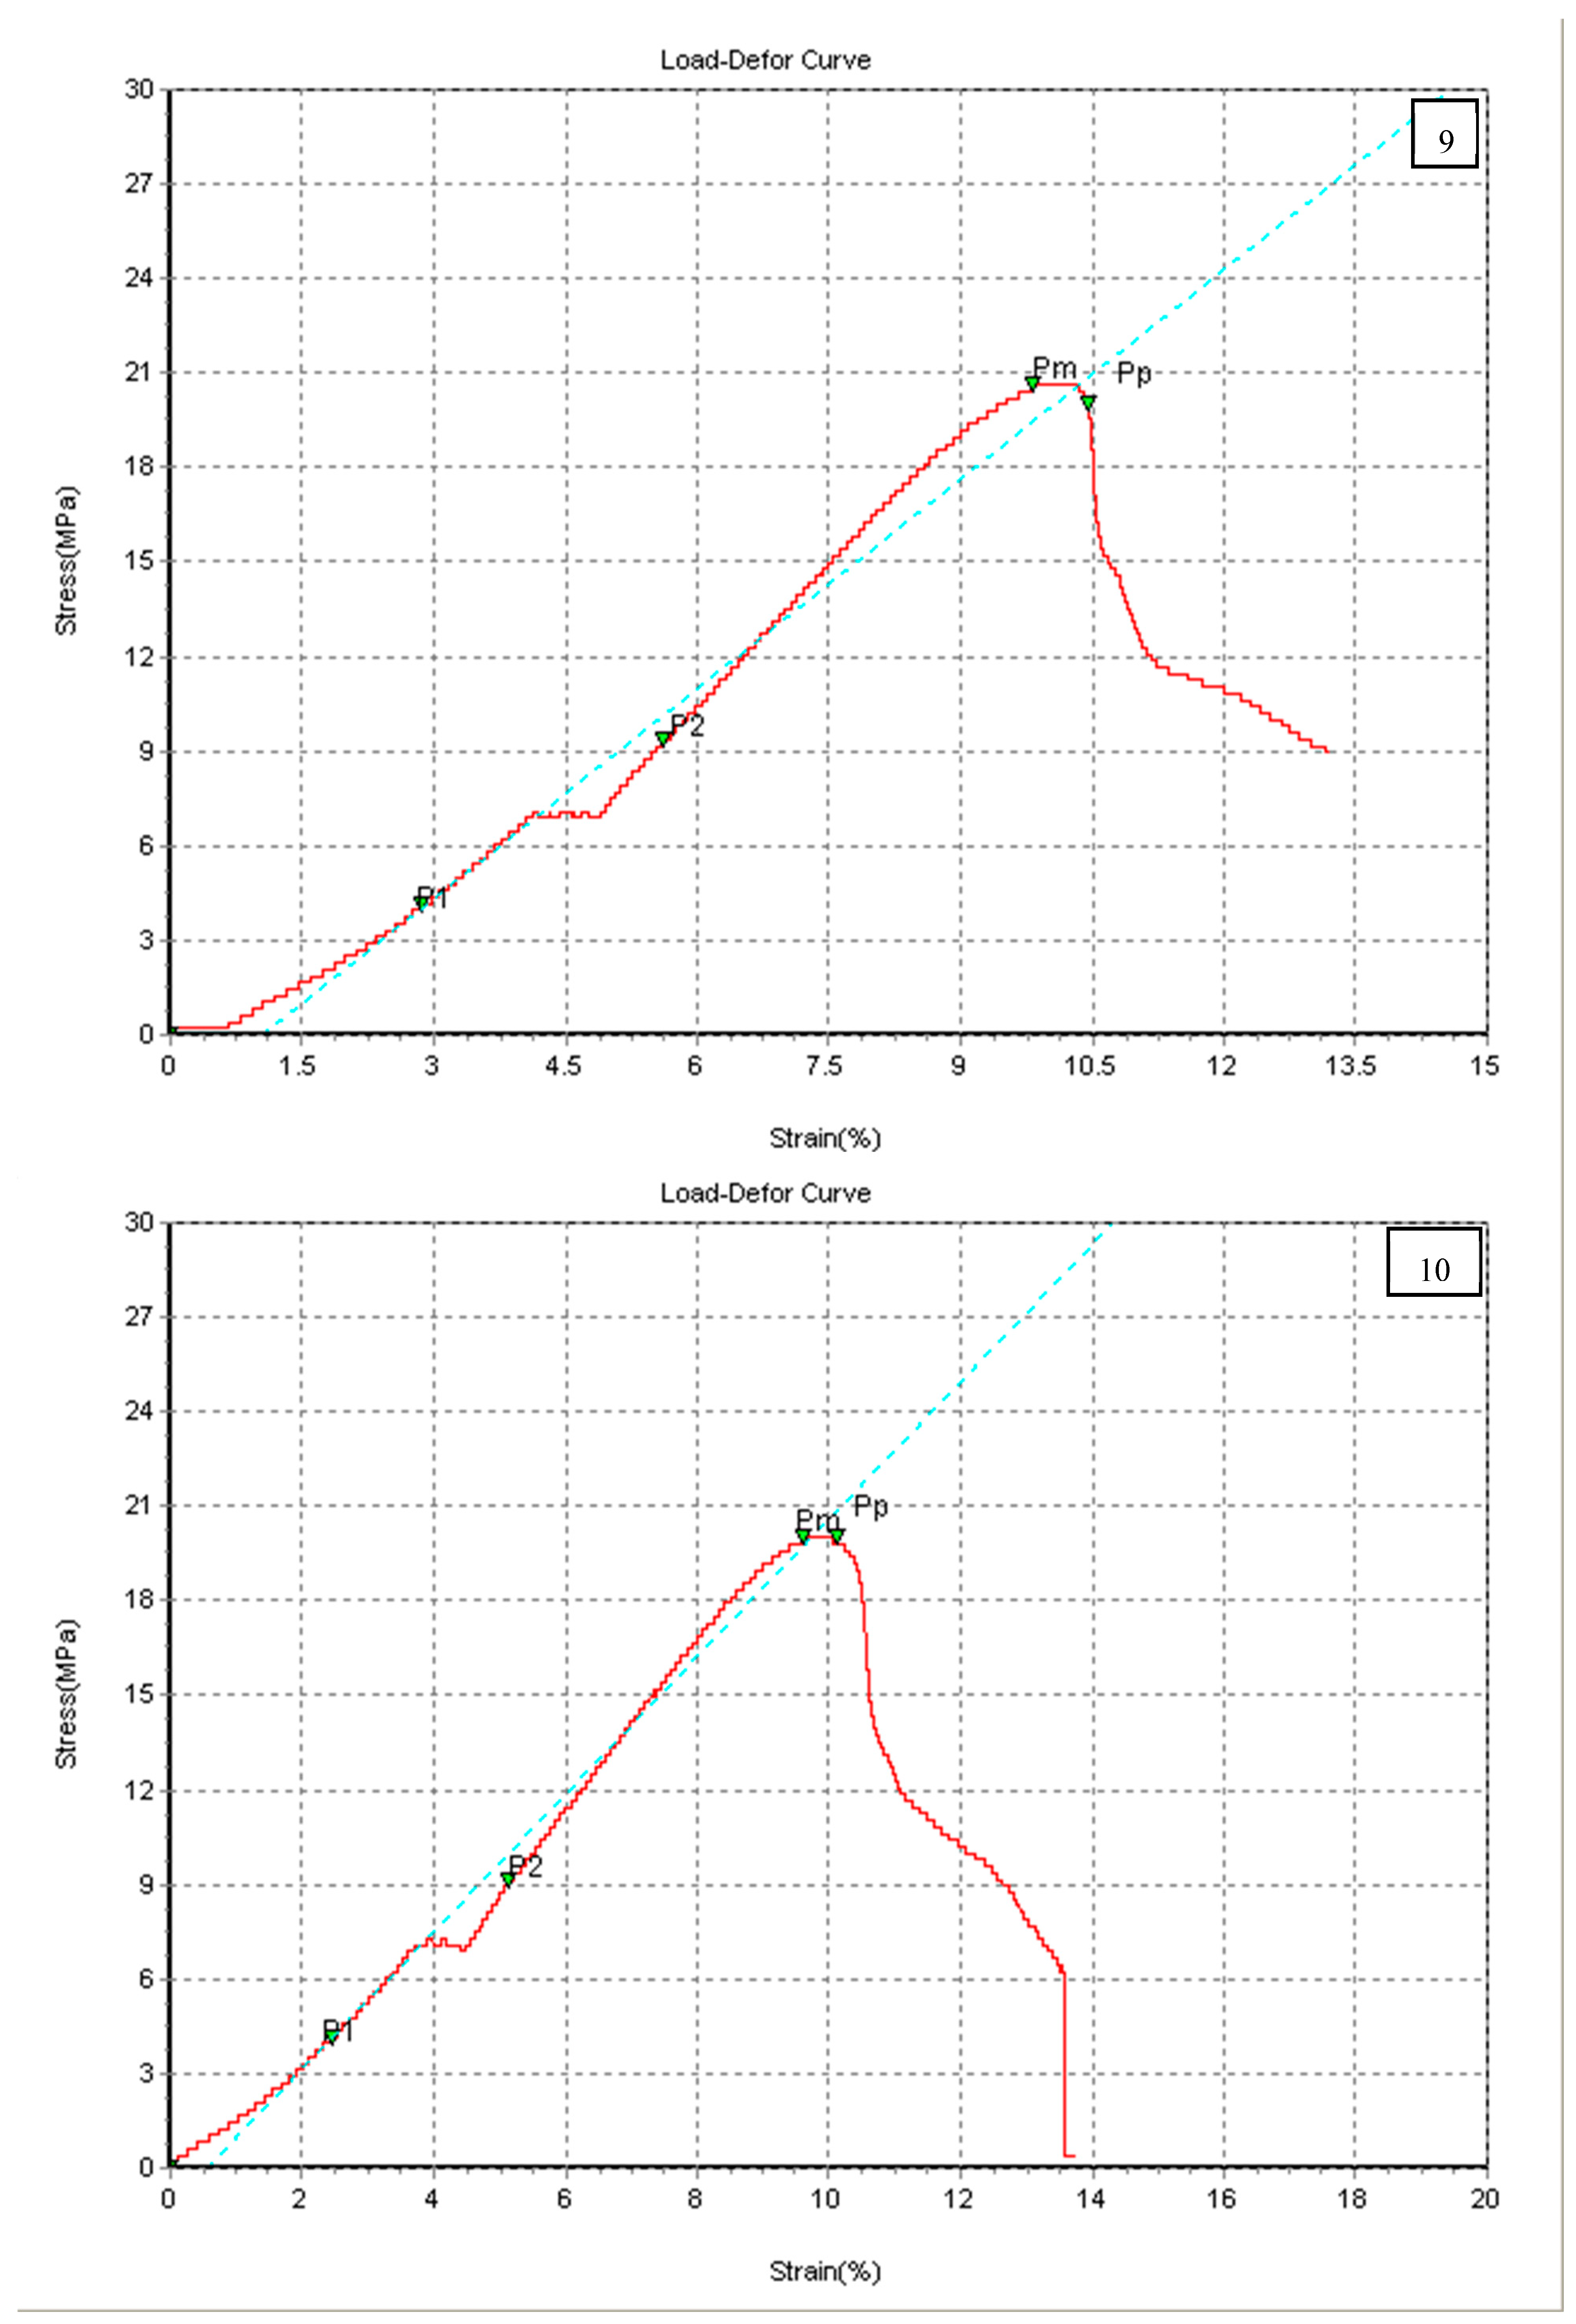
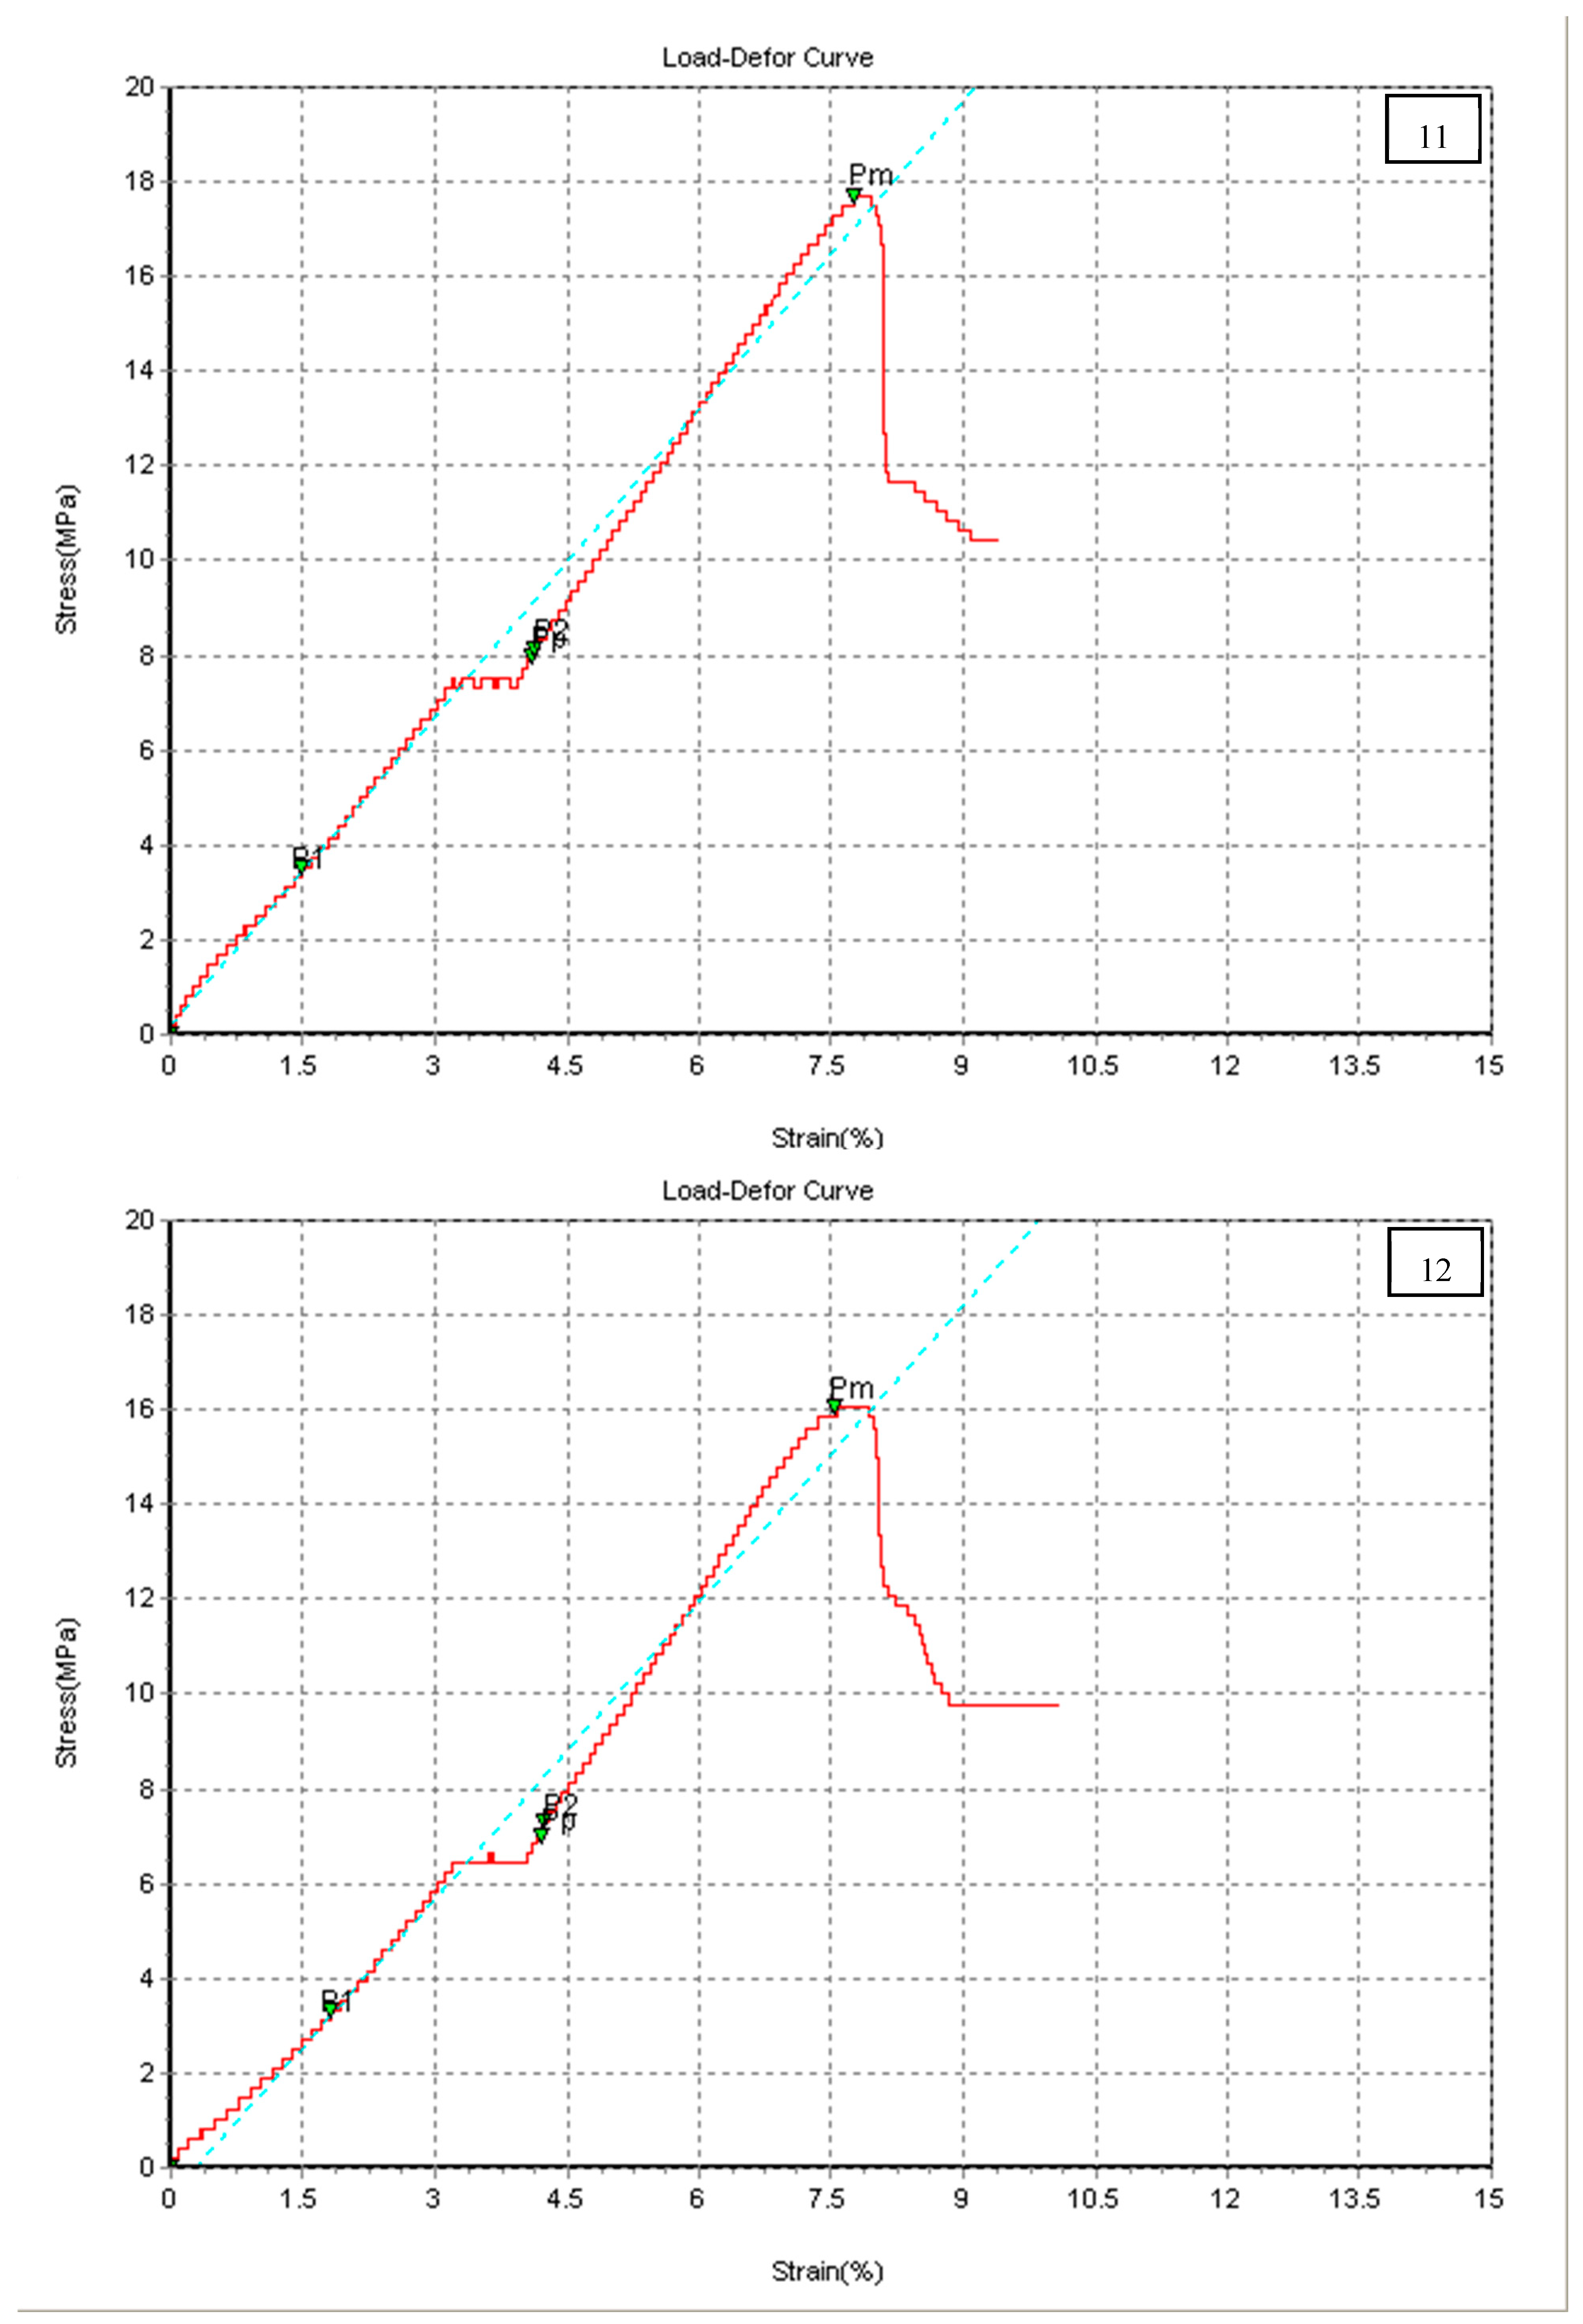
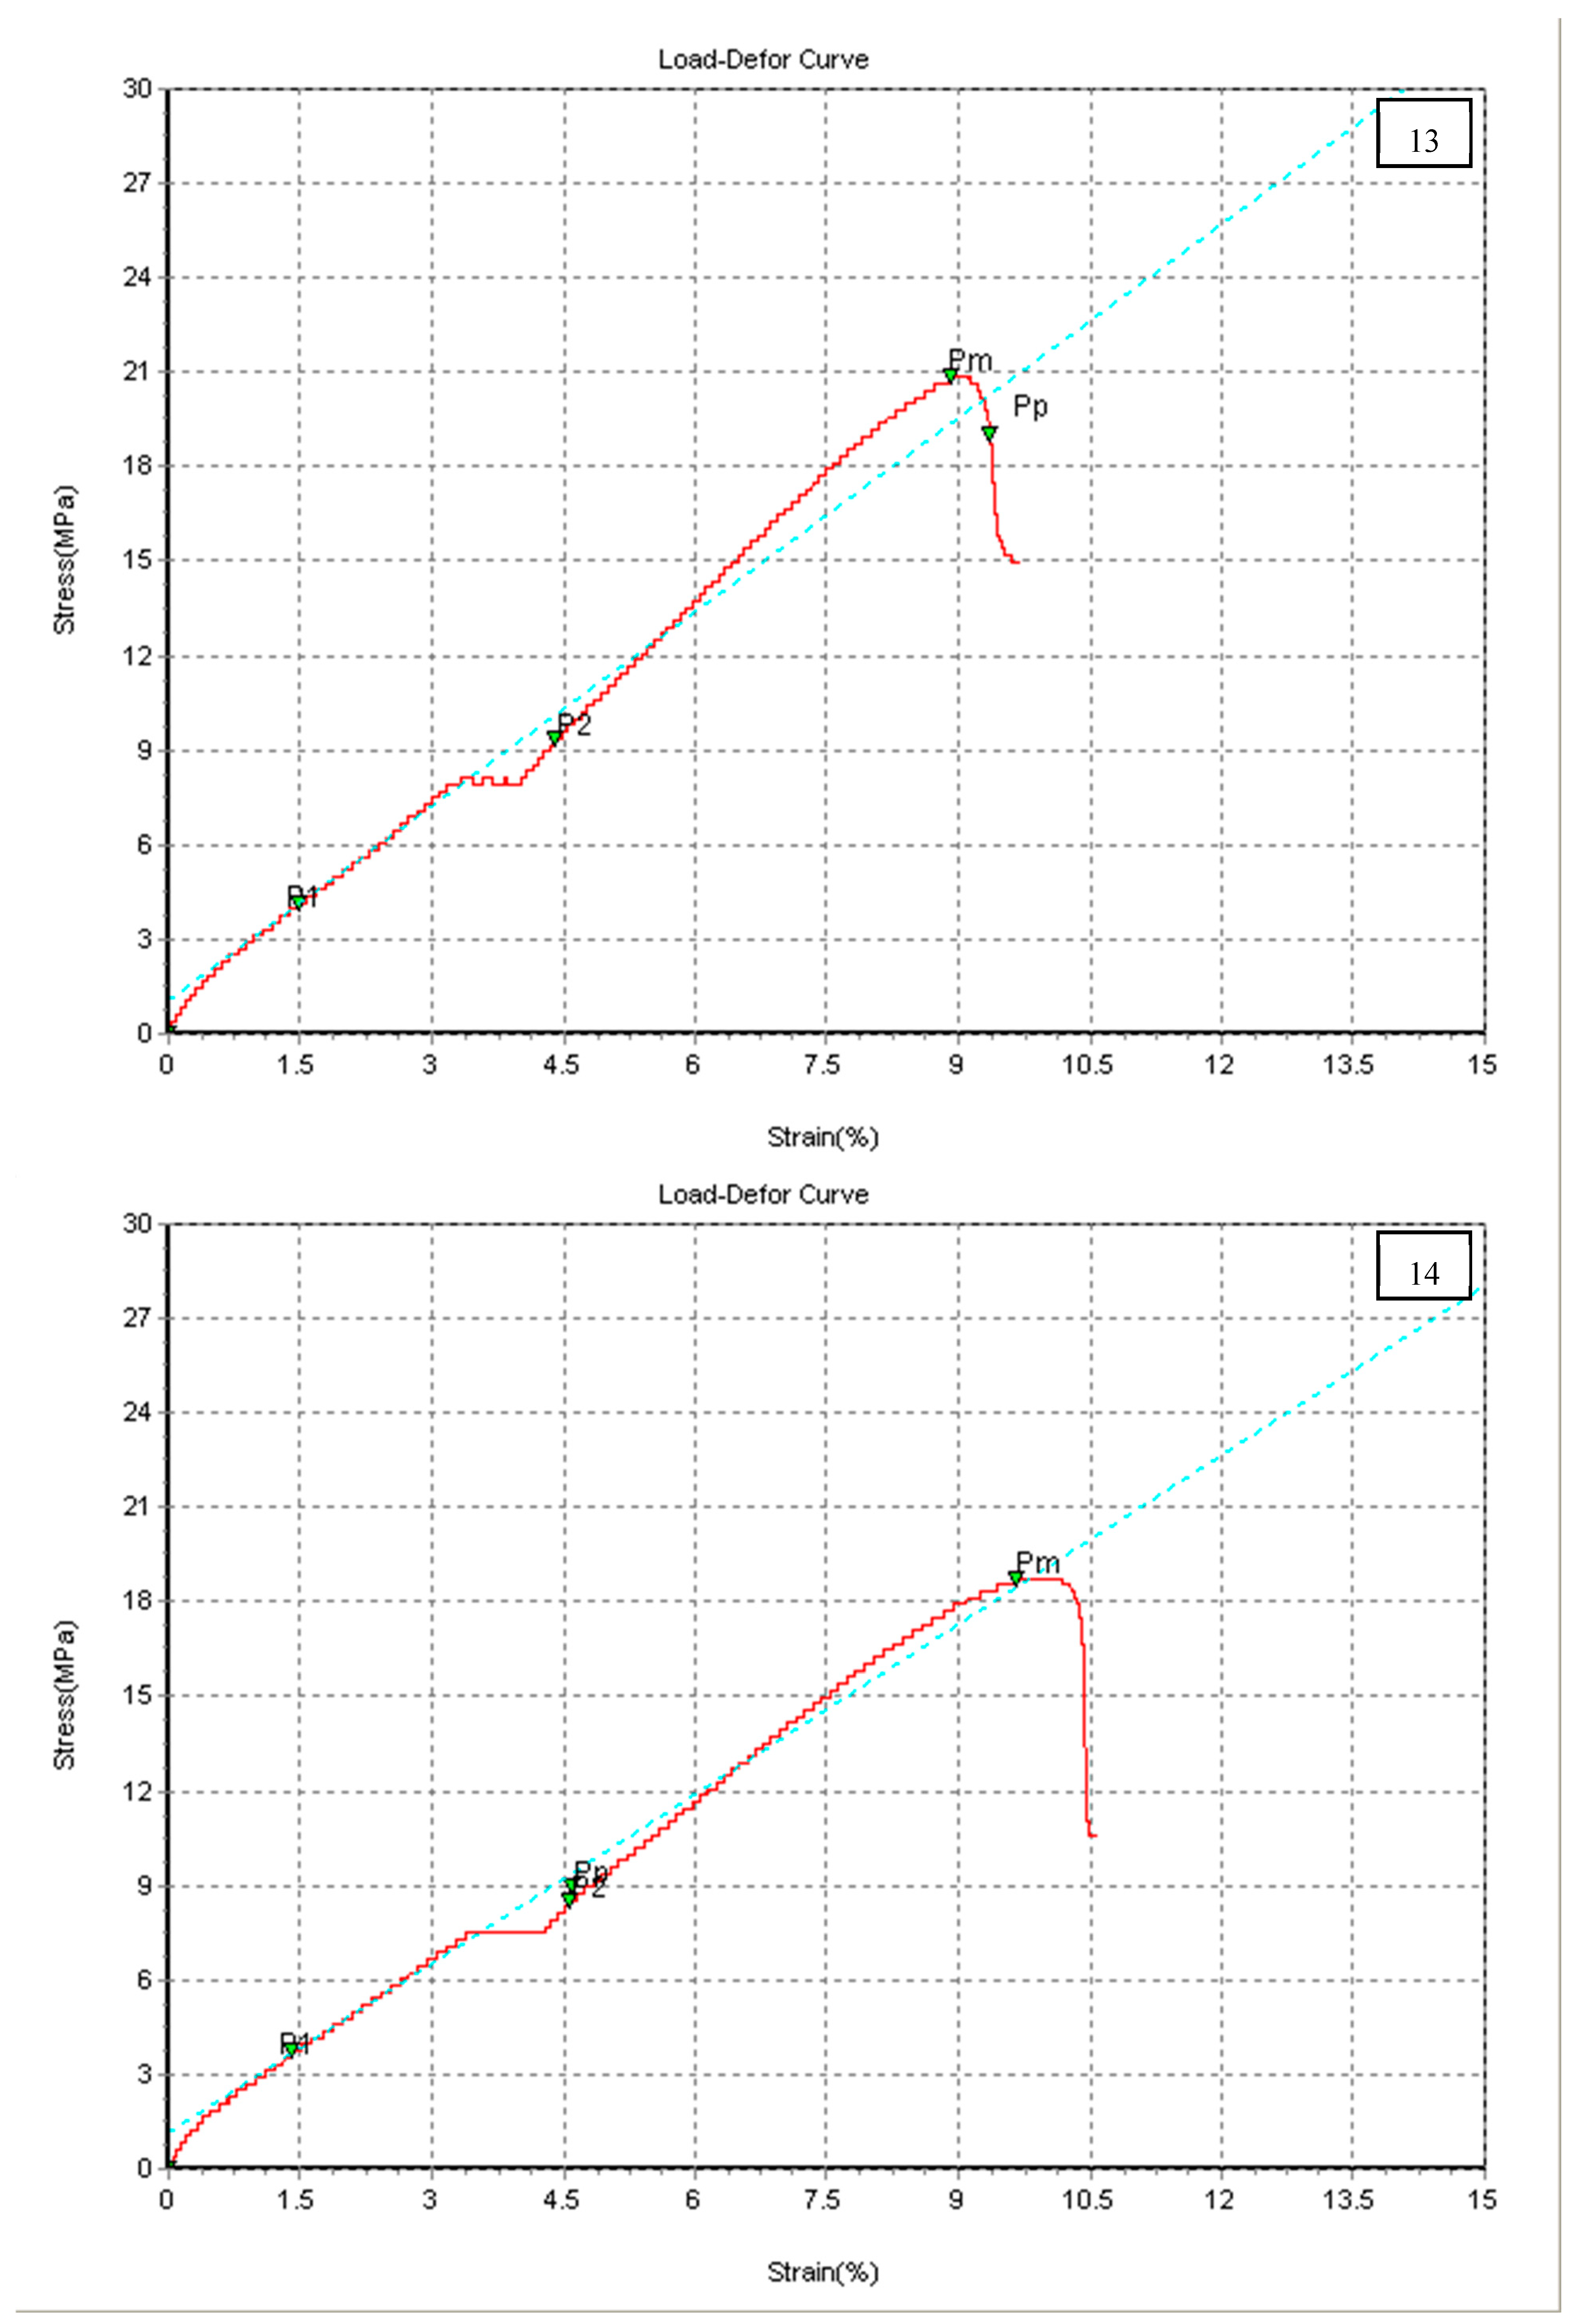
The second group was the PETG specimens, which were also tested using the tensile test machine, and their mechanical properties were tabulated in
Table 3 and presented in
Figure 5. The same selected patterns and 3D-printed parameters in PLA were applied for PETG as well as PLA+. The maximum tensile strength and Young’s modulus were recorded for the Gyroid pattern (specimen 13) with good strain at the break %. Bad performance, in terms of the mechanical properties, was obtained by the grid pattern. Two other patterns achieved a tensile strength around 20.0 MPa, which were the concentric and zigzag patterns.
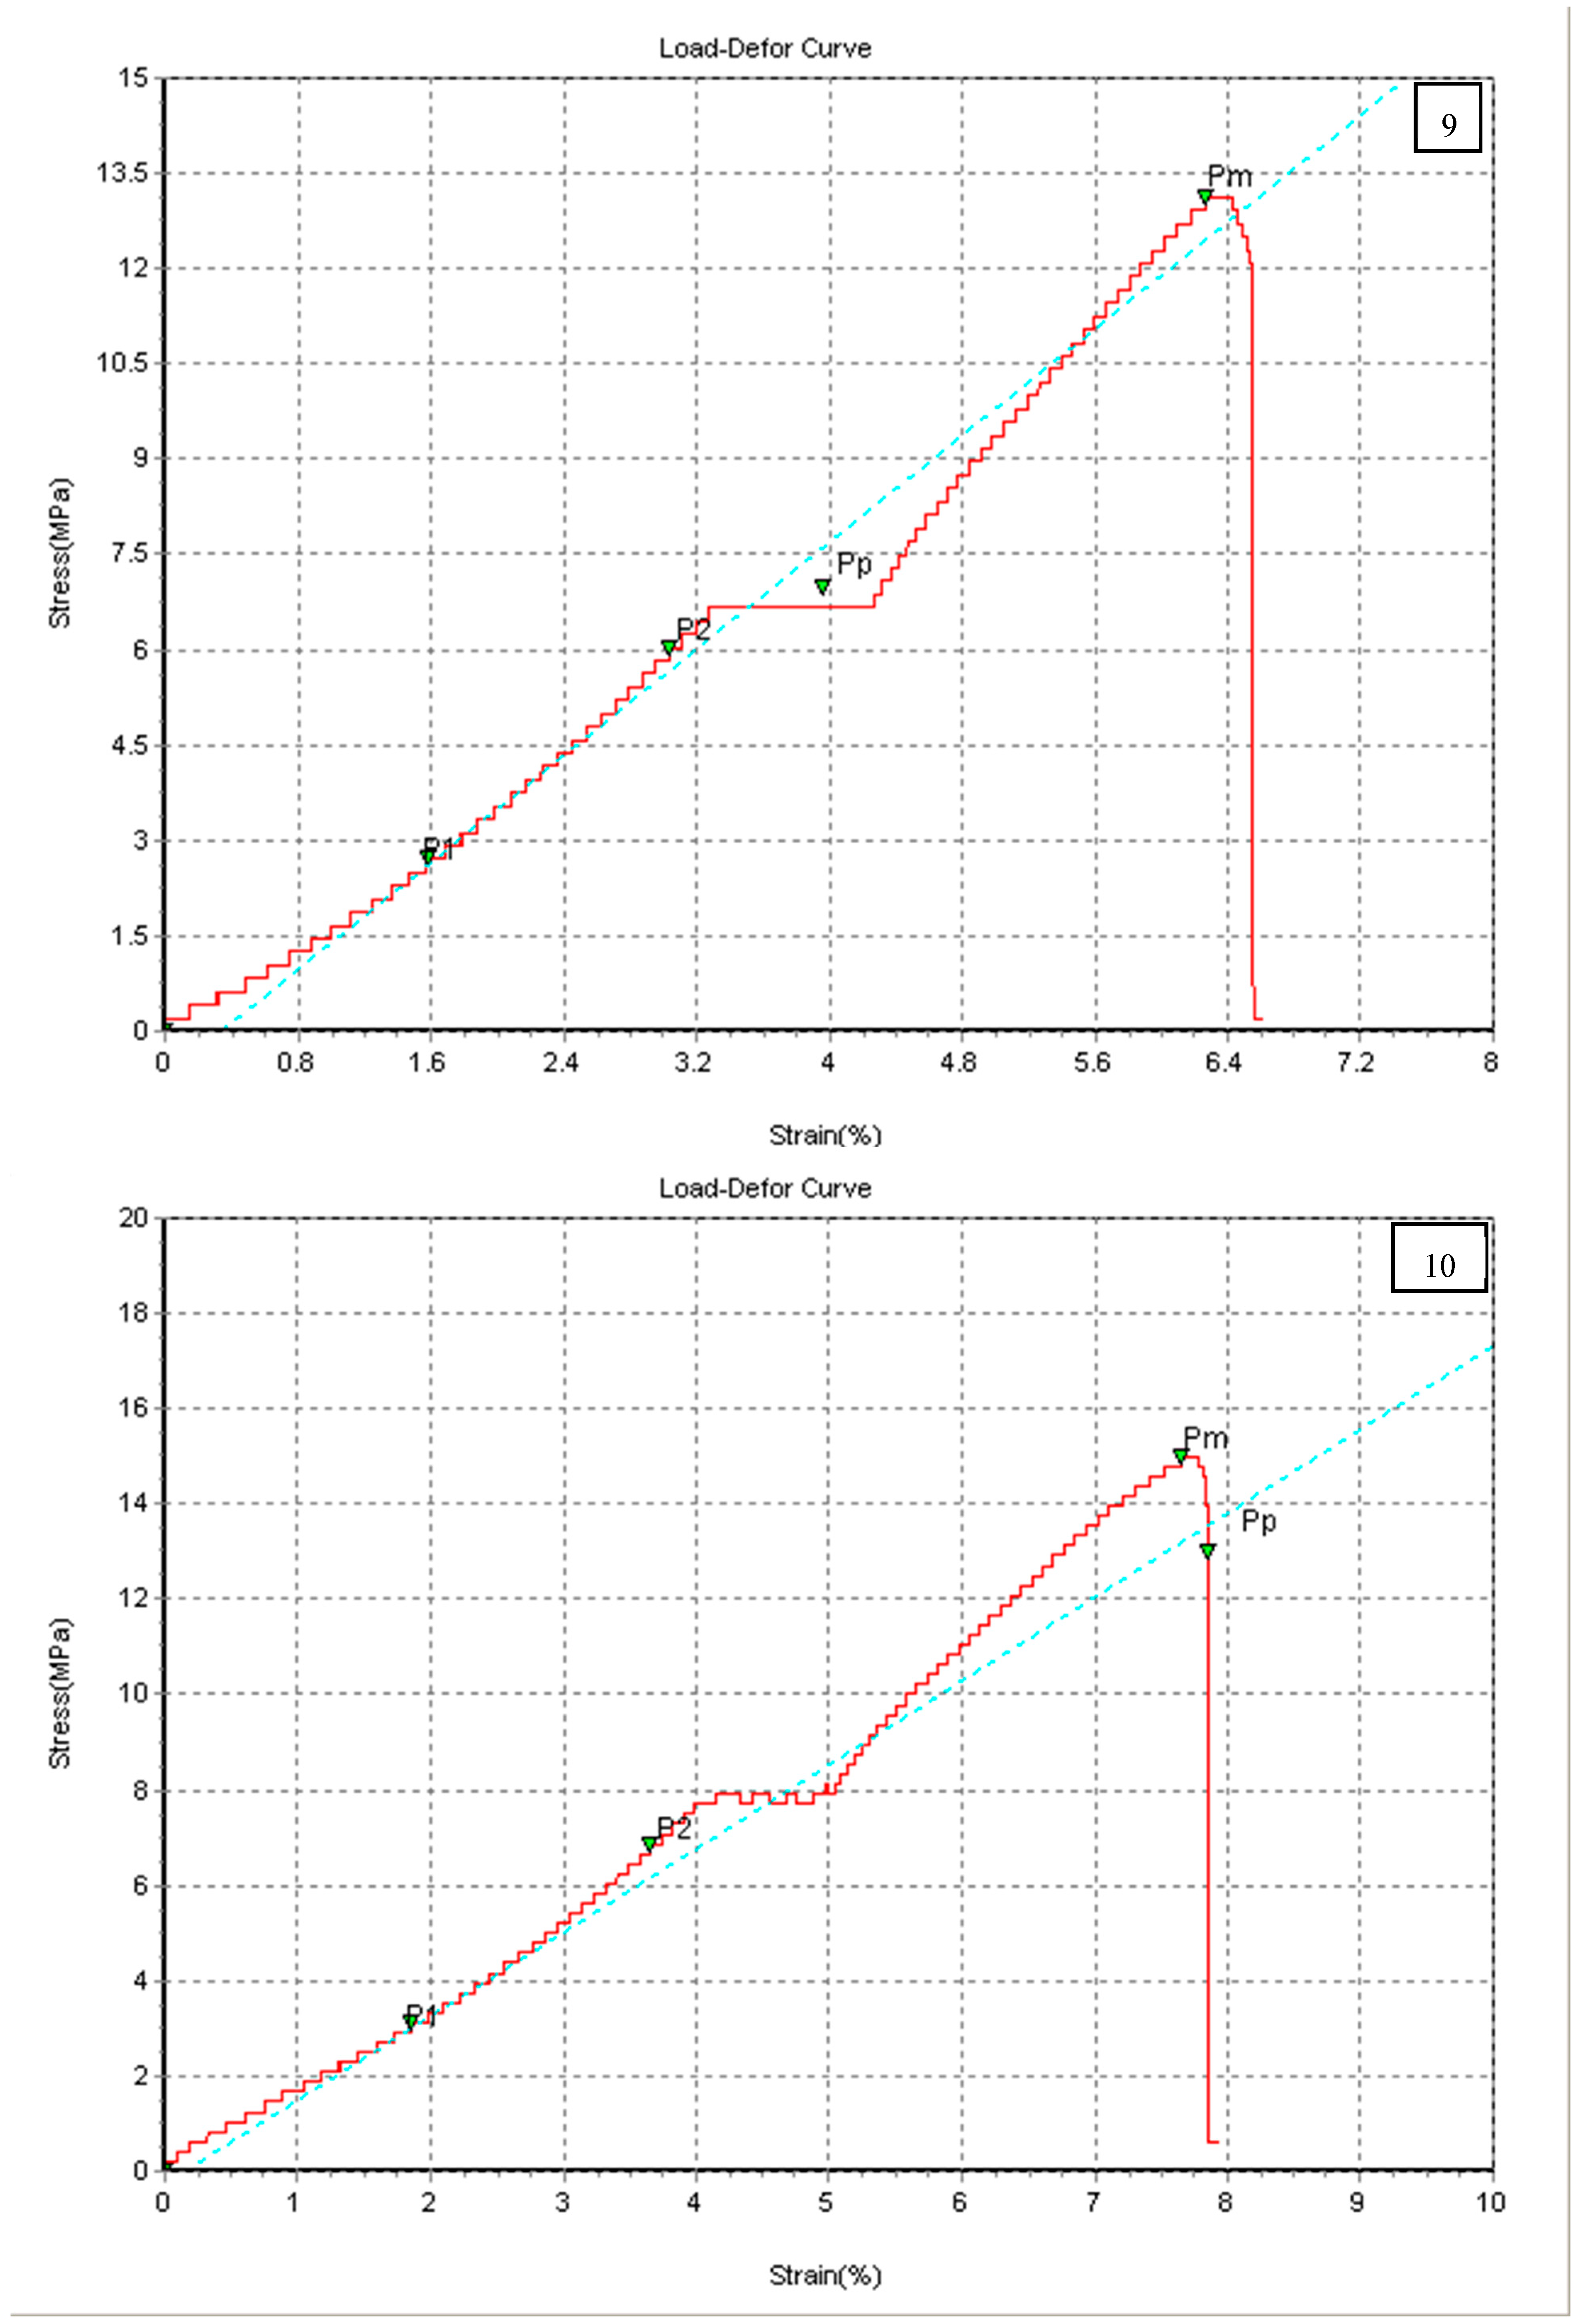
Finally, the tensile test was also applied for the third group (i.e., PLA+ specimens).
Table 4 shows the measured mechanical properties, which themselves were calculated from the stress–strain curves in
Figure 6. Specimen 9, with the concentric pattern, produced a maximum tensile strength of 16.5 MPa with a good Young’s modulus and strain at break (2.4 Gpa and 17%, respectively). No specimen exhibited bad performance for the PLA+ group.
In summation, both data visualization formats (i.e.,
Table 2,
Table 3 and
Table 4 and
Figure 4,
Figure 5 and
Figure 6) reveal that specimens 5, 13, and 9 with cubic, gyroid, and concentric patterns, which stand for PLA, PETG, and PLA+, attained the maximum ultimate tensile strength with a good Young’s modulus and strain at break % based on the selected printing parameters. For comparison purposes, the average and standard deviation is taken for the mechanical properties of the three materials to generate
Table 5.
It can be seen from the above table that the highest average strength was recorded for PETG followed by PLA+ and PLA. With respect to Young’s modulus and strain at break %, the PLA+ was stiffer than PETG and PLA. On the other side, the PLA+ shows minimum scattering around the mean in terms of the standard deviation for the tensile strength and Young’s modulus, which were 1.0 and 0.3, respectively. It points out that PLA+ was less influenced by the 14 different patterns compared with PETG and PLA. This is obvious from
Table 4, where mechanical properties for all patterns were near each other, unlike the other two materials.
To explain such variability in the measured mechanical properties (particularly ultimate tensile strength) between the specimens in each group and between the groups themselves, certain points have to be put in mind. Firstly, the cross-sectional area (width × thickness) is not a solid section because it is printed with 20% infill density. Secondly, it is well-know that the ratio of applied perpendicular tensile force to the cross-section area of all specimens stands for the applied stress and, in this case, the section is varied (in structure but not in dimensions) from specimen to specimen and group to group due to different printed patterns and materials. Finally, the bonding between layer and layer in the same specimen is different based on such variability. Therefore, the response (represented by the mechanical properties) of different specimens and groups were varied to the applied normal tensile stress. On the other hand, the obtained ductility was comparable between all of the specimens within each group. Finally, Young’s modulus was relatively similar for each group material due to fact that Young’s modulus is an indicator for how strong the atoms and molecules are bonded. According to the four elements of material’s science and engineering, the final properties are a function of the arranged internal structure, which is influenced by the type of the processing method and its parameters.
Bellehumeur et al. [
26] ascribed the behavior of the mechanical properties of 3D-printed materials to the interaction influences of three resistances, namely filament resistance itself, the joint resistance between the filaments of each layer, and joint resistance between layers themselves. The first resistance is correlated with the mechanical properties of original raw material of filaments, the second and third resistances depend on the bonding energies between the filaments within the same layer and the cohesion between the layers themselves. The printed part involves two segments: the contour and infill pattern. The contour acts as a delimitation skin of the part perimeter, while the empty space inside that contour is filled by the nozzle, which follows the trajectories based on the selected infill pattern. Therefore, the contour is formed first followed by the selected infill that produces different mechanical properties [
27]. During the tensile test, the cracks initiation and fracture occurs in the interlayer bonding zone between the layers of the specimens where the crack propagates and grows in the infill pattern until fracturing within the gauge length zone [
28].
3.2. Surface Characteristics of PLA, PLA+, and PETG 3D Printed Materials
The surface roughness is considered as the most quality index for parts processed by various manufacturing processes [
29]. Thus, in this study, all the 3D-printed materials were subjected to surface roughness measurements in terms of Ra, Rz, and Rt. Three measurements were taken at different locations and averaged. All the averaged measurements are tabulated.
Table 6 shows the measured average surface roughness of the PLA group for the whole 14-pattern set. It can be seen from the table that the three measures of surface roughness were presented, namely Ra, Rz, and Rt. The minimum values of these roughness measures were recorded for the cross-pattern structure (specimen 11). In contrast, the corresponding maximum values were achieved by specimen 6 (cubic subdivision pattern). Other patterns recorded values fluctuating between the minimum and maximum limits.
The surface roughness of the PETG group was depicted in
Table 7. For this material group, 4.8 µm, 24.1 µm, and 35.2 µm were the minimum surface roughness measures that were obtained by the quarter cubic pattern (specimen 8). It is coarser than the corresponding values of PLA specimen 9. Other specimens from the PETG group generated higher values up to 7.5 µm, 33. 6 µm, and 45.8 µm for specimen 3 with a triangle pattern.
Finally, the surface roughness of the PLA+ group is presented in
Table 8. Better roughness measures were recorded by specimen 9 with the concentric pattern, where it achieved 4.2 µm, 30.1 µm, and 31.9 µm. Other specimens produced values near and far from the minimum roughness measures.
If the average and standard deviation is taken for surface roughness measures of all three materials,
Table 9 is produced.
In terms of the average Ra, Rz, and Rt, PLA won the competition with the lowest values (5.1 µm, 27.9 µm, and 50.0 µm) because it is known that PLA has a low melt viscosity, which is reflected by the surface texture. In contrast, the minimum level of scattering around the mean was recorded for PETG followed by PLA+. This means that those two materials were slightly affected by changing the pattern structure compared with PLA, which shows significant influence, keeping in mind that the applied infill density was low (20%) and other printing parameters are kept constant. The layering nature of the FDM process, besides different infills being applied and the tessellation process, stands for such variety in the surface quality of the specimens [
30]. The improvement in the surface roughness is possible using various postprocessing techniques [
31].


