3.3. Control Performance with Setpoint Change
The performance control of MMPC on the compressor unit with the MIMO 1 model is shown in
Figure 3,
Figure 4,
Figure 5 and
Figure 6, with a change in SP of 7 kPa. MMPC provided better results than MPC. When the setpoint on compressor unit 1 was increased, the MMPC could respond more quickly to the change. Both MPC and MMPC on compressor 1 experienced an increase in pressure until they passed the SP (i.e., overshoot occurs), then decreased until reaching the SP. As a result of the change in SP of compressor 1, the pressure of the other compressor changed (interrupted). However, the MMPC managed to return to its SP better than MPC, as can be seen in
Figure 3b–d. For compressor units 1–4, the IAE and ISE values of MMPC FT showed a significant difference from those of MPC. Meanwhile, the IAE and ISE values between MMPC S&C and MMPC FT did not have a significant difference, as shown in
Table 7. Similar results occurred in the SP change test on compressors 2–4, as shown in
Table 8,
Table 9 and
Table 10. All the CVs demonstrated final stability at their SP (0). Some of the IAE and ISE of MMPC FT and S&C had the same result but different percentages of improvement. This is caused by the calculations in the spreadsheet being performed with decimals up to ten decimal digits. Meanwhile, the results provided in this research were decimal numbers with two decimal digits.
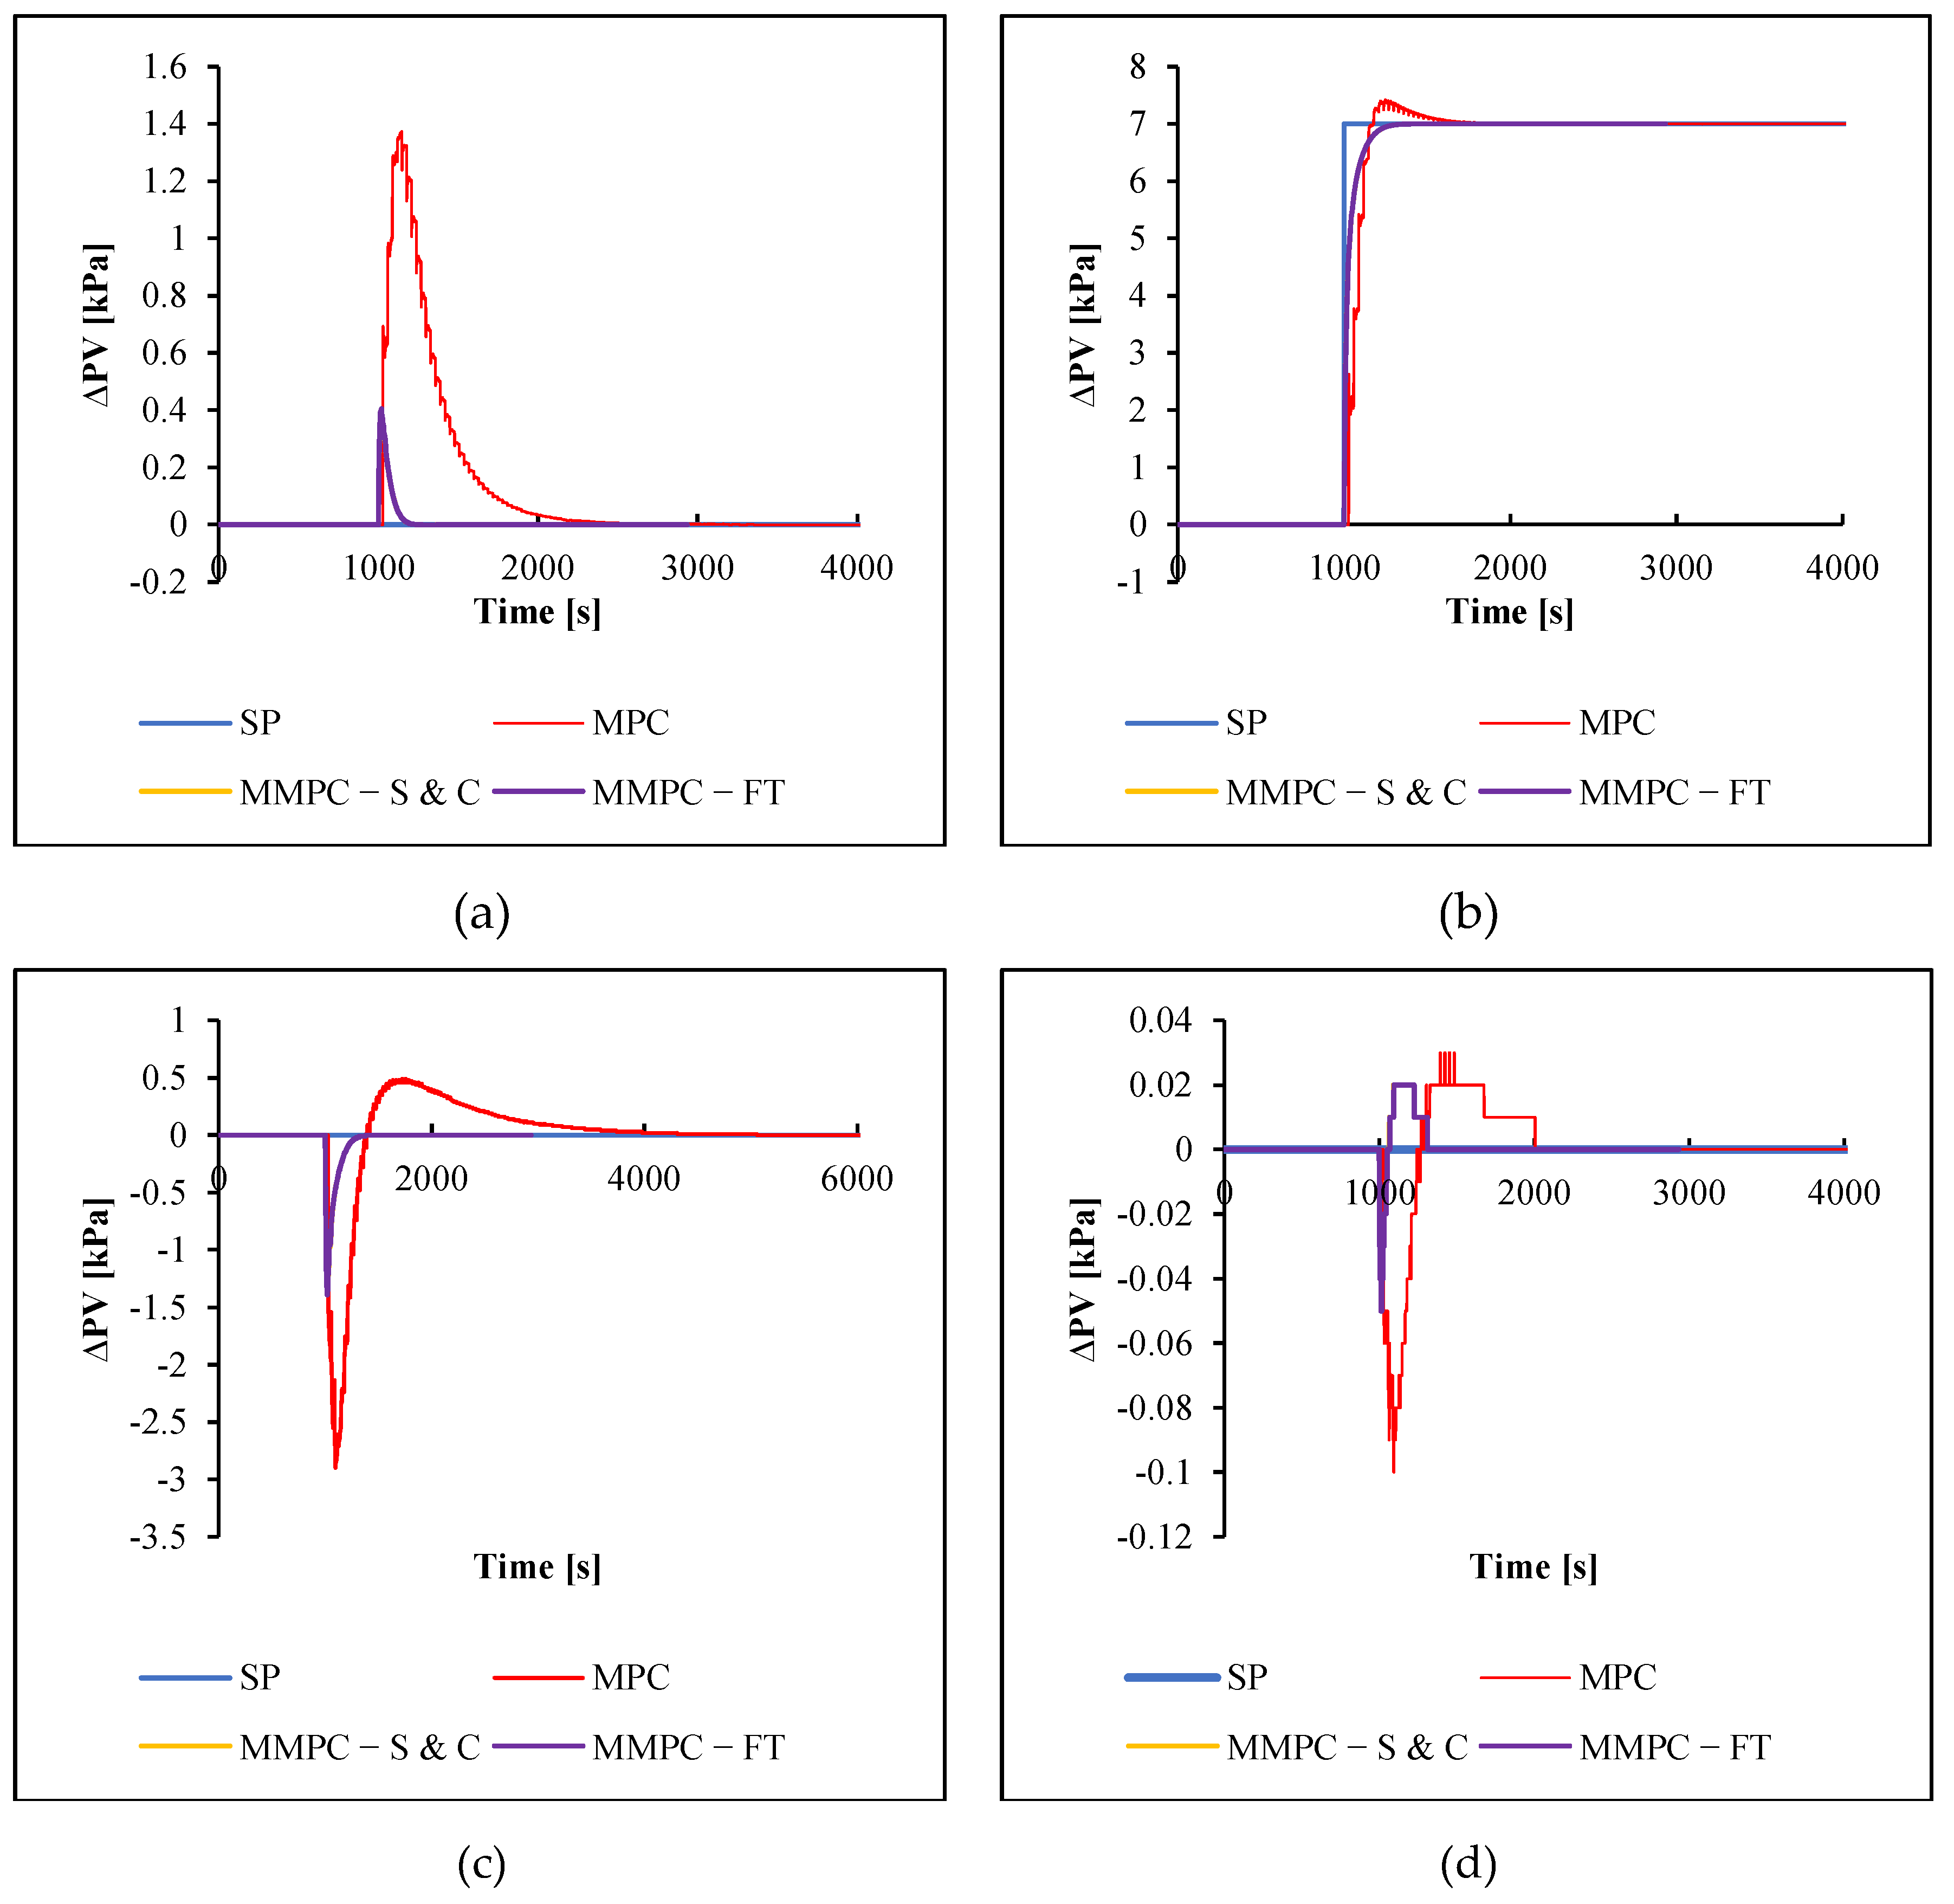
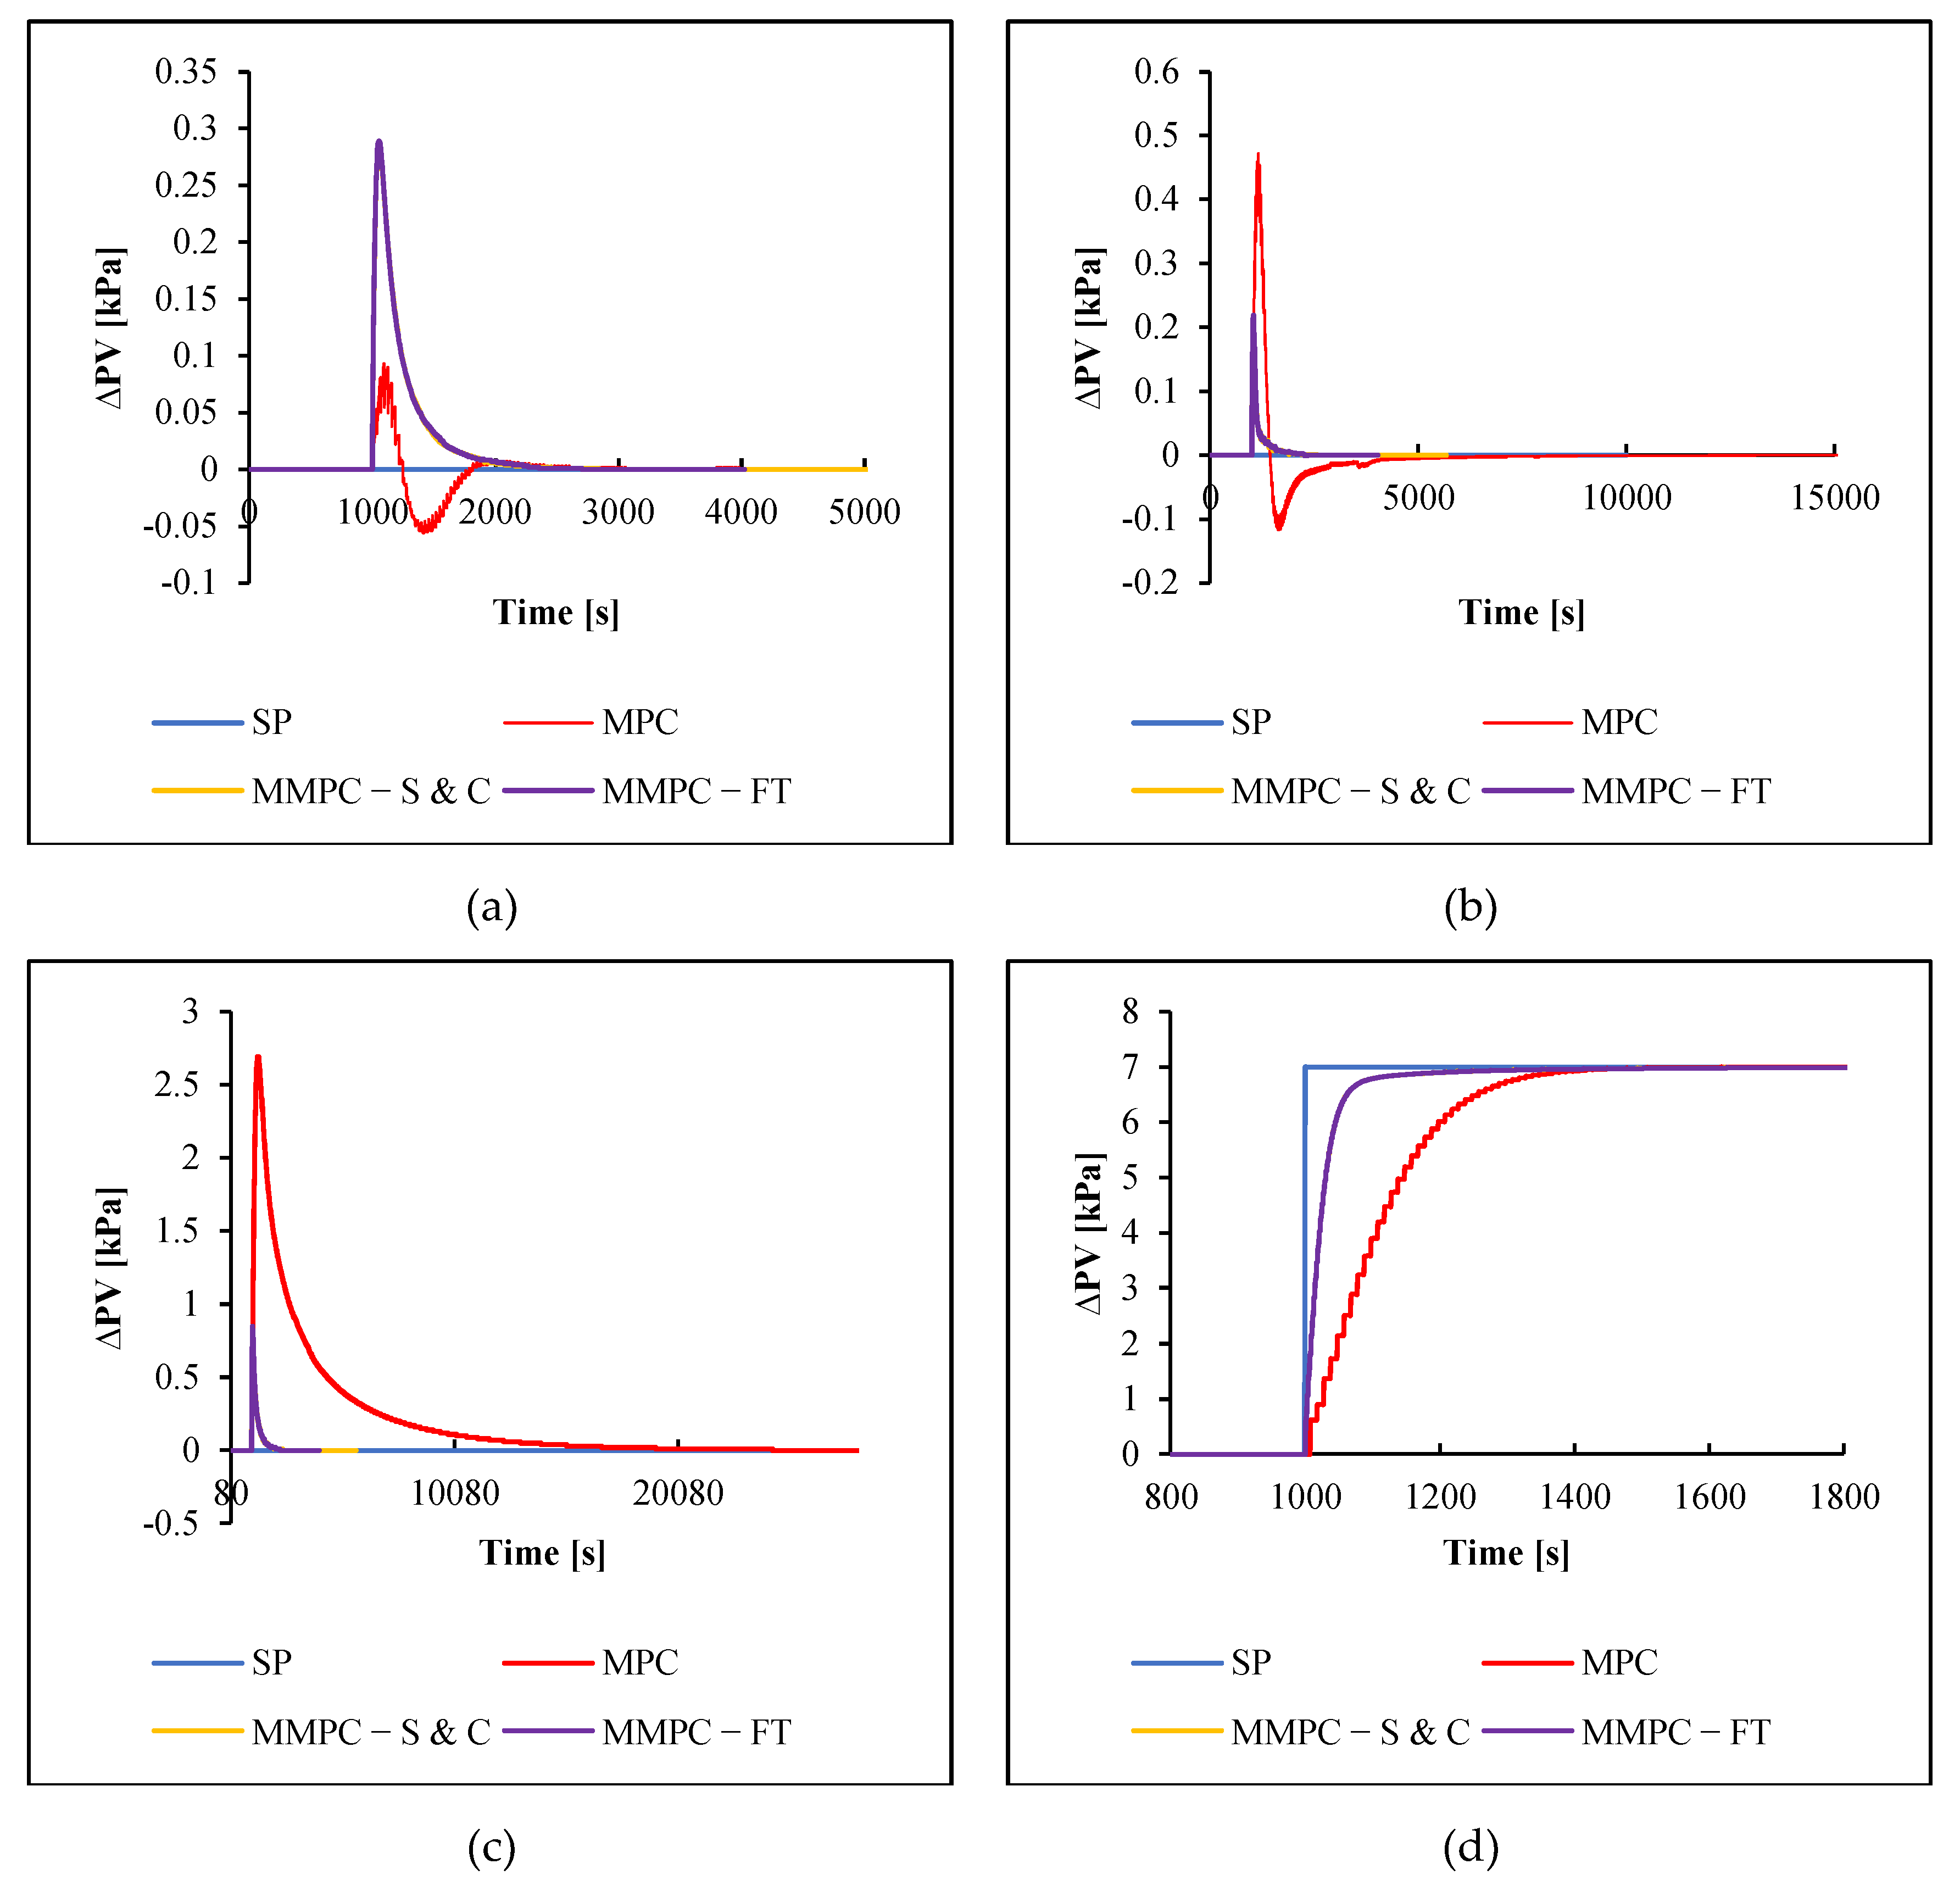
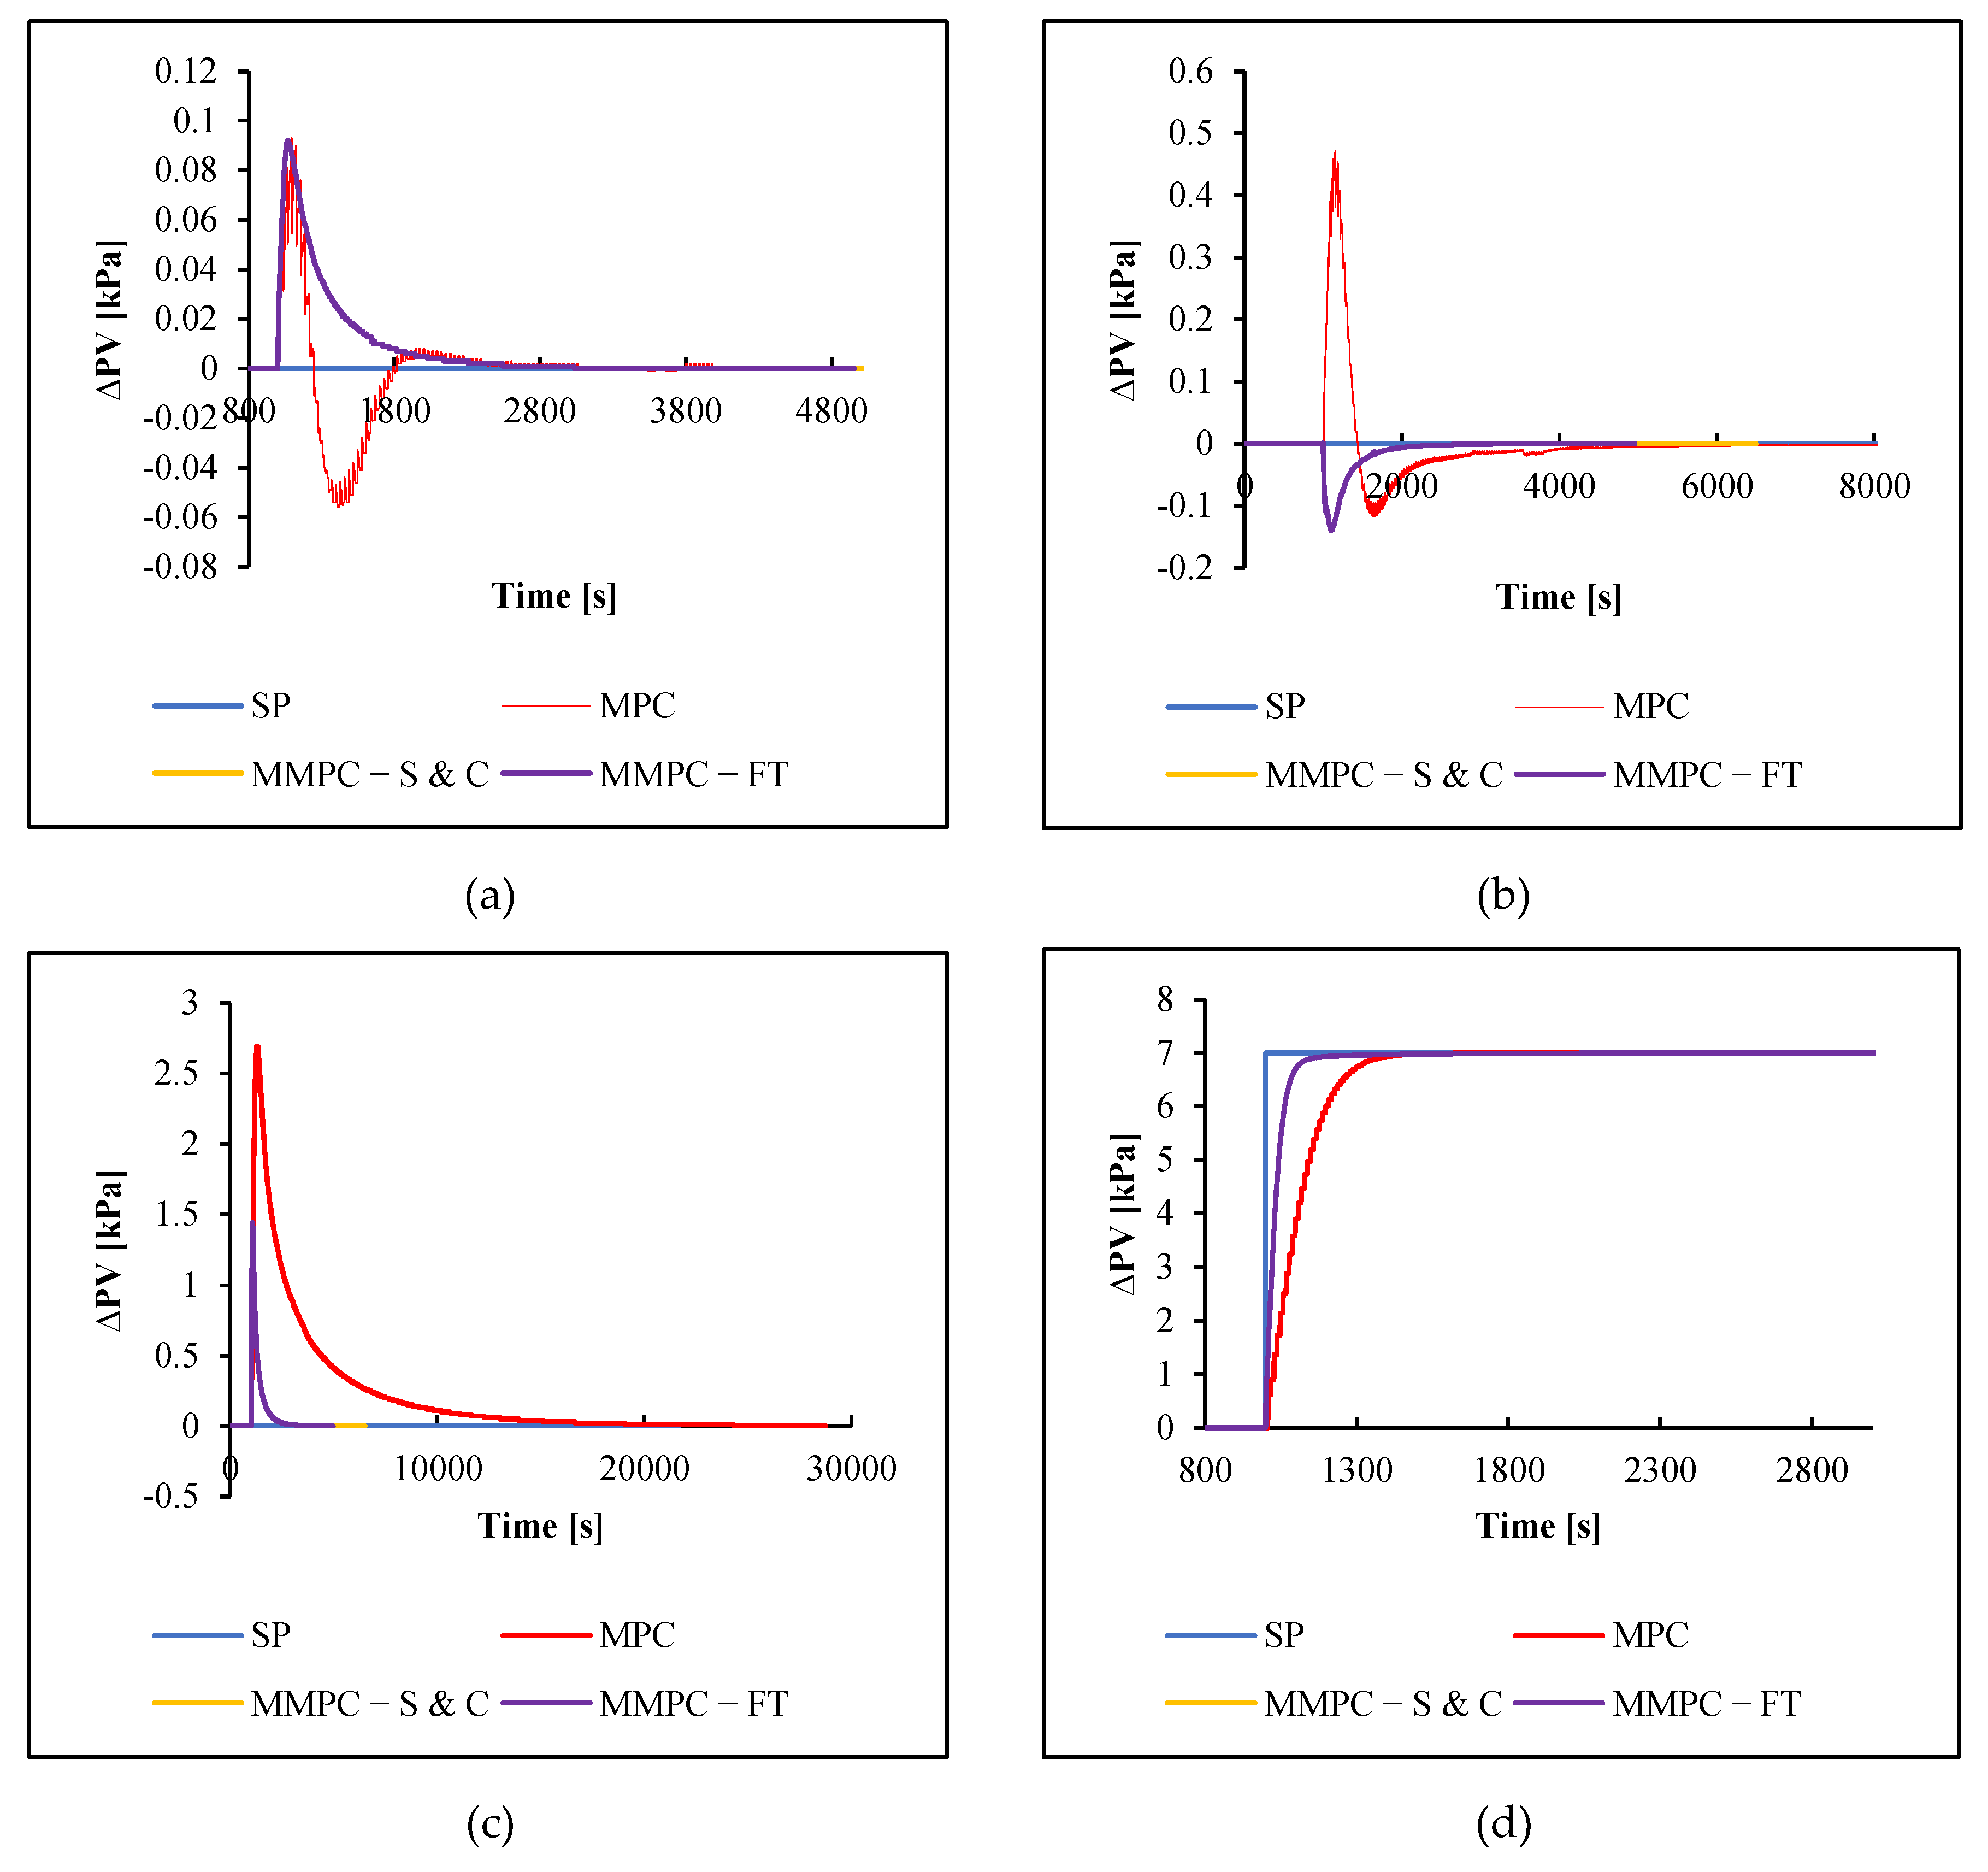
Figure 3 shows the results with the increased SP on compressor unit 1. The change in the SP of compressor unit 1 can be seen in
Figure 3a. The simulation results showed that in each compressor unit, MPC responded and achieved stability more slowly than MMPC. In addition, MMPC S&C and FT provided almost the same results and showed barely any difference in the graphs. However, the difference in the performance of the two controllers can be seen in the IAE and ISE, which are listed in
Table 7. When the SP on compressor unit 1 was increased, the pressure on the next compressor unit decreased. It is because when the flow pressure increases, the flow rate decreases. This pressure drop will be stabilized by the controller. In
Figure 3a, the shapes of the MMPC and MPC graphs were the same, but the MMPC responded more slowly and had almost no noise. The performance of other compressor units is shown in
Figure 3b–d, where the patterns of the three graphs are not much different. In the three graphs, generally, there was no pressure drop on the MMPC, while the MPC experienced a significant pressure drop. This is because when the pressure drops, the MMPC immediately responds to stabilize the flow according to its SP. However, before reaching stability, the flow controlled by MMPC experienced a pressure increase shortly. MMPC S&C and MMPC FT had almost the same results, but MMPC FT generally had a slightly better percentage increase in performance than MMPC S&C, except for compressor unit 2. In the compressor, both IAE was the same, and ISE MMPC S&C was slightly superior. Meanwhile, compressor unit 4 showed a better MMPC S&C.
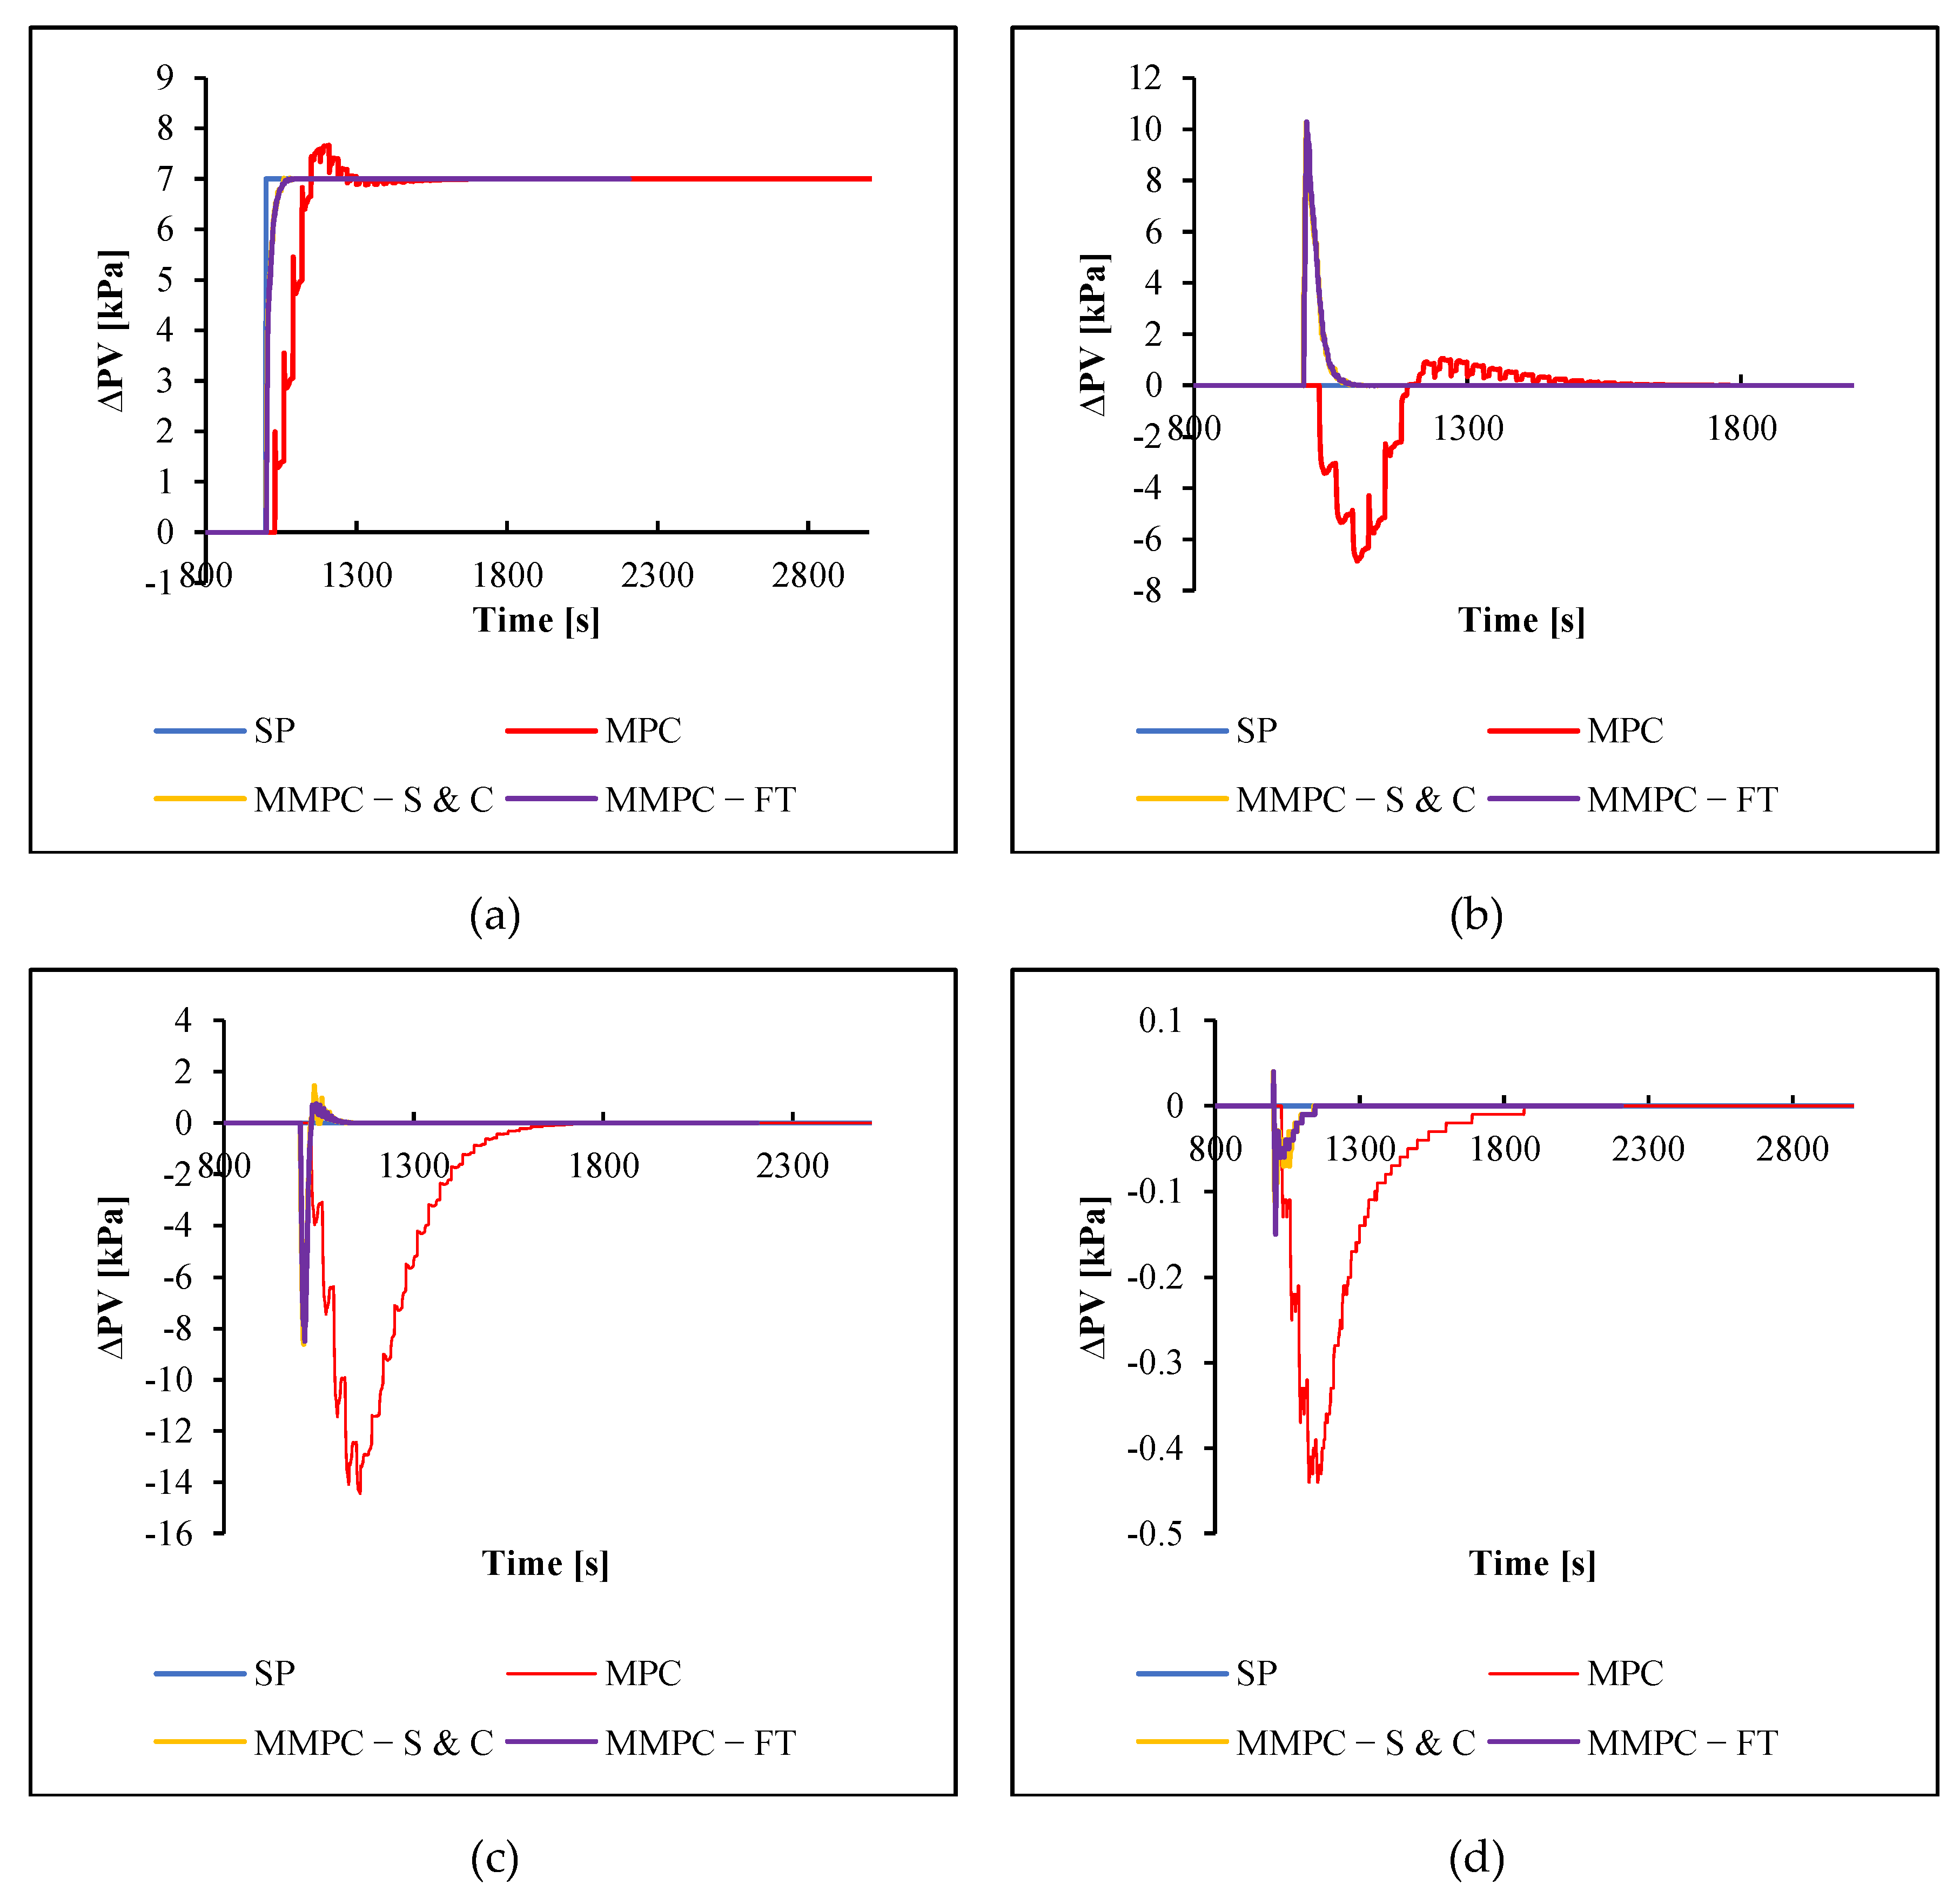
The performance of controlling the change in SP on compressor unit 2 is shown in
Figure 4 and
Table 8. The change in SP on compressor unit 2, as shown in
Figure 4b, caused an increase in pressure in compressor unit 1 and a decrease in pressure in compressor unit after compressor unit 2. It can be concluded that changes in SP in a compressor unit will cause a pressure increase in the previous unit and a pressure decrease in the following unit.
Figure 4b also shows that MMPC can immediately stabilize the pressure in the flow without having to exceed its SP, while the MPC has exceeded its SP. MMPC’s response to pressure increase in compressor unit 1 (
Figure 4a) was faster and better than MPC. It is because the flow pressure at the MMPC only experiences a slight increase and can be stabilized more quickly. In addition, the control response to the pressure drop in compressor units 3 and 4 had a similar pattern (shown in
Figure 4c,d) but with different line shapes. When the pressure decreases, the controller will respond to increase the pressure. In compressor unit 3 (
Figure 4c), the MMPC can immediately stabilize the flow pressure according to the SP, while the MPC experienced an increase first. In
Figure 4d, both MPC and MMPC experienced an increase in pressure before returning to their SP, but MMPC can restore the flow pressure according to its SP more quickly. Based on
Table 8, MMPC FT generally had better control performance results than other controllers.
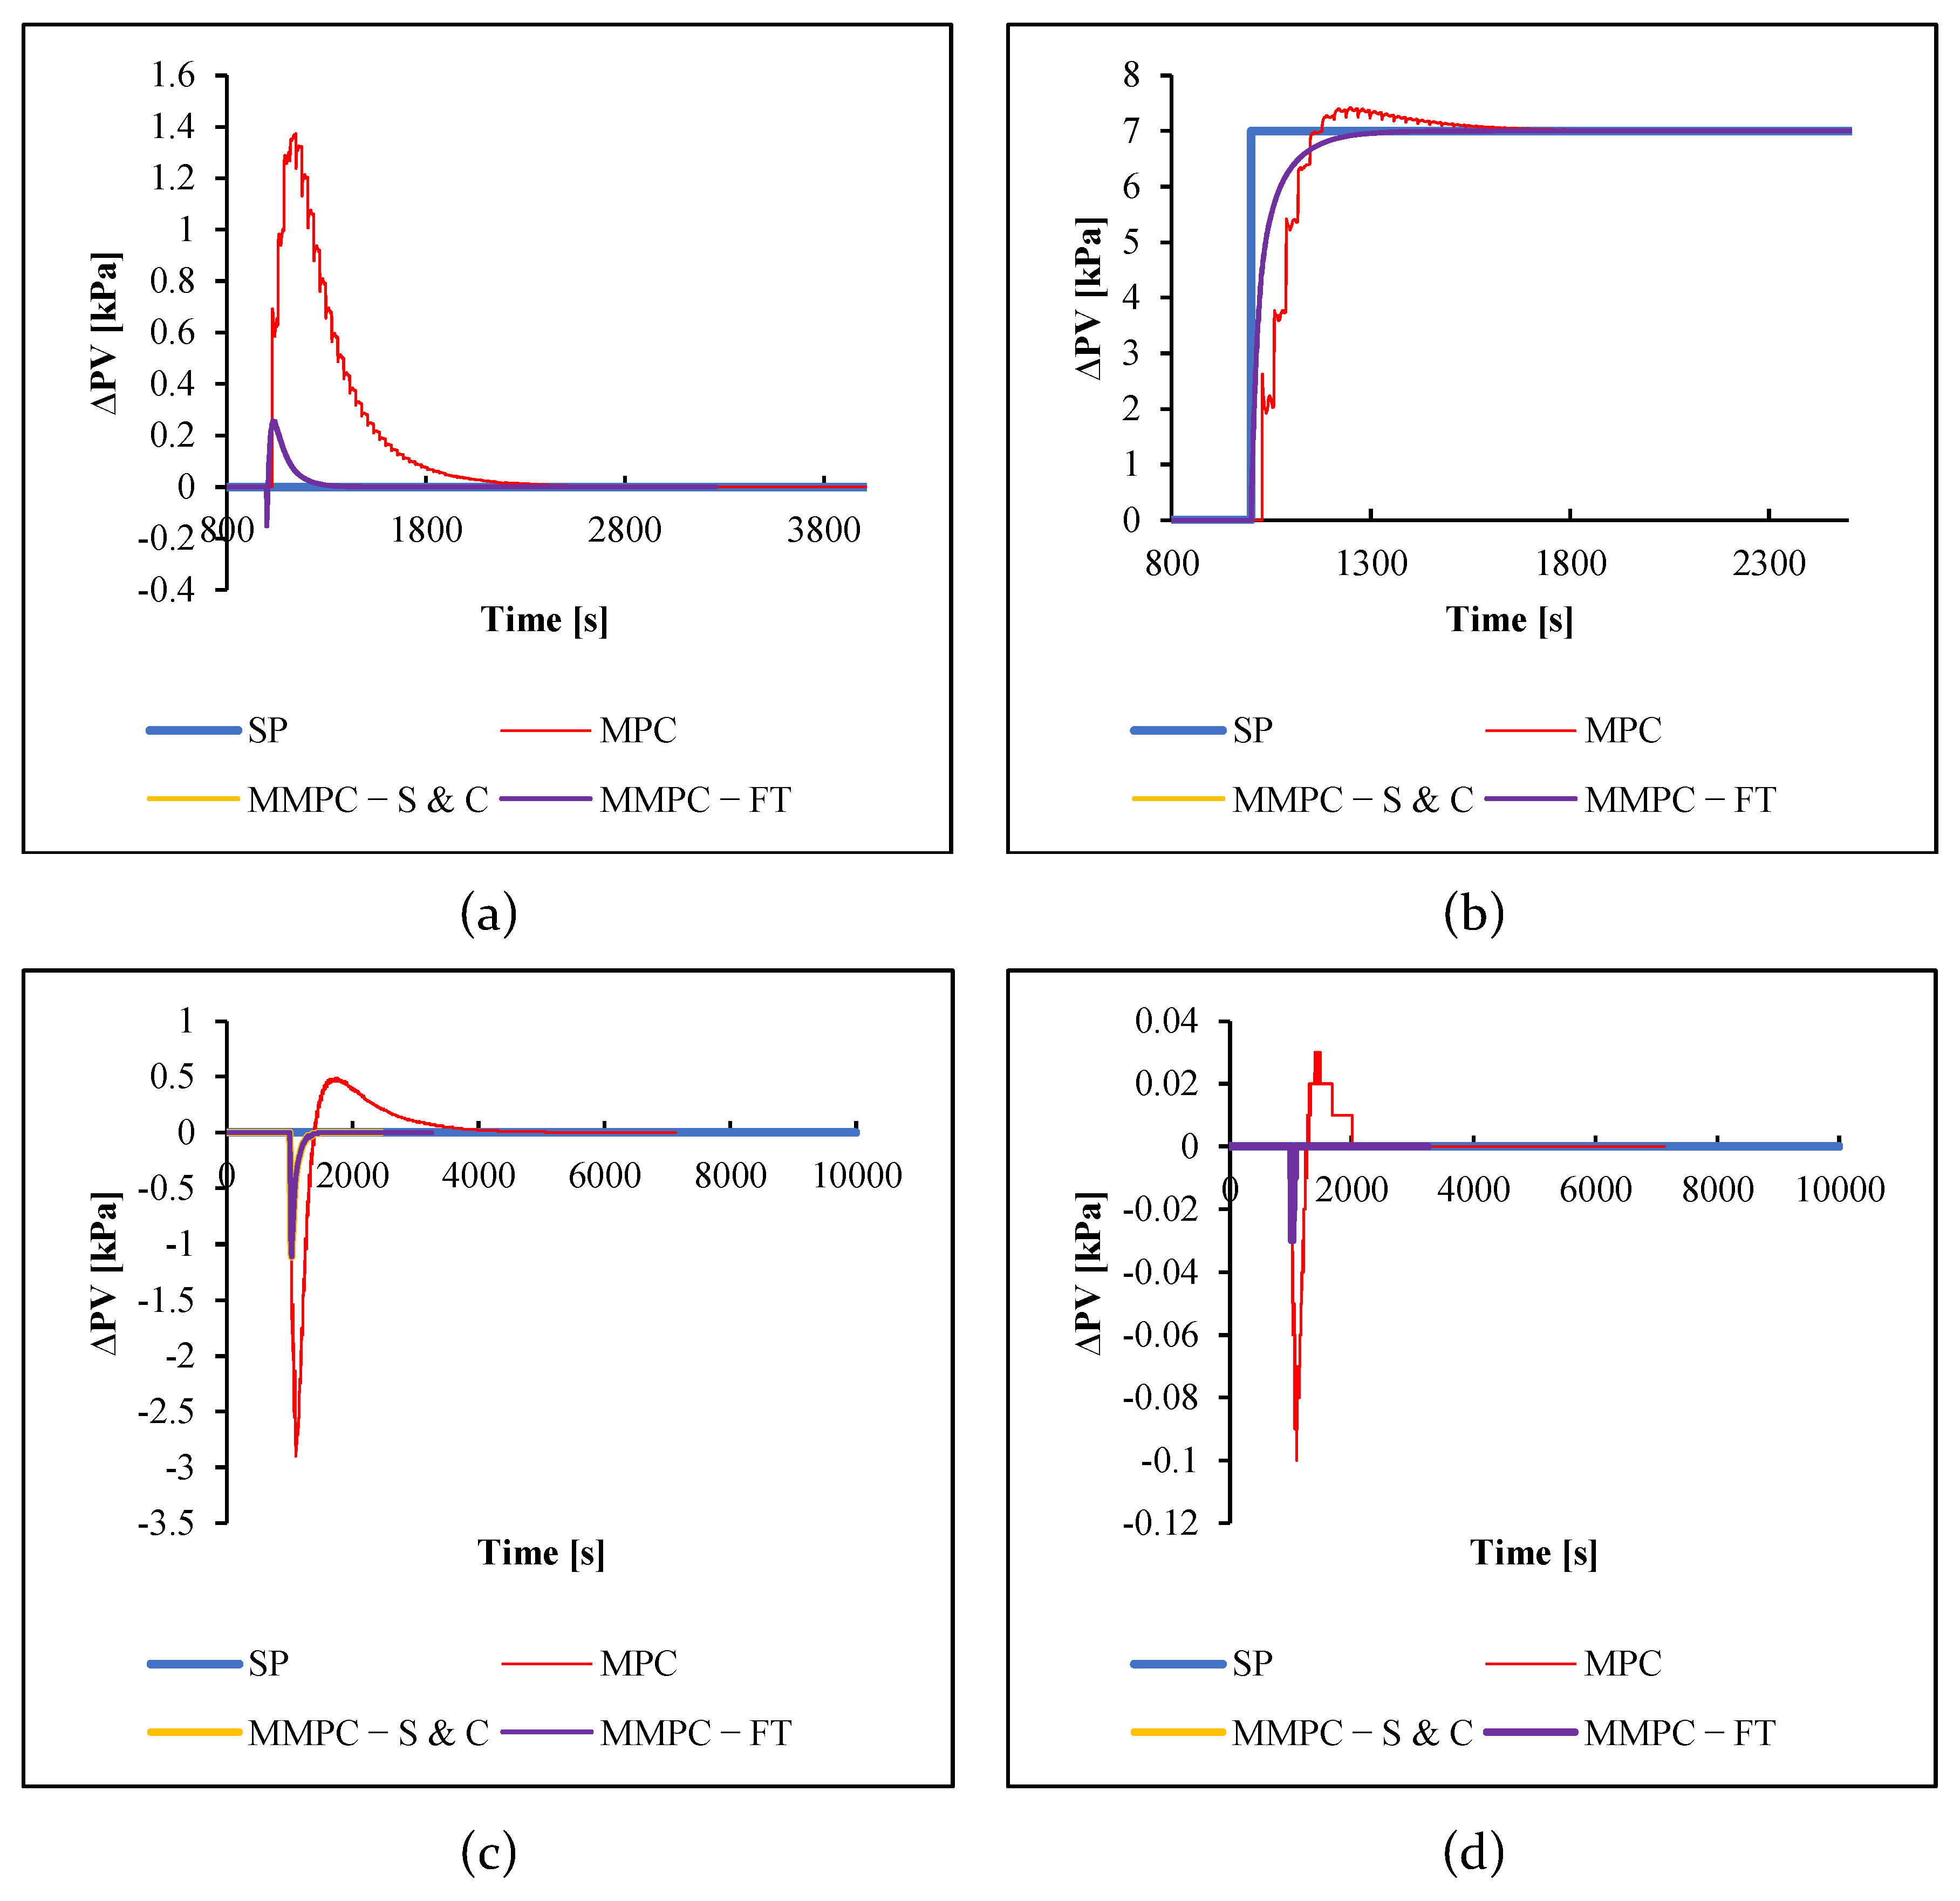
Figure 5 and
Table 9 show the simulation results of process control with SP changes in compressor unit 3. A graph of SP changes is shown in
Figure 5c, where MMPC can stabilize flow much faster than MPC. When the SP on compressor unit 3 changes, the MMPC-controlled flow pressure on compressor units 1 and 2 decreased instead of increasing (shown in
Figure 5a,b). It is due to the response of the MMPC to excessive pressure increases, thus causing a decrease in pressure. Even so, MMPC still provided the best control performance results compared with MPC. Altogether, MMPC FT has the best results for compressor units 1, 2, and 3. However, for compressor unit 4, MPC provided the best control performance results because it has the fewest errors. The cause of this is the tuning factor in MPC, which is better than MMPC.
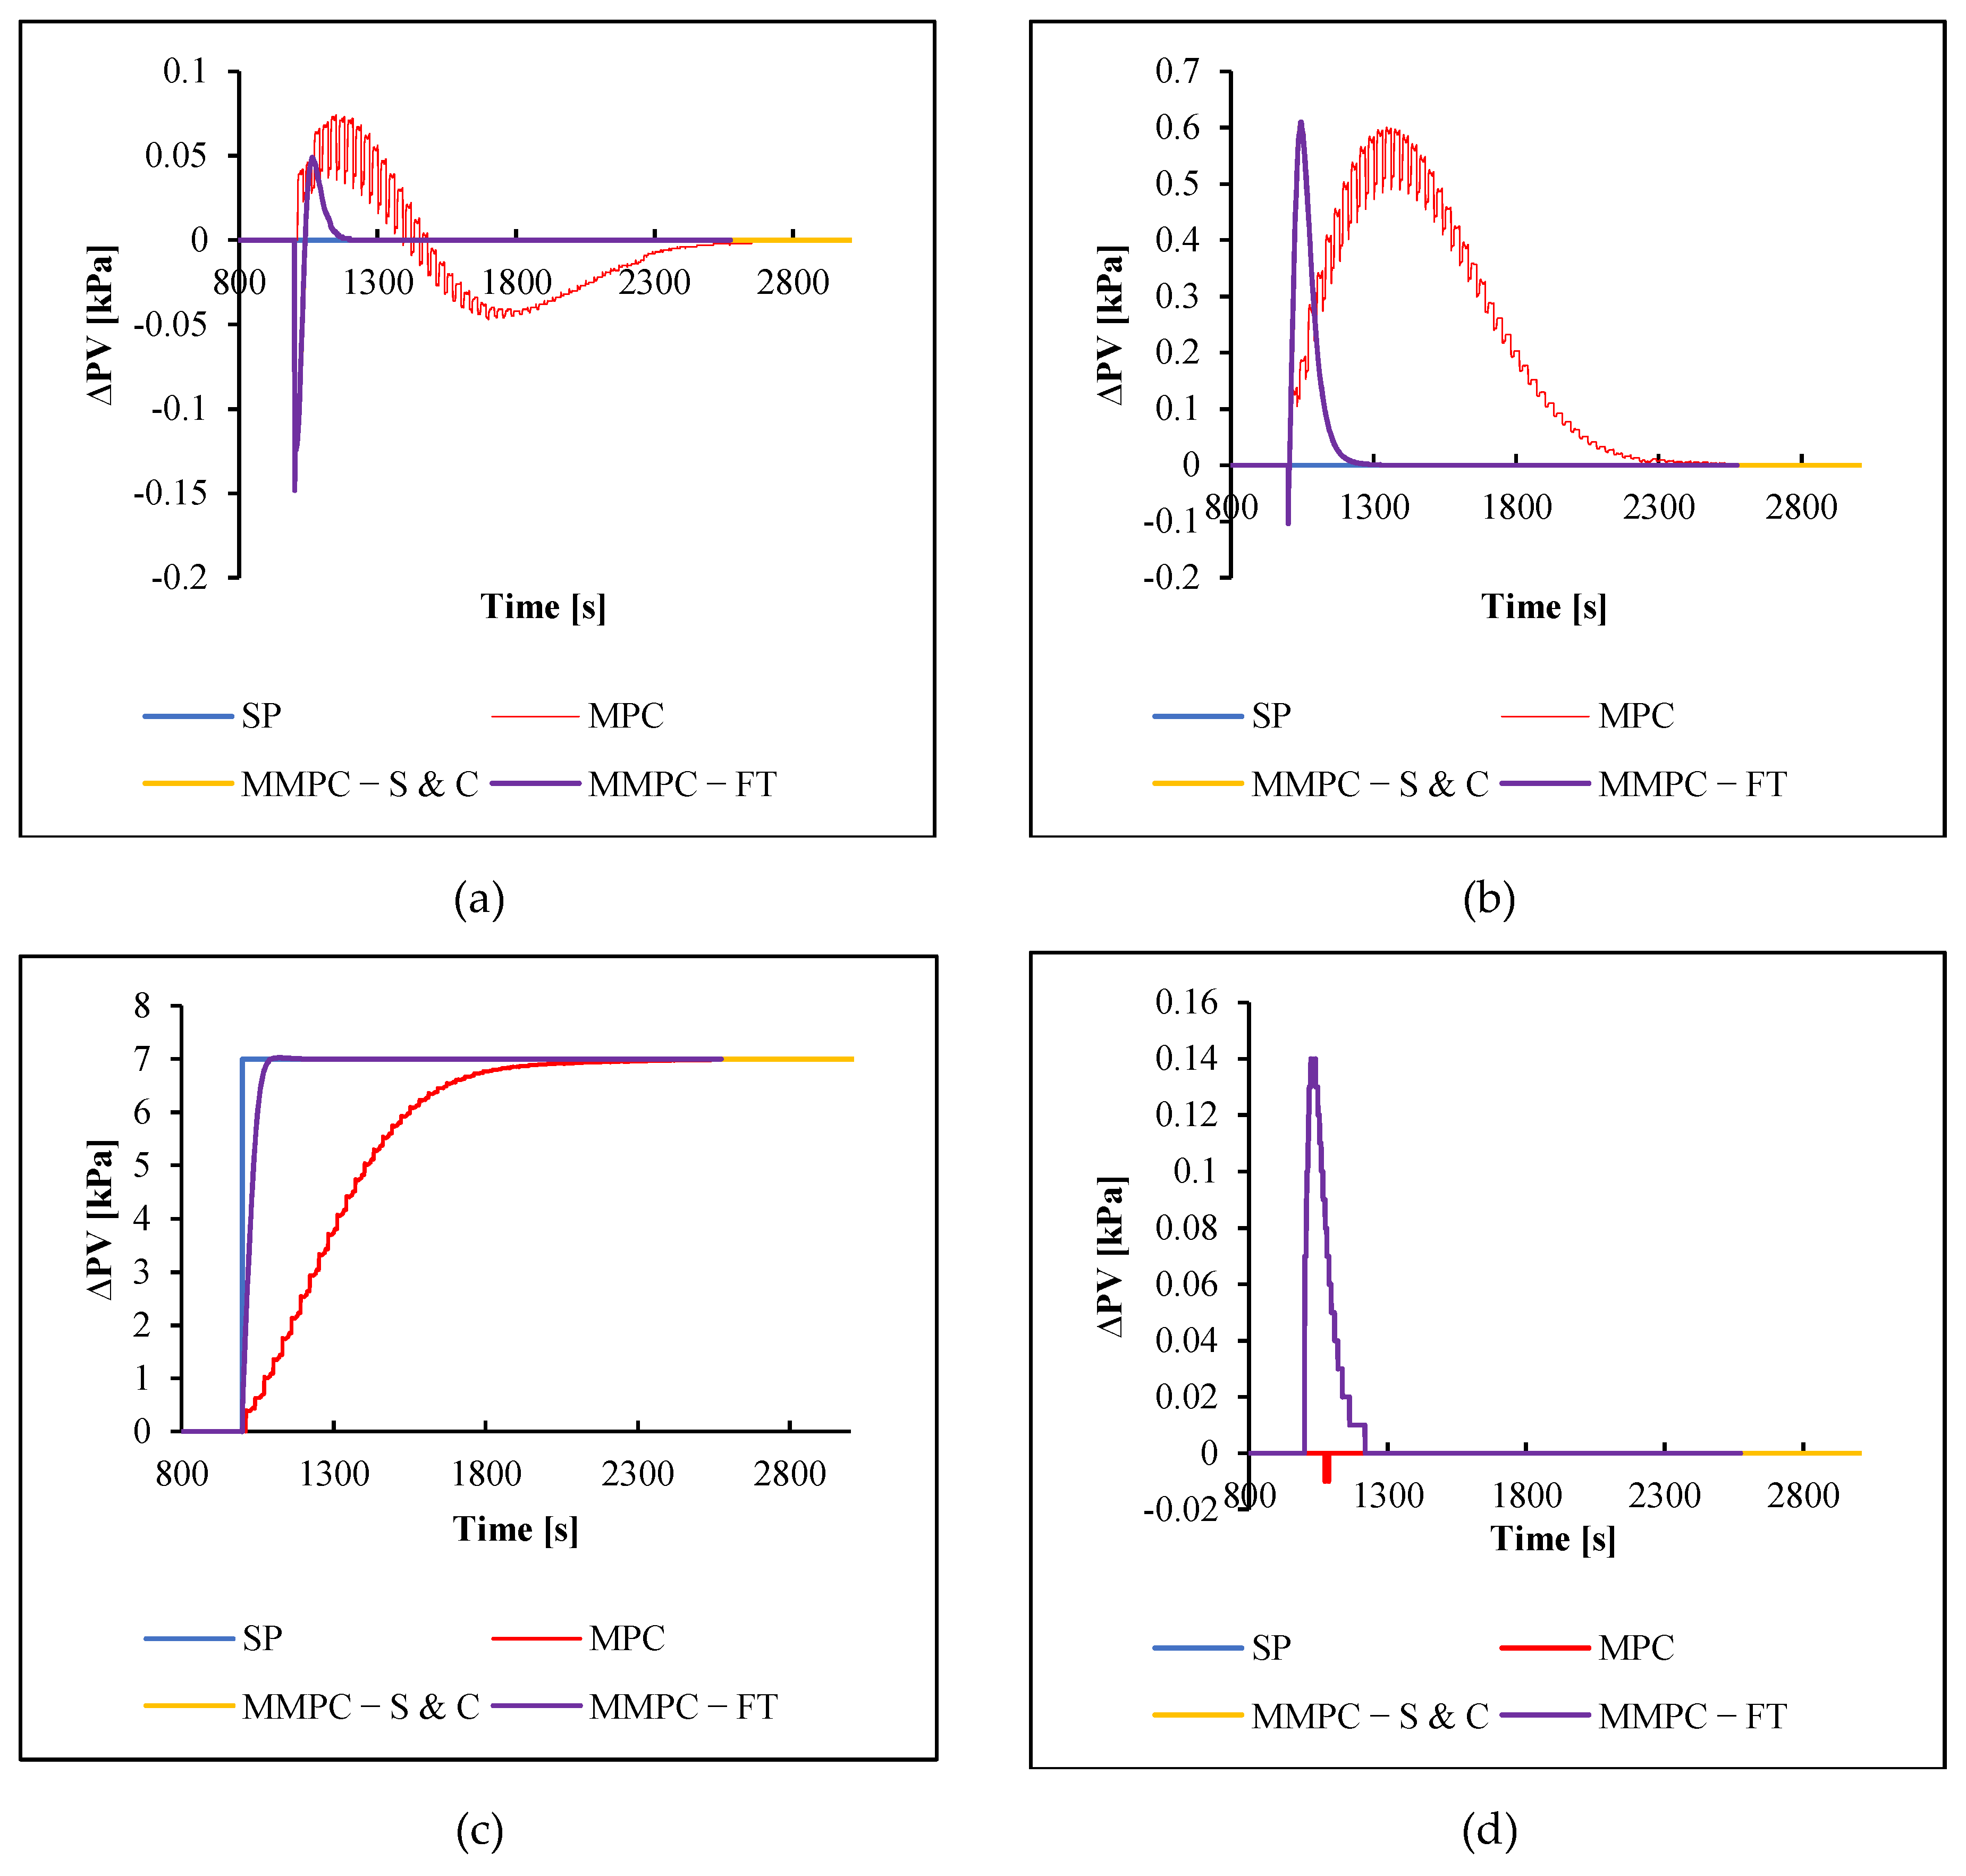
The simulation results for SP changes in compressor unit 4 are shown in
Figure 6 and
Table 10. SP changes in compressor unit 4 (shown in
Figure 6d) caused the flow pressure in all compressor units to increase. In compressor units 1, 2, and 3 shown in
Figure 6a–c, the MMPC controlled flow did not experience a pressure drop past its SP, but the pressure increase was directly lowered to its SP. The response from MMPC provided the best performance results for compressor units 1, 2, and 3, except for compressor unit 1. In compressor unit 1 (
Figure 6a), the flow controlled by MMPC experienced a higher rise and a slower response than MPC. As previously explained, this can be caused by tuning factors. The results of this simulation differed from the changes in SP on the previous compressor units because the MMPC S&C generally has fewer errors.
The MMPC performance control on the compressor units using the MIMO 2 model is shown, in
Figure 7,
Figure 8,
Figure 9 and
Figure 10, with a change in SP of 7 kPa (as before). The control performance was not much different from the MIMO 2 model, as shown in
Table 11,
Table 12,
Table 13 and
Table 14. The MMPC with MIMO 2 model did not produce a significant graph pattern difference compared to the MIMO 1 model, and neither did the analysis. It also becomes the reason why the MIMO 2 model and MIMO 1 model are not plotted in one graph. Both overlapped, so it would be hard to analyze them. Therefore, IAE was used to compare the performance between MPC and MMPC with the MIMO 2 and MIMO 1 models, as provided in Table 17.
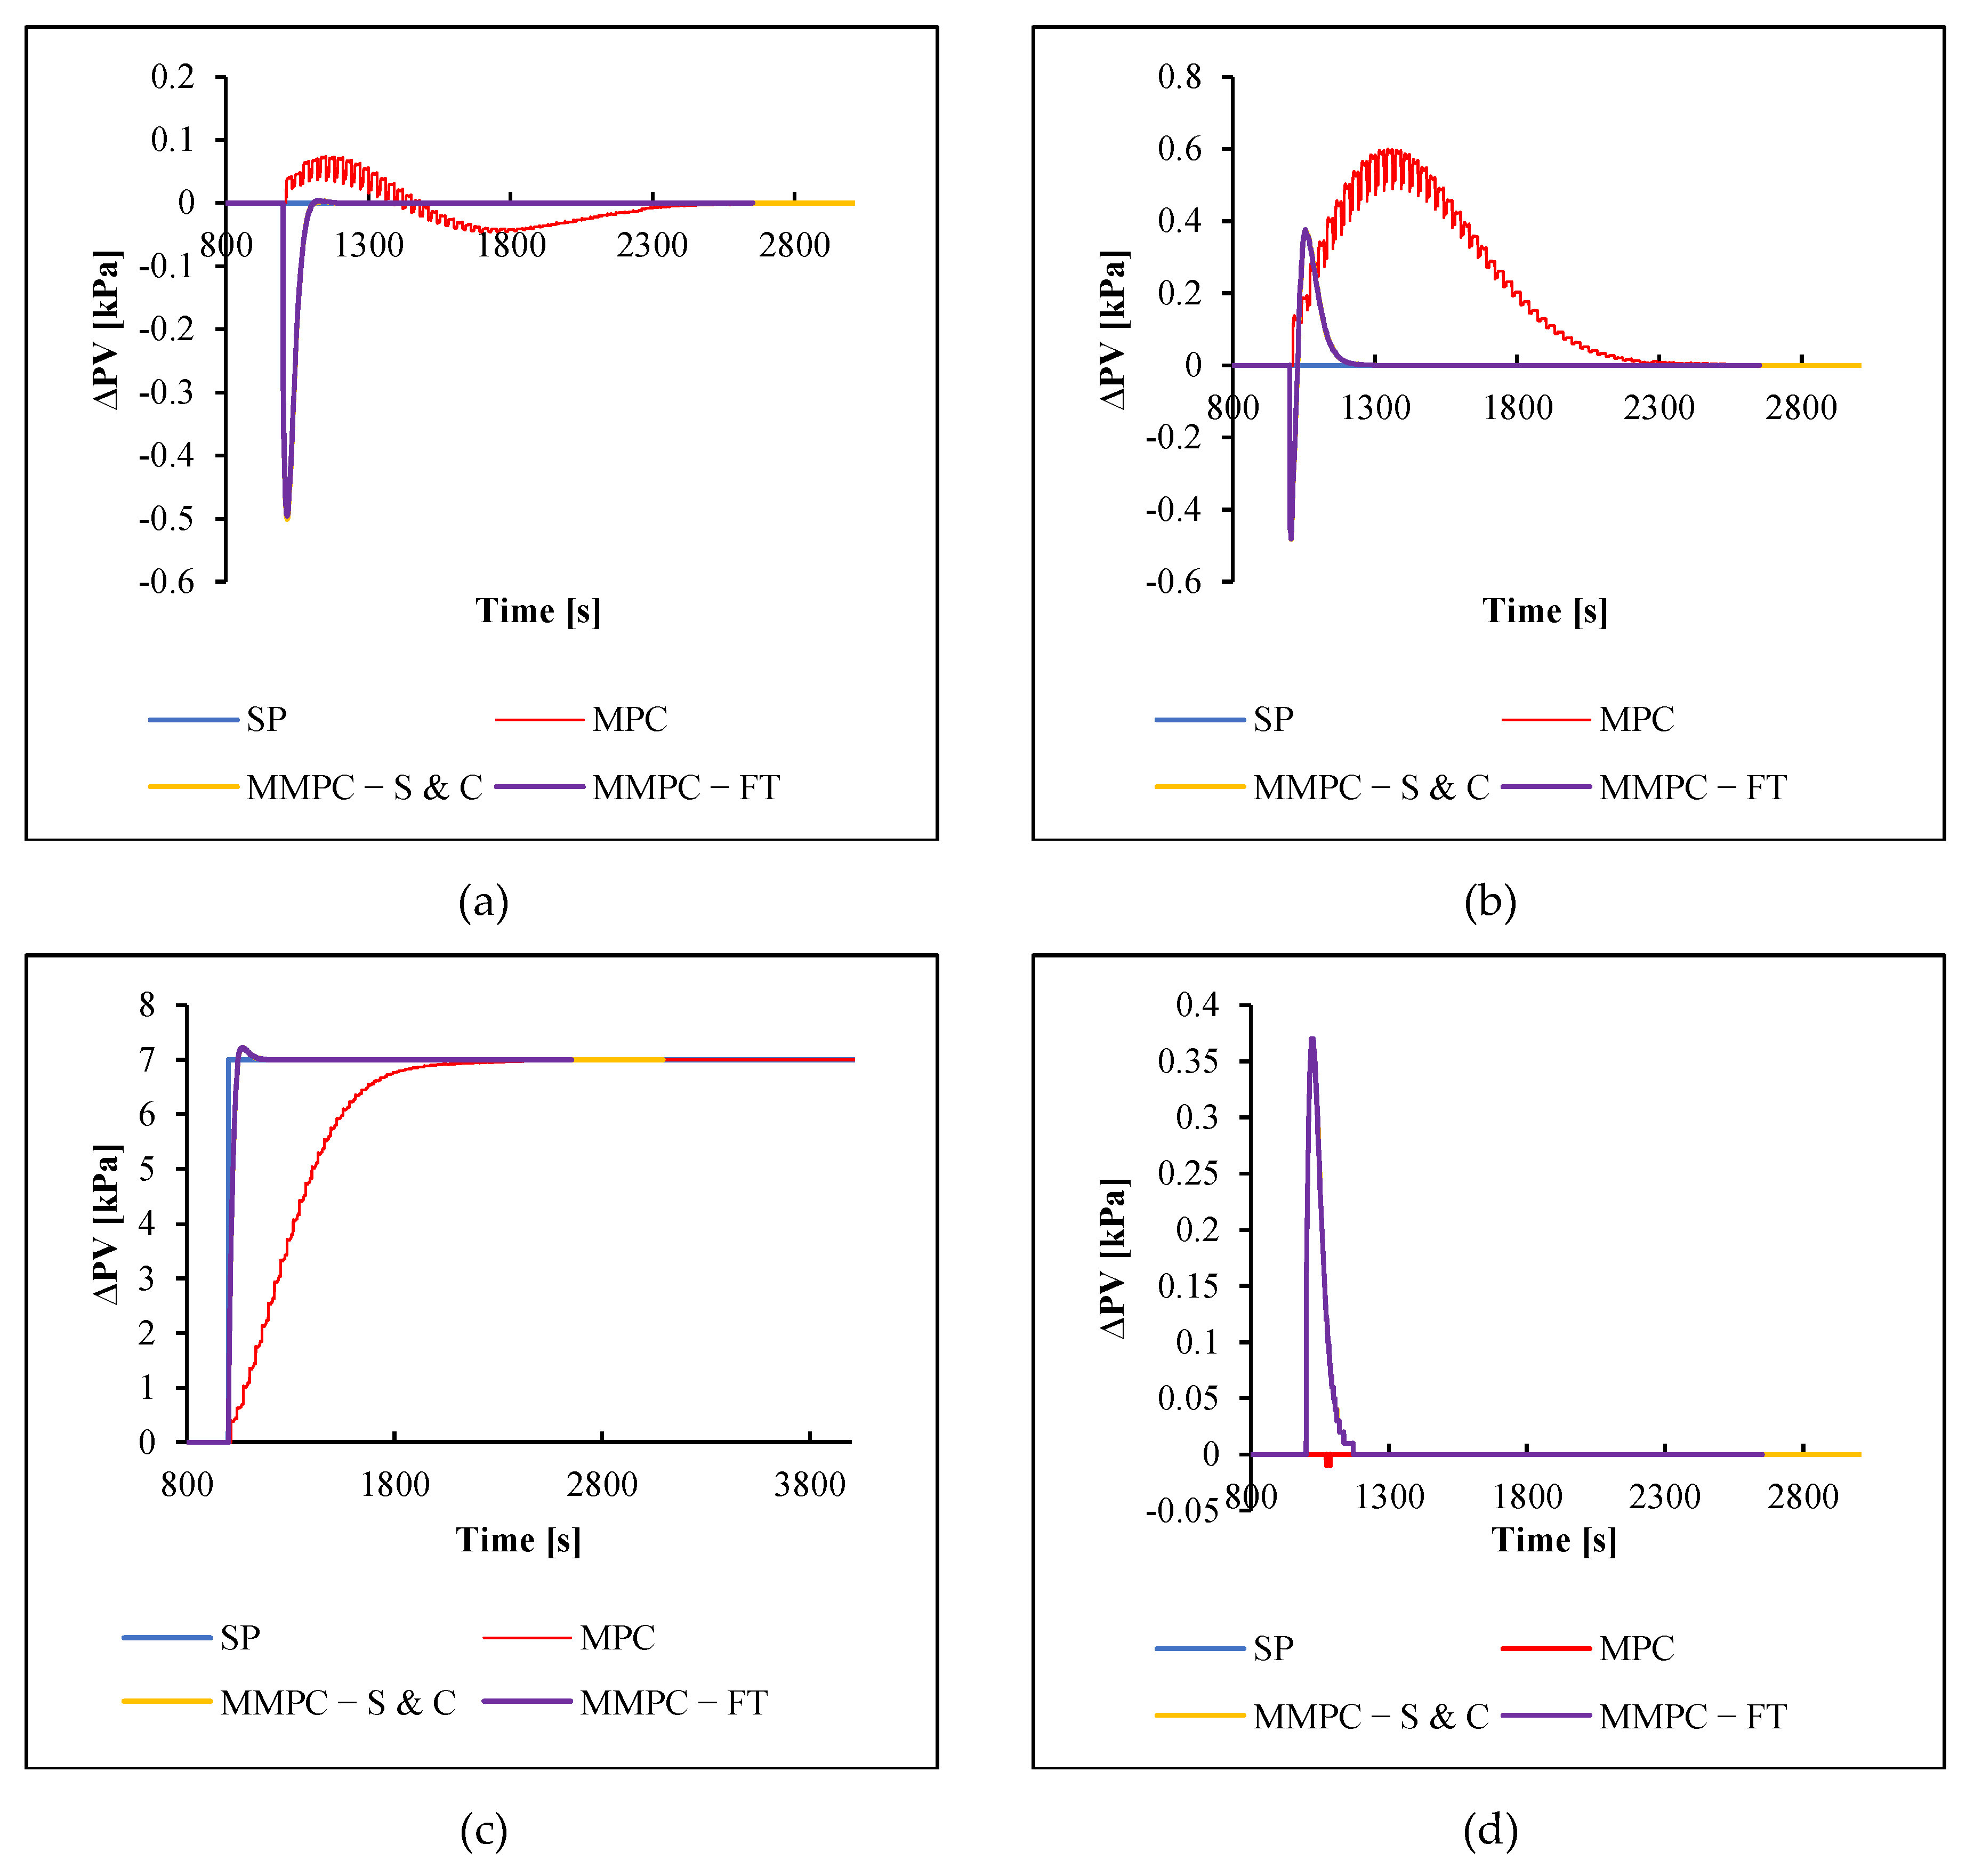
MMPC S&C and FT with MIMO 2 model almost provided the same control performance results. Generally, MMPCs had better controller performance results, except on compressor unit 4 with SP changes on compressor unit 3 and compressor unit 1 with SP changes on compressor unit 4. The performance of MMPC S&C with SP changes on compressor unit 1, as shown in
Figure 7 and
Table 11, had better results than other controllers. MMPC FT had slightly better performance with SP changes on compressor unit 2, which are shown in
Figure 8 and
Table 12. Based on
Figure 9 and
Figure 10 and
Table 13 and
Table 14, MMPC S&C and MMPC FT had the same control performance due to the same amount of error.
Control performance in the steam reformer and combustor units was carried out by changing the SP by +10 °C for both types of equipment (heater and combustor units).
Figure 11 shows that, for the heater, MMPC FT was better than MPC and MMPC S&C, as detailed in
Table 15. MPC produced an oscillating control behavior, leading to worse performance. The same thing happened when testing the SP change on the combustor unit, as shown by
Figure 12 and
Table 16.
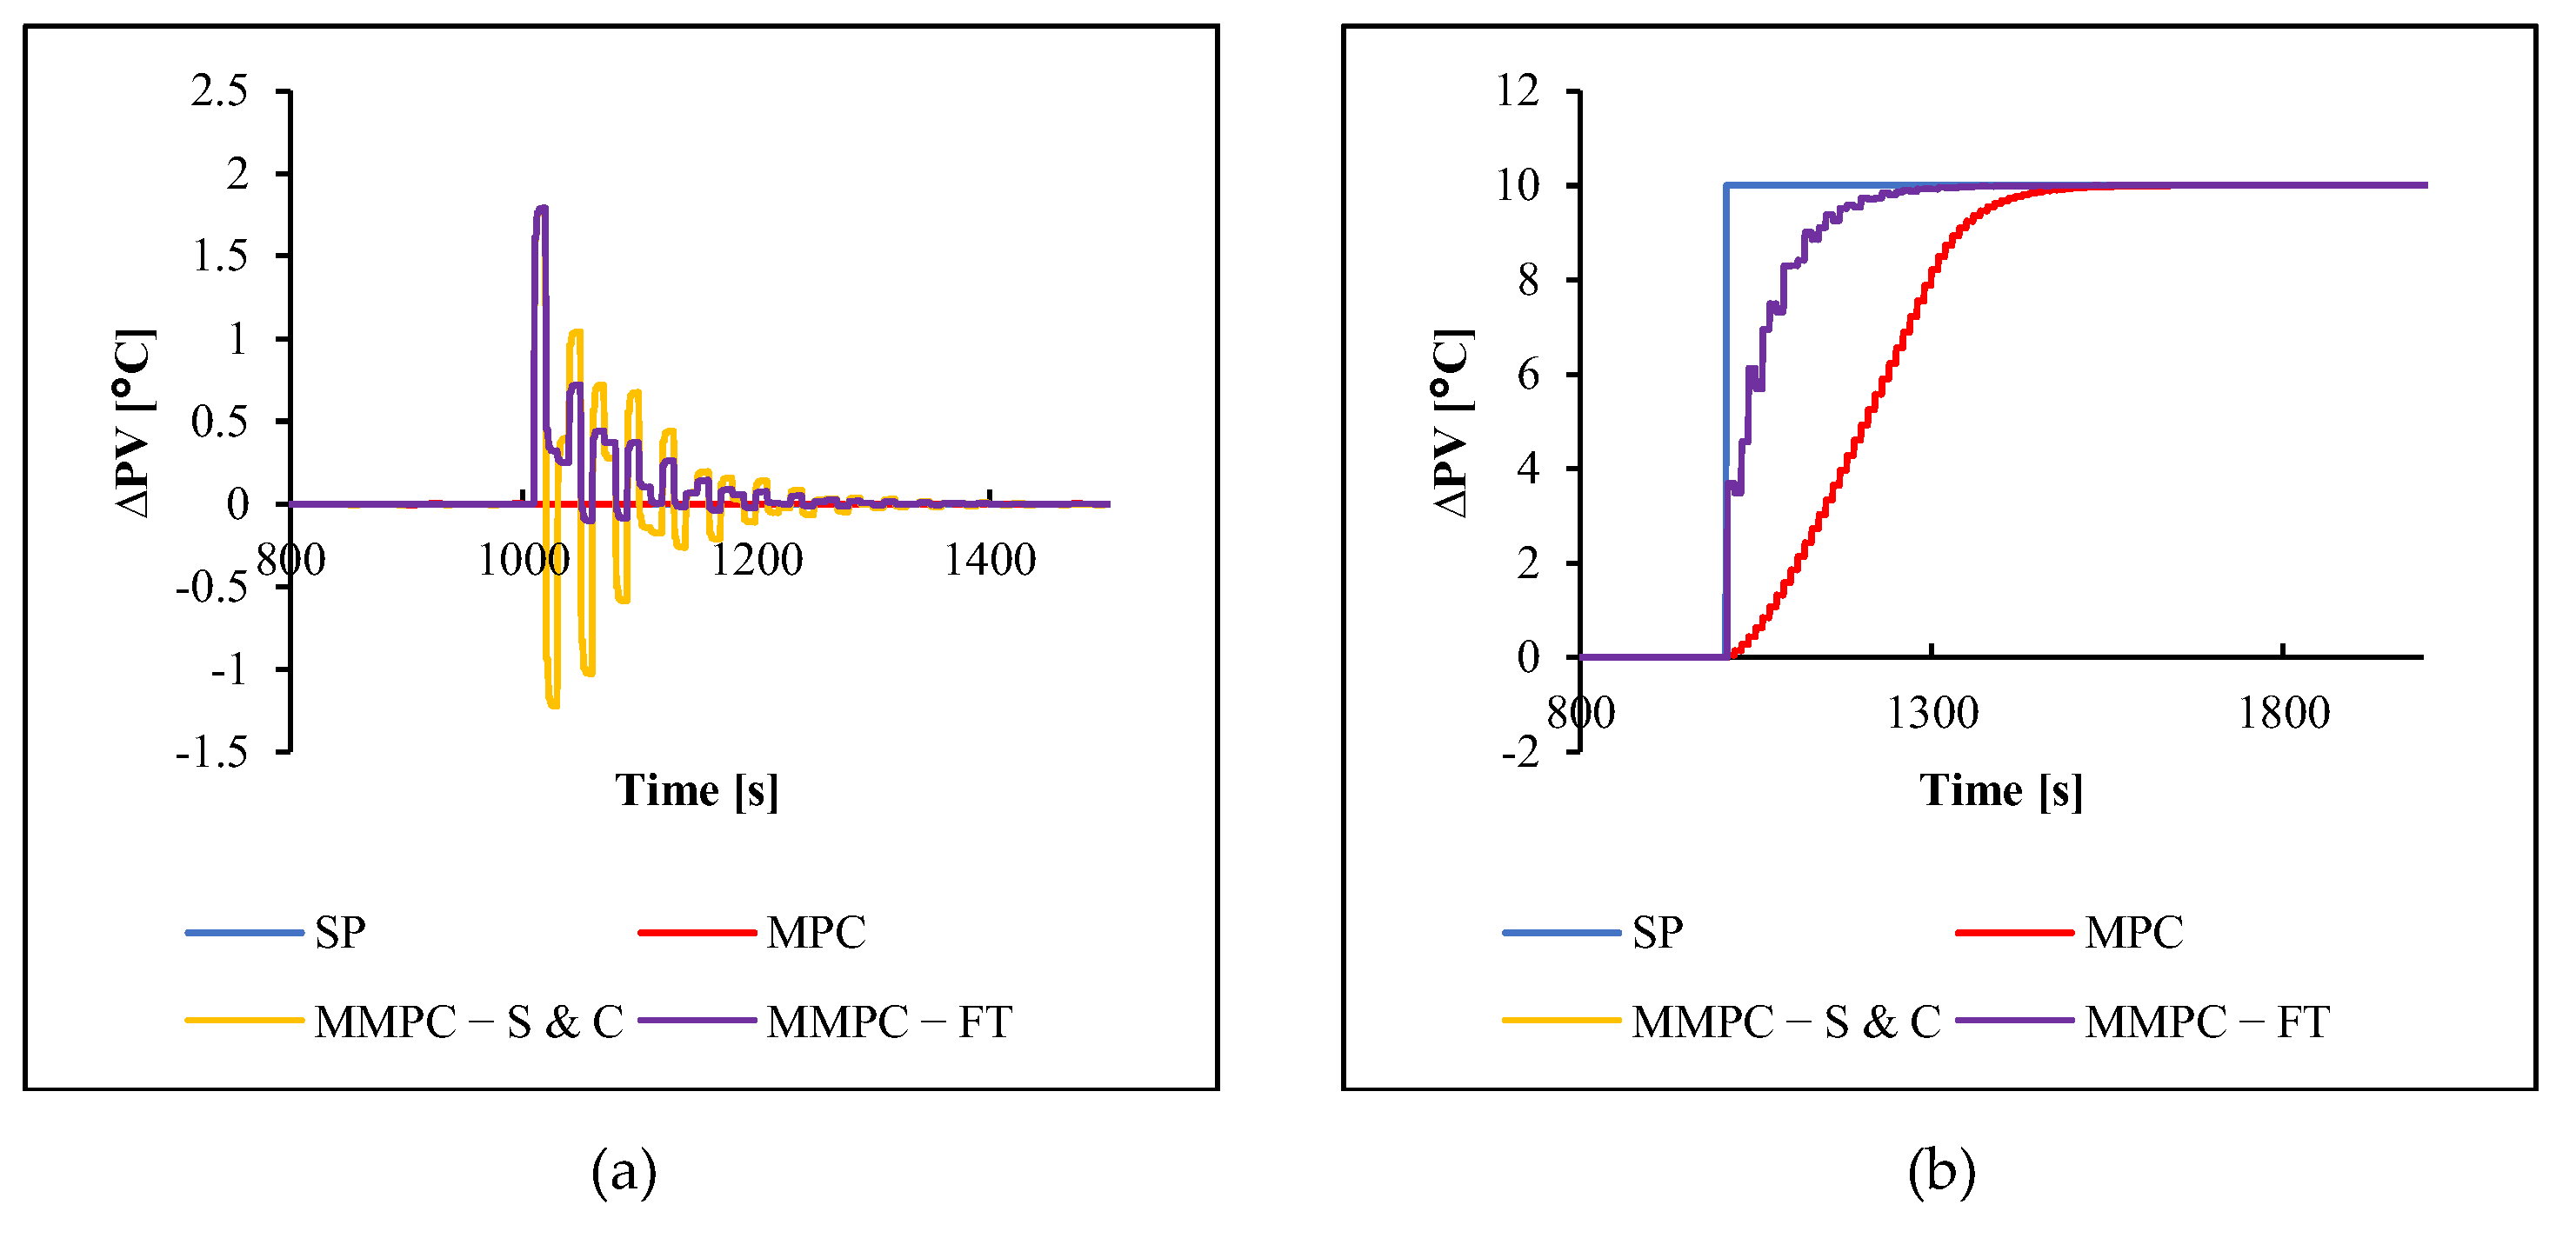
Figure 11 and
Table 15 show the results of controlling the steam reformer unit with changes in SP on the heater. Changes in SP on the heater caused temperature oscillations in the equipment, except for the flow controlled by the MMPC FT. This oscillation can be stabilized by any type of controller. The MMPC FT controlled flow has no oscillations and can be stabilized more quickly than other controllers. Considering Equation (3), the change in SP on the heater should not affect the combustion chamber. However, this is not the case. It may be caused by little changes in temperature, which are immediately responded to by the controller. When a sensitivity analysis was performed, the logger could not record these changes.
In
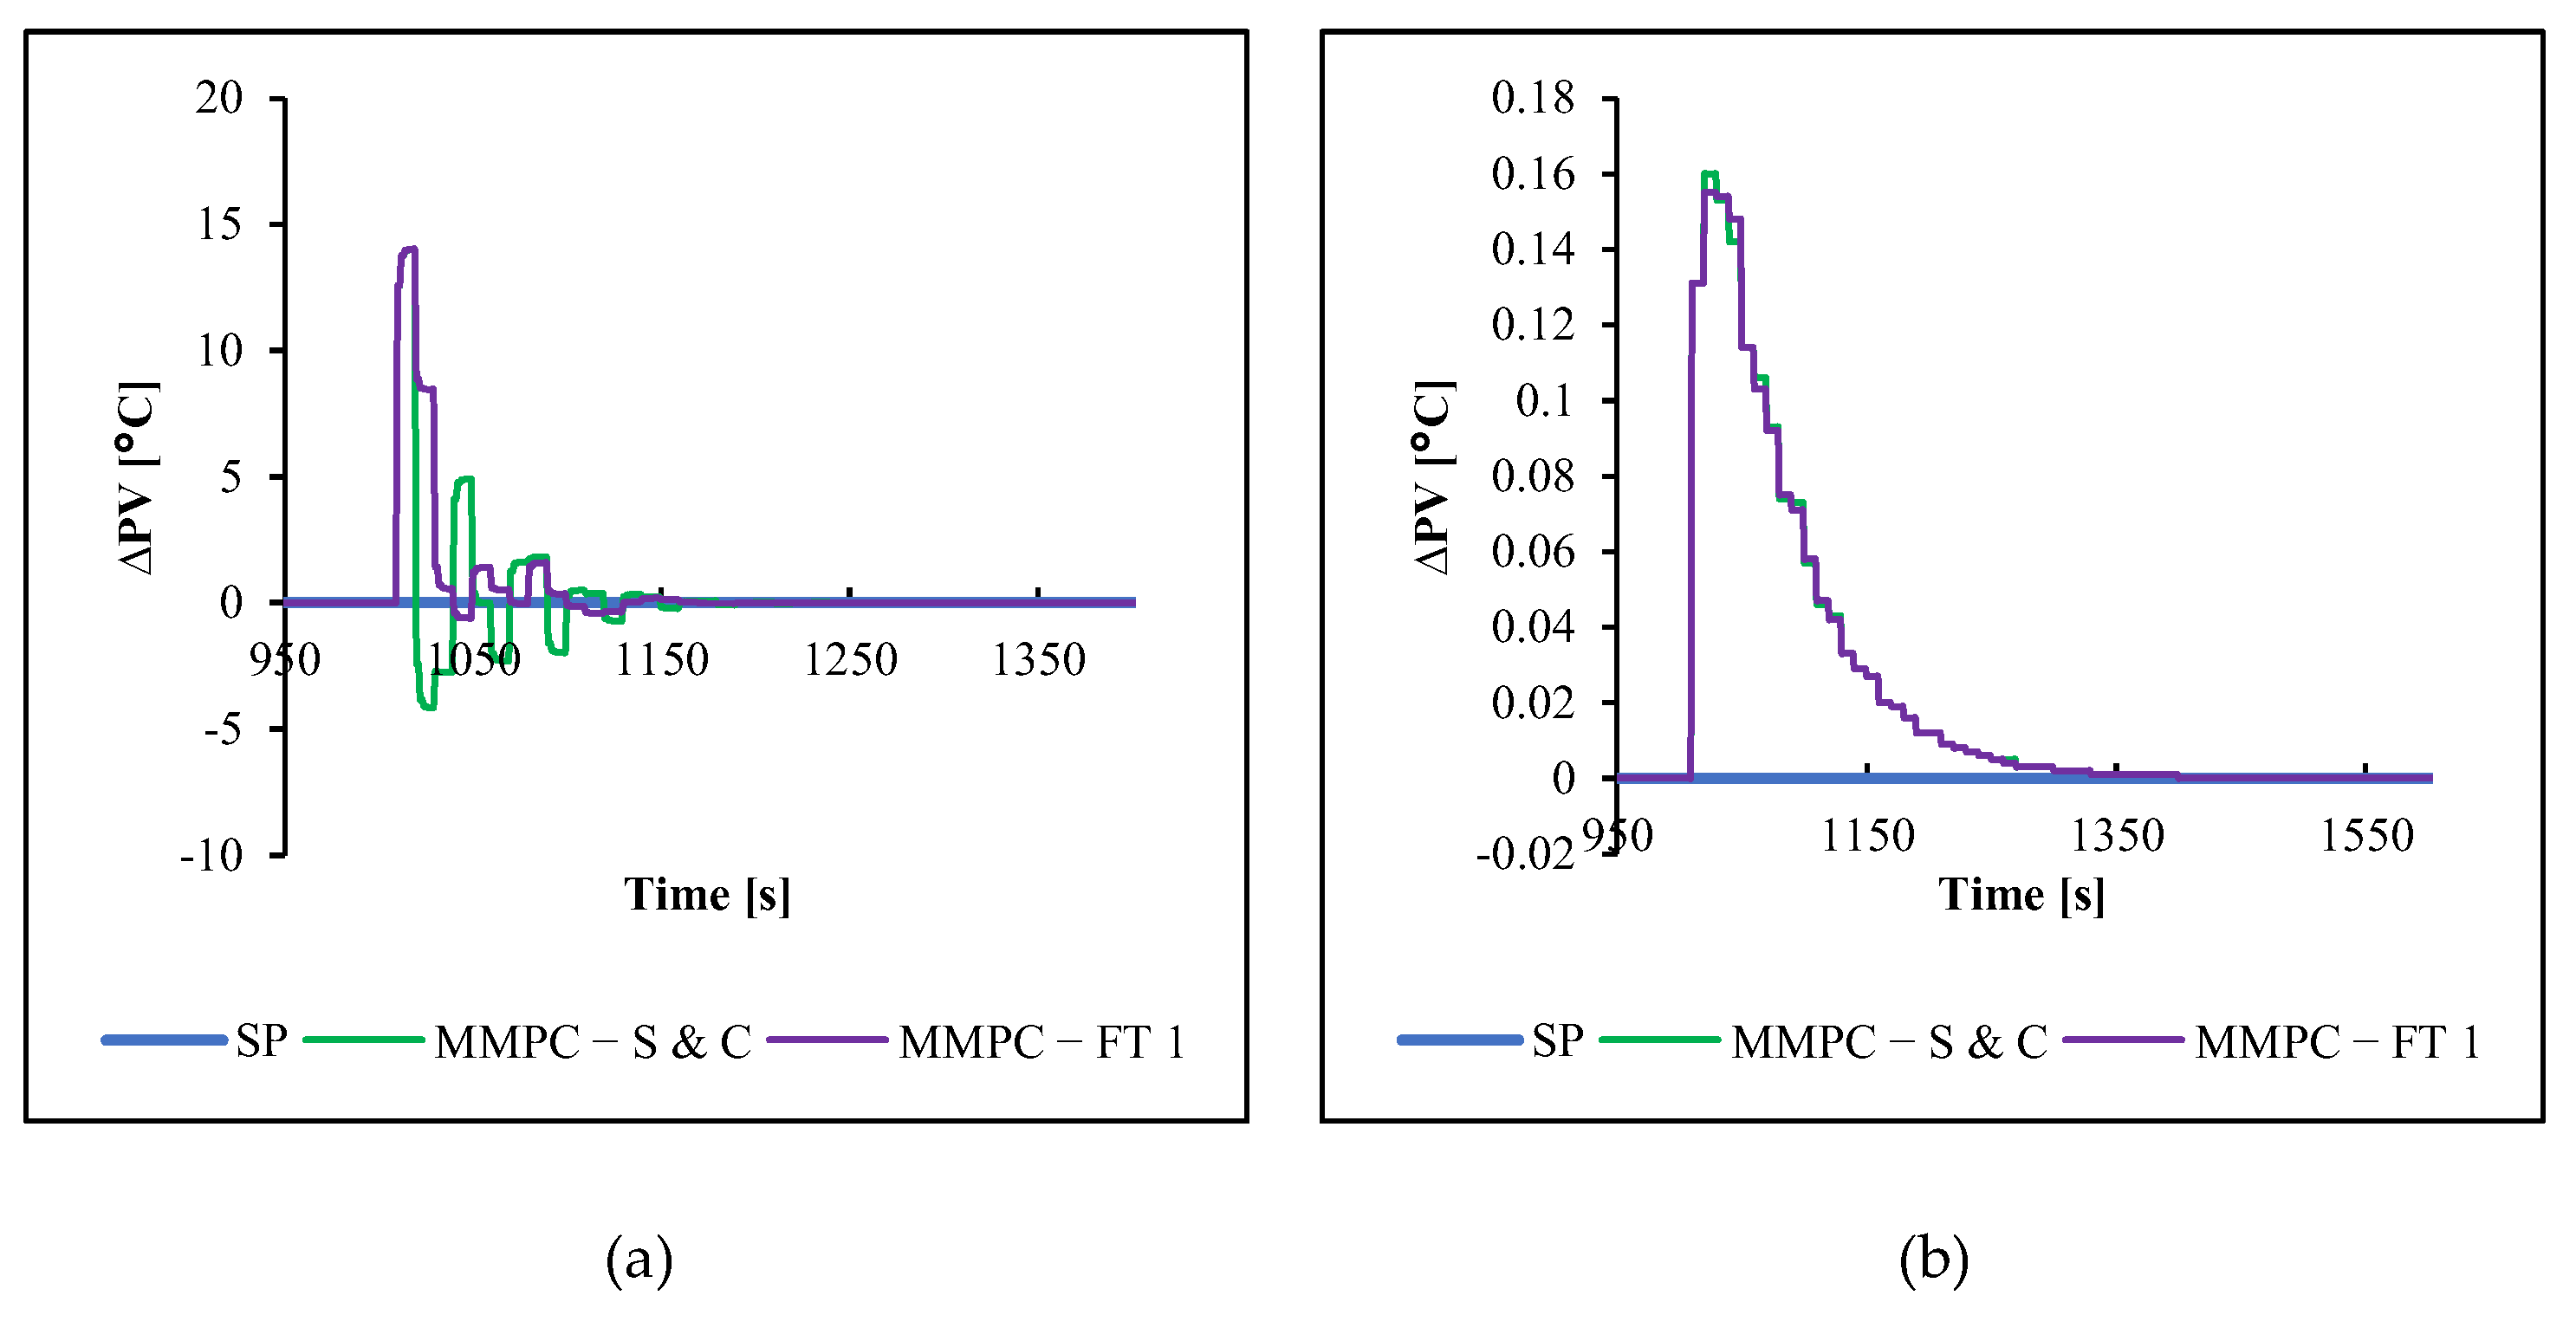
Figure 12, the change in SP on the combustor did not produce oscillations in the tool but still occurred in the heater. Meanwhile,
Table 16 shows that the MMPC FT could stabilize heater flow oscillations with the best control performance results. On the combustor, the resulting graph did not oscillate. MMPC S&C and FT had no difference in control performance.
Improved control performance on SP changes was achieved when using MMPC FT on compressor units with the MIMO 1 model, based on the IAE of 85.84% for compressor 1, 61.39% for compressor 2, 94.57% for compressor 3, and 73.35% for compressor 4 (or about 61– 95%); while, for the MIMO 2 model, it was 88.23% for compressor 1, 58.22% for compressor 2, 91.45% for compressor 3, and 66.71% for compressor 4 (or around 58–91%). Thus, the MIMO 1 model performed better than the MIMO 2 model, as detailed in
Table 17. In the steam reformer unit, the increase in control performance using the MMPC FT based on IAE was 63.34% (heater) and 71.36% (combustor), as shown in
Table 18.


