Article

Thermodynamics and Kinetics of the Reaction of Catalytic Dismutation of Chlorosilanes in the Vapor Phase in the Temperature Range of 353–393 K

1
Department of Nanotechnology and Biotechnology, Nizhny Novgorod State Technical University Named after R.E. Alekseev, Nizhny Novgorod 603950, Russia
2
Horst LLC., Gas Analysis Laboratory, Moskva 117545, Russia
*
Author to whom correspondence should be addressed.
ChemEngineering 2023, 7(1), 13; https://doi.org/10.3390/chemengineering7010013
Submission received: 29 November 2022 / Revised: 16 January 2023 / Accepted: 19 January 2023 / Published: 10 February 2023

Abstract

:
Currently, the most common method of silane synthesis for electronics and photovoltaics is trichlorosilane (TS) dismutation. TS dismutation proceeds in the form of a reactions cascade, therefore its study is of both practical and scientific interest. The results of calculating the equilibrium composition of the reaction mixture in the vapor phase based on literature data from various sources were not reliable. Therefore, the dependence of the composition of the reaction mixture on the time of contact of the TS vapor with the catalyst under static conditions was experimentally investigated. The stationary composition of the mixture, close to equilibrium, was determined. A good agreement of the obtained results with the literature data in one of the sources was shown. The kinetics of the dismutation reaction of TS and dichlorosilane (DCS) was carried out by the flow method. As a result of regression analysis of experimental data, the rate constants of the direct and reverse dismutation reactions of TS, DCS, and monochlorosilane (MSC) were obtained. The rate constants were used to calculate the equilibrium composition of the reaction mixture. A good agreement between the calculated and experimental data was shown.

1. Introduction

Intensive industrial development leads to an increase in energy demand, which requires an increase in the production capacity of environmentally dirty and polluting energy sources. One of the alternative environmentally friendly and renewable energy sources is solar photovoltaics [1,2].
Semiconductor silicon obtained by the thermolysis of silane has become the most widespread to realize the conversion of light energy into an electrical one [3,4,5]. In addition, silicon is currently the leading semiconductor material in electronics. So far, the main method of obtaining semiconductor silicon is the Siemens process [6,7], which is used by more than 80% of polysilicon manufacturers in the world. Nevertheless, this process has a number of disadvantages, such as the environmental hazard of the reaction products, significant investments due to the corrosive activity of both the starting materials and the reaction products, high energy consumption costs, and difficulties in preparing products for the manufacture of high-purity polysilicon for the electronics industry.
This, in turn, stimulates an increase in interest in the production of polysilicon by the thermal decomposition of silane (SiH4) since this process requires less energy and this production minimally pollutes the environment [8]. Thus, silane is widely used in optoelectronics, micro- and nanoelectronics, the production of solar cells, and the semiconductor industry [3,4,5].
Currently, silane is mainly obtained by the catalytic disproportionation of trichlorosilane [9,10,11,12] and various variants of acidolysis of magnesium silicide [13,14,15]. The method of disproportionation of TS involves a simple process with the lowest cost and high industrial safety compared to methods based on the acidolysis of magnesium silicide.
Several types of catalysts can catalyze the disproportionation process, for example, aluminum trichloride, heterocyclic arenes, or acyclic nitriles [16,17]. However, almost all of them are a source of impurities in the reaction products. Thus, when using organic homogeneous catalysts containing a nitrogen atom as an electron pair donor, difficulties associated with the separation of reaction products from the reaction mixture arise. For this reason, non-volatile nitrogen-containing anion exchange resins are of interest, which, due to their low volatility, do not enter the reaction products and whose matrices are chemically inert with respect to chlorosilanes. Amberlyst-21, Amberlyst-26, and IRA-400 anionites produced by foreign companies were the first of such resins to be used [18,19]. They are a styrene copolymer with divinylbenzene containing weakly basic tertiary amine N+(CH3)2- groups or strongly basic quaternary ammonium N+(CH3)3- groups as the functional groups. Among the domestic analogs of the above-mentioned resins, AN18-12P (the analog of Amberlyst-21), AB17-12P (the analog of Amberlyst-26), and AB27-10P are known, in which one methyl group is replaced by the ethoxy group in the nitrogen atom in the quaternary ammonium functional group. The study of these resins revealed the greatest catalytic activity in the AB27-10P sample [20]. However, the use of divinylbenzene-styrene resins with grafted amine and ammonium groups is possible only at temperatures no higher than 80 °C, which limits the kinetic possibilities of the reactions [21]. Anion exchange resins based on the vinyl pyridine copolymer with divinylbenzene are more heat-resistant. The increased thermal stability of such a catalyst allowed the disproportionation of TS at higher temperatures, which not only improved the kinetic characteristics of the disproportionation reactions but also increased the yield of dichlorosilane due to the endothermicity of the reaction [22,23]. The literature contains information about the catalytic activity of some samples of vinyl pyridine resins [24]. However, in [24], the kinetics of the disproportionation of only TS on various types of anionites was considered, and there is no information about the kinetics of the disproportionation of DCS.
The process of the disproportionation of TS, DCS, and monochlorosilane in the presence of a catalyst consists of three reversible reactions involving five components: TS, DCS, MCS, silicon tetrachloride (STC), and silane (S) [25]:
2 SiHCl 3     SiCl 4 + SiH 2 Cl 2 ,
2 SiH 2 Cl 2     SiHCl 3 + SiH 3 Cl ,
2 SiH 3 Cl     SiH 2 Cl 2 + SiH 4 .
The study of the equilibrium composition of products and the kinetics of reactions (1)–(3) in the liquid phase in the presence of the catalyst Amberlyst-21 (anionite with tertiary amine functionality) was carried out by Union Carbide employees [26]. In Huang et al. [27], several ion-exchange resins were compared as catalysts for the disproportionation (dismutation) reaction of TS (1), and with the DOWEX MWA-1 resin (also a weakly basic tertiary-amine anionite, with a macroporous structure), the degree of transformation of TS and the rate of the liquid-phase reaction of the TS dismutation were studied. Data on the kinetics of the catalytic dismutation of chlorosilanes in the vapor phase, except for the publication [24], have not been found in the literature. Therefore, the subject of this research is an experimental study of the equilibrium and kinetic characteristics of the dismutation reaction of vaporous TS and DCS in the presence of the ion-exchange resin VP-1AP, with an assessment of the activation energy of these reactions. The study also includes a review of the available information on the thermodynamics of the process to select the appropriate experimental data for calculating the composition of equilibrium mixtures.

2. Results

As a result of the experimental determination of the composition of the reaction mixture under static conditions, it was found that after 1 h in the TS reactor, the composition of the mixture practically did not change within the analysis error. The relative error did not exceed 5%. The results of the experiment are presented in Table 1.
The values of the equilibrium constants of reactions (1) and (2) calculated according to Table 1 are: (2.1 ± 0.1)·10−2 and 0.35 ± 0.02 at 353 K; (2.2 ± 0.1)·10−2 and 0.360 ± 0.014 at 373 K; (2.4 ± 0.1)·10−2 and 0.39 ± 0.02 at 393 K.
However, carrying out the dismutation reaction of chlorosilanes in synthesis devices does not always allow for achieving the level of concentration of the components close to the equilibrium. Therefore, in addition to thermodynamic data, the kinetic characteristics of the reactions are necessary to adequately reflect the current composition of the reaction mixture in the reactor. To determine these characteristics, an experimental study of the kinetics of TS and DCS dismutation reactions was carried out. The relative error in measuring the concentration of the components in the reaction mixture did not exceed 5%. The differences in the experimental conditions are shown in Table 2.
Experiments to study the kinetics of dismutation reactions were carried out with both TS and DCS. The differences in their formulation are shown in Table 2.
Where V p is the free gas volume of the resin, equal to the product of the resin volume and porosity, and w p is the volumetric flow rate of the reaction mixture through the reactor. The formula for calculating the value of w p is
w p = w г H T p   P a T г н P a P p e a г 0
which can be obtained from the equations:
w p = w б c м T p T б ,   w б c м P a P p e a г 0 = w б г н P a   ,   w б г н = w г н T б T г н
where w б c м is the volumetric velocity of the carrier gas-saturated with the reagent at the temperature of the bubbler ampoule, T б ; T p is the reactor temperature; P a is the atmospheric pressure (the same as the carrier gas pressure);   P p e a г 0 is the saturated vapor pressure of chlorosilane at bubbler temperature; w б г н is the volumetric flow rate of the carrier gas at bubbler temperature; w г н is the flow rate of the carrier gas for bubbling at ambient temperature T г н   293   K , fixed with the help of a flow stabilizer 6.
Since the experimentally determined concentration of the components in the reaction mixture was in molar percentages, it was converted to a molar concentration for kinetic analysis according to the equation: C i   = X i C i 0 , where C i is the molar concentration of the i-th component at the reactor outlet, C i 0 is the molar concentration of the reagent at the inlet into the reactor, and X i is the molar fraction of the reagent at the reactor outlet.
The initial molar concentration of the reagent was calculated from the equation of the state of the ideal gas as
C i 0 = P i 0 1000 R T p ,  
since the reaction was carried out at a pressure close to atmospheric.
The results obtained in the form of kinetic curves are presented in Appendix A.

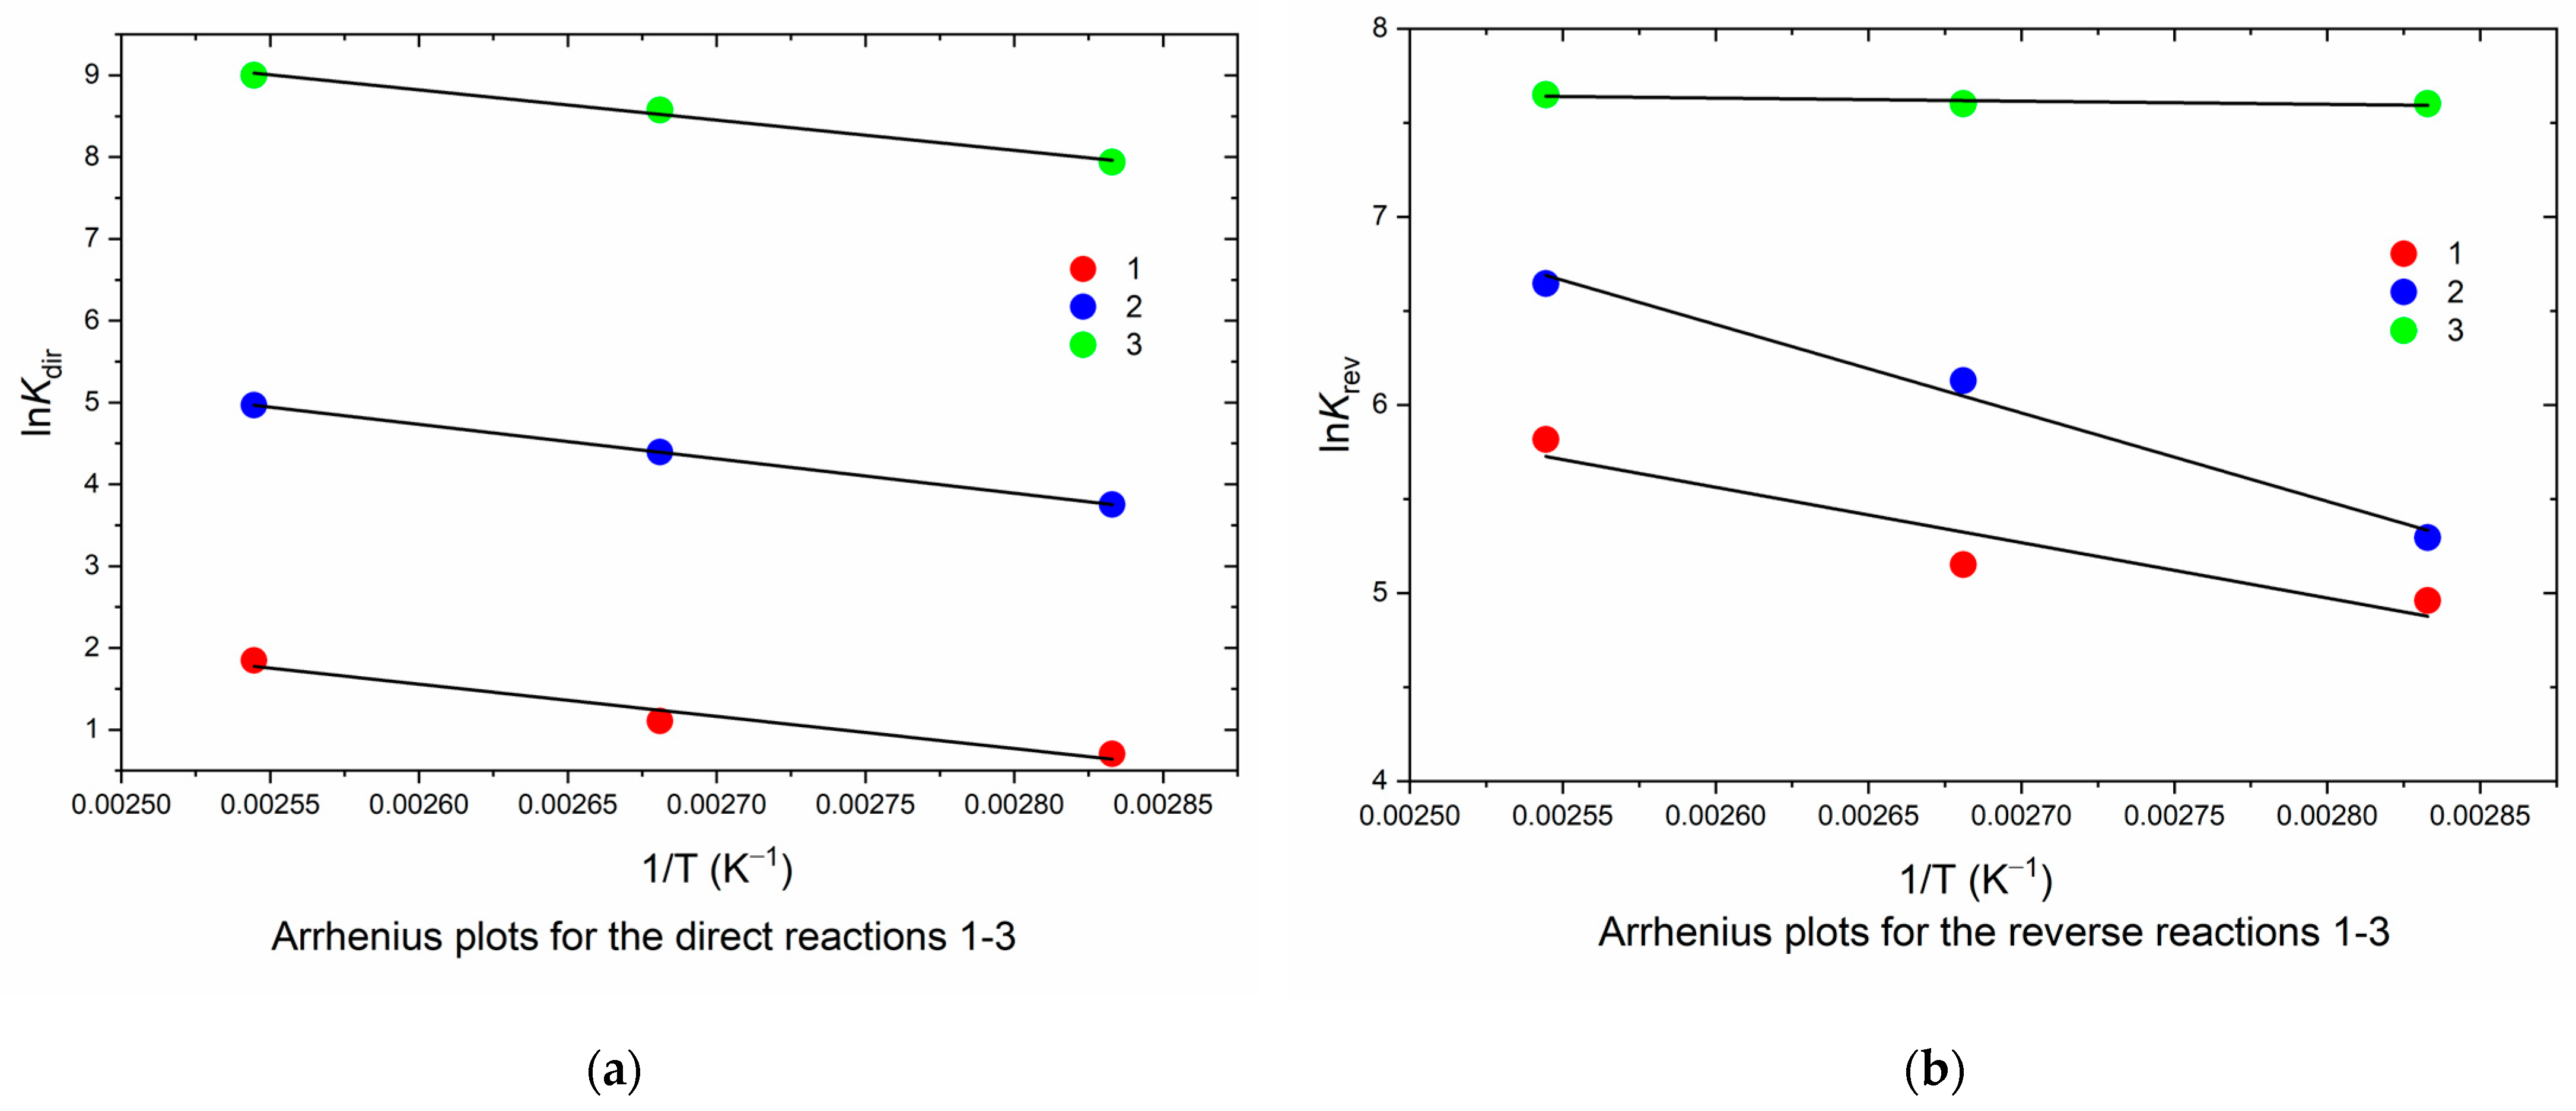
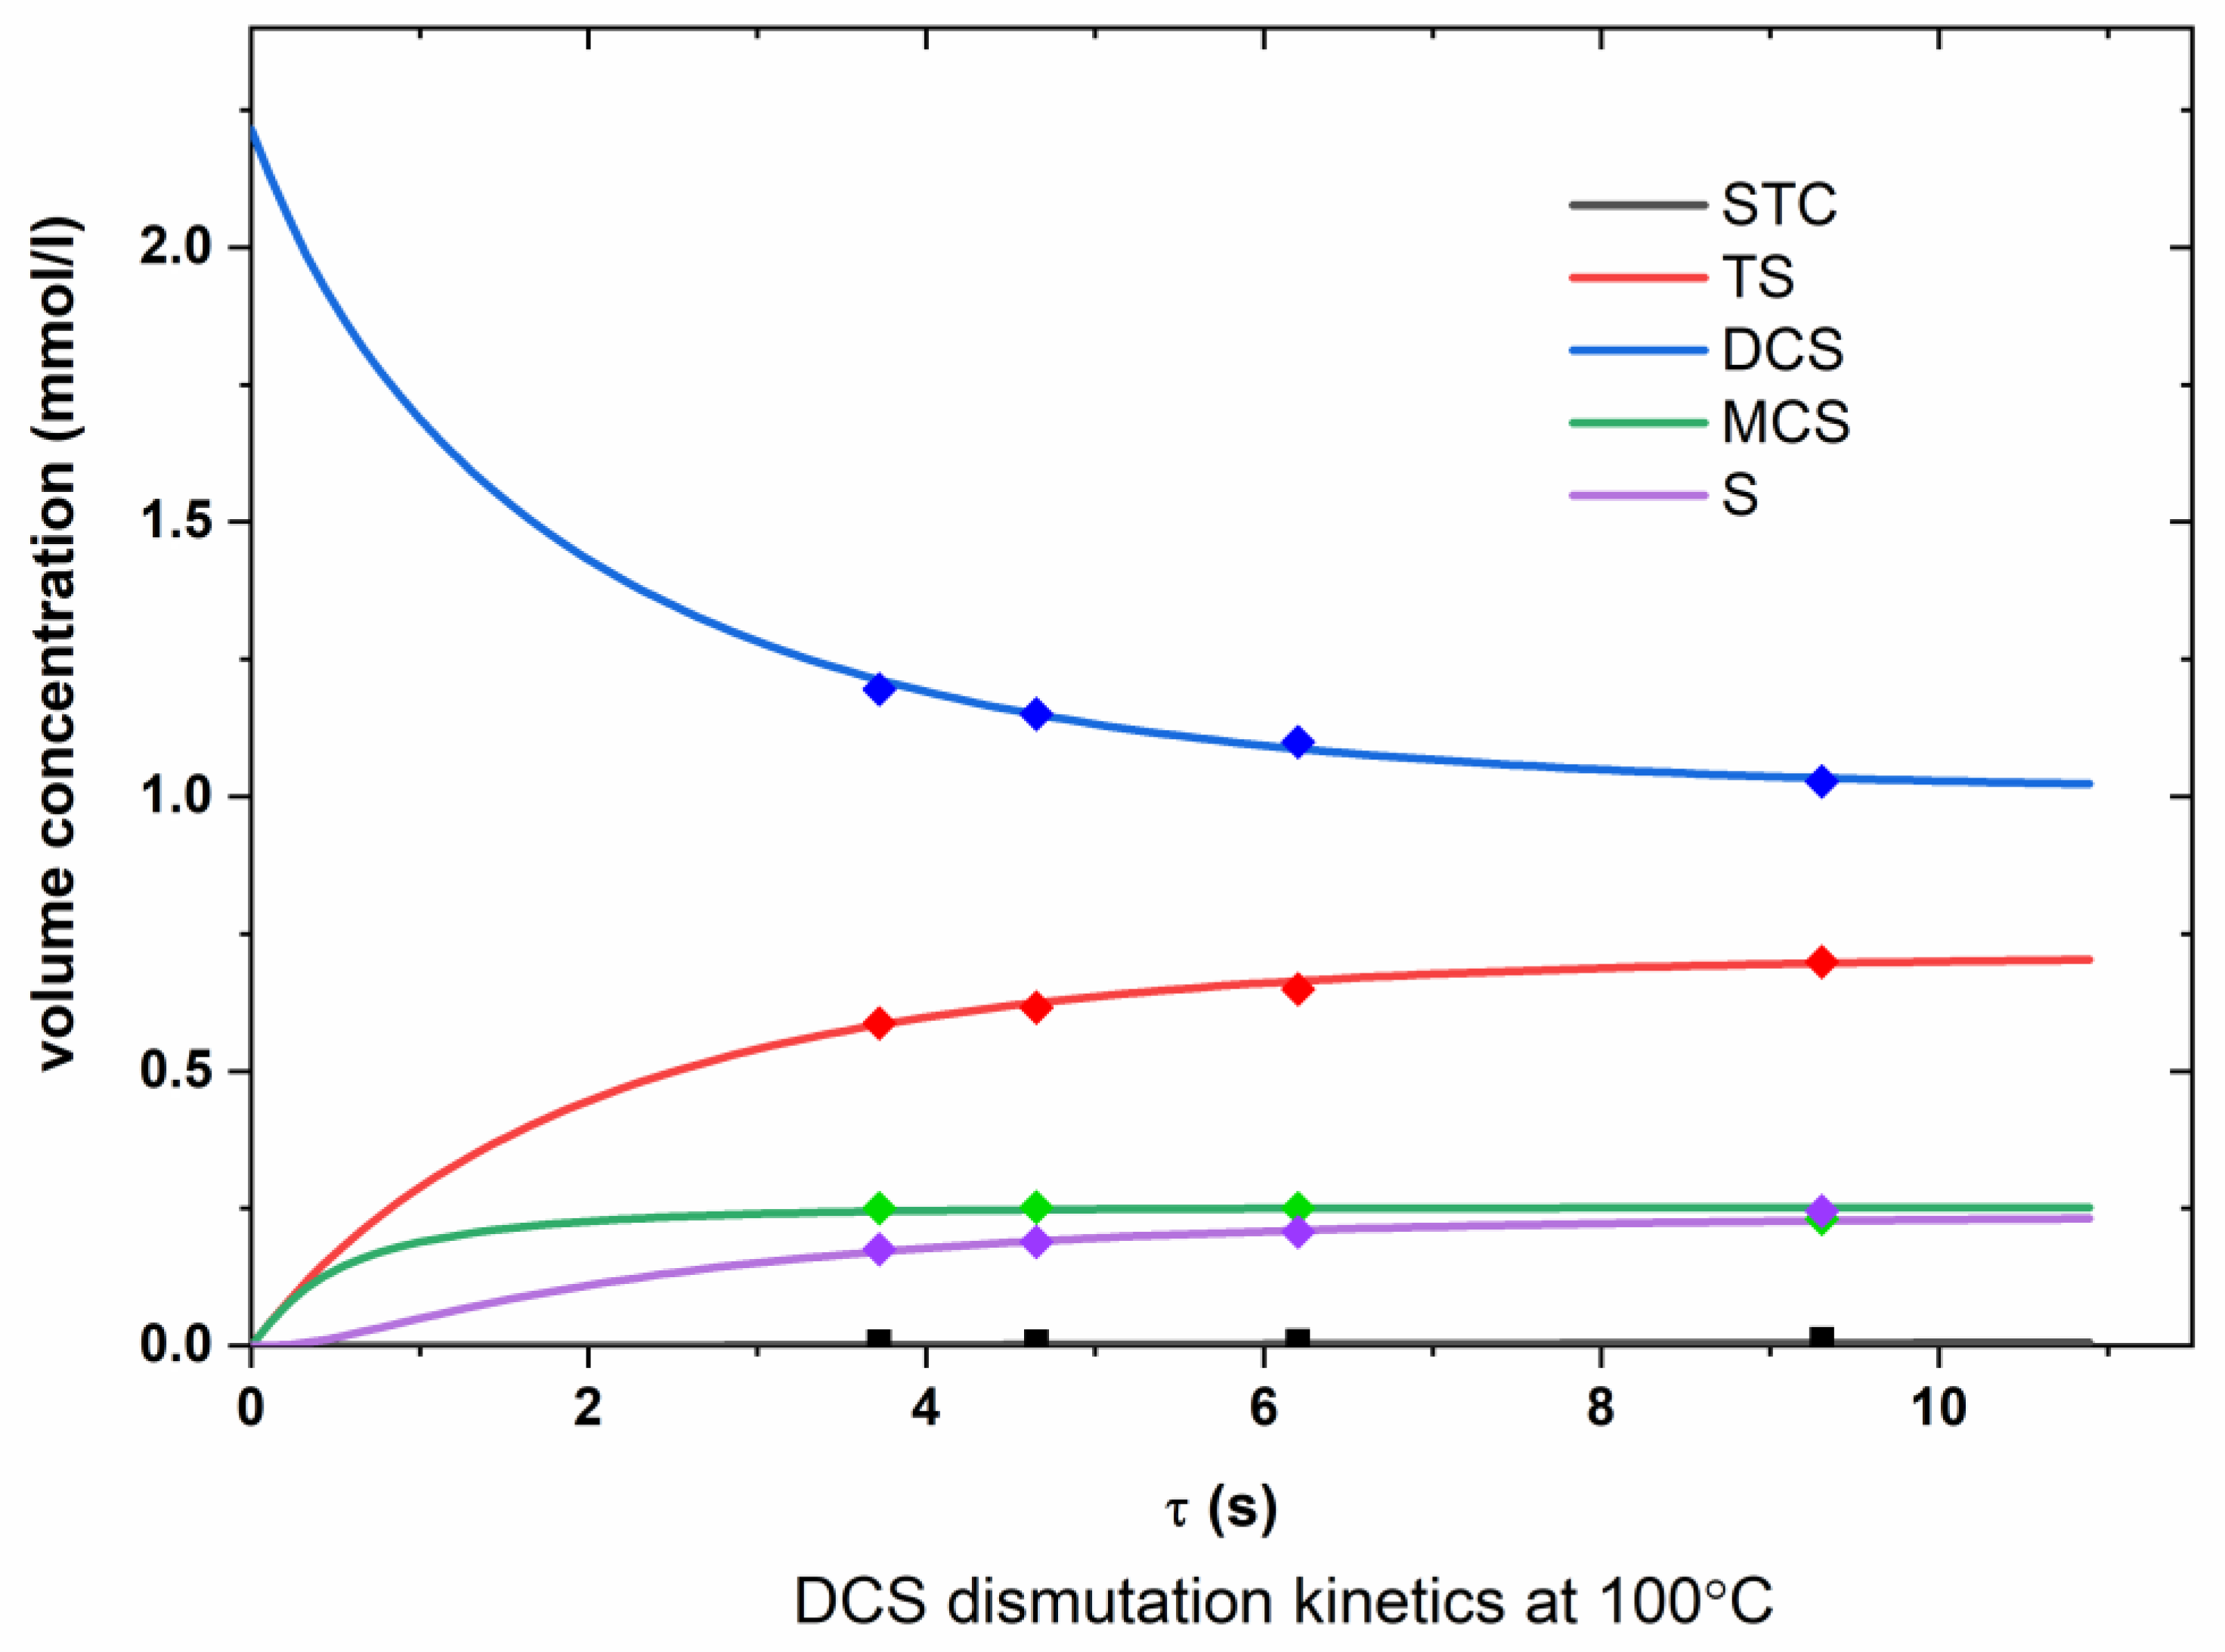
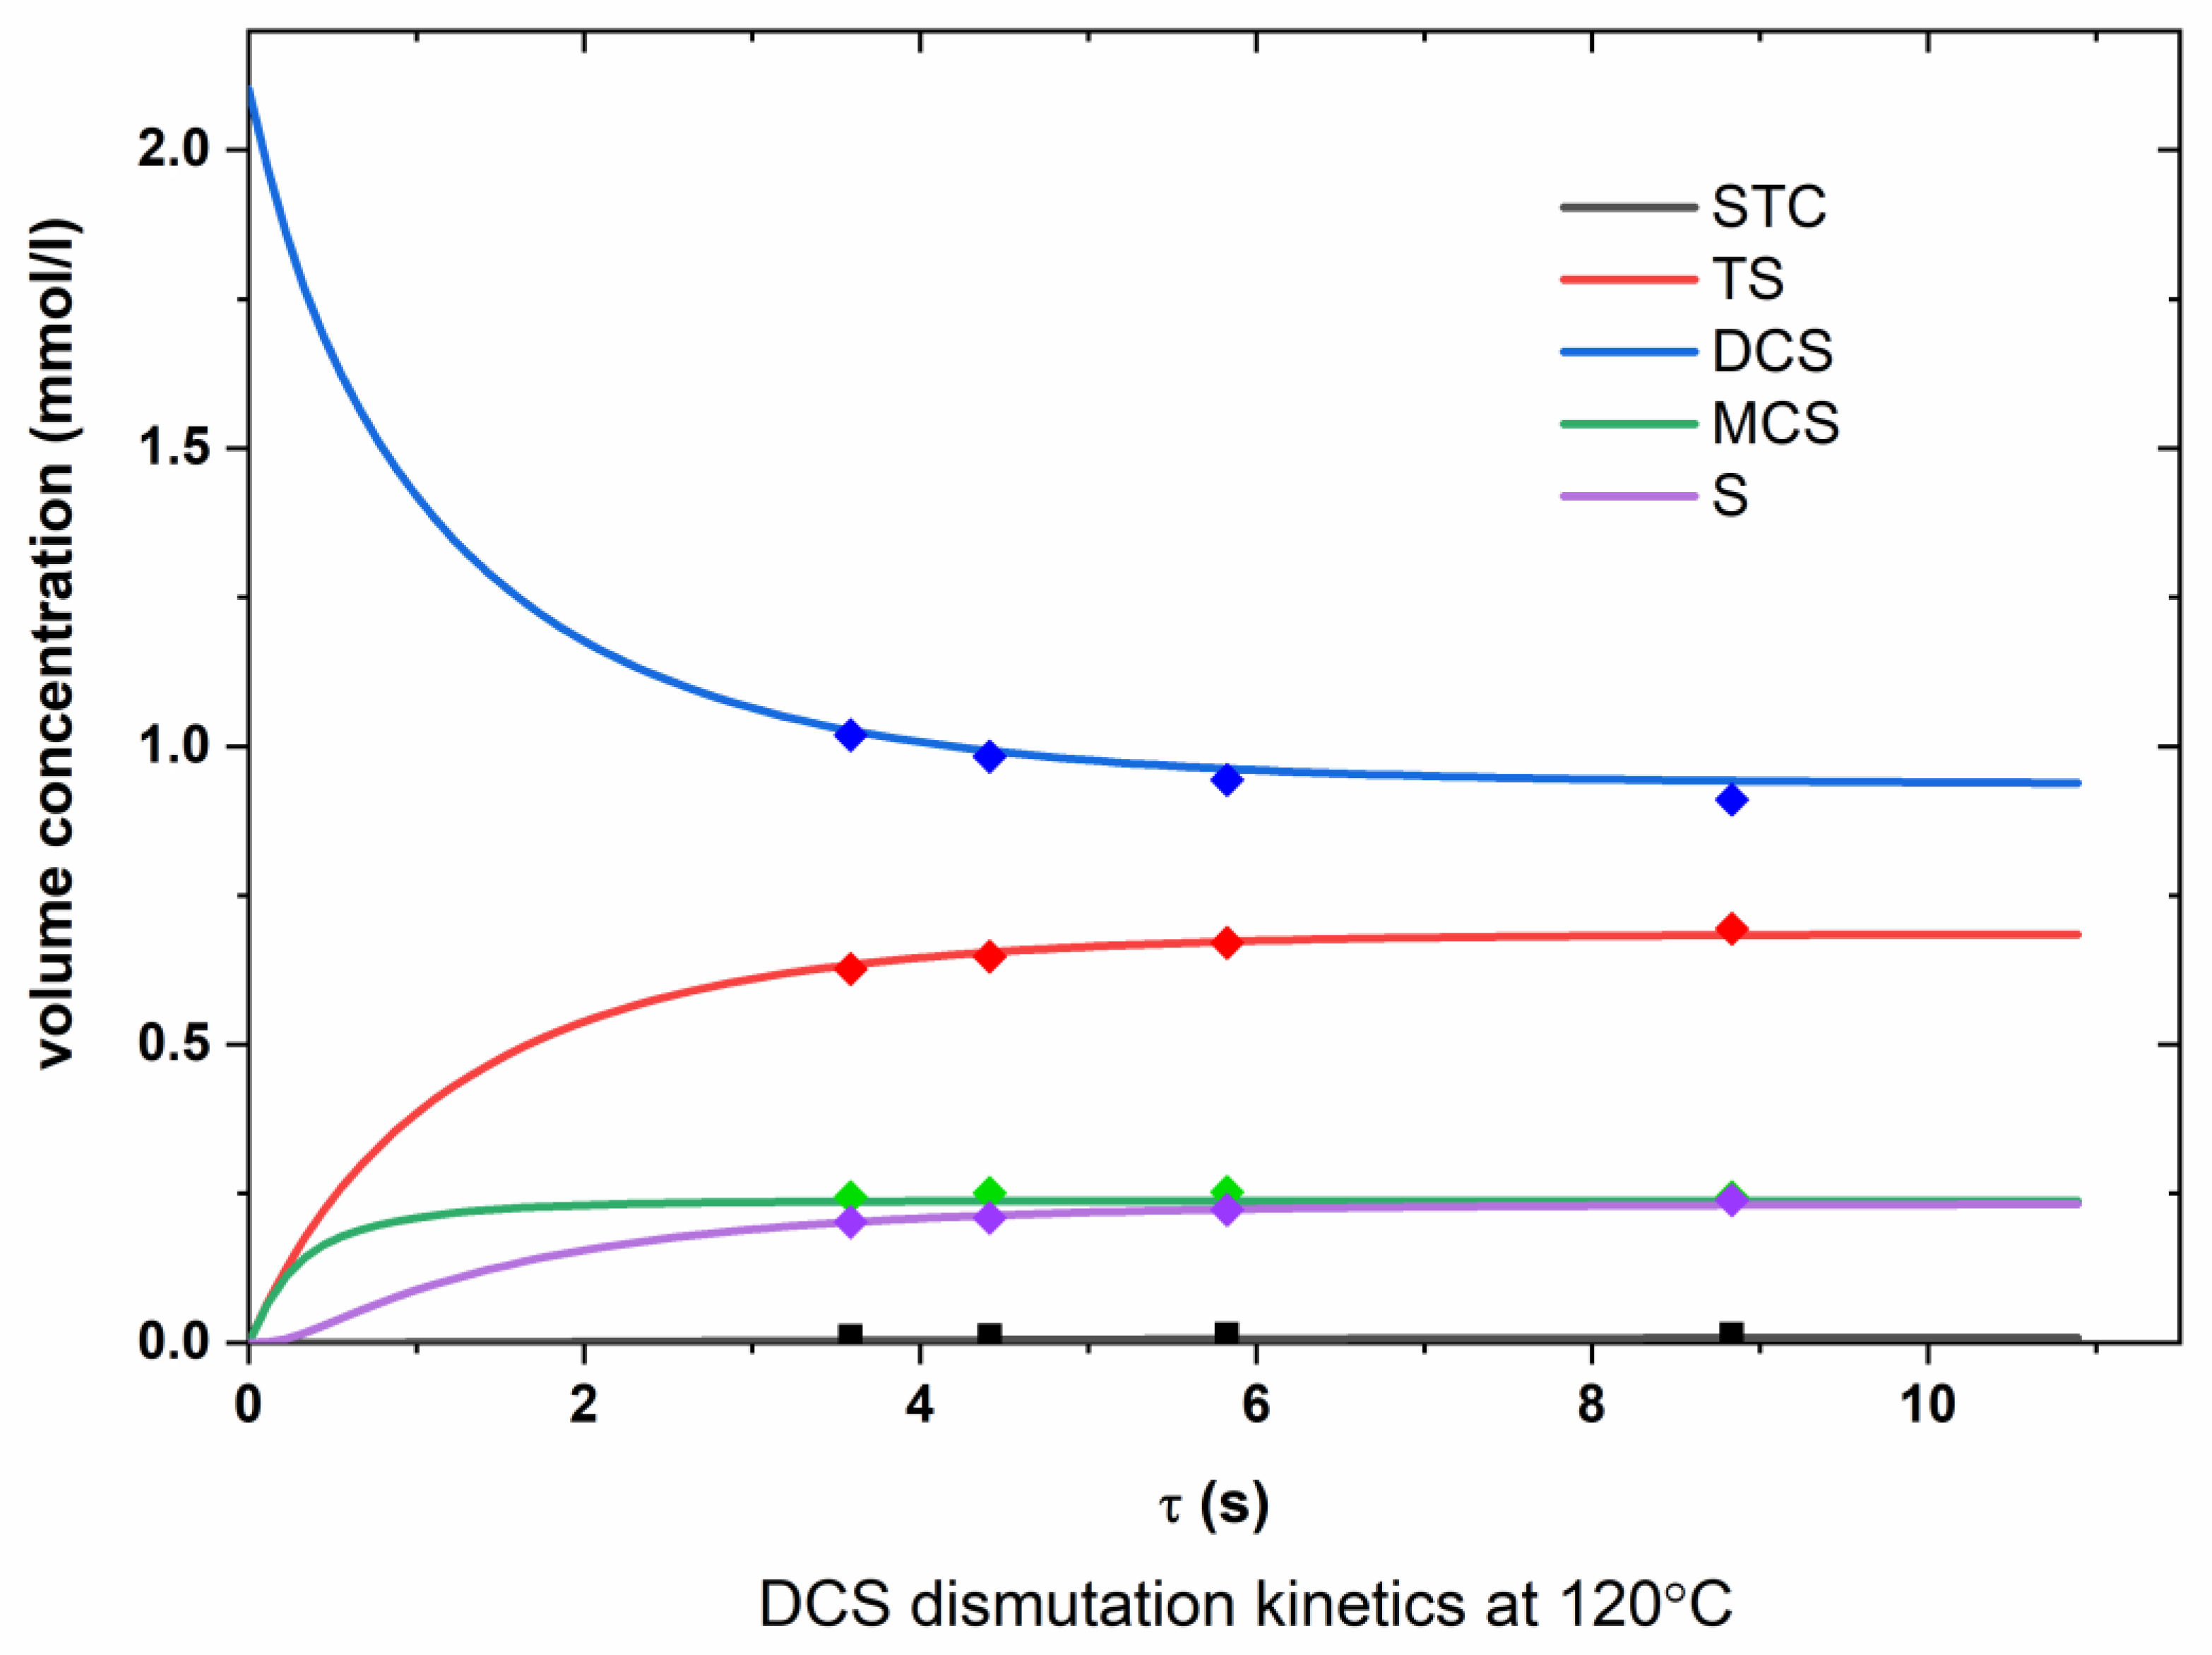
2.1. Kinetic Analysis

For the quantitative processing of the experimental results, it was necessary to solve the problem of choosing the form of the kinetic equation. Based on the data of [27] on the second order of direct and reverse reactions of TS’s dismutation (1), it is assumed that the reactions of the dismutation of DCS (2) and MCS (3) also have a second order, which corresponds to the formal kinetic approach to the description of the process under study. It was assumed that Equations (1)–(3) described not only the mass balance but also the kinetic scheme of the process.
To obtain information about the rate and depth of reactions (1)–(3) from the experimental data (i.e., to solve the inverse kinetic problem), the approach described in [26] was used for the dismutation reactions of the liquid chlorosilanes.
To solve the kinetic problem, a system of Equations (6) for reactions (1)–(3) was compiled:
d C S T C d τ = k 1 C T S 2 k 1 C S T C C D C S ; d C T S d τ = k 2 C D C S 2 k 2 C T S C M C S 2 k 1 C T S 2 + 2 k 1 C S T C C D C S ; d C D C S d τ = k 1 C T S 2 k 1 C S T C C D C S 2 k 2 C D C S 2 + 2 k 2 C T S C M C S + k 3 C M C S 2 k 3 C S C D C S ; d C M C S d τ = k 2 C D C S 2 k 2 C T S C M C S 2 k 3 C M C S 2 + 2   k 3 C S C D C S ; d C S d τ = k 3 C M C S 2 k 3 C S C D C S .
The rate constants of the direct and reverse reactions are optimized using the least squares method. During optimization, the calculated concentrations of C i τ , obtained by the numerical integration of the system (6), were maximally approximated to the experimental data. The relative approximation error in calculating the reaction rate constants did not exceed 0.1%.
Since the experiments with TS and DCS were carried out at the same set of reactor temperatures, the concentration data obtained at each temperature value for the two substances were used to optimize a single set of rate constants for all reactions, (1)–(3).
The values of the rate and equilibrium constants of chemical reactions (1)–(3), optimized by the least squares method, are presented in Table 3. The data obtained allow for determining the C i = f τ characteristics.
From the graphs presented in Appendix A (Figure A1, Figure A2, Figure A3, Figure A4, Figure A5 and Figure A6), it can be seen that the experimental points are in good agreement with the calculated lines obtained as a result of optimizing the values of the rate constants of the dismutation reactions.
According to Figure A1, Figure A2, Figure A3, Figure A4, Figure A5 and Figure A6 (Appendix A), the optimized data are in satisfactory agreement with the experimental results.
The analysis of the sources of the errors in the measurement results and calculations showed that the main error was the measurement of the concentration of the components in the reaction mixture, and the relative error did not exceed 5%.
This fact was taken into account when presenting the results of the calculations.
Limitations in the accuracy of the experimental data allow for only an approximate estimate of the activation energy, E a , for the TS, DCS, and MCS dismutation reactions.
The activation energy was calculated based on the experimental dependence of the reaction rate constant on the temperature in Arrhenius coordinates, shown in the Figure 1.
The values of E a and pre-exponential coefficient, A, with a relative error of correlation, not exceeding 4%, are obtained by fitting the dependencies ln k d i r and ln k r e v of reactions (1)–(3) on the inverse temperature in accordance with the Arrhenius equation, k = A e E a R T (Table 4).
The obtained values of the pre-exponential coefficient for the direct and reverse reactions of TS dismutation (1) are significantly higher than those found in [27] for the liquid-phase reaction: when at 80 °C, k1 = (3.01 ± 0.38)10−4 M−1s−1 and k−1 = (1.86 ± 0.25)10−2 M−1s−1. At the same time, the values of E a ,   d i r and E a ,   r e v , found in [27] for reaction (1) (36 and 29.6 kJ/mol, respectively), are close to those obtained here.
In [26], the values of the reaction rate constants (I–III) in the liquid phase (min−1, and the concentrations are expressed in mole fractions) were obtained, which satisfactorily agree with the data of [27] on the rate of TS’s dismutation. This makes it possible to compare the rates of direct reactions (1), (2), and (3). It follows from a comparison of the literature’s data [26,27] that the richer the initial molecule is in hydrogen, the higher the rates of direct reactions. So, at 56 °C, k1 = 7.23 · 10 2 , k2 = 5.32·10−1, and k3 = 4.21 min−1. The results of the kinetics experiment demonstrate the same trend but stronger; the constants differ by more than one decimal order.

2.2. Thermodynamics of Chlorosilanes Dismutation

The case is of interest to compare the values of the equilibrium constants of the TS, DCS, and MCS dismutation reactions obtained on the basis of experimental data with the calculation results based on the use of a change in the standard Gibbs function at the reaction temperature. The calculation was carried out using the literature’s data on changes in the enthalpy and entropy of the reaction under standard conditions.
Earlier, the authors of [28] calculated the equilibrium composition of the Si/H/Cl system for two industrially significant ratios of the total content of Cl/H atoms, regardless of the molecular shape, as well as two total pressures. It was found that in the temperature point of 400 K with two calculation options—pressure 1 bar, ratio Cl/H = 0.1, and pressure 35 bar, Cl/H = 1.0—the main component in the gas phase is molecular hydrogen, despite the high concentration of chlorine-containing compounds in the first case.
On the other hand, the equimolar Cl/H ratio in the second case (the same as in DCS) and high pressure should lead to a decrease in the number of moles of gases, i.e., contribute to the formation of light chlorosilanes [29] by the reactions of the type:
3SiCl4(g) + Si(s) + 2H2(g) = 4SiHCl3(g),
However, as shown in [28], in both calculation variants, the main components following hydrogen in the reaction products are STC and TS, with a small admixture of DCS; MCS and silane, as well as hydrogen chloride, are absent.
In addition, kinetic studies [30,31] and quantum mechanical calculations [32] have established that the decomposition reactions of silane, MCS, DCS, TS, and STC [33], proceeding with the formation of silylenes SiHxCl2-x, H2, and HCl, have a high activation energy (above 250 kJ/mol) and proceed with noticeable speed only at temperatures above 600 K. Thus, the results of [28,33] make it possible to exclude SiHxCl2-x, H2, and HCl from consideration when calculating the thermodynamics of the dismutation reactions of chlorosilanes occurring at temperatures below 400 K and concentrate on the transformations of only five substances—STC, TS, DCS, MCS, and silane.
The composition of the equilibrium gas mixtures was calculated according to the values of thermodynamic equilibrium constants:
K eq = exp ( Δ r G T 0 / R T ) ,
where Δr G T 0 is the change in the standard Gibbs function of the reaction at temperature T.
The value of Δr G T 0 can be calculated by the equation
Δ r G T 0   = Δ r H T 0 T Δ r S T 0 ,
where Δr H T 0 is the change in the standard enthalpy of the reaction at temperature T, and Δr S T 0 is the change in the standard entropy of the reaction at temperature T, since the reaction was carried out at standard pressure and constant temperature.
The values of the enthalpy and entropy of the reaction at a given temperature are found by integrating the temperature dependencies of the corresponding quantities:
Δ r H T 0 = Δ r H 298 0 + 298 T r C P 0 d T ;
r S T 0   = r S 298 0 + 298 T r C P 0 T d T ,
where Δr H 298 0 and r S 298 0 are the change in the enthalpy and entropy of the reaction under standard conditions at 298 K, and r C P 0 is the difference of the molar isobaric heat capacities of the reaction products and starting substances under standard conditions.
The difference standard values at 298 K for reactions of the type 2A = B + C are calculated using reference data [34,35,36,37]:
Δ r H 298 0   = f H 298 , B   0 + f H 298 , C   0 2   f H 298 , A   0 ;
Δ r S 298 0   = S 298 , B   0 + S 298 , C   0 2 S 298 , A   0 ;
Δ r C P 0   = C P , B   0 + C P , C   0 2 C P , A   0 ,
where Cp is the molar isobaric heat capacity of a gaseous substance as a function of temperature, approximated by the Mayer–Kelly equation [37] with numerical coefficients a, b, and c:
Cp(T) = a + bT − c/T2.
Instead of Equations (9)–(14), the Shomate equations of the following form can be used, as in [35]:
f H T , i   0 = a t + bt 2 / 2 + ct 3 / 3 + dt 4 / 4 e t + f h ;
S T , i   0 = a ln t + bt + ct 2 / 2 + dt 3 / 3 e / ( 2 t 2 ) + g ,
where t = T(K)/1000 and a, b, c, d, e, f, g, and h are coefficients.
At the same time, the values Δr H T 0 and Δr S T 0 are calculated using equations similar to (11) and (12).
Since the initial thermodynamic data from various sources differ significantly, it makes sense to use the semi-empirical equation of the isobar of a chemical reaction obtained in [26] for three temperature values (32, 56, and 81 °C). The sixth column of Table 5 contains the results of extrapolation of the isobar equation [26] for calculating Keq in the temperature range of 353–393 K.
In the seventh and eighth columns of Table 5, the values Kp, obtained when processing the results of the experiment under static conditions and by the flow method, are presented. As a result of regression analysis of the system of Equation (6), the rate constants of the direct and reverse reactions were obtained, and Kp is a quotient obtained when it is divided by the rate constants of the direct and reverse reactions.
From the data presented in Table 5, it can be seen that the results of the calculations differ significantly. This is due to the fact that the calculation requires accurate thermodynamic data on the values of the enthalpies of the formation, entropies, and temperature dependence of the heat capacity of all the substances involved in the cascade of the reactions of the TS, DCS, and MCS disproportionation.
In the reference literature [34,35], these values are presented with a relative error of 1–10%, which, when calculating the equilibrium constants, gives a deviation of up to two decimal orders (Table 5).
The third column of Table 5 presents the results of calculating the Keq of the mixtures according to Equations (7)–(14) using the data [34]; the fourth is according to Equations (7), (8), and (15), (16) with the data [35], and the fifth is according to the same formulas using f H T , i   0 [36], refined in [26].
A comparison of the Kp values in Table 5 shows that the calculation results using the data of [26] are in good agreement with the experimental ones. In addition, it can be noted that the Kp obtained by processing the results of static and kinetic experiments are in good agreement with each other. Consequently, the use of the proposed system of kinetic equations for calculating the rate constants of the dismutation reactions of chlorosilanes is justified since it does not contradict the results of static measurements and is in good agreement with the literature data from [26].

2.3. Calculation of Equilibrium Concentrations Based on the Values of Keq

Having compiled a system of differential Equations (6) of the form
d C i d τ = f k 1 , k j ,   C 1 , C i ,
where C 1 , C i are the concentrations of the reacting substances, and k 1 , k j are the rate constants of the direct and reverse reactions of the second order according to Equations (1)–(3), it was additionally verified by applying it to calculate the composition of the equilibrium reaction mixture and comparing the results with the data in [26] and the experimental data. A numerical solution of this system of equations was performed to calculate the equilibrium concentrations under the condition τ→∞. The condition for the end of the calculations was the achievement of the immutability of the values of C i in a given error interval. Since the equilibrium concentrations at the given C i 0 are uniquely determined by the equilibrium constants Keq, the rate constants for their calculation can be chosen arbitrarily in compliance with the condition k d i r k r e v = K e q .
Based on these considerations, an algorithm was compiled for calculating the equilibrium concentrations using the value of Keq. Numerical integration was carried out using the Euler method, which is based on the approximation of the function ( C i ) by its derivative with small changes in the argument (τ).
The compositions of the equilibrium mixtures calculated for the case of the disproportionation of pure TS and DCS using the equilibrium constants from [26] are given in Table 6. For the convenience of comparison, it also presents the experimental data from Table 1.
From the data presented in Table 6, it can be seen that the results of the experiment on the study of thermodynamics and kinetics of dismutation reactions of chlorosilanes do not contradict each other and are in good agreement with the literature data [26]. Consequently, the system of Equation (6) proposed for calculation and the values of the rate constants of the dismutation reactions of chlorosilanes obtained by regression analysis from the experimental data can be used to calculate the composition of nonequilibrium mixtures obtained at a given time of contact of chlorosilanes with a catalyst.
The use of kinetic representations for calculating the equilibrium composition is justified since the calculation results are in good agreement with the experimental results.

3. Discussion

As a result of the study of the equilibrium and kinetic characteristics of the reversible dismutation reactions of gaseous TS and DCS in the presence of the ion-exchange resin VP-1AP, the values of the equilibrium constants and rate constants of these reactions in the temperature range of 353–393 K were determined.
As a result of the study of the kinetic characteristics of the dismutation reactions of chlorosilanes, it was found that the catalytic activity of VP-1AP was not inferior to the catalysts known in the literature [38,39].
The value of the activation energy of the TS and DCS dismutation reaction in the vapor phase obtained on the basis of the experimental data was compared with the literature data on the kinetics of liquid-phase reactions. The comparison showed that the values of the activation energy of the reaction in the gas and liquid phases were close, despite the significant difference in the reaction rate. The value of the activation energy not exceeding 40 kJ/mol indicates a probable adsorption–desorption control of the process rate.
The analysis of the literature data [26,34,35,36] on the thermodynamic properties of STC, TS, DCS, MCS, and silane showed that their accuracy was insufficient to calculate the equilibrium constants of the cascade of reactions of the dismutation of chlorosilanes. As a result of the comparison with the experimental data, it was found that the semiempirical equation from [26] was the most applicable for calculation.
The system of kinetic equations is proposed for the kinetic characteristics of the cascade of the reactions of the dismutation of chlorosilanes, using which of the reaction rate constants were calculated on the basis of experimentally determined kinetic curves. The proposed system of kinetic equations was applied to calculate the equilibrium composition of the reaction mixture when the contact time tends to infinity. The calculation results were compared with the experimental data and with those known from the literature [26]. A good agreement between the literature, calculated, and experimental data has been established. Consequently, the proposed system of kinetic equations and the rate constants of the chlorosilane dismutation reactions are applicable for calculating the nonequilibrium composition of the reaction mixture at a given contact time with the VP-1AP catalyst.

4. Materials and Methods

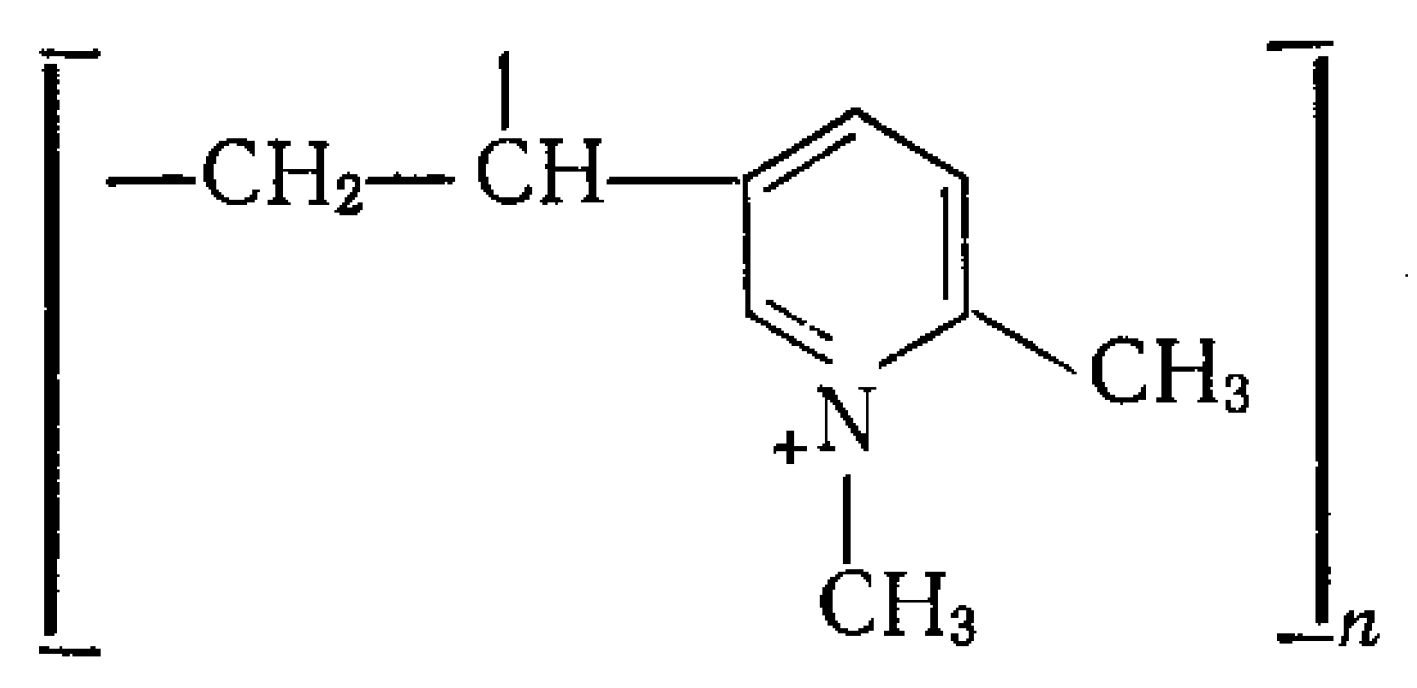
4.1. Reagents and Catalyst

VP-1AP resin, produced by OAO VNIIKhT, is a strongly basic quaternary ammonium macroporous anionite, a copolymer of 2-methyl-5-vinylpyridine and divinylbenzene, and methylated by pyridine nitrogen (Figure 2).
VP-1AP resin is supplied in a sulfate form, so its preparation was required before the study. To do this, the samples were treated with a 10% solution of sodium hydroxide for conversion to the OH form and then with a 10% solution of hydrochloric acid for conversion to the Cl form. After these operations, the resin was washed with distilled water to a neutral reaction and dehydrated by weekly calcination in a helium stream at 200 °C, and no change in the color of the resin was observed.
TS, with a purity of 3N produced by OAO Khimprom, and DCS, with a purity of 99.5% produced by OOO HORST, were used in the experiments.

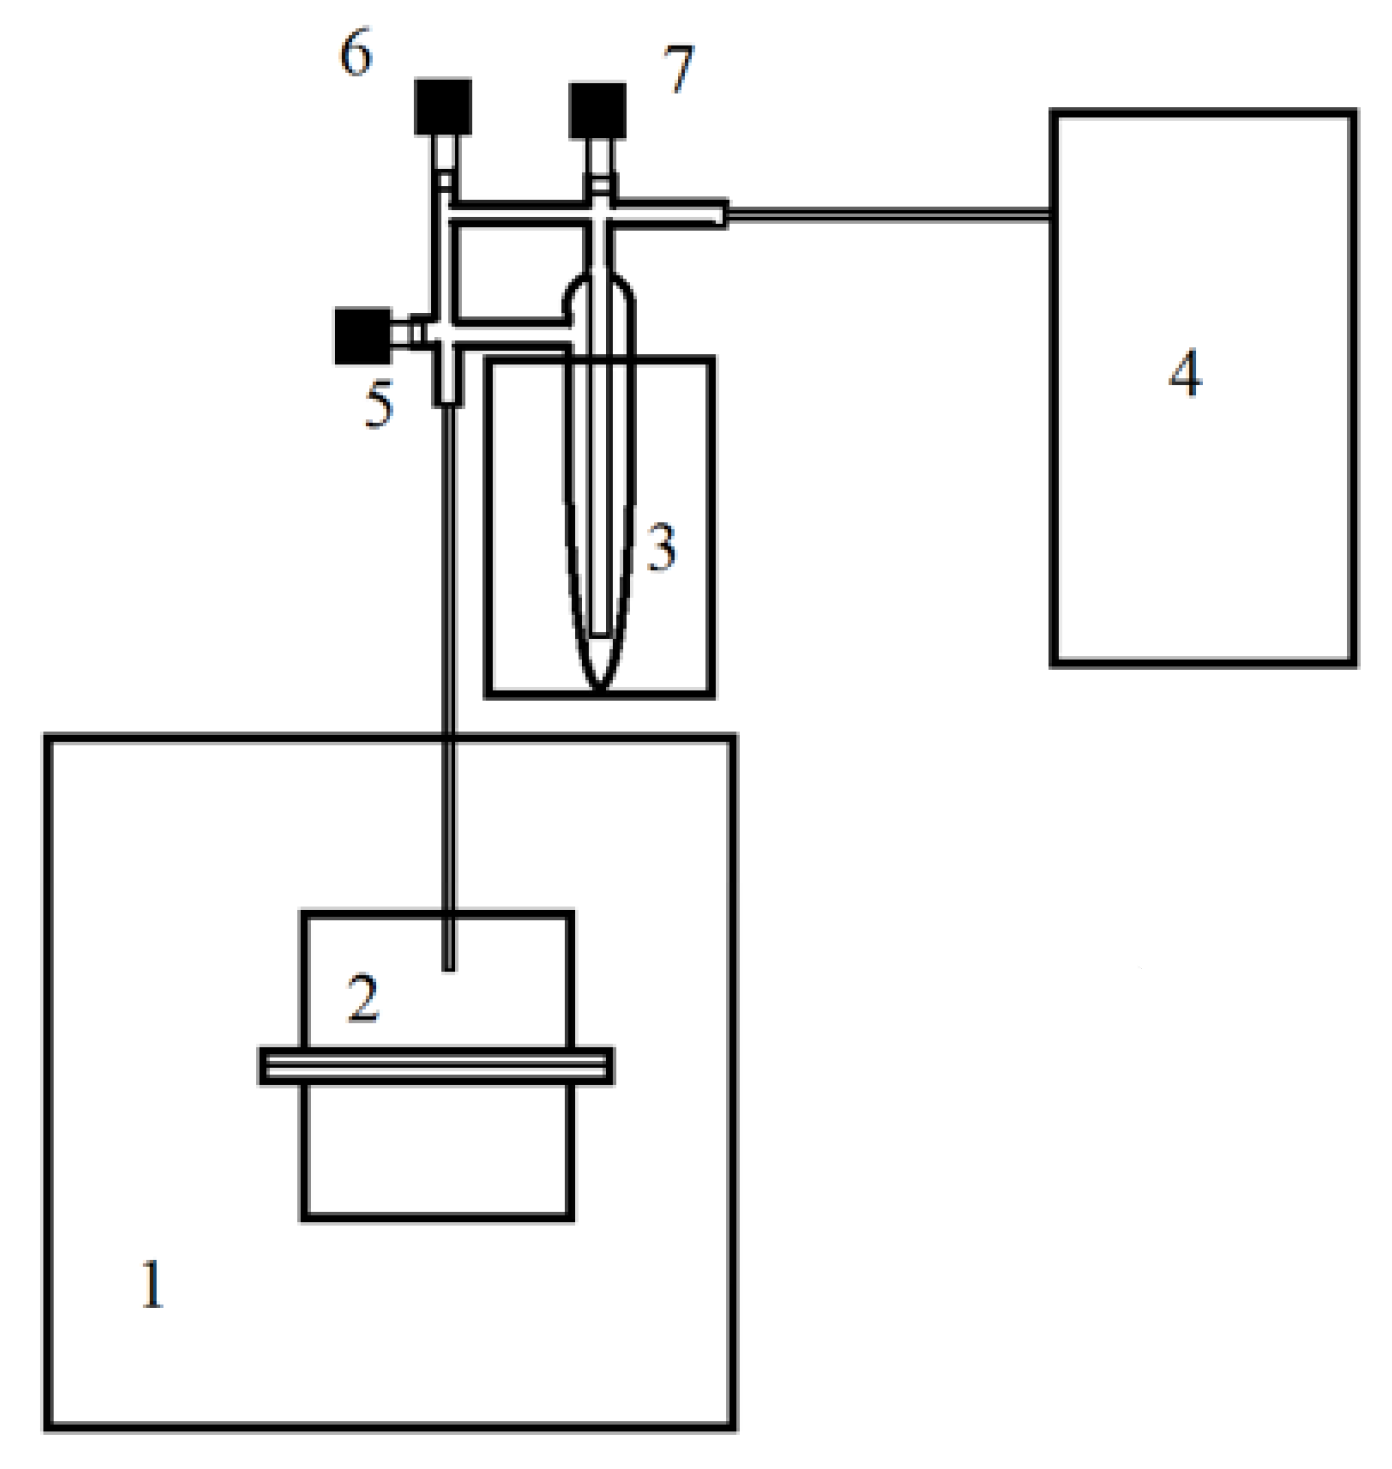
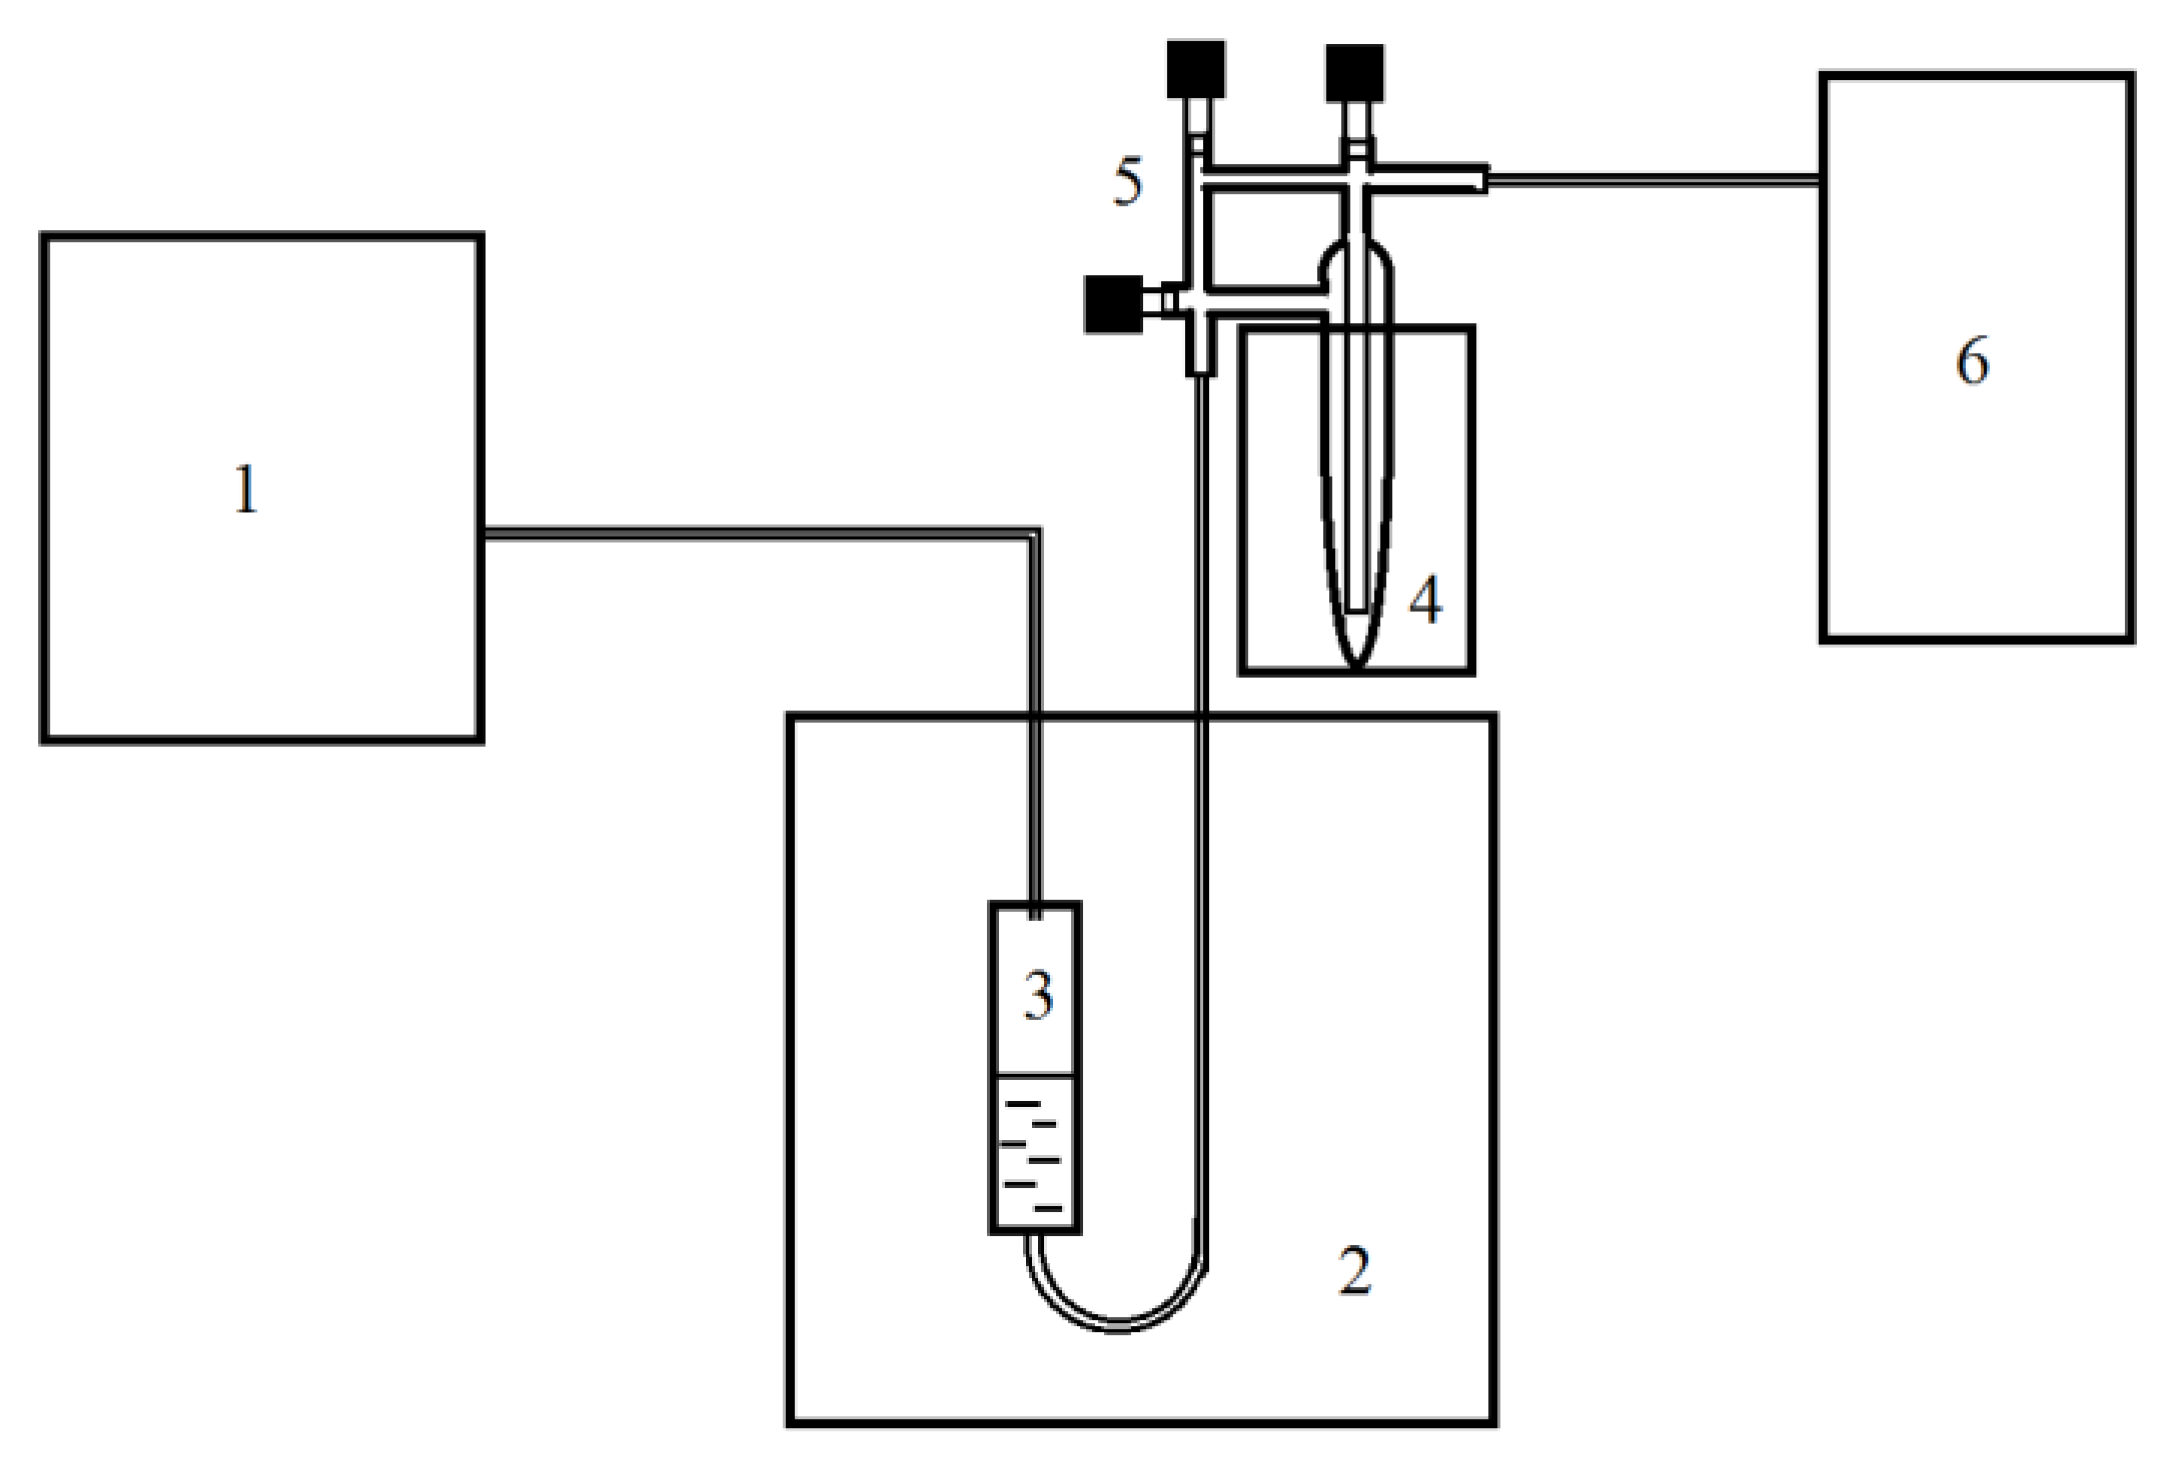
4.2. Design of Experiments

Determination of the composition of the reaction products under static conditions was carried out on the installation shown in Figure 3.
Resin in the amount of 4.6 cm3 was poured into reactor 2 and placed in a thermostat. Saturated reagent vapor was injected into the reactor from the ampoule 3. During exposure for 1–24 h, a mixture of disproportionation reaction products from the reactor was fed into a chromatograph, and its composition was determined. The composition of the gas phase at the reactor outlet was determined on a chromatographic analyzer using a thermal conductivity detector made on the basis of the chromatograph Chromos GC-1000, connected to a computer with the installed software, Chromosome. The separation of the mixture was carried out in a 4 m long column made of a 4 × 0.5 mm stainless-steel tube filled with chromaton with E-301 methylsilicon elastomer applied to it in an amount of 15%. The absolute calibration method was used to calculate the concentrations. The relative error in determining the concentrations of the reaction products did not exceed 4%.
To study the kinetic characteristics of the catalyst, experiments were carried out in a flow reactor according to the scheme shown in Figure 4. Resin in an amount of 4 or 4.6 mL with a porosity of 0.53 was placed in the thermostated reactor 3. The reactor was thermostated in a chromatograph thermostat 2. Chlorosilane was in a glass bubbler ampoule 5 placed in a cryostat 4 operating in the temperature range of 213–283 K. To supply the reagent steam to the reactor, bubbling with a carrier gas (helium of grade 6.0) was used through a bubbler 5. The content of chlorosilane in the vapor–gas mixture at the reactor inlet was stabilized by cryostating the bubbler. The studies were carried out at different cryostat temperatures, carrier gas flow rates, and reactor temperatures. The composition of the mixture after the reactor was determined in chromatograph 1, according to the above procedure.

5. Conclusions

As a result of the study of the equilibrium and kinetic characteristics of reversible dismutation reactions of gaseous TS and DCS in the presence of ion-exchange resin VP-1AP, the values of the equilibrium constants and rate constants of these reactions in the temperature range of 353–393 K were determined.
As a result of the study of the kinetic characteristics of the dismutation reactions of chlorosilanes, it was found that the catalytic activity of VP-1AP is as good as that of the catalysts known in the literature [38,39].
The value of the activation energy of the TS and DCS dismutation reaction in the vapor phase, first obtained on the basis of the experimental data, was compared with the literature data on the kinetics of liquid–phase reactions. The comparison showed that the values of the activation energy of the reaction in the gas and liquid phases were close, despite the significant difference in the reaction rate. The value of the activation energy not exceeding 40 kJ/mol indicates a probable adsorption–desorption control of the process rate.
For the first time, the analysis of the possibility of using the literature data on the thermodynamic properties of STC, TC, DCS, MCS, and silane to calculate the equal composition of the reaction mixture was carried out. The analysis of the literature data [26,34,35,36] on the thermodynamic properties of STC, TS, DCS, MCS, and silane showed that their accuracy was insufficient to calculate the equilibrium constants of the cascade of reactions of the dismutation of chlorosilanes.
As a result of the comparison with the experimental data, it was found that the semiempirical equation from [26] was the most applicable for calculation.
For the first time, a system of kinetic equations was proposed for calculating the characteristics of the cascade of reactions of chlorosilanes’ dismutation, using which of the reaction rate constants were calculated based on the experimental kinetic curves. The simulation results were used to calculate the equilibrium constant. A comparison of the equilibrium constants obtained as a result of the experiment under static conditions by the flow method and those known from the literature [26] showed good agreement. Also, the proposed system of kinetic equations was applied to calculate the equilibrium composition of the reaction mixture when the contact time tends to infinity. The simulation results were compared with the experimental data obtained under static conditions and with those known in the literature [26]. The good agreement between the literature, calculated, and experimental data allows for using the proposed system of kinetic equations and the rate constants of chlorosilane dismutation reactions to calculate the nonequilibrium composition of the reaction mixture at a given contact time with the VP-1AP catalyst.
Hence, the proposed system of kinetic equations describes not only the material balance but also a kinetic scheme of the cascade of reactions of chlorosilanes’ dismutation, which gives it a high degree of generality.
Further development of the study is associated with the use of the obtained kinetic data to calculate the composition of the reaction mixture, leaving the reaction apparatus under the condition of a limited contact time with the catalyst VP-1AP and then the experimental verification of the results obtained.

Author Contributions

Conceptualization, G.M. and Y.S.; methodology, G.M.; software, Y.S.; validation, G.M., Y.S. and O.Z.; formal analysis, O.Z.; investigation, O.Z.; data curation, G.M.; writing—original draft preparation, Y.S.; writing—review and editing, G.M.; visualization, Y.S. and O.Z.; supervision, G.M.; project administration, G.M.; funding acquisition, G.M. All authors have read and agreed to the published version of the manuscript.

Funding

The work was carried out within the framework of the state task in the field of scientific activity (subject No. FSWE-2022-0008).

Informed Consent Statement

Informed consent was obtained from all subjects involved in the study.

Data Availability Statement

Not applicable.

Conflicts of Interest

The authors declare no conflict of interest.

Appendix A

Dependencies C i t and their approximation.
Experimental data are depicted as points; the approximation is a solid line.

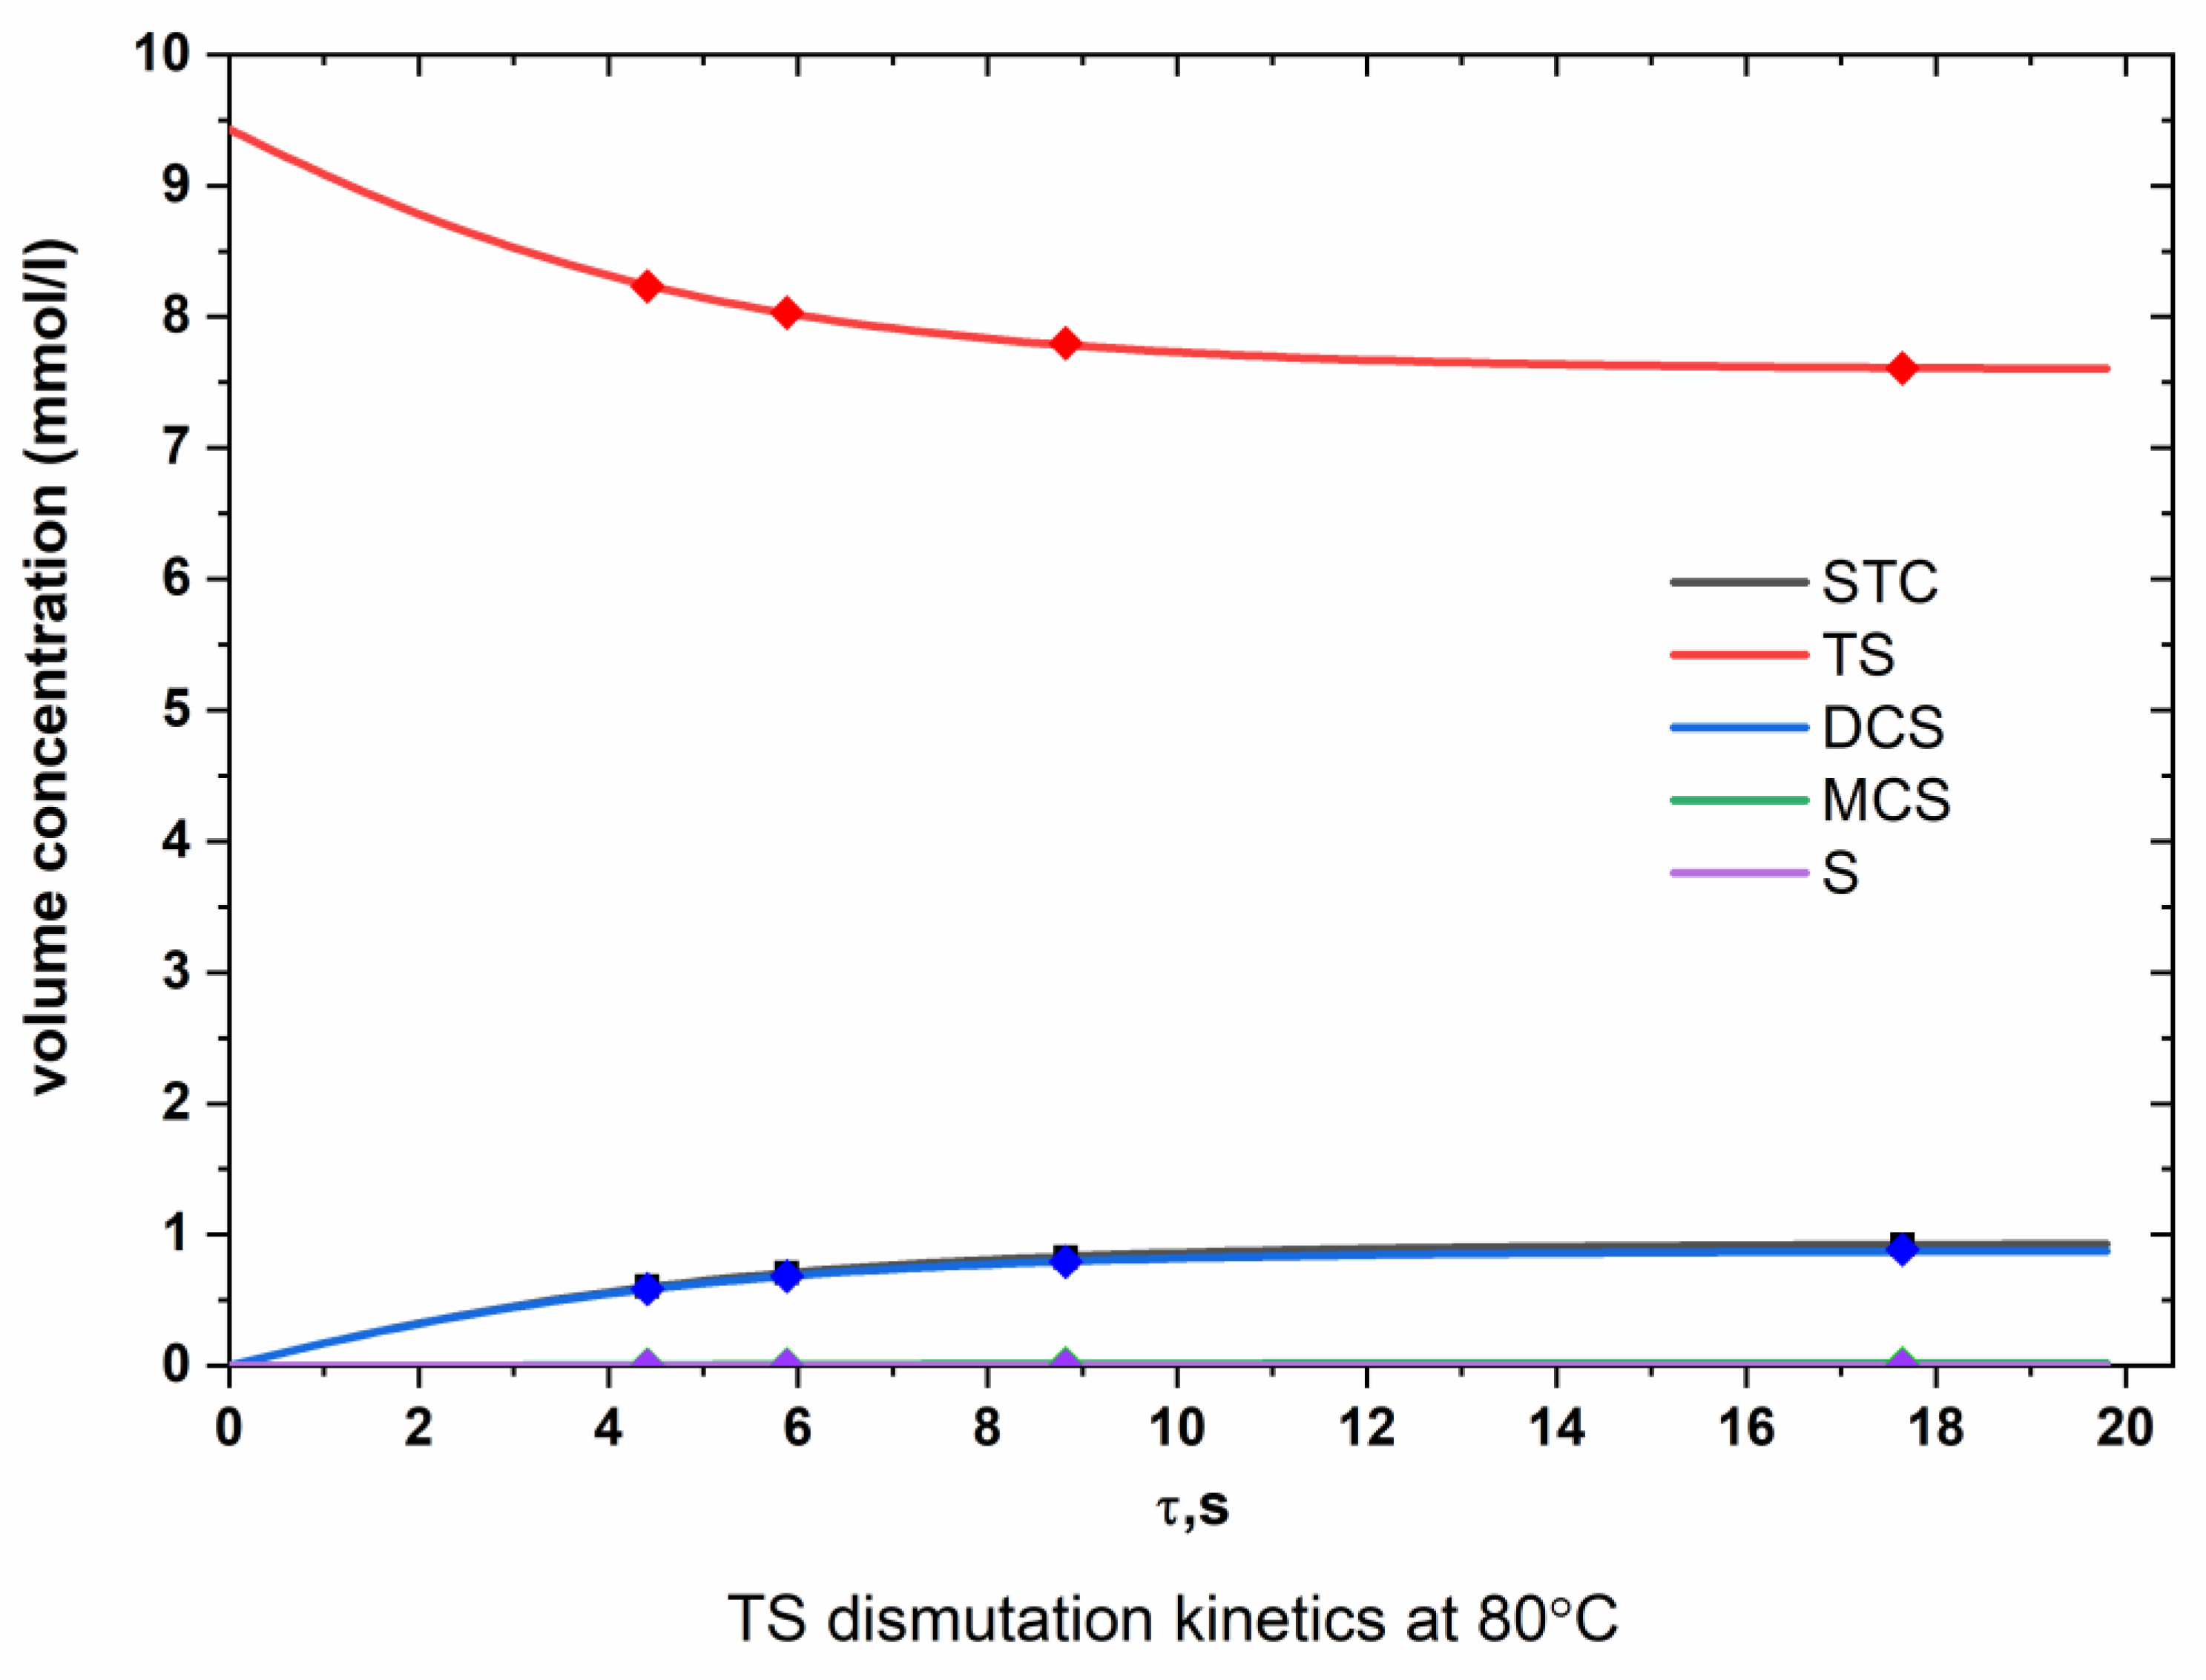
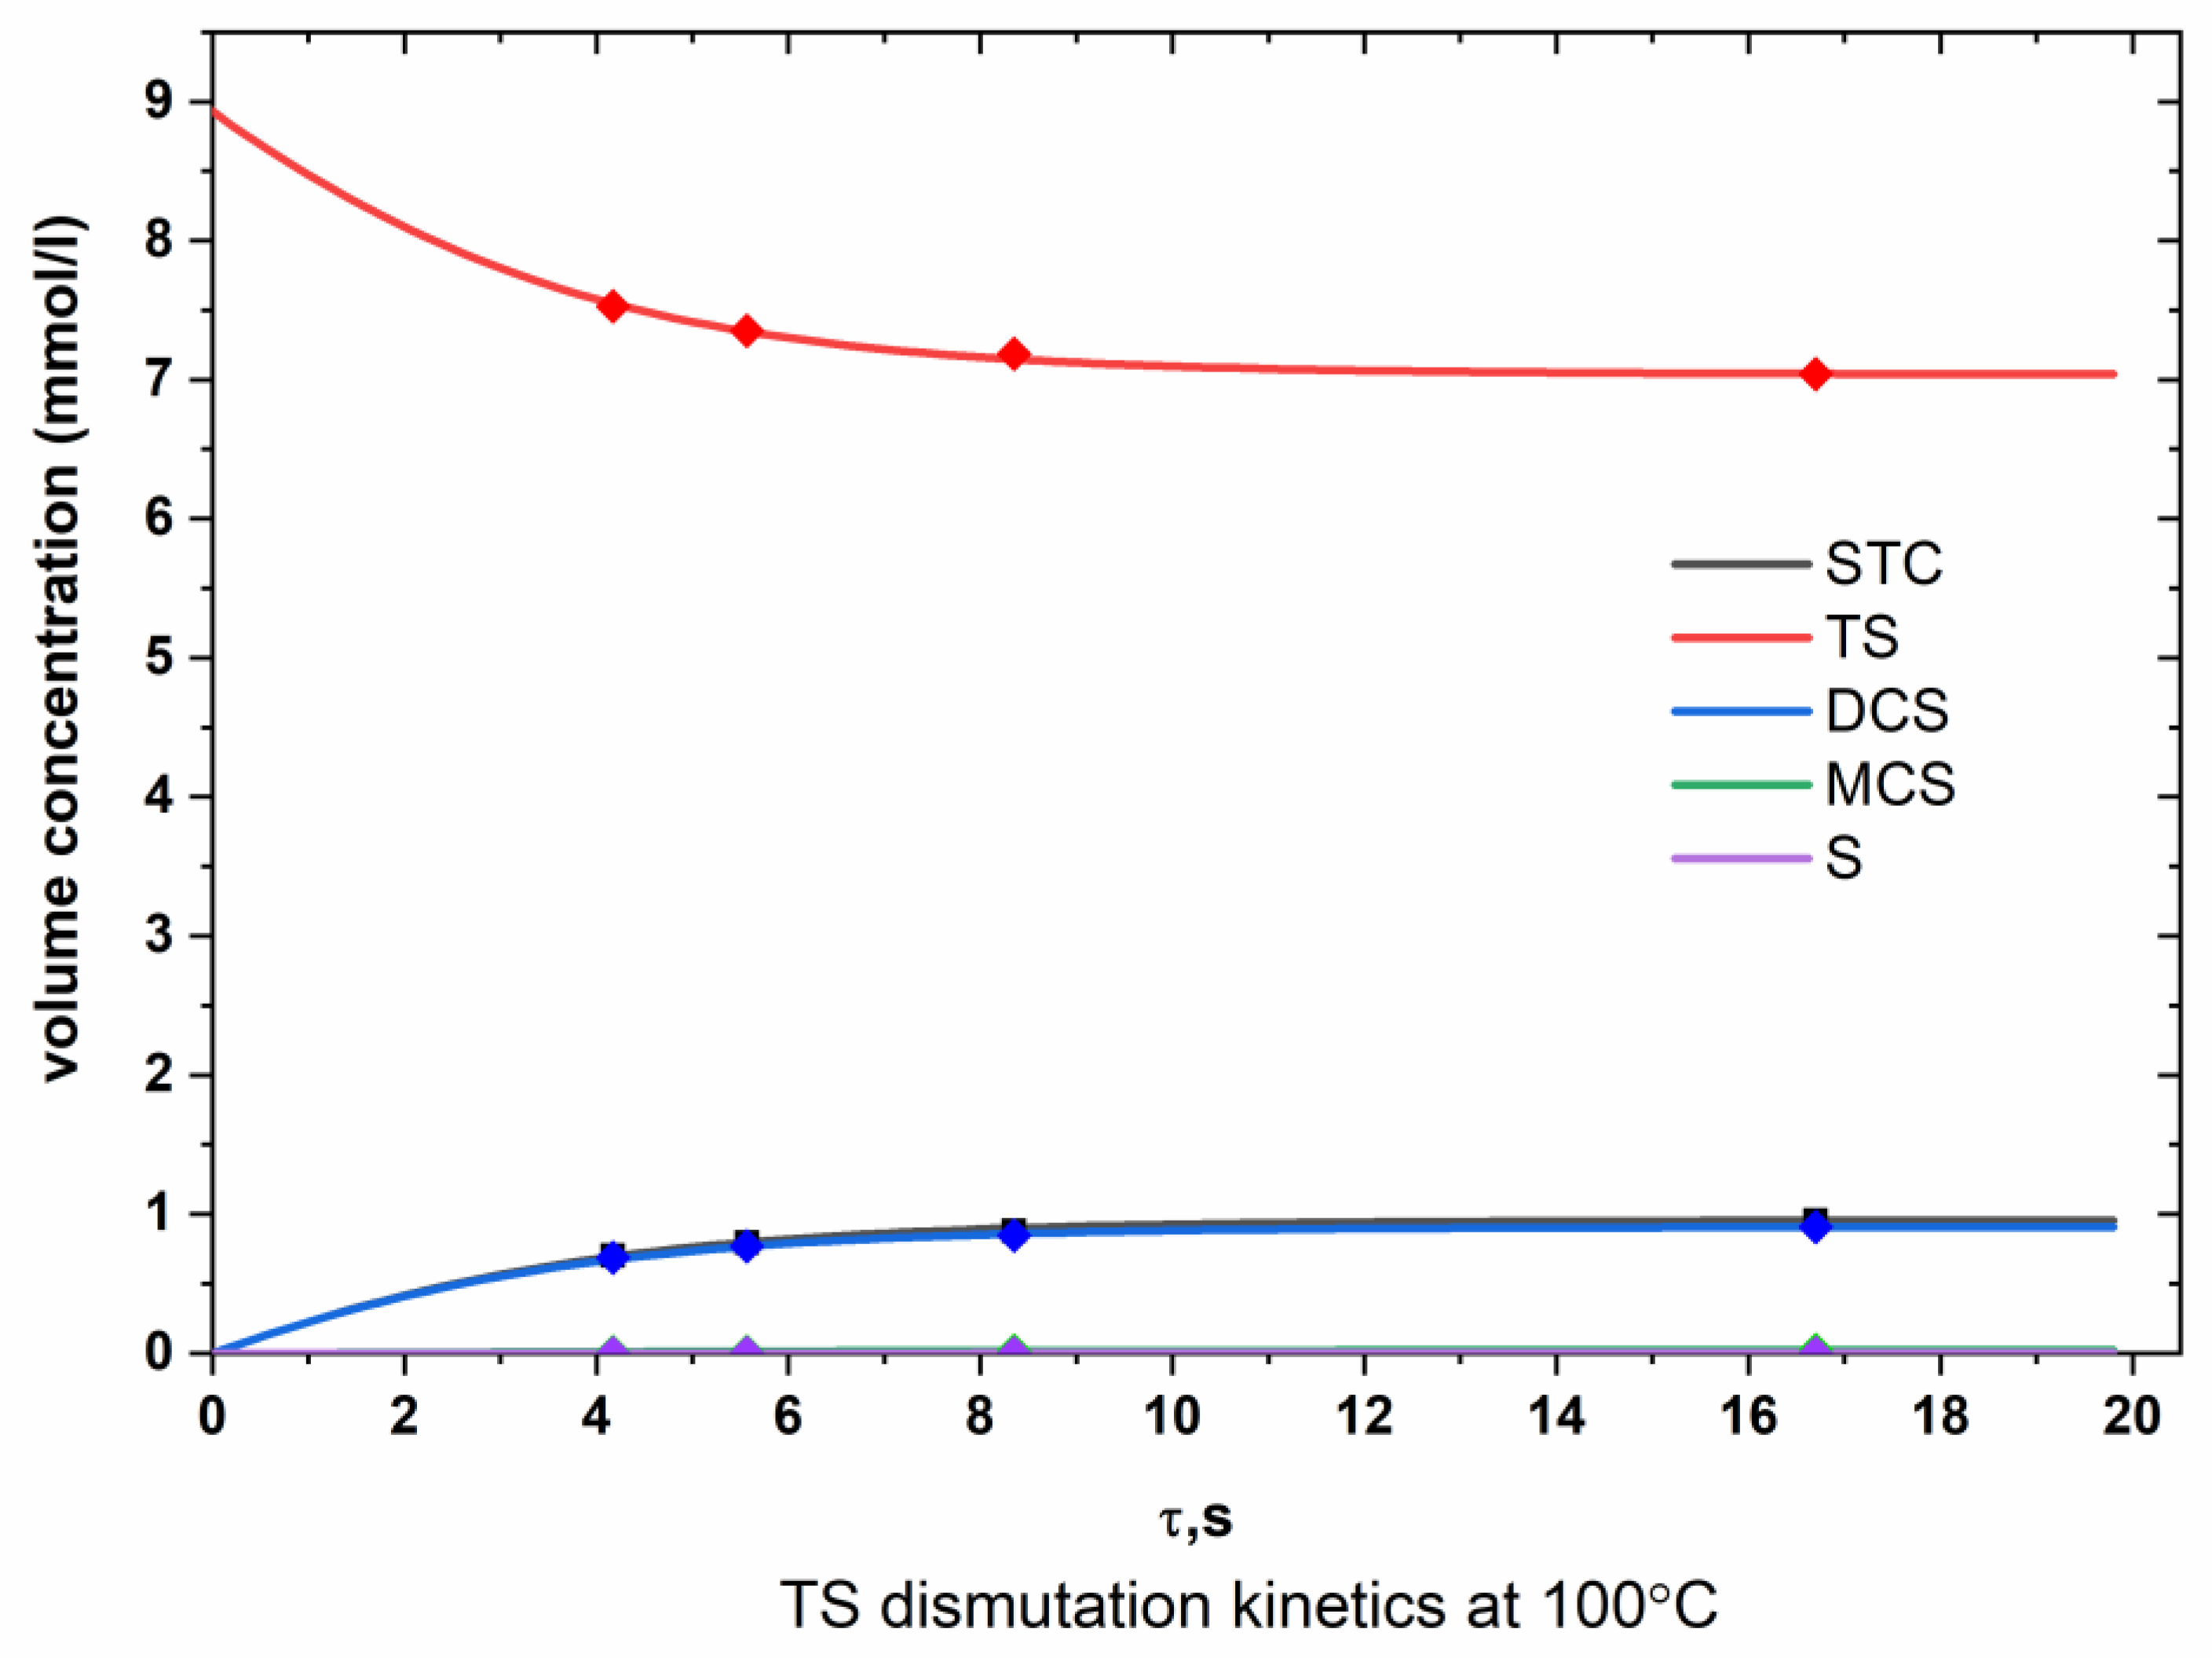
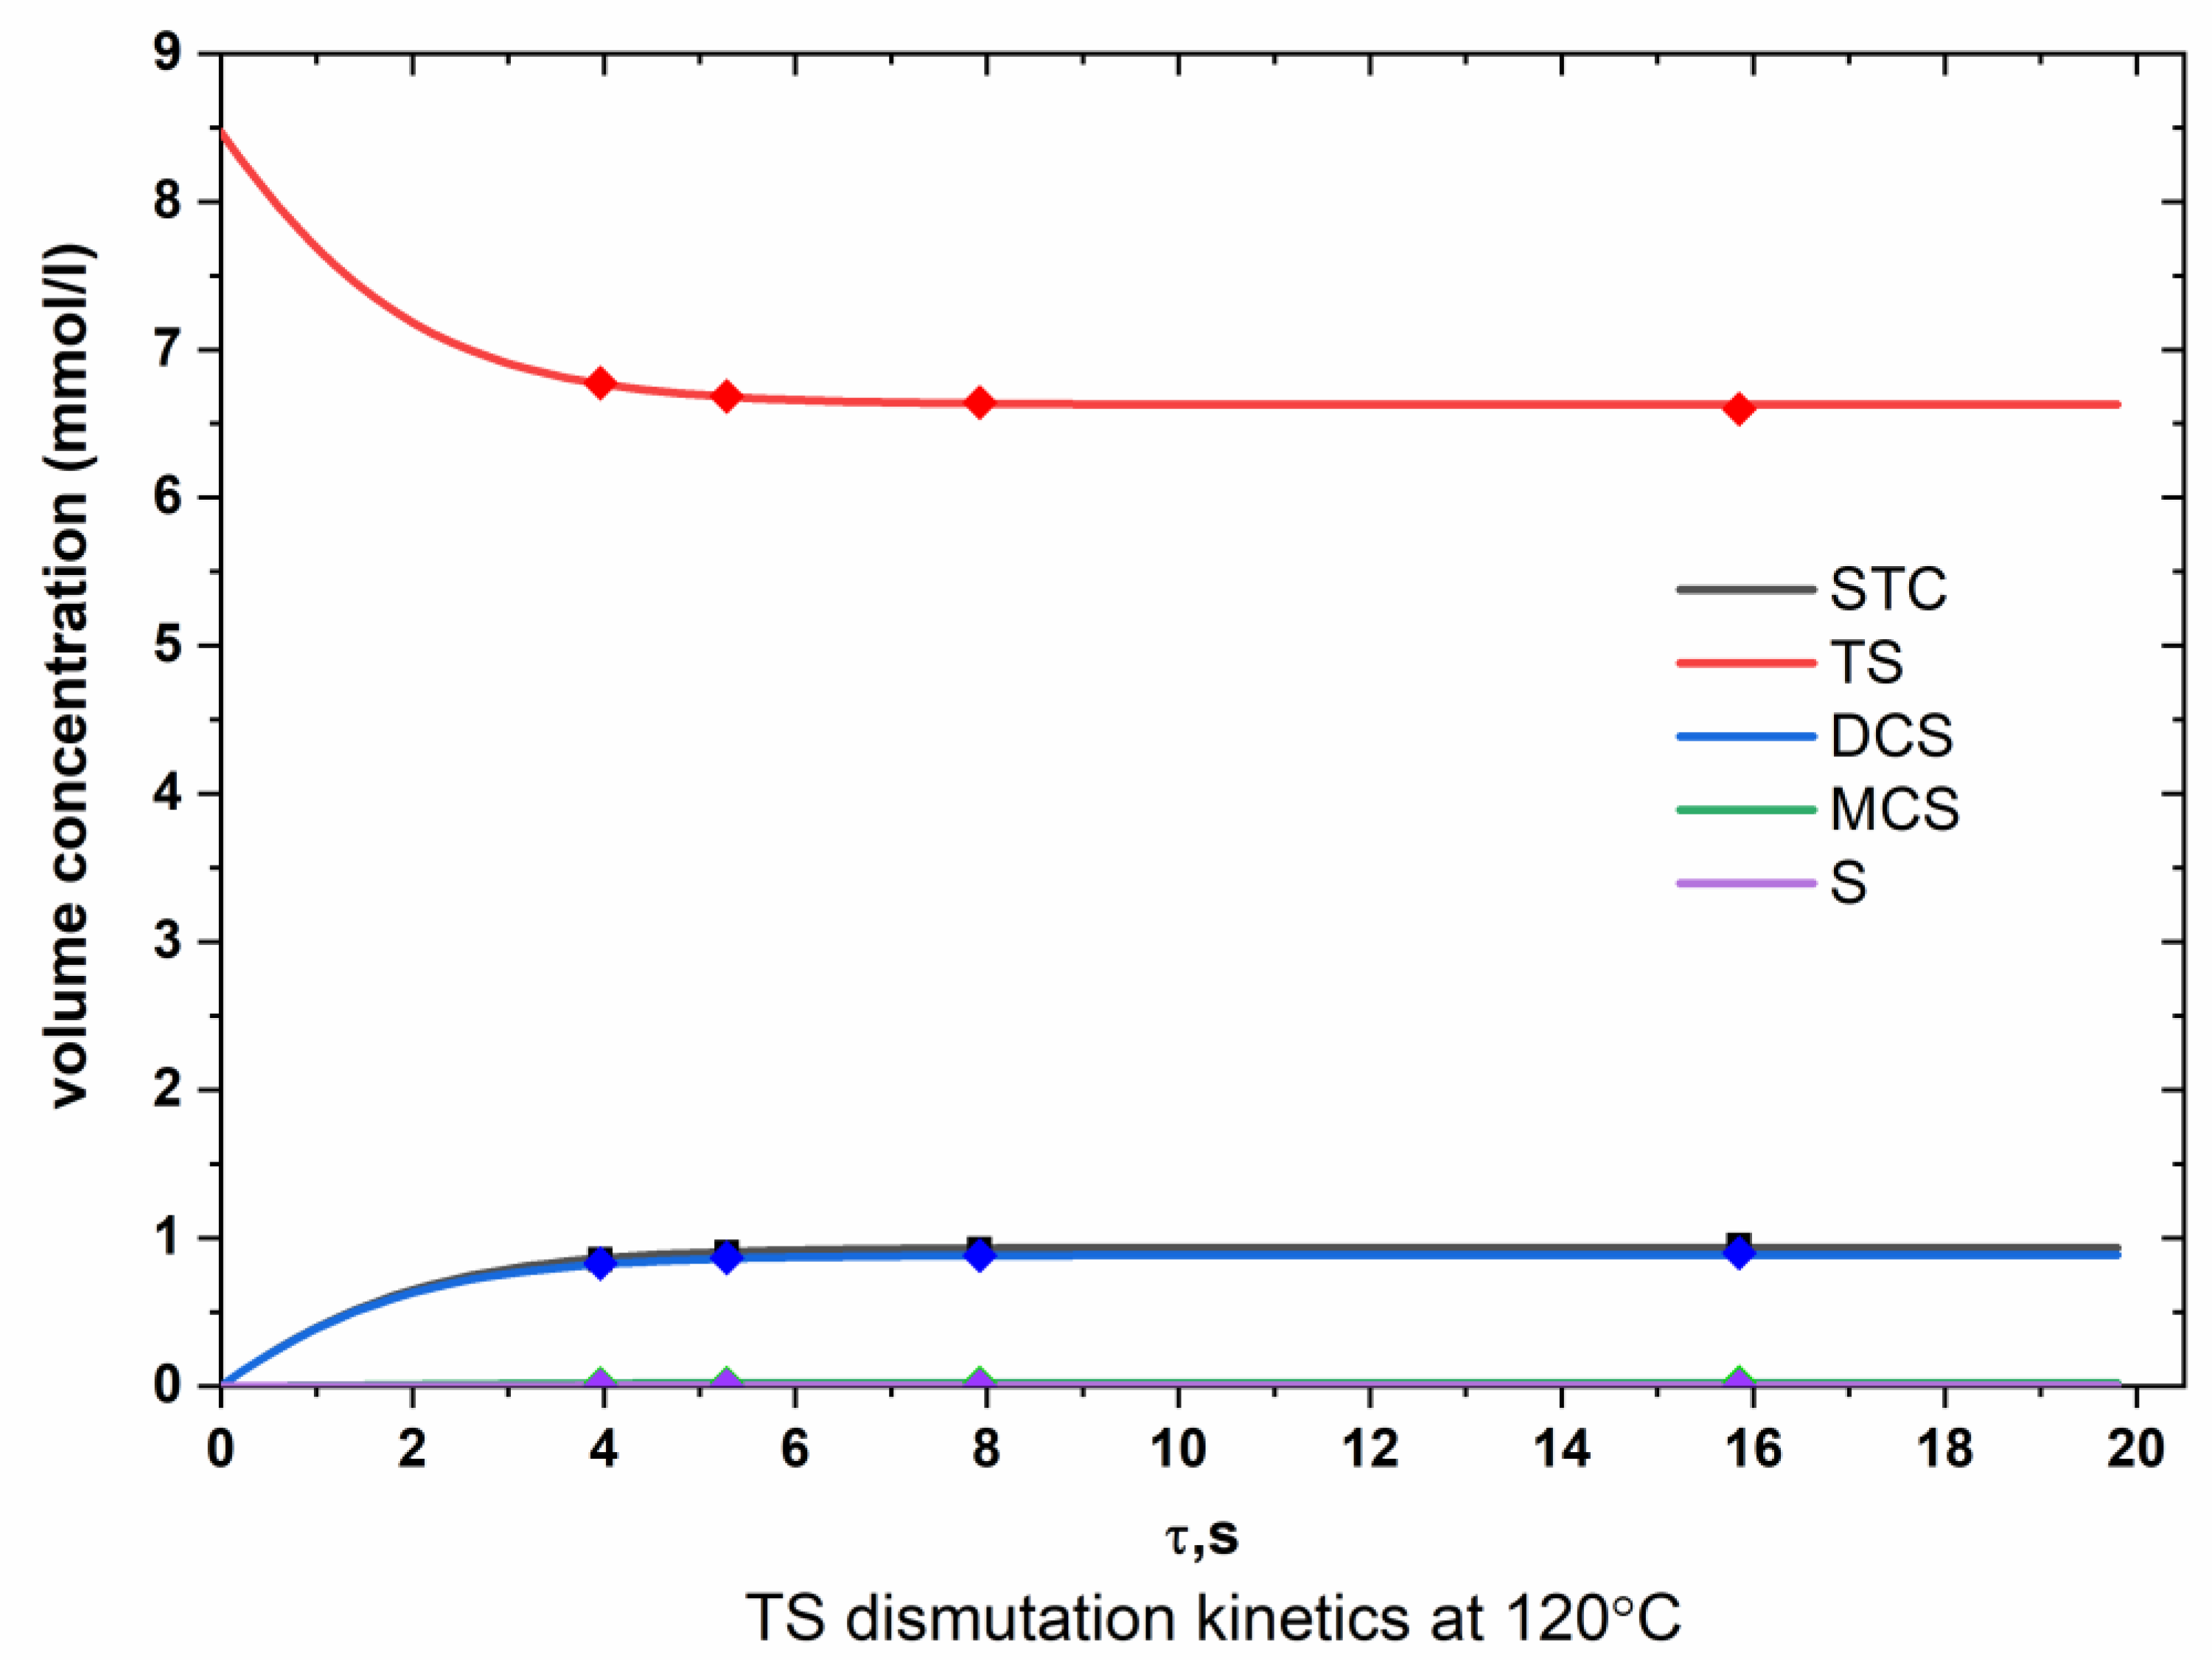
Appendix A.1. TS Dismutation

Figure A1. Dependence of the molar concentrations of chlorosilanes on time (TS, 80 °C).
Chemengineering 07 00013 g0a1
Figure A2. Dependence of the molar concentrations of chlorosilanes on time (TS, 100 °C).
Chemengineering 07 00013 g0a2
Figure A3. Dependence of the molar concentrations of chlorosilanes on time (TS, 120 °C).
Chemengineering 07 00013 g0a3

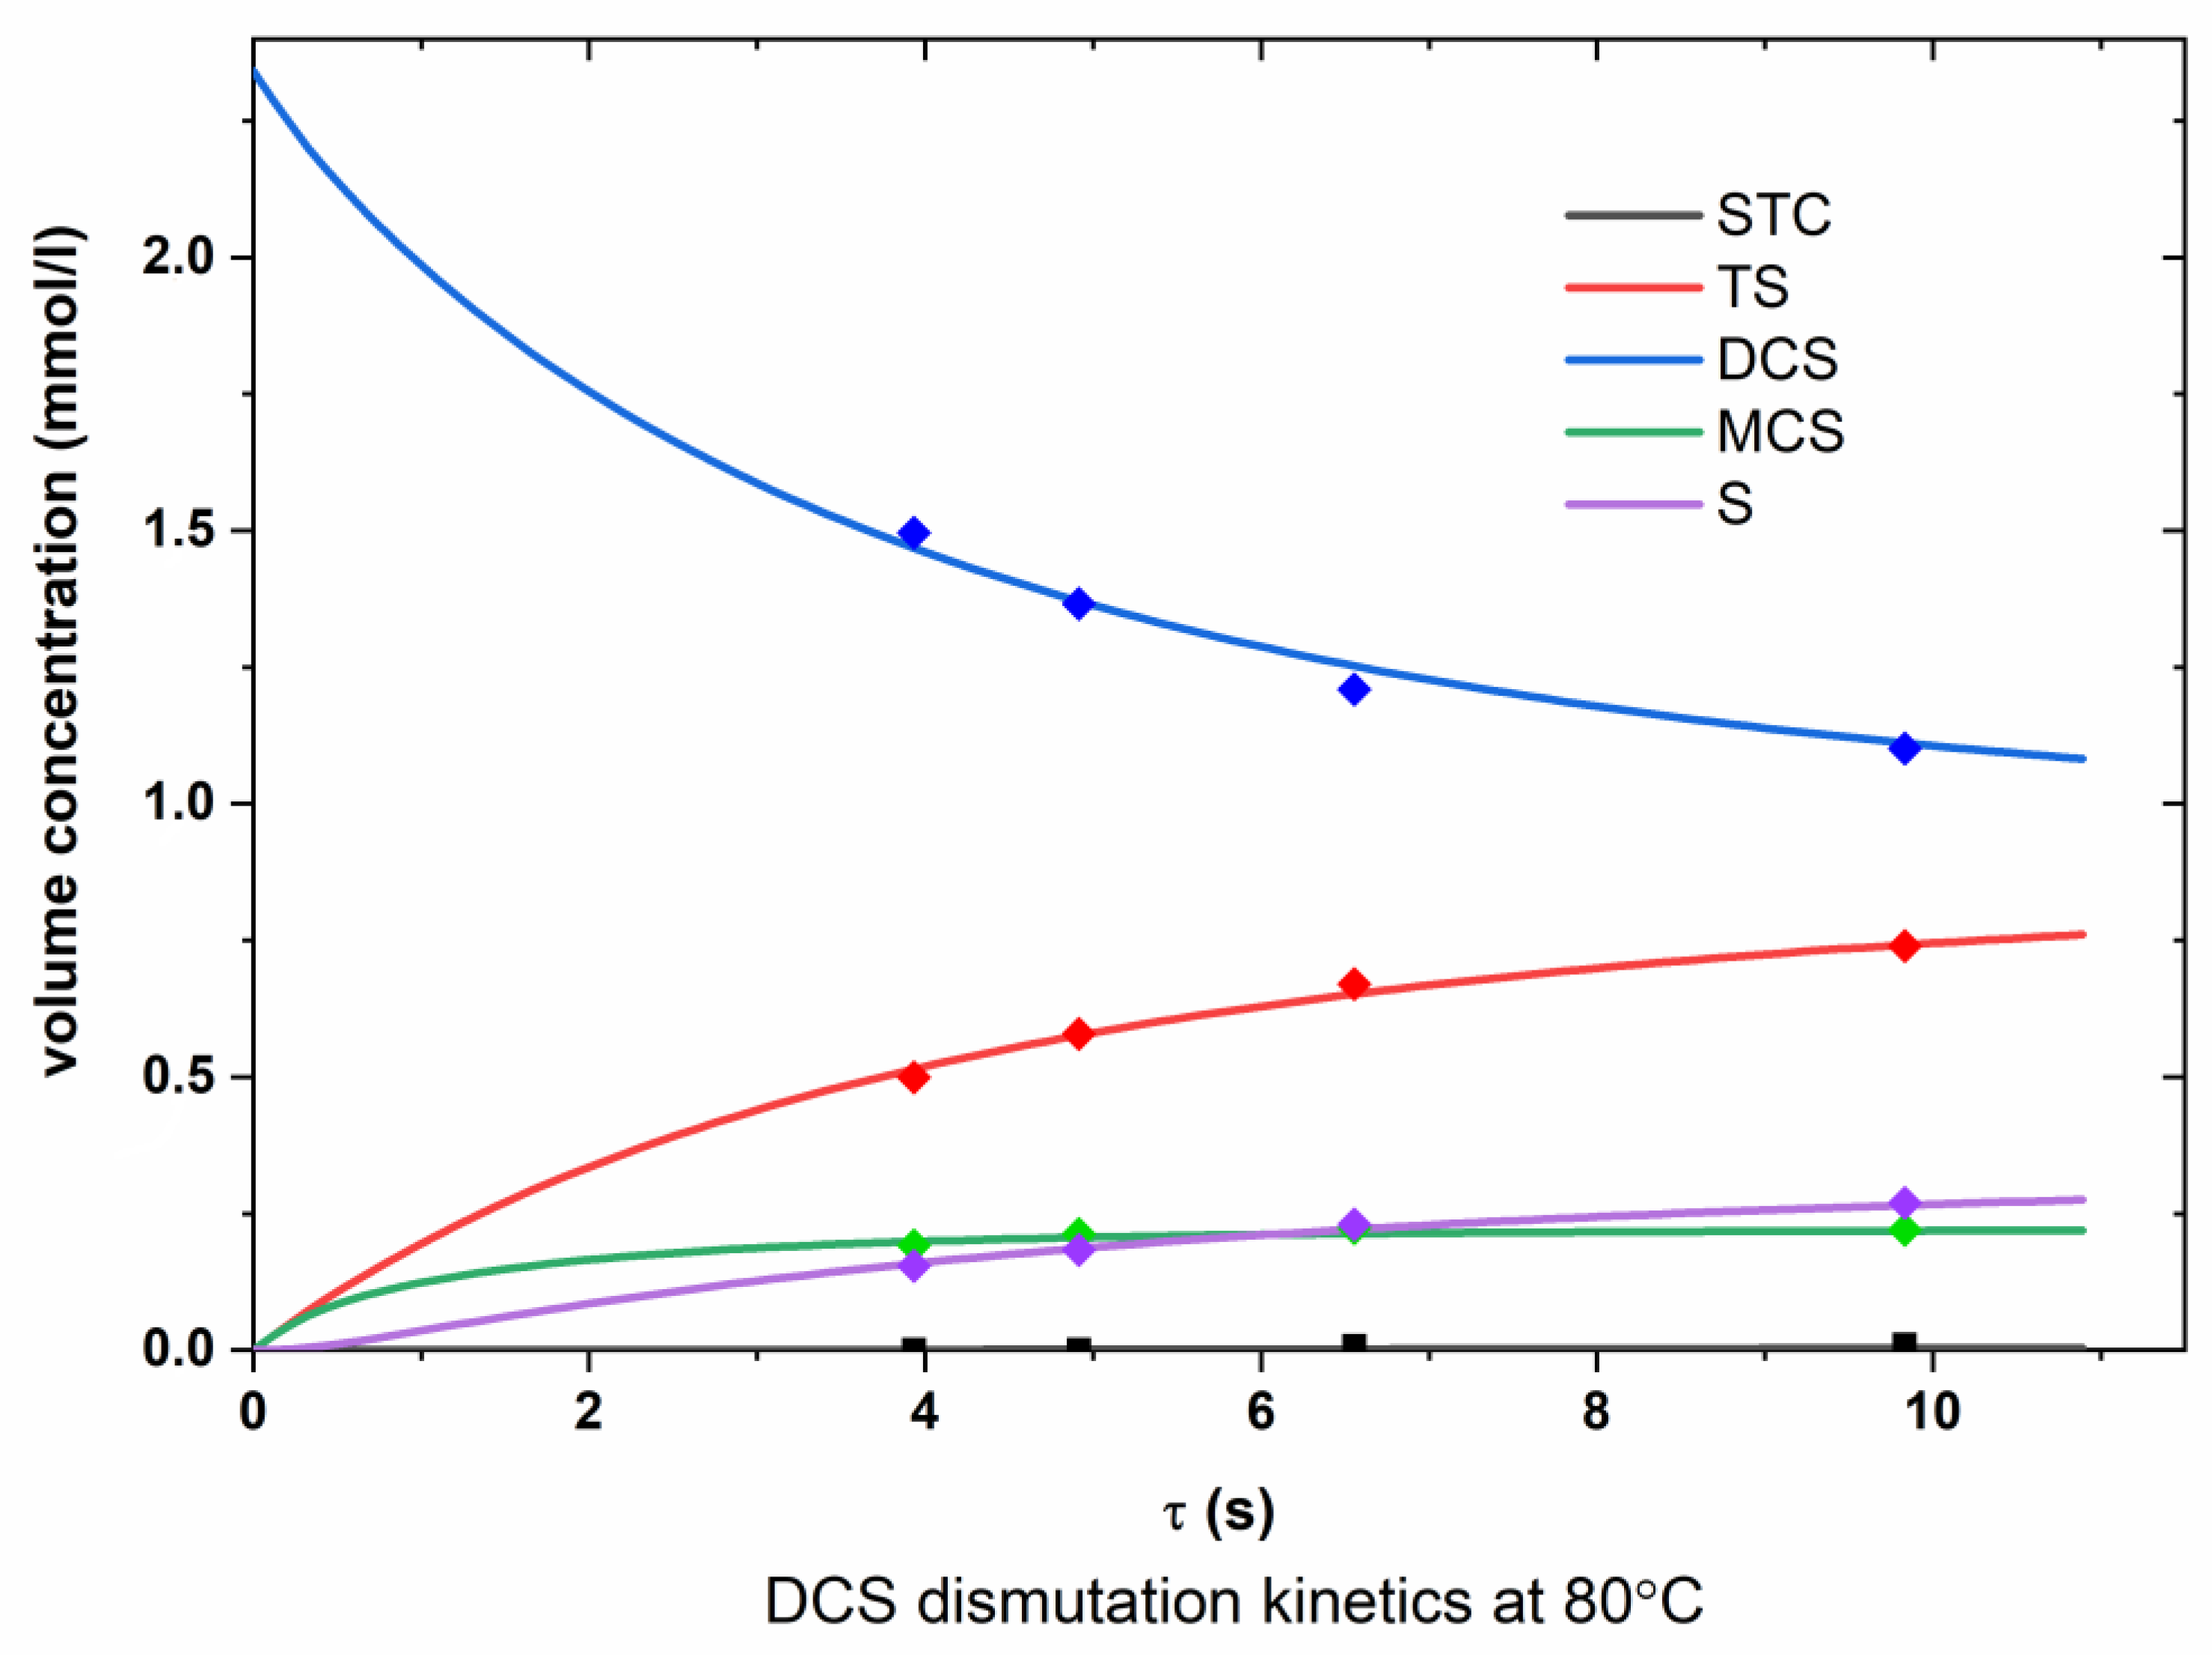
Appendix A.2. DCS Dismutation

Figure A4. Dependence of the molar concentrations of chlorosilanes on time (DCS, 80 °C).
Chemengineering 07 00013 g0a4
Figure A5. Dependence of the molar concentrations of chlorosilanes on time (DCS, 100 °C).
Chemengineering 07 00013 g0a5
Figure A6. Dependence of the molar concentrations of chlorosilanes on time (DCS, 120 °C).
Chemengineering 07 00013 g0a6

References

  1. Ahn, S.H.; Chun, D.M.; Chu, W.S. Perspective to Green Manufacturing and Applications. Int. J. Adv. Manuf. Technol. 2013, 14, 873–874. [Google Scholar] [CrossRef]
  2. Shah, A.V.; Meier, J.; Vallat-Sauvain, E.; Wyrsch, N.; Kroll, U.; Droz, C.; Graf, U. Material and solar cell research in microcrystalline silicon. Sol. Energ. Mat. Sol. 2003, 1, 469–491. [Google Scholar] [CrossRef]
  3. Eaglesham, D.J.; Cerullo, M. Dislocation-free stranski-krastanow growth of Ge on Si (100). Phys. Rev. Lett. 1990, 64, 1943–1947. [Google Scholar] [CrossRef] [PubMed]
  4. Chu, S.; Majumdar, A. Opportunities and challenges for a sustainable energy future. Nature 2012, 488, 294–303. [Google Scholar] [CrossRef]
  5. Bathey, B.R.; Cretella, M.C. Solar-grade silicon. J. Mater Sci. 2005, 17, 3877–3896. [Google Scholar] [CrossRef]
  6. Setty, H.S.N.; Yaws, C.L.; Martin, B.R.; Wangler, D.J. Method of Operating a Quartz Fluidized Bed Reactor for the Production of Silicon. US Patent No. 3963838, 15 June 1976. [Google Scholar]
  7. Iya, S.K.; Flagella, R.N.; Dipaolo, F.S. Heterogeneous decomposition of silane in a fixed bed reactor. J. Electrochem. Soc. 1982, 129, 1531–1535. [Google Scholar] [CrossRef]
  8. Zhang, P.; Duan, J.; Chen, G. Production of polycrystalline silicon from silane pyrolysis: A review of fines formation. Sol. Energy. 2018, 175, 44–53. [Google Scholar] [CrossRef]
  9. Vorotyntsev, V.M.; Mochalov, G.M.; Nipruk, O.V. Synthesis of monosilane by catalytic disproportionation of trichlorosilane in a reaction-distillation apparatus with recycle. Russ. J. Appl. Chem. 2001, 74, 621–625. [Google Scholar] [CrossRef]
  10. Matveev, A.K.; Mochalov, G.M.; Suvorov, S.S. Method of Obtaining Silane and Chlorosilanes. RU Patent No 2608523, 30 July 2015. [Google Scholar]
  11. Mehler, M. Electron. News 1984, 30, 54. [Google Scholar]
  12. Marin, G.; Lefort, M. Dismutation of Trichlorosilane. US Patent No 4018871A, 4 November 1975. [Google Scholar]
  13. O’Mara, W.C.; Herring, R.B.; Hunt, L.P. Handbook of Semiconductor Silicon Technology; Noyes Publications: Park Ridge, NJ, USA, 1990. [Google Scholar]
  14. Yasuda, K.; Okabe, T.H. Production processes of solar grade silicon based on metallothermic reduction. J. Jpn. Inst. Met. 2010, 74, 1–9. [Google Scholar] [CrossRef]
  15. Hou, Y.Q.; Xie, G.; Nie, Z.F.; Li, N. Direct current heating model for the Siemens. Adv. Mate Res. 2014, 881–883, 1805–1808. [Google Scholar]
  16. Jung, N.; Cho, K.D.; Lim, J.C.; Yoo, B.-R. Redistribution Catalyst and Methods for Its Preparation and Use to Convert Chlorosilicon Hydrides to Silane. US Patent No. 4613491, 23 September 1986. [Google Scholar]
  17. Erickson, C.E.; Wagner, G.H. Disproportionation of Silane Derivatives. US Patent No 2627451, 2 March 1953. [Google Scholar]
  18. Bakay, C.J. Verfahren zur herstellung von silan. Germany Patent No 2507864, 28 August 1975. [Google Scholar]
  19. Litteral, C.J. Disproportionation of Chlorosilane. US Patent No. 4113845, 12 September 1978. [Google Scholar]
  20. Devyatykh, G.G.; Panov, G.I.; Kharitonov, A.S. Investigation of the catalytic activity of resins. J. Inorg. Chem. 1987, 32, 1002–1005. [Google Scholar]
  21. Zubakova, L.B.; Tevlina, A.S.; Davankova, A.B. Sinteticheskie Ionoobmennye Materialy [Synthetic Ion-Exchange Materials]; Chemistry: Moscow, Russia, 1978. [Google Scholar]
  22. Kishankumar, K. Chlorosilane Disproportionation Process. US Patent No. 4395389, 26 July 1983. [Google Scholar]
  23. Morimoto, S. Process for the Disproportionation of Chlorosilanes. US Patent 4613489, 23 September 1986. [Google Scholar]
  24. Grishnova, N.D.; Gusev, A.V.; Moiseev, A.N.; Mochalov, G.M.; Balanovsky, N.V.; Kharitonov, T.N. Catalytic activity of anion-exchange resins in the trichlorosilane disproportionation reaction. J. Appl. Chem. 1999, 72, 1667–1672. [Google Scholar]
  25. Bailey, D.L.; Shafer, P.W.; Wagner, G.H. Disproportionation of Chlorosilanes Employing Amine-Type Catalysts. US Patent 2834648, 13 May 1958. [Google Scholar]
  26. Low Cost Solar Array Project. Feasibility of the Silane Process for Producing Semiconductor-Grade Silicon. Final Report, October 1975–March 1979; Union Carbide Corp.: Houston, TX, USA, 1979. [Google Scholar]
  27. Li, K.Y.; Huang, C.D. Redistribution reaction of trichlorosilane in a fixed-bed reactor. Ind. Eng. Chem. Res. 1988, 27, 1600–1606. [Google Scholar] [CrossRef]
  28. Hunt, L.P. Thermodynamic Equilibria in the Si-H-Cl and Si-H-Br Systems. J. Electrochem. Soc. 1988, 135, 206–209. [Google Scholar] [CrossRef]
  29. Ingle, W.M.; Peffley, M.S. Kinetics of the hydrogenation of silicon tetrachloride. J. Electrochem. Soc. 1985, 132, 1236–1240. [Google Scholar] [CrossRef]
  30. Walker, K.L.; Jardine, R.E.; Ring, M.A.; O’Neal, H.E. Mechanisms and kinetics of the thermal decompositions of trichlorosilane, dichlorosilane, and monochlorosilane. Int. J. Chem. Kinet. 1998, 30, 69–88. [Google Scholar] [CrossRef]
  31. Hogness, T.R.; Wilson, T.L.; Johnson, W.C. The thermal decomposition of silane. J. Amer. Chem. Soc. 1936, 58, 108–112. [Google Scholar] [CrossRef]
  32. Walch, S.P.; Dateo, C.E. Thermal decomposition pathways and rates for silane, chlorosilane, dichlorosilane, and trichlorosilane. J. Phys. Chem. A 2001, 105, 2015–2022. [Google Scholar] [CrossRef]
  33. Catoire, L.; Woiki, D.; Roth, P. Kinetics of the initiation step of the thermal decomposition of SiCl4. Int. J. Chem. Kinet. 1997, 29, 415–420. [Google Scholar] [CrossRef]
  34. Morachevsky, A.G.; Sladkov, I.B. Fiziko-Khimicheskie Svoistva Molekulyarnykh Neorganicheskikh Soedinenii (Eksperimental’nye Dannye i Metody Rascheta) [Physico-Chemical Properties of Molecular Inorganic Compounds (Experimental Data and Calculation Methods)]; Chemistry: St. Petersburg, Russia, 1996. [Google Scholar]
  35. Chase, M.W. NIST-JANAF Themochemical Tables, 4th ed.; American Institute of Physics: Woodbury, NY, USA, 1998; updated 19 February 2017. [Google Scholar]
  36. Stull, D.R.; Prophet, H. JÂNAF Thermochemical Tables; Office of Standard Reference Data, National Bureau of Standards: Washington, DC, USA, 1971.
  37. Maier, C.G.; Kelley, K.K. An equation for the representation of hightemperature heat content data. J. Am. Chem. Soc. 1932, 54, 3243–3246. [Google Scholar] [CrossRef]
  38. Vorotyntsev, A.; Markov, A.; Petukhov, A.; Atlaskina, M.; Atlaskin, A.; Kapinos, A.; Vorotyntsev, V.; Pryakhina, V. Catalytic disproportionation of chlorosilanes using imidazolium ionic liquids supported on polymer supports. Catal. Ind. 2021, 13, 1–11. [Google Scholar] [CrossRef]
  39. Blinov, I.A.; Belokhvostov, V.; Kossoy, A.; Mukhortov, D.; Kambur, M.; Lantratova, O.; Kurapova, E.S. Thermal Decomposition of Anion-Exchange Resin Based on Copolymer of 4-Vinylpyridine. Russ. J. Appl. Chem. 2016, 89, 554–558. [Google Scholar] [CrossRef]
Figure 1. (a) The dependencies of ln k d i r and (b) ln k r e v on 1/T for reactions (1), (2), and (3).
Chemengineering 07 00013 g001
Figure 2. Structure of the active link of the VP-1AP anionite.
Chemengineering 07 00013 g002
Figure 3. Scheme of an experimental setup for studying the composition of the reaction mixture under static conditions: 1—thermostat; 2—reactor; 3—ampoule bubbler with SiHCl3; 4—chromatograph; 5–7—control valves.
Chemengineering 07 00013 g003
Figure 4. Scheme of an experimental setup for studying the kinetic characteristics of the catalyst: 1—chromatograph; 2—thermostat; 3—reactor with catalyst; 4—thermostat; 5—ampoule bubbler with SiHCl3 (SiH2Cl2); 6—flow stabilizer.
Chemengineering 07 00013 g004
Table 1. The composition of the products of the TS dismutation reaction under static conditions after one hour of the TS in the reactor (molar percentages).
T, KSiH3ClSiH2Cl2SiHCl3SiCl4
3530.5511.07611.1
3730.5911.17511.3
3930.6611.27411.8
Table 2. Details of the design of kinetic experiments with TS and DCS.
Experiment ParameterTSDCS
Resin volume, ml4.64.0
Atmospheric pressure, mm Hg760760
Bubbler temperature, K273215.6
Carrier gas consumption per bubbling, ml/min5, 10, 15, 2010, 15, 20, 25
Reactor temperature, K353, 373, 393353, 373, 393
Table 3. The rate constants of direct and reverse reactions and the equilibrium constants of the system of Equations (1)–(3) obtained by optimizing the parameters of the kinetic model (6).
T, KReaction k dir ,   l   m o l · s k rev ,   l m o l · s Keq
353.012.021421.42·10−2
242.61992.14·10−1
3280016001.80
373.013.021731.75·10−2
2814601.76·10−1
3530034001.650
393.016.323361.88·10−2
21437701.86·10−1
3810054001.50
Table 4. The parameters of the temperature dependencies of the rate constants of direct and reverse reactions of TS and DCS dismutation.
Parameter(1),
dir.
(1),
rev.
(2),
dir.
(2),
rev.
(3),
dir.
(3),
rev.
A ,   l   m o l · s 1.32 · 10 5 5.50 · 10 5 6.40 · 10 6 1.26 · 10 8 1.01 · 10 8 3.20 · 10 3
Ea, kJ/mol32.724.535.039.130.714
Table 5. Equilibrium constants of reactions (1)–(3) calculated according to the literature data [26,34,35,36,37] and obtained as a result of the experiment for temperatures 353, 373, and 393 K.
T, KReactionsKp
[34][35][36] + [26][26]Experiment (Static)Experiment
(Kinetics)
353I1.29050.01340.03690.02080.021 ± 0.0010.020 ± 0.007
II0.02140.12590.16250.35860.35 ± 0.020.30 ± 0.07
III1.41270.69520.69861.6434 1.8 ± 0.3
373I1.44100.01580.04140.02330.022 ± 0.010.021 ± 0.005
II0.02230.13310.16940.37310.360 ± 0.0140.30 ± 0.08
III1.39180.66600.66921.5697 1.6 ± 0.1
393I1.59140.01850.04600.02580.024 ± 0.0010.020 ± 0.005
II0.02310.13990.17600.38670.39 ± 0.020.35 ± 0.05
III1.37420.64130.64421.5063 1.5 ± 0.1
Table 6. Compositions (in mole percentages) of equilibrium mixtures of products of TS and DCS disproportionation for temperatures 353, 373, and 393 K calculated according to the data [26] and experimental data.
T, KSiH4SiH3ClSiH2Cl2SiHCl3SiCl4
Disproportionation of TS
353 [26]0.0420.5210.5777.1411.73
353 experiment statics 0.55 ± 0.0311.0 ± 0.476 ± 311.1 ± 0.4
353 experiment kinetics0.03 ± 0.010.42 ± 0.1210.5 ± 0.478 ± 311.4 ± 0.4
373 [26]0.050.5910.9776.0812.31
373 experiment statics 0.59 ± 0.0211.1 ± 0.475 ± 311.3 ± 0.4
373 experiment kinetics0.03 ± 10.4 ± 0.210.7 ± 0.477 ± 311.6 ± 0.8
393 [26]0.0580.6611.3475.0912.84
393 experiment statics 0.66 ± 0.0211.2 ± 0.474 ± 311.8 ± 0.4
393 experiment kinetics0.04 ± 0.020.5 ± 0.210 ± 2477 ± 311.5 ± 0.7
Disproportionation of DHS
353 [26]10.2415.5538.834.70.65
353 experiment kinetics9 ± 215.2 ± 1.241 ± 333.2 ± 1.30.6 ± 0.7
373 [26]10.2315.8238.434.80.74
373 experiment kinetics9 ± 215.6 ± 0.541 ± 333 ± 20.6 ± 0.2
393 [26]10.2216.0638.034.80.82
393 experiment kinetics9 ± 217 ± 139 ± 234.2 ± 0.70.6 ± 0.3
Disclaimer/Publisher’s Note: The statements, opinions and data contained in all publications are solely those of the individual author(s) and contributor(s) and not of MDPI and/or the editor(s). MDPI and/or the editor(s) disclaim responsibility for any injury to people or property resulting from any ideas, methods, instructions or products referred to in the content.

