

Predicting Advanced Air Mobility Adoption Globally by Machine Learning


Transportation, Logistics, & Finance, College of Business, North Dakota State University, P.O. Box 6050, Fargo, ND 58108-6050, USA
Standards 2023, 3(1), 70-83; https://doi.org/10.3390/standards3010007
Submission received: 17 December 2022
/
Revised: 7 February 2023
/
Accepted: 20 February 2023
/
Published: 16 March 2023
Abstract
:Advanced air mobility (AAM) is a sustainable aviation initiative to deliver cargo and passengers in urban and regional locations by electrified drones. The widespread expectation is that AAM adoption worldwide will help to reduce pollution, reduce transport costs, increase accessibility, and enable a more reliable and resilient supply chain. However, most countries lack regulations that legalize AAM. A fragmented regulatory approach hampers the progress of business prospectors and international organizations concerned with human welfare. Therefore, amidst high uncertainty, knowledge of indicators that can predict the propensity for AAM adoption will help nations and organizations plan for drone use. This research finds predictive indicators by assembling a unique dataset of 36 economic, social, environmental, governance, land use, technology, and transportation indicators for 204 nations. Subsequently, the best of 12 different machine learning models ranks the predictive importance of the indicators. The gross domestic product (GDP) and the regulatory quality index (RQI) developed by the Worldwide Governance Indicators (WGI) project were the two top predictors. Just as importantly, the poor predictors were as follows: the social progress index developed by the Social Progress Imperative, the WGI rule-of-law index, land use characteristics such as rural and urban proportions, borders on open waterways, population density, technology accessibility such as electricity and cell phones, carbon dioxide emission level, aviation traffic, port traffic, tourist arrivals, and roadway fatalities.
1. Introduction
International agreements on planetary accountability such as the Paris Climate Accords highlighted the urgent need for policies to limit pollutants that can harm humanity [1]. Responsive policies focus on decarbonizing transportation by electrifying road vehicles and promoting cleaner methods of energy production [2]. Consequently, nations are electrifying ground vehicles but there is less progress in aviation [3].
Advanced air mobility (AAM) is a more recent sustainable transportation initiative that seeks to use drones, which are small, electrified aircraft, to move cargo and passengers between high population areas [4]. Key enablers of AAM are the convergence and cost reduction of technologies such as distributed electric propulsion, artificial intelligence in robotics, and network-enabled on-demand transportation services [5]. The primary motivations for AAM are shorter trips by air, avoidance of road congestion, and the reduction of pollutants [6].
Drones provide other benefits such as supporting the United Nations’ sustainable development goals by lowering the cost to deliver humanitarian aid, food, medicine, and disaster relief [7]. Drones can help to increase the resilience and reliability of supply chains by using the third dimension of travel to speed up deliveries [8]. Additionally, nations can use drones to more safely and efficiently monitor forest health, wildlife, farms, critical infrastructure, and post-disaster sites to justify aid.
Despite the potential widespread benefits of AAM, only developed nations like the United States, China, and some European countries are working on technologies and regulations to safely integrate drones into the general aviation airspace [9]. Countries that are advancing drone regulations will attract new markets. Therefore, policy laggards could be at an economic and trade disadvantage that may keep the global supply chain unbalanced. Furthermore, non-uniform policies and regulations worldwide can impede the agenda of international organizations concerned with human welfare. Hence, the identification of indicators that are predictors of potential AAM success can help nations, business developers, and international organizations guide policymaking, evaluate policy impacts, take corrective action, and benchmark progress internationally.
The goal of this research was to identify well-established social indicators that are effective predictors of international success in AAM adoption. The strategy was to define the target feature of prediction as 2022 national-level regulations that legalize drone operations under a common set of rules. The rationale was that nations that have already defined rules to allow drone use are more likely to have the wherewithal to adjust them for compliance with emerging international AAM standards.
The contribution of this work is a three-stage data mining and machine learning (ML) framework developed to achieve the above stated goal. The first stage of the framework was a computational workflow to assemble a comprehensive and unique dataset of relevant social indicators. The second stage compared the effectiveness of 12 mature ML models in representing the dataset. The third stage selected the best ML model to rank the predictive importance of indicators based on their association with the target feature.
Technology developers, market prospectors, and international organizations concerned with human welfare can benefit from the insights of this research. International organizations may include the United Nations, the World Bank Group, International Development Law Organization, International Standards Organization, International Civil Aviation Organization, International Air Transport Association, International Energy Agency, and the World Trade Organization.
The organization of the rest of this work is as follows: Section 2 conducts a literature review that focuses on related work at the intersection of international AAM developments and drone regulatory progress. Section 3 describes the framework that includes data acquisition, feature engineering, feature selection, model selection, and attribute importance ranking. Section 4 presents the results and discusses insights about the outcome and limitations. Section 5 concludes the work by reflecting on the motivation, significance, outcome, and contributions of the work.
2. Literature Review
Walmart and Amazon, the world’s two largest retailers, recently began drone delivery services in the United States. Walmart is expanding drone deliveries to 34 sites in six U.S. states (Arizona, Arkansas, Florida, Texas, Utah, VA, USA) and expects to reach four million households by the end of 2022 [10]. According to Amazon, the city of Lockeford, California, will be the first to receive its drone delivery service in 2022 [11]. FedEx, DHL, and UPS are large package shipping companies that have partnerships with drone manufacturers to launch air delivery services by 2024 [12]. Despite the evidence of ongoing commercial adoption, the current literature has barely analyzed progress worldwide in advancing regulations and policies to enable and encourage AAM adoption. The small body of literature that discussed drone regulations worldwide fell into three categories: common factors in regulations, hindrances to rule making, and the interplay between drone utility and rulemaking. The next three subsections describe those findings.
2.1. Common Factors
The Technical Centre for Agricultural and Rural Cooperation (CTA) was one of the first to examine regulations and policies in 79 countries [13]. CTA, an organization seeking to advance food security and inclusive economic growth in poor nations, found that in 2016, 77% of African and 39% of Caribbean countries did not have any specific rules for drone use. In the same year, Ravich (2016) found that although drone laws varied among nations, the common unifying concerns were safety, privacy, and national security [14]. One year later, the RAND Corporation published a report that summarized commercial drone regulations worldwide [15]. RAND found that the level of regulation restrictiveness reflected whether the nation favored safety over promoting recent technology. The same year, Cracknell (2017) found a trend of requiring the pilot to complete a training program and keeping a log of all flights [16]. Tsiamis et al. (2019) compared drone regulations across 35 countries of the Organization for Economic Co-operation and Development (OECD) and found that, although there were many variations in legal framework, common considerations were the vehicle size and weight, flight altitude, and purpose of use [17]. That same year, Coops et al. (2019) found that one-quarter of countries had strict laws regulating drone use, one-third lacked regulations, and six countries simply banned drones [18]. A recent analysis found there was no central European repository for data related to remote pilots, legal entities, and operational approvals that could help with monitoring and enforcement [19].
2.2. Rulemaking Hindrances
Ayamga et al. (2021) found that the lack of skilled personnel, processes, and resources were the main factors hindering the implementation and enforcement of drone regulations in Africa [20]. Sah et al. (2021) assessed that threats to privacy and security were critical barriers to implementing drone regulations in the logistics sector [21]. Tran et al. (2022) compared regulatory considerations across the United States, United Kingdom, Canada, China, Singapore, Thailand, Cambodia, and Vietnam and discovered that rules varied in their requirements for flight permits, pilot qualifications, and operating constraints such as maintaining visual line-of-sight, altitude limits, flying at night, and proximity to airfields [22]. More generally, some in developing nations fear that technological advancements will lower worker wages [23].
2.3. Drone Utility
A literature review by Chauhan (2019) found that publications from 1968 to 2017 about drone utility increased at a rate of 16% annually [24]. In 2015, Oxford Analytica suggested that a push to commercialize drones will help to advance drone regulations and that a comprehensive regulatory framework will accelerate applications [25]. Kitonsa et al. (2018) suggested that drone technology can help to achieve the United Nations’ sustainable development goals in matters such as addressing issues in agriculture, e-commerce, and healthcare [7]. Schulzke (2019) pointed out that drone technology advancements for civilian applications could also increase their attractiveness for military use [26]. Calandrillo et al. (2020) criticized the slow pace of U.S. regulations for stalling drone applications and forcing innovation efforts to move abroad [27].
Research suggests that AAM will complement various forms of ground transportation such as autonomous vehicles and ridesharing [28]. Drones can replace long portions of ground trips to help reduce congestion and pollution [29]. For example, the Uber Elevate use case suggests that riders can book complete door-to-door trips by taking ground ride share to vertiports where drones will more quickly complete the long-haul portion of a regional trip [30]. That is, passenger drones can take more direct air routes between cities to provide immense time savings under affordable conditions [31]. Similarly, cargo drones can bypass ground traffic to speed up package delivery in both middle-mile and last-mile operations [32].
At the time of this writing, there was no other recent evaluation of worldwide drone laws or their relationship to any social indicators. This research filled that gap by evaluating the state of drone regulations in 222 nations and the degree to which they might be associated with social indicators that span economic, social, environmental, governance, land use, technology, and transportation characteristics. The 222 nations included the more than 190 United Nations member states plus nations under their dependencies.
3. Methodology
The next subsections describe the data and framework to select relevant attributes, engineer features, train the ML models, and rank attribute importance.
3.1. Data Acquisition
A literature review yielded 36 relevant indicators or attributes for evaluation of their potential association with the target feature. Table 1 lists the economic, environmental, and governance attributes selected based on their availability for a majority of the 222 nations. Table 2 lists attributes that reflect the land use, technology (Tech.), and transportation characteristics of those nations. Both tables describe the attributes, their units, their data source, the most recent year that data was available for most nations, and the number of entries (N) in the source dataset. LN in the attribute name indicates that the ML models used the natural log transformation of that attribute for reasons described later in the subsection on feature engineering. The sources of the datasets shown in the two tables are as follows:
- Vertical Flight Society (VFS) [33]
- World Bank Global Economic Prospects (WB-GEP) [34]
- World Bank World Development Indicators (WB-WDI) [35]
- Worldwide Governance Indicators (WGI) [36]
- World Bank Sustainable Development Goals (WB-SDG) [37]
- World Bank Jobs (WB-J) [38]
- World Bank Doing Business (WB-DB) [39]
- Social Progress Index (SPI) [40]
The International Civil Aviation Organization (ICAO) [41] and the International Air Transport Association (IATA) [42] websites provided links to the civil aviation authority (CAA) of each nation. The target value was Fly = 1 if a nation’s CAA specified a set of rules to allow civilian drone operations; otherwise, the target value was Fly = 0. Although rules varied, there were common specifications, such as aircraft registration procedures and maintaining visual line-of-sight, and limitations on flying at night, over people, over traffic, near government facilities, and over private property. The more restrictive rules imposed additional limitations such as maximum flight altitude, maximum distance from the pilot, number of drones per pilot, minimum age of the pilot, and minimum distance from an airport or airfield. The target value for nations that banned drones was Fly = 0.
The gross domestic product (GDP) and its variations, such as GDP per capita, reflected economic progress but not necessarily other important aspects of human welfare [43]. The other attributes that reflected economic progress were the unemployment rate, number of tourist arrivals, and variations of measures involving population.
There are dozens of indicators of human welfare, but few incorporate sustainable developments [44]. The framework used the social progress index (SPI) to represent the environmental category because of its maturity and inclusion of sustainable developments [45]. Updated annually since 2014 by the Social Progress Imperative organization [40], the SPI reflects how much a country provides for the social and environmental needs of its people but without considering economic factors [46]. The index is based on a combination of 54 indicators of basic human needs, wellness, equality, inclusion, and personal freedom [47]. The environmental quality index (EQI) is a component of the SPI that had a low correlation (R2 = 0.675) with the composite index. Therefore, splitting it out added another dimension of information to the environmental category. The framework included the amount of carbon dioxide (CO2) emissions as an indicator of progress in the environmental category.
The worldwide governance indicators (WGI) represented the governance category because of its maturity and use since 1996 [36]. The WGI project created six governance indicators for more than 200 nations from 1996 to 2021 [48]. The indices are based on surveys of public, private, and non-governmental organization experts throughout the world. The score assigned to each nation ranged from −2.5 to 2.5 of a standard normal distribution among the nations surveyed. Two of the WGI indicators (voice & accountability, control of corruption) lacked rankings for most countries so the workflow dropped those. The WGI project defined the other four indicators as follows [48]: The government effectiveness index “captures perceptions of the quality of public services, the quality of the civil service and the degree of its independence from political pressures, the quality of policy formulation and implementation, and the credibility of the government’s commitment to such policies”. The political stability index “measures perceptions of the likelihood of political instability and/or politically-motivated violence, including terrorism”. The regulatory quality index “captures perceptions of the ability of the government to formulate and implement sound policies and regulations that permit and promote private sector development”. The rule-of-law index “captures perceptions of the extent to which agents have confidence in and abide by the rules of society, and in particular the quality of contract enforcement, property rights, the police, and the courts, as well as the likelihood of crime and violence”.
For the land use category, attributes included measures of land area, proportion by land type (urban, rural, agricultural, forestry, landlocked), population growth, and population density. The technology category included attributes that reflected accessibility to electricity, automated teller machines (ATMs), and cell phones (Phone100).
The logistics performance index (LPI) of the transport category represented how efficiently a country moved goods across and within its borders to connect firms to markets [49]. The LPI is a five-point scale that the World Bank Group has been updating since 2008. The LPI used principal component analysis (PCA) to aggregate views reflected from six components of logistics: customs, infrastructure, ease of arranging shipments, quality of logistics services, timeliness, and tracking/tracing. The rating of each component (1–5) reflected views of logistics, freight-forwarding, and express carrier professionals throughout the world that traded with the nation.
The infrastructure quality index (Infr_Qual) isolated the infrastructure quality component of the LPI aggregate score to separate views about the quality of the transportation infrastructure such as ports, railroads, roads, and information technology. The rationale to isolate the Infr_Qual component was that while the LPI remained mostly unchanged since 2008, the 2018 results revealed a greater improvement in infrastructure quality for the poorest nations than for the richest ones. Hence, isolating the infrastructure quality component prevented the composite LPI from masking the larger differences among poorer nations. Other attributes associated with transportation activity were the amount of air cargo, air passengers, port container traffic, and the road traffic fatality rate.
3.2. Feature Engineering
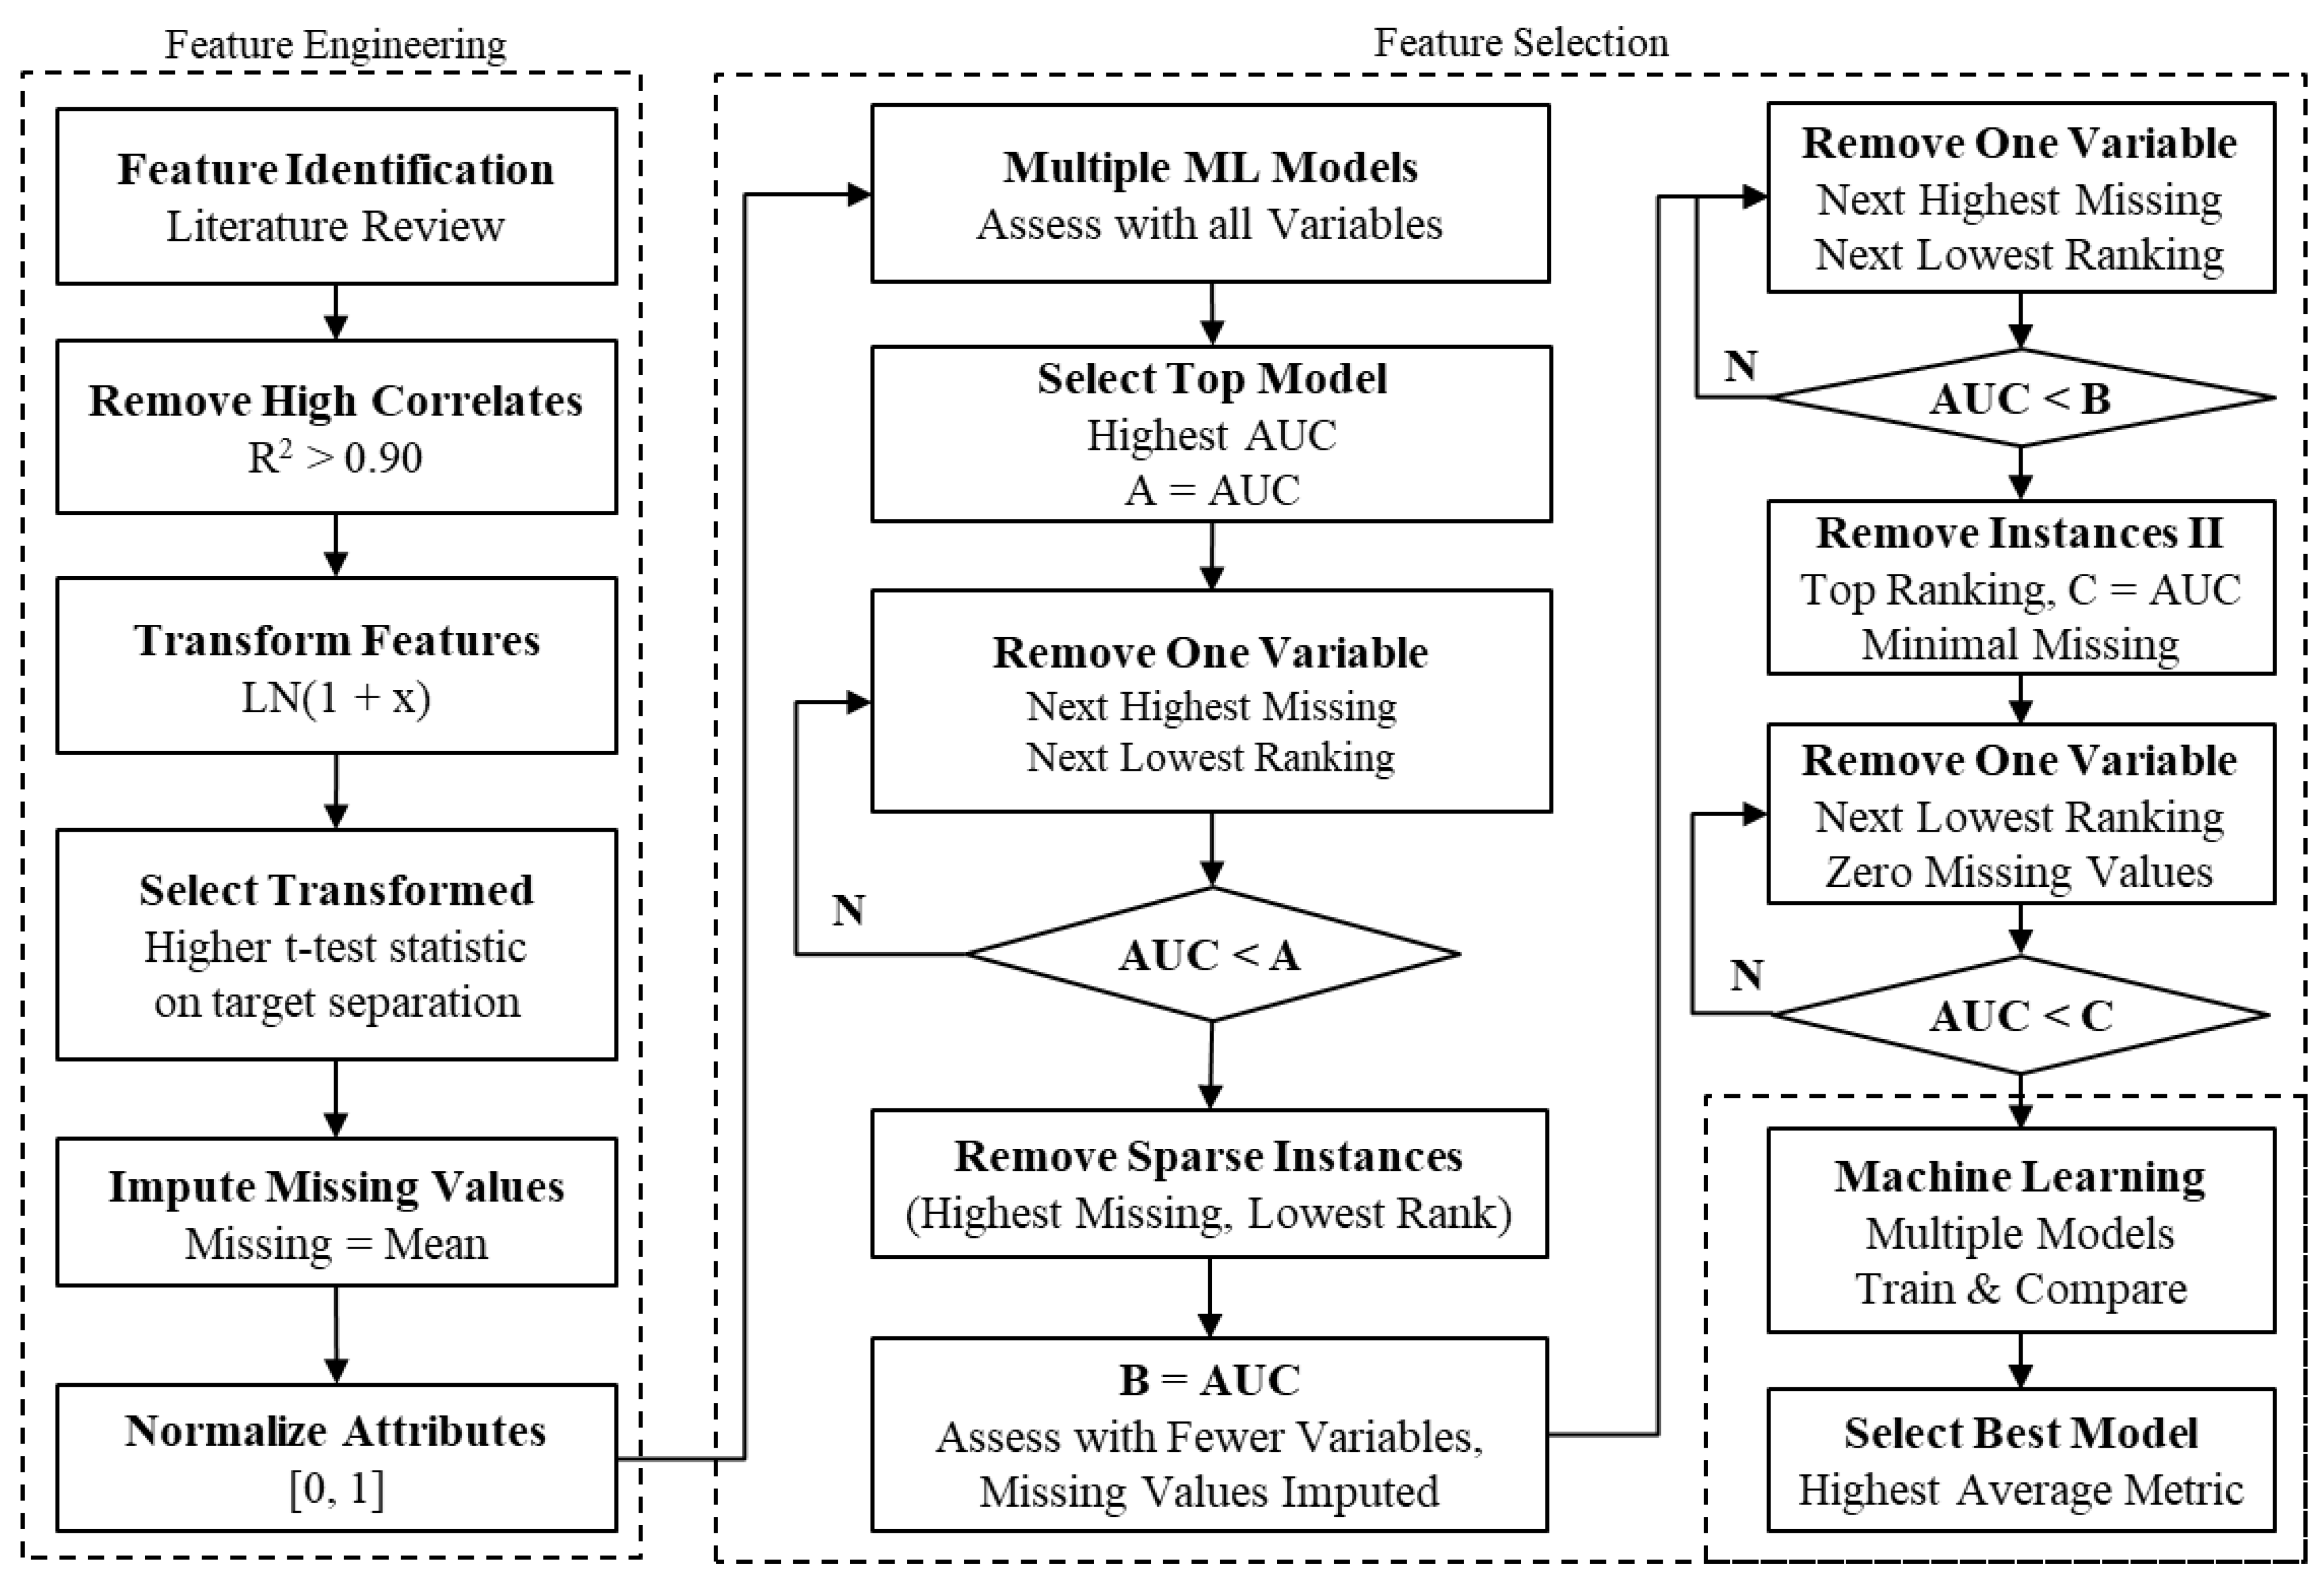
Figure 1 illustrates the workflow developed as a key aspect of the method to achieve the research goal defined in the introduction section. The workflow had three sections: feature engineering, feature selection, and machine learning. The method to rank attribute importance was based on the best performing ML model. The feature identification task of the feature engineering section started with population data from the United Nations World Population Prospects (UN-WPP) [50]. This resulted in data for 222 nations. Next, the procedure merged attributes from the datasets listed in Table 1 and Table 2. The merge procedure revealed that datasets with more than 222 instances included aggregated regions, hence, the workflow removed those as redundant records. Datasets with less than 222 locations resulted in records with missing values for those attributes.
To prevent a multicollinearity problem when training the ML models, the “Remove High Correlates” procedure removed attributes that were highly correlated with others. Removing highly correlated attributes also prevented them from splitting their predictive importance instead of adding different information to improve predictive performance. Attributes selected for removal had the Pearson correlation coefficient R2 > 0.90 [51]. Altogether, the process identified 36 relevant attributes.
The “Transform Features” procedure applied the natural log, LN(1 + x), to reduce the skew of its value distributions, which improved the predictive performance of the ML models. To remove duplication, the procedure dropped the version of the attribute that produced the least target class separation. The measure of target class separation was the t-statistic from a t-test for statistical difference between the mean value of the attributes by target category (Fly = 1 versus Fly = 0).
Next, the “Impute Missing Values” procedure did so by assigning them the mean of their non-missing values. Using the mean value for imputation allows the value of other attributes for that instance to contribute toward predictive performance without influence from the imputed value. The “Normalize Attributes” procedure did so by mathematically mapping them to the [0, 1] value range. Attribute normalization reduces the effect of importance bias when training some types of ML models, especially those that rely on finding gradients [52].
3.3. Feature Selection
The mature methods of predictive performance scoring are classification accuracy (CA), precision (Pr), recall (Rc), F1 score, and AUC [48]. CA is simply the proportion of predictions that were correct. However, CA can be misleading for several reasons. First, a “no-skill” classifier that simply predicts the dominant class each time could appear to perform better than a skilled classifier. Second, CA does not reflect the false positive (FP) and false negative (FN) error rates of a classifier. Therefore, including the four other scoring methods provided a more complete assessment of model performance. Precision is the proportion of positive predictions that were correct while recall is the proportion of positive outcomes that the model correctly predicted. The difference between precision and recall is subtle but important. Precision assesses a classifier’s tendency to not mislabel negative outcomes while recall assesses its tendency to not mislabel positive outcomes. There is an inherent tradeoff between the FP and FN rates, and the precision and recall scores, respectively, reflect that [52]. The F1 score reflects the balance between precision and recall scores as their harmonic mean.
The AUC is a score that supplies a robust measure of the ability of a classifier to maximize precision at the expense of a higher error rate by optimizing the probability threshold of class membership. AUC is an acronym for area under the curve, where the curve is a plot of the classifier’s true positive rate (TP) against its FP rate, both as a function of the threshold in class membership probability [49]. As the threshold changes, the classifier increases its TP rate at the expense of a higher FP rate. The optimization is to achieve the maximum increase in TP rate for the least increase in FP rate. The first part of the workflow used the AUC score to select the best model for optimization. The final model selection was based on the average of the five scores.
The framework used the permutation feature importance (PFI) method to rank the predictive importance of attributes. The key benefits achieved from using PFI were that it is agnostic to the type of model evaluated, accounts for interactions with other attributes, and does not require retraining a model [51]. The PFI measured the mean and standard deviation of the decrease in AUC after permuting (shuffling) the attribute values a specified number of times. The permutation broke the association between the attribute and the target. Therefore, the mean reduction in the AUC score reflected how much the model depended on that attribute.
After selecting the model with the highest AUC score and saving the value, shown as A = AUC, the workflow iteratively removed attributes with the most missing values and lowest importance ranking. As the iterations removed attributes, the AUC increased from its initial value A because low importance attributes that also have missing values is like having noise in the data. The iteration continued until just before the AUC score decreased below the initial value A. Next, the “Remove Sparse Instances” procedure removed instances with attributes having the most missing values and lowest importance rank. The workflow then stored the updated AUC as B = AUC based on the reduced dataset and then imputed the remaining missing values. The next procedure repeated the earlier iteration of removing attributes with the next most missing values and lowest importance rank, just before the AUC declined below B.
The “Remove Instances II” procedure removed all instances with missing values for the remaining top-ranking attributes. The effect was a minimization of the number of missing values in the overall dataset because the lower ranking attributes of those instances removed also tended to have missing values. The procedure then stored the AUC at that stage as C = AUC. Even though removing instances with missing values reduced the size of the dataset, minimizing the number of instances with missing values also yielded more reliable ML model performance and attribute importance ranking. Subsequently, a procedure iterated the removal of the lowest ranking attributes just before the AUC declined below C. A final procedure evaluated the refined data using all the ML models and selected the best model to evaluate the ranking of attributes. The best model had the highest average of all five performance indicators.
3.4. Machine Learning
Data scientists established that no single ML model can best represent all types of datasets [52]. Therefore, the workflow trained 12 mature ML models and selected the best one to refine the attribute selection and to rank their importance in predictive performance. There are four categories of supervised ML models: decision trees, statistical learning, decision boundaries, and learned functions [52]. The models selected from the decision tree category were single decision trees (DT), random forest (RF), AdaBoost, gradient boosting (GB), Catboost, and extreme gradient boosting (XGB). The statistical models selected were k-nearest neighbor (kNN) and naïve Bayes (NB). The decision boundary models selected were logistic regression (LR) and support vector machine (SVM). The learned function models selected were linear multivariate fitting with stochastic gradient descent (SGD) and artificial neural network (ANN). The workflow added a “no skill” classifier to benchmark against five performance scores and their mean value. The no skill classifier simply selects the majority class for every prediction. The workflow averaged each of the five performance scores by using a 10-fold cross validation procedure [48].
The selected models are mature—only the outcome of their application to the unique dataset developed in this work was of interest. Textbooks by Aggarwal [49], Burkov [48], Géron [50], and Kelleher et al. [52] provide complete explanations and examples of how the selected ML models work and how k-fold cross validation provides reliable performance scores by minimizing overfitting and underfitting. Hence, there is no need to duplicate the description of those techniques here.
4. Results and Discussion
The workflow started by populating the target feature for 222 nations, which required visiting each CAA site to evaluate any drone regulations that existed. Subsequently, merging the other 36 indicators resulted in missing values for more than 10% of the data. The feature selection stage of the workflow effectively refined the dataset by removing attributes that ranked lowest and had the most missing values. The result was retention of seven indicators and 204 instances without missing values.
Table 3 lists the five predictive performance scores and their mean value for each model. A value of 1.0 is perfect predictive performance. A value of 0.5 suggests that the classification was no better than random guessing. Eight of the models had mean scores above 0.850, which is a widely accepted threshold for “good” performance [51]. ANN provided the best overall performance while the decision tree method provided the worst. The T&T column lists the multiples of time needed for training and testing relative to the “Constant” model. ANN was the best performer based on the average of the five scores, but it was also the most computationally intensive by a large margin.
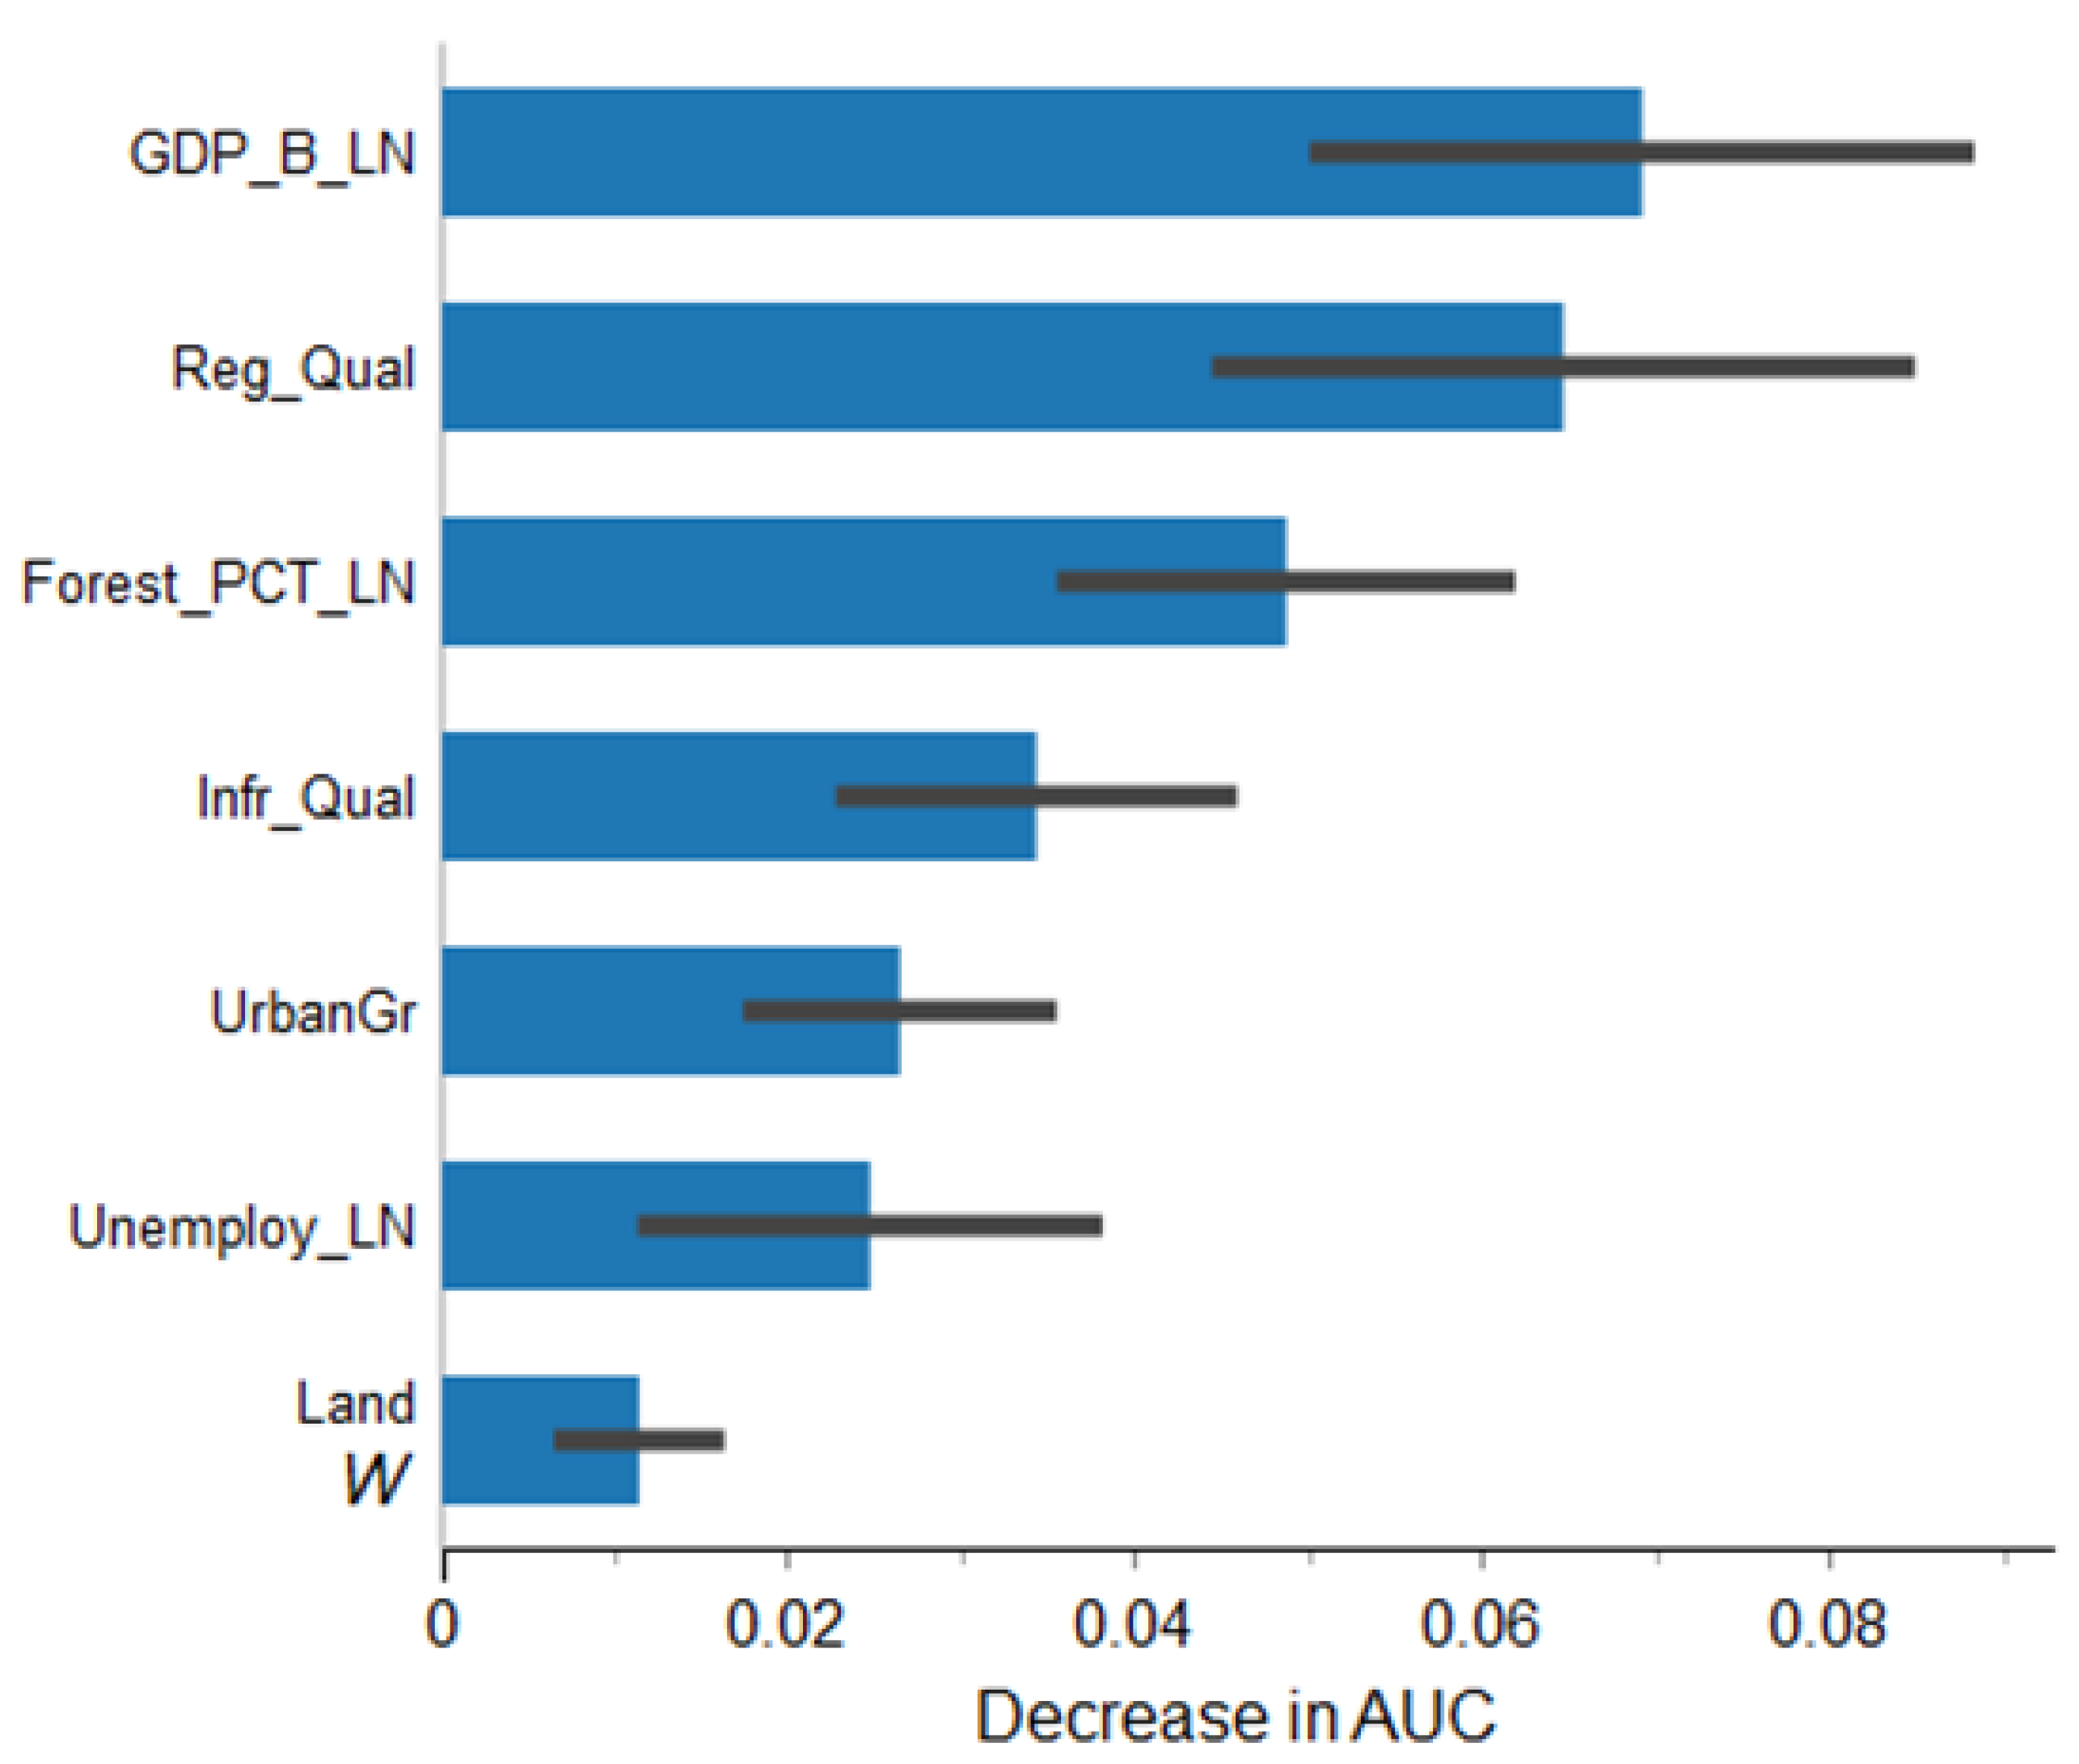
Figure 2 charts the importance ranking of the seven attributes left after feature refinement. The bars show the mean decrease in AUC for the ANN model after permutating the value of each attribute 100 times.
The lines at the right edge of each bar shows the proportional variation in AUC decrease across permutations. The results suggest that the GDP and regulatory quality rating were the two best predictors of nations that will adopt AAM. The plot indicates that each of the top two attributes account for 4% to 8% improvement in the model’s predictive performance. Each of the other five attributes shown account for less than 5% improvement in predictive performance, which may be insignificant in statistical terms [52].
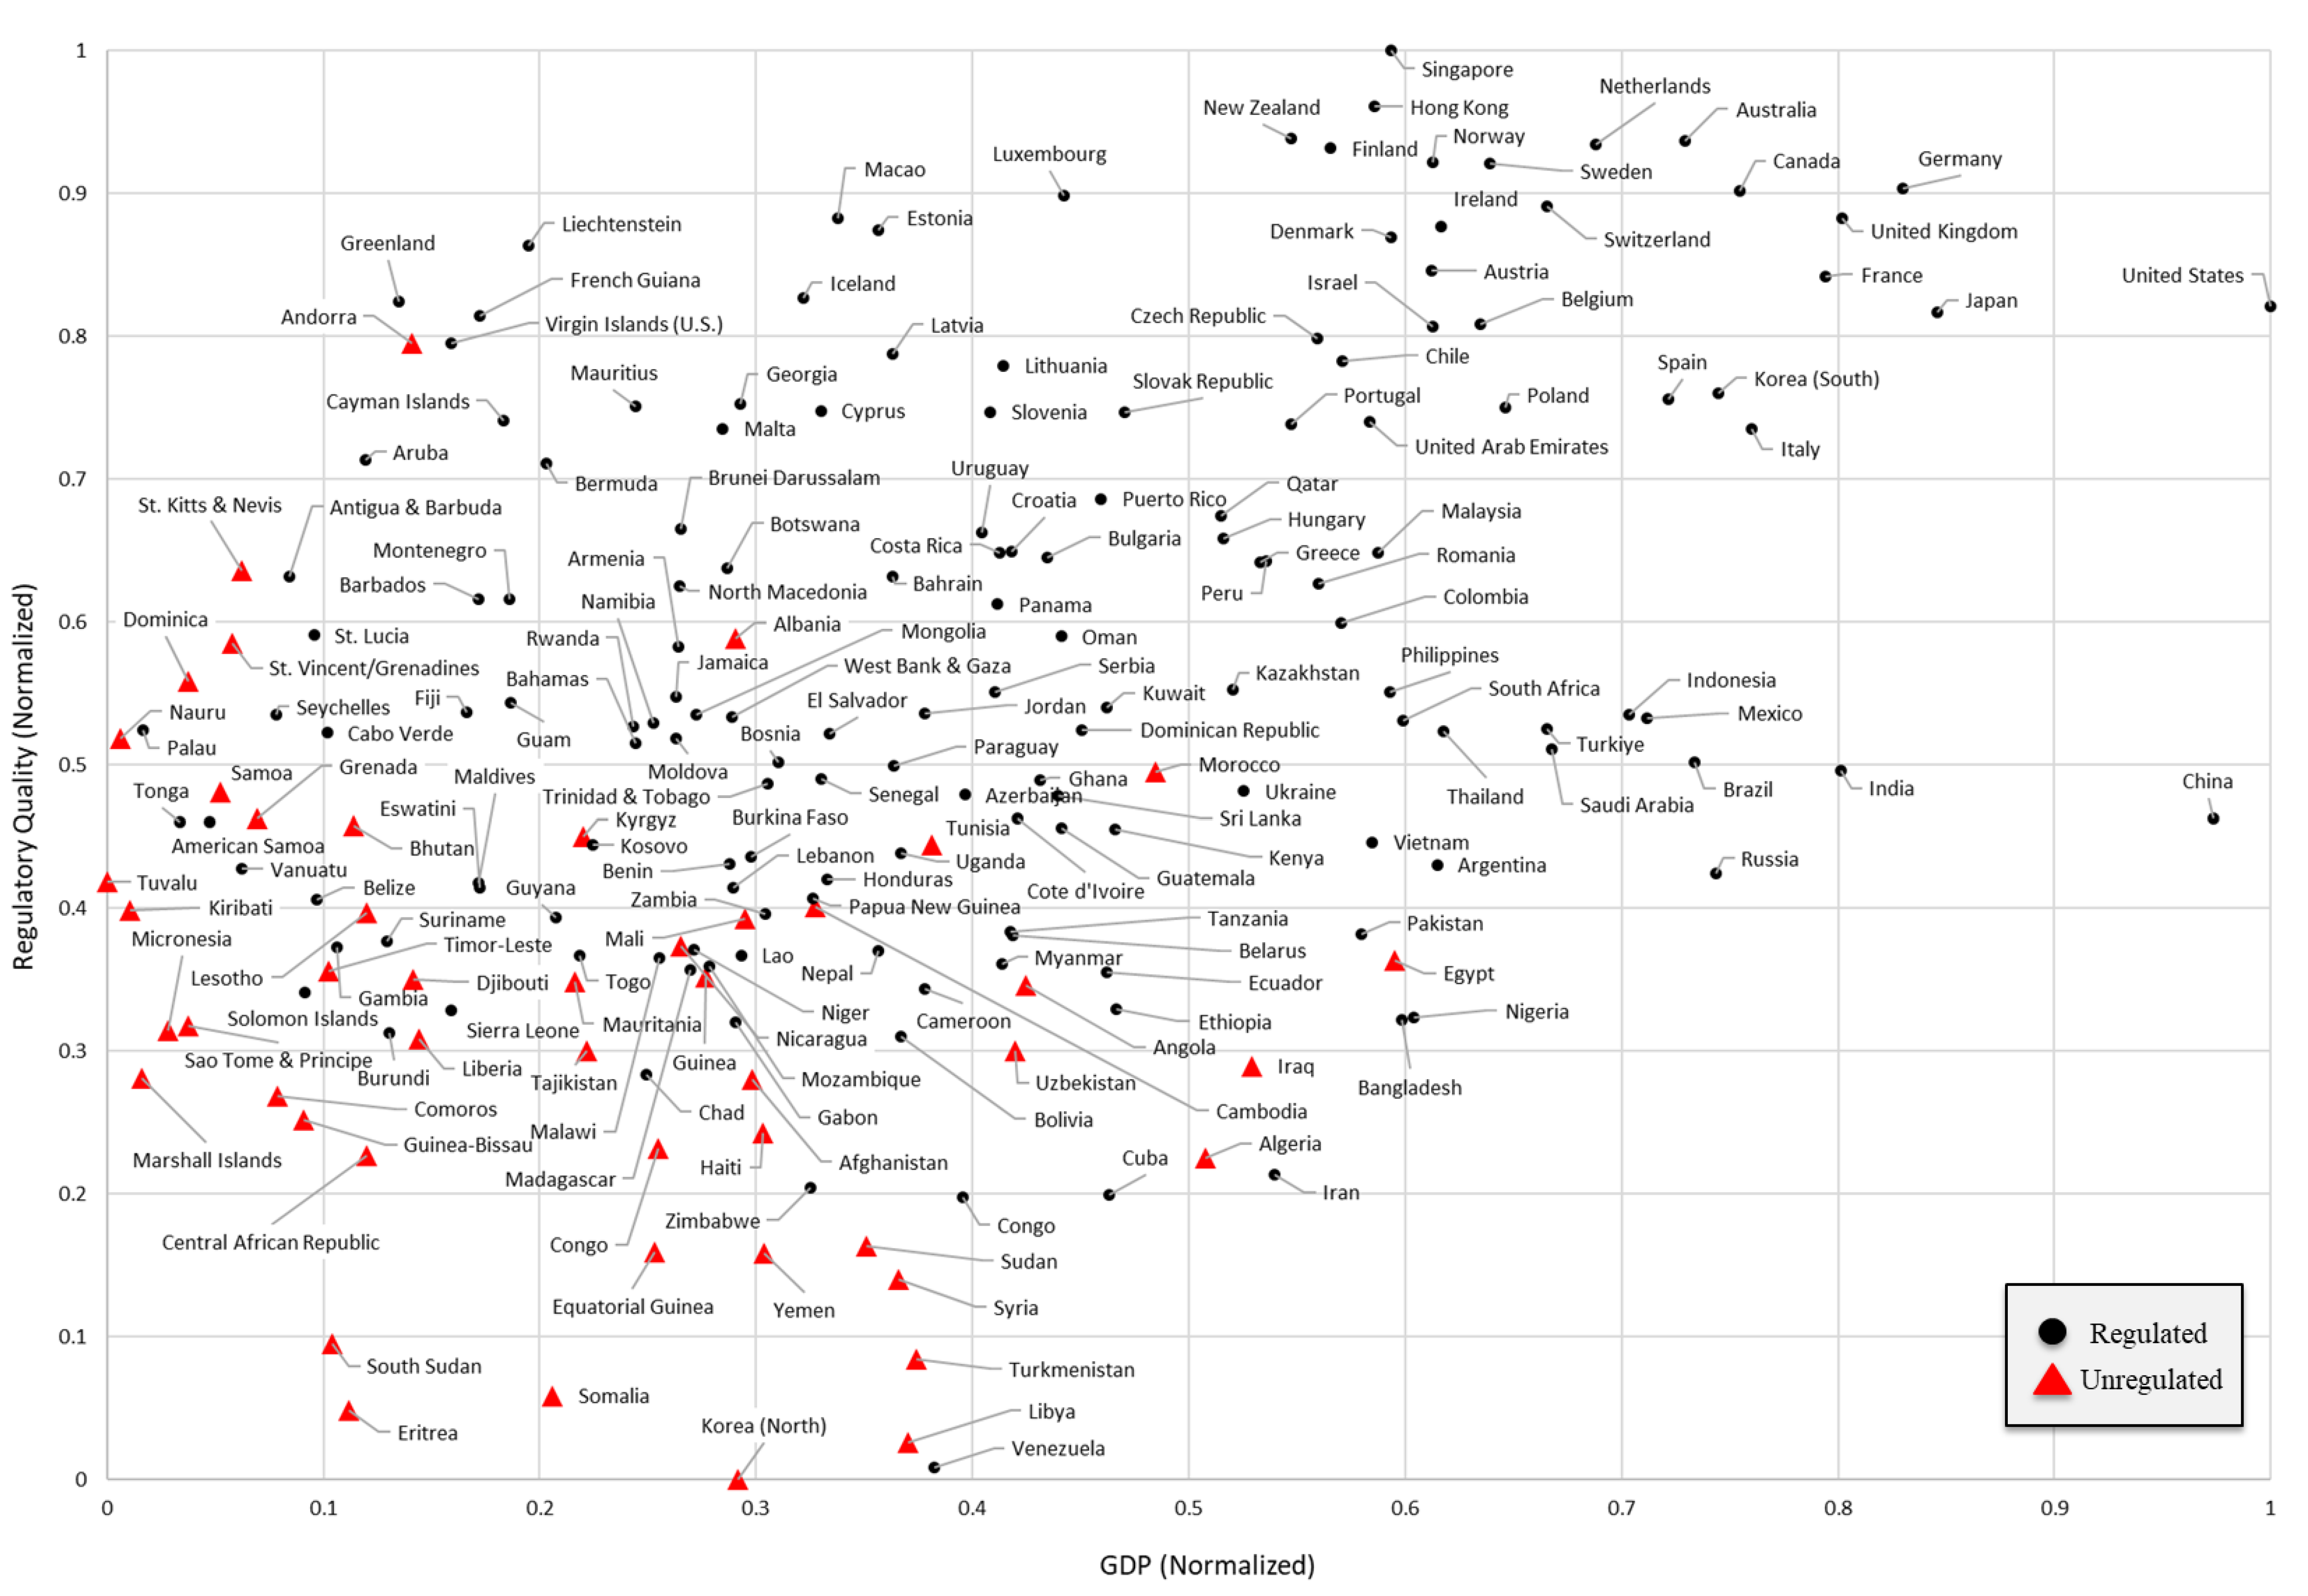
Figure 3 is a visualization of the relative adoption likelihood for each nation based on their position along the dimensions of the top two predictors. The scale of each attribute is their transformed and normalized values. Nations positioned in the upper right quadrant are more likely to adopt AAM based on the defined target. Conversely, nations in the lower left quadrant are least likely to adopt AAM based on the defined target.
The data had a large class imbalance because 48 of the 204 nations (23.5%) did not regulate drone operations as of 2022. A large class imbalance increases the difficulty of training ML models, which also leads to a reduction in classification performance. To reduce the impact of class imbalance, the k-fold cross validation stratified the data to even out the distribution of the minority class across folds.
Figure 3 shows there was no clear boundary to separate nations that allow drone usage under a set of rules versus those that did not. However, there is a clear clustering of nations in the lower left quadrant that do not regulate drone usage. This result suggested that as the best performer, the ANN model found a more complex hyperplane that best separated the target values in the refined feature space. Hence, those nations on the opposite side of the predicted boundary reduced the classification performance.
Figure 3 also shows that the United States and China were clear outliers in regulating drone operations. Indeed, as of 2022, manufacturers were testing more than 75% of all known designs in those two countries. Outliers in the opposite extreme of the chart that did not regulate drone operations were less developed African nations such as South Sudan, Eritrea and Somalia, and poor island nations such as Micronesia, Tuvalu, Kiribati, and the Marshall Islands.
The above findings align with the expectation that richer nations are more likely to be early adopters of AAM than poorer nations. The findings also aligned with the regulatory quality index, which supports the effectiveness of the WGI surveys. Equally important is the finding that attributes not associated with the target included SPI, land use characteristics, carbon dioxide emissions, tourism, population density, rule-of-law index, technology access, air transportation, traffic fatalities, and port traffic. For example, the ML outcome did not support a hypothesis that nations with a high SPI will likely to be early adopters of AAM.
A limitation of the data is that it may have misrepresented countries that are working on regulations but did not publish related information online at the time of accessing the CAA website. Also, the data may have misrepresented countries that are keeping the status of their developing regulations secret for whatever reason. Finally, countries that ban the public use of drones may still allow them for military use only, or for use only by their citizens. The ML approach also has a few limitations. The first is that feature importance depends on the target definition. Hence, the strategy was to use a known target value, which is whether a country regulated drone use. The rationale was that regulating drone use is an important early and necessary step towards AAM adoption. The second limitation of ML models is that a weak association with the target value means that the feature is a poor predictor but that does not necessarily mean that the feature is an inherently poor indicator.
5. Conclusions
Advanced Air Mobility (AAM) has the potential to change transportation as we know it. The benefits widely expected from adopting AAM are pollution reduction, greater accessibility, lower transport costs, and quicker trips in and between highly populated areas. However, most nations are not yet advancing regulations to enable AAM. The fragmentation and non-uniformity of regulations in different regions of the world could hamper the humanitarian initiatives of international organizations and prevent commercial opportunities for technology developers. Therefore, knowledge of key indicators that are predictors of AAM adoption will help focus resources and guide decision making. To that end, this research conducted a comprehensive assessment of attributes and their association with progress in drone rulemaking, which is a necessary precursor to AAM development and standardization. The methodology developed compared the predictive performance of 12 machine learning models on a uniquely assembled dataset of 36 indicators for 204 nations.
The research findings were that gross domestic product (GDP) and the regulatory quality indictor (RQI) were the best predictors of AAM adoption, based on their association with the target. Artificial neural network was the best performing model with an AUC score of 92.3% and an average composite score of approximately 90%. As a top predictor, the GDP supported an expectation that richer nations are more likely to lead in AAM adoption and reap its benefits sooner than poorer nations. RQI aligned with the WGI indicator for effective policymaking. In general, nations with a low RQI had no drone regulations or simply banned drone usage altogether. Just as importantly, attribute ranking for the top performing ML models revealed indicators that were poor predictors. Those included the social progress index, the WGI rule-of-law index, land use characteristics such as rural and urban proportions, direct access to open waterways, population density, access to technology such as electricity and cell phones, the level of carbon dioxide emissions, air transportation, traffic fatalities, port traffic, and tourism.
Future work will examine the correlation of indicators to find latent characteristics based on principal component analysis and to evaluate their effectiveness in explaining the transportation infrastructure quality of a nation
Funding
The U.S. Department of Transportation supported this work, grant number [Mountain Plains Consortium].
Institutional Review Board Statement
Not applicable.
Informed Consent Statement
Not applicable.
Data Availability Statement
The data presented in this study are openly available as cited.
Conflicts of Interest
The authors declare no conflict of interest.
References
- Pegels, A.; Altenburg, T. Latecomer development in a “greening” world: Introduction to the Special Issue. World Dev. 2020, 135, 105084. [Google Scholar] [CrossRef]
- Olabi, A.G.; Abdelkareem, M.A. Renewable energy and climate change. Renew. Sustain. Energy Rev. 2022, 158, 112111. [Google Scholar] [CrossRef]
- Huete, J.; Nalianda, D.; Zaghari, B.; Pilidis, P. A Strategy to Decarbonize Civil Aviation: A phased innovation approach to hydrogen technologies. IEEE Electrif. Mag. 2022, 10, 27–33. [Google Scholar] [CrossRef]
- Garrow, L.A.; German, B.; Schwab, N.T.; Patterson, M.D.; Mendonca, N.; Gawdiak, Y.O.; Murphy, J.R. A Proposed Taxonomy for Advanced Air Mobility. In Proceedings of the AIAA AVIATION 2022 Forum, Chicago, IL, USA, 27 June–1 July 2022. [Google Scholar]
- Bridgelall, R.; Askarzadeh, T.; Tolliver, D. Introducing an Efficiency Index to Evaluate eVTOL Designs. SSRN 2022. [Google Scholar] [CrossRef]
- GAO. Transforming Aviation: Stakeholders Identified Issues to Address for ‘Advanced Air Mobility’; Government Accountability Office (GAO): Washington, DC, USA, 2022. [Google Scholar]
- Kitonsa, H.; Kruglikov, S.V. Significance of drone technology for achievement of the United Nations sustainable development goals. R-Economy 2018, 4, 115–120. [Google Scholar] [CrossRef] [Green Version]
- Bexell, M.; Jönsson, K. Responsibility and the United Nations’ Sustainable Development Goals. Forum Dev. Stud. 2017, 44, 13–29. [Google Scholar] [CrossRef] [Green Version]
- Garrow, L.A.; German, B.J.; Leonard, C.E. Urban air mobility: A comprehensive review and comparative analysis with autonomous and electric ground transportation for informing future research. Transp. Res. Part C Emerg. Technol. 2021, 132, 103377. [Google Scholar] [CrossRef]
- Guggina, D. We’re Bringing the Convenience of Drone Delivery to 4 Million U.S. Households in Partnership with DroneUp. Walmart News, 24 May 2022. [Google Scholar]
- Amazon. Amazon Prime Air Prepares for Drone Deliveries. Amazon News, 13 June 2022. [Google Scholar]
- Carter, S.; Johnston, T.; Lidel, S.; Riedel, R.; Tusch, L. Drone Delivery: More Lift than You Think. Future Air Mobility Blog, 15 March 2022. [Google Scholar]
- Jeanneret, C.; Rambaldi, G. Drone Governance: A Scan of Policies, Laws and Regulations Governing the Use of Unmanned Aerial Vehicles (UAVs) in 79 Countries; Technical Centre for Agricultural and Rural Cooperation (CTA): Wageningen, The Netherlands, 2016. [Google Scholar]
- Ravich, T. A Comparative Global Analysis of Drone Laws: Best Practices and Policies. In The Future of Drone Use; Information Technology and Law Series; Custers, B., Ed.; T.M.C. Asser Press: The Hague, The Netherlands, 2016; Volume 27. [Google Scholar]
- Jones, T. International Commercial Drone Regulation and Drone Delivery Services; RAND Corporation: Santa Monica, CA, USA, 2017; p. 47. [Google Scholar]
- Cracknell, A.P. UAVs: Regulations and Law Enforcement. Int. J. Remote Sens. 2017, 38, 3054–3067. [Google Scholar] [CrossRef]
- Tsiamis, N.; Efthymiou, L.; Tsagarakis, K.P. A comparative analysis of the legislation evolution for drone use in oecd countries. Drones 2019, 3, 75. [Google Scholar] [CrossRef] [Green Version]
- Coops, N.C.; Goodbody, T.R.; Cao, L. Four steps to extend drone use in research. Nature 2019, 572, 433–435. [Google Scholar] [CrossRef] [Green Version]
- Janke, C.; Haag, M.U. Implementation of European Drone Regulations-Status Quo and Assessment. J. Intell. Robot. Syst. 2022, 106, 33. [Google Scholar] [CrossRef]
- Ayamga, M.; Tekinerdogan, B.; Kassahun, A. Exploring the challenges posed by regulations for the use of drones in agriculture in the African context. Land 2021, 10, 164. [Google Scholar] [CrossRef]
- Sah, B.; Gupta, R.; Bani-Hani, D. Analysis of barriers to implement drone logistics. Int. J. Logist. Res. Appl. 2021, 24, 531–550. [Google Scholar] [CrossRef]
- Tran, T.-H.; Nguyen, D.-D. Management and Regulation of Drone Operation in Urban Environment: A Case Study. Soc. Sci. 2022, 11, 474. [Google Scholar] [CrossRef]
- Jongwanich, J.; Kohpaiboon, A.; Obashi, A. Technological advancement, import penetration and labour markets: Evidence from Thailand. World Dev. 2022, 151, 105746. [Google Scholar] [CrossRef]
- Chauhan, S.K. Scholarly output on drone research: A bibliometric study. DESIDOC J. Libr. Inf. Technol. 2019, 39, 117–124. [Google Scholar] [CrossRef]
- Oxford. Analytica Growing Drone Use Will Drive International Regulation; Emerald Expert Briefings: West Yorkshire, UK, 2015. [Google Scholar]
- Schulzke, M. Drone proliferation and the challenge of regulating dual-use technologies. Int. Stud. Rev. 2019, 21, 497–517. [Google Scholar] [CrossRef]
- Calandrillo, S.; Oh, J.; Webb, A. Deadly Drones? Why FAA Regulations Miss the Mark on Drone Safety. Stanf. Technol. Law Rev. 2020, 23, 182. [Google Scholar]
- VFS. The Vertical Flight Society. 11 November 2022. Available online: https://evtol.news/aircraft (accessed on 11 November 2022).
- WB-GEP. Databank: Global Economic Prospects. 7 June 2022. Available online: https://databank.worldbank.org/source/global-economic-prospects (accessed on 6 November 2022).
- WB-WDI. DataBank: World Development Indicators. 16 September 2022. Available online: https://databank.worldbank.org/source/world-development-indicators (accessed on 6 November 2022).
- WGI. Worldwide Governance Indicators (WGI). 23 September 2022. Available online: http://info.worldbank.org/governance/wgi/ (accessed on 6 November 2022).
- WB-SDG. DataBank: Sustainable Development Goals (WB-SDG). 22 July 2022. Available online: https://databank.worldbank.org/source/sustainable-development-goals-(sdgs) (accessed on 6 November 2022).
- WB-Jobs. DataBank: Jobs. 29 June 2022. Available online: https://databank.worldbank.org/source/jobs (accessed on 6 November 2022).
- WB-DB. DataBank: Doing Business. 18 August 2021. Available online: https://databank.worldbank.org/source/doing-business (accessed on 6 November 2022).
- SPI. Social Progress Index. 6 November 2022. Available online: https://www.socialprogress.org/ (accessed on 6 November 2022).
- ICAO. International Civil Aviation Organization (ICAO). 6 November 2022. Available online: https://www.icao.int/pages/links.aspx (accessed on 6 November 2022).
- IATA. IATA. 11 November 2022. Available online: https://www.iata.org/en/programs/ops-infra/air-traffic-management/drones/ (accessed on 11 November 2022).
- Bleys, B. Beyond GDP: Classifying alternative measures for progress. Soc. Indic. Res. 2012, 109, 355–376. [Google Scholar] [CrossRef]
- Barrington-Leigh, C.; Escande, A. Measuring progress and well-being: A comparative review of indicators. Soc. Indic. Res. 2018, 135, 893–925. [Google Scholar] [CrossRef]
- Fleurbaey, M. Beyond GDP: The quest for a measure of social welfare. J. Econ. Lit. 2009, 47, 1029–1075. [Google Scholar] [CrossRef]
- Siddiqui, A.F.; Waseem, A.; Mamoon, D. Did we find alternate to GDP to measure national progress? Analysis of Harvard University’s social progress index. Turk. Econ. Rev. 2017, 4, 352–368. [Google Scholar]
- Fehder, D.; Stern, S. The Social Progress Index Methodology; Social Progress Imperative: Washington, DC, USA, 2013. [Google Scholar]
- Kaufmann, D.; Kraay, A.; Mastruzzi, M. The worldwide governance indicators: Methodology and analytical issues. Hague J. Rule Law 2011, 3, 220–246. [Google Scholar] [CrossRef]
- Jaramillo, C.F.; Freund, C.; Reis, J.G.; Arvis, J.F.; Wiederer, C.K.; Ojala, L.M.; Shepherd, B.A.; Raj, A.U.L.; Dairabayeva, K.S.; Kiiski, T.M.M. Connecting to Compete 2018: Trade Logistics in the Global Economy—The Logistics Performance Index and its Indicators. In The International Bank for Reconstruction and Development; The World Bank: Washington, DC, USA, 2018. [Google Scholar]
- UN-WPP. United Nations World Population Prospects (UN-WPP). Available online: https://population.un.org/wpp/Download/Standard/CSV/ (accessed on 6 November 2022).
- Wei, P.; Lu, Z.; Song, J. Variable importance analysis: A comprehensive review. Reliab. Eng. Syst. Saf. 2015, 142, 399–432. [Google Scholar] [CrossRef]
- Kelleher, J.D.; Namee, B.M.; D’arcy, A. Fundamentals of Machine Learning for Predictive Data Analytics: Algorithms, Worked Examples, and Case Studies; MIT Press: Cambridge, MA, USA, 2020; p. 856. [Google Scholar]
- Burkov, A. The Hundred-Page Machine Learning Book; Burkov, Andriy: Quebec City, QC, Canada, 2019; p. 160. [Google Scholar]
- Aggarwal, C.C. Data Mining; Springer International Publishing: New York, NY, USA, 2015; p. 734. [Google Scholar]
- Géron, A. Hands-on Machine Learning with Scikit-Learn, Keras, and TensorFlow: Concepts, Tools, and Techniques to Build Intelligent Systems, 2nd ed.; O’Reilly Media: Sebastopol, CA, USA, 2019. [Google Scholar]
- Durm, M.W. An A is not an A is not an A: A history of grading. Educ. Forum 1993, 57, 294–297. [Google Scholar] [CrossRef]
- Agresti, A. Statistical Methods for the Social Sciences, 5th ed.; Pearson: Boston, MA, USA, 2018; p. 608. [Google Scholar]
Figure 1.
Feature engineering and machine learning workflow.

Figure 2.
ANN feature ranking by AUC reduction.

Figure 3.
Normalized regulatory quality index and GDP among locations that did and did not regulate drone operations.
Figure 3.
Normalized regulatory quality index and GDP among locations that did and did not regulate drone operations.


Table 1.
Drones, economic, social, environmental, and governance attributes selected.
| Attribute | Description | Dataset | Year | N | |
|---|---|---|---|---|---|
| Drones | Fly | Drone use regulated (target feature) | CAA Web | 2022 | 222 |
| Designs_LN | Number of drone designs | VFS | 2022 | 222 | |
| Economic | POP_M_LN | Population in millions (LN) | UN-WPP | 2022 | 237 |
| POP_Gr | Population growth (annual %) | WB-PI | 2021 | 222 | |
| GDP_B_LN | GDP in $billion (LN) (current US$) | WB-WDI | 2021 | 217 | |
| GDPP_LN | GDP per capita (LN) (current US$) | WB-WDI | 2021 | 217 | |
| GDP_Gr | GDP growth (% since 2015 US$) | WB-GEP | 2021 | 217 | |
| Unemploy_LN | Unemployment (% of labor force) | WB-SDG | 2020 | 261 | |
| Arrivals_LN | Number of tourism arrivals | WB-WDI | 2020 | 266 | |
| Environment | SPI | Social progress index | SPI | 2021 | 168 |
| EQI-SPI | Environmental quality index | SPI | 2021 | 168 | |
| CO2_KT_LN | CO2 emissions (kilotons), LN | WB-WDI | 2019 | 266 | |
| Governance | Gov_Eff | Governance effectiveness index | WGI | 2019 | 214 |
| Polit_Stab | Political stability index | WGI | 2019 | 214 | |
| Reg_Qual | Regulatory quality index | WGI | 2019 | 214 | |
| Laws | Rule-of-law index | WGI | 2019 | 214 |
Table 2.
Land use, technology, and transportation attributes selected.
| Attribute | Description | Dataset | Year | N | |
|---|---|---|---|---|---|
| Land Use | Land_SqKM | Land area (sq. km) | WB-WDI | 2019 | 268 |
| Urban_SqKM_LN | Urban area (sq. km), LN | WB-WDI | 2010 | 268 | |
| UrbanPop | Urban population (% of total) | WB-SDG | 2020 | 261 | |
| UrbanGr | Urban population growth (annual %) | WB-SDG | 2020 | 261 | |
| Rural_SqKM | Rural area (sq. km) | WB-WDI | 2010 | 266 | |
| Ag_SqKM | Agricultural land (sq. km) | WB-WDI | 2018 | 266 | |
| Rural_r | Rural/land area ratio | Derived | 2010 | 266 | |
| Urban_r_LN | Urban/land area ratio | Derived | 2010 | 268 | |
| Ag_r_LN | Agricultural/land area ratio | Derived | 2010 | 266 | |
| Forest_PCT_LN | Forest/land area ratio | WB-WDI | 2019 | 266 | |
| POP_SqKM | Population density (persons/sq-km) | WB-J | 2016 | 242 | |
| Land_Type | Landlocked (L), open ocean border (W), island (I) | 2022 | 222 | ||
| Tech. | Electric_Cost | Cost to get in % of income per capita | WB-DB | 2019 | 191 |
| ATM100K_LN | ATMs per 100,000 adults | WB-J | 2016 | 242 | |
| Phone100 | Mobile phone subscriptions per 100 person | WB-J | 2016 | 242 | |
| Transportation | LPI | Logistics performance index | WB-WDI | 2018 | 266 |
| Infr_Qual | Infrastructure quality index | WB-WDI | 2018 | 266 | |
| Air_Cargo_LN | Air freight (million ton-km), LN | WB-WDI | 2019 | 266 | |
| Air_Pax_LN | Air passengers (year) | WB-WDI | 2019 | 266 | |
| Port_TEU_LN | Port traffic, 20 ft equivalent units (TEU) | WB-WDI | 2019 | 266 | |
| Road_Deaths | Road traffic mortality (per 100,000) | WB-WDI | 2019 | 266 |
Table 3.
ML model performance scores.
| Model | AUC | CA | F1 | Pr | Rc | Mean | T&T |
|---|---|---|---|---|---|---|---|
| ANN | 0.923 | 0.886 | 0.884 | 0.882 | 0.886 | 0.892 | 113.6 |
| LR | 0.912 | 0.873 | 0.864 | 0.867 | 0.873 | 0.878 | 6.5 |
| SVM | 0.885 | 0.867 | 0.861 | 0.860 | 0.867 | 0.868 | 10.0 |
| NB | 0.926 | 0.843 | 0.852 | 0.874 | 0.843 | 0.868 | 3.9 |
| kNN | 0.870 | 0.861 | 0.859 | 0.857 | 0.861 | 0.862 | 9.3 |
| RF | 0.889 | 0.855 | 0.850 | 0.848 | 0.855 | 0.859 | 47.0 |
| Catboost | 0.871 | 0.849 | 0.849 | 0.848 | 0.849 | 0.853 | 53.9 |
| XGB | 0.876 | 0.849 | 0.845 | 0.842 | 0.849 | 0.852 | 41.5 |
| SGD | 0.782 | 0.861 | 0.861 | 0.860 | 0.861 | 0.845 | 6.4 |
| GB | 0.853 | 0.837 | 0.835 | 0.832 | 0.837 | 0.839 | 36.9 |
| AdaBoost | 0.733 | 0.801 | 0.808 | 0.817 | 0.801 | 0.792 | 11.0 |
| DT | 0.658 | 0.795 | 0.793 | 0.791 | 0.795 | 0.766 | 6.1 |
| No Skill | 0.459 | 0.795 | 0.704 | 0.632 | 0.795 | 0.677 | 1.0 |
Disclaimer/Publisher’s Note: The statements, opinions and data contained in all publications are solely those of the individual author(s) and contributor(s) and not of MDPI and/or the editor(s). MDPI and/or the editor(s) disclaim responsibility for any injury to people or property resulting from any ideas, methods, instructions or products referred to in the content. |
© 2023 by the author. Licensee MDPI, Basel, Switzerland. This article is an open access article distributed under the terms and conditions of the Creative Commons Attribution (CC BY) license (https://creativecommons.org/licenses/by/4.0/).
Share and Cite
MDPI and ACS Style
Bridgelall, R. Predicting Advanced Air Mobility Adoption Globally by Machine Learning. Standards 2023, 3, 70-83. https://doi.org/10.3390/standards3010007
AMA Style
Bridgelall R. Predicting Advanced Air Mobility Adoption Globally by Machine Learning. Standards. 2023; 3(1):70-83. https://doi.org/10.3390/standards3010007
Chicago/Turabian StyleBridgelall, Raj. 2023. "Predicting Advanced Air Mobility Adoption Globally by Machine Learning" Standards 3, no. 1: 70-83. https://doi.org/10.3390/standards3010007