
Observation of a Signal Suppressing Effect in a Binary Mixture of Glycol-Water Contamination in Engine Oil with Fourier-Transform Infrared Spectroscopy

 , , and
Abstract
:
1. Introduction
2. Material and Methods
2.1. Sample Preparation
2.2. FT-IR Spectroscopy Analysis
2.3. Data Preprocessing and Analysis
2.4. Results and Discussion
3. Conclusions
Author Contributions
Funding
Institutional Review Board Statement
Informed Consent Statement
Data Availability Statement
Conflicts of Interest
References
- Fitch, J.; Corporation, N. Glycol in Lubricating Oil-Detection, Analysis and Removal. Mach. Lubr. 2014, 15, 1–9. [Google Scholar]
- Pawlak, Z.B.T.-T. (Ed.) Chapter 6-Analytical Techniques in Lubricating Practices. Tribochemistry Lubr. Oils; Elsevier: Amsterdam, The Netherlands, 2003; Volume 45, pp. 217–265. [Google Scholar] [CrossRef]
- Salehi, F.M.; Morina, A.; Neville, A. The effect of soot and diesel contamination on wear and friction of engine oil pump. Tribol. Int. 2017, 115, 285–296. [Google Scholar] [CrossRef] [Green Version]
- Angeles, R. Tables on Oil Analysis 2003. Available online: https://www.rsareliability.com/Oil%20Analysis%20Tables.pdf (accessed on 1 June 2018).
- MTU Friedrichshafen GmbH. Fluids and Lubricants Specifications 2012; pp. 1–135. Available online: https://authorzilla.com/zG2rD/fluids-and-lubricants-specifications-mtu.html (accessed on 5 June 2018).
- Van Rensselar, J. Used Oil Condemning Limits. Tribol. Lubr. Technol. 2012, 68, 36–43. [Google Scholar]
- Raţiu, S.; Josan, A.; Alexa, V.; Cioată, V.G.; Kiss, I. Impact of contaminants on engine oil: A review. J. Phys. Conf. Ser. 2021, 1781, 012051. [Google Scholar] [CrossRef]
- Scientific Spectro. Guide to Measuring Glycol Contamination in Oil; Spectro Sci.: Chelmsford, MA, USA, 2016; pp. 1–5. [Google Scholar]
- Agarwal, A.K. Lubricating Oil Tribology of a Biodiesel-Fuelled Compression Ignition Engine. In Proceedings of the ASME 2003 Internal Combustion Engine Division Spring Technical Conference, Salzburg, Austria, 11–14 May 2003; pp. 751–765. [Google Scholar] [CrossRef] [Green Version]
- Hönig, V.; Procházka, P.; Obergruber, M.; Kučerová, V.; Mejstřík, P.; Macků, J.; Bouček, J. Determination of Tractor Engine Oil Change Interval Based on Material Properties. Materials 2020, 13, 5403. [Google Scholar] [CrossRef]
- Suryawanshi, S.; Pattiwar, J. Effect of TiO2 Nanoparticles Blended with Lubricating Oil on the Tribological Performance of the Journal Bearing. Tribol. Ind. 2018, 40, 370–391. [Google Scholar] [CrossRef]
- Wu, Y.; Kao, M. Using TiO2 nanofluid additive for engine lubrication oil. Ind. Lubr. Tribol. 2011, 63, 440–445. [Google Scholar] [CrossRef]
- Kumar, M.; Afzal, A.; Ramis, M.K. Investigation of physicochemical and tribological properties of TiO2 nano-lubricant oil of different concentrations. Tribologia 2017, 35, 6–15. [Google Scholar]
- Laad, M.; Jatti, V.K.S. Titanium oxide nanoparticles as additives in engine oil. J. King Saud Univ.-Eng. Sci. 2018, 30, 116–122. [Google Scholar] [CrossRef] [Green Version]
- Ilie, F.; Covaliu, C. Tribological Properties of the Lubricant Containing Titanium Dioxide Nanoparticles as an Additive. Lubricants 2016, 4, 12. [Google Scholar] [CrossRef] [Green Version]
- Lister, T. Industrial Chemistry Case Studies: Industrial Processes in the 1990s, 1st ed.; Royal Society of Chemistry: London, UK, 1999. [Google Scholar]
- Abdulmunem, O.M.; Abdul-Munaim, A.M.; Aller, M.M.; Preu, S.; Watson, D.G. THz-TDS for Detecting Glycol Contamination in Engine Oil. Appl. Sci. 2020, 10, 3738. [Google Scholar] [CrossRef]
- Karunanithy, R.; Holland, T.; Sivakumar, P. Influence of Glutaraldehyde’s Molecular Transformations on Spectroscopic Investigations of Its Conjugation with Amine-Modified Fe3O4 Microparticles in the Reaction Medium. Langmuir 2021, 37, 5242–5251. [Google Scholar] [CrossRef]
- Berthomieu, C.; Hienerwadel, R. Fourier transform infrared (FTIR) spectroscopy. Photosynth. Res. 2009, 101, 157–170. [Google Scholar] [CrossRef]
- Ami, D.; Mereghetti, P.; Leri, M.; Giorgetti, S.; Natalello, A.; Doglia, S.M.; Stefani, M.; Bucciantini, M. A FTIR microspectroscopy study of the structural and biochemical perturbations induced by natively folded and aggregated transthyretin in HL-1 cardiomyocytes. Sci. Rep. 2018, 8, 1–15. [Google Scholar] [CrossRef] [Green Version]
- Breton, J. Fourier transform infrared spectroscopy of primary electron donors in type I photosynthetic reaction centers. Biochim. Biophys. Acta 2001, 1507, 180–193. [Google Scholar] [CrossRef] [Green Version]
- Guang, P.; Huang, W.; Guo, L.; Yang, X.; Huang, F.; Yang, M.; Wen, W.; Li, L. Blood-based FTIR-ATR spectroscopy coupled with extreme gradient boosting for the diagnosis of type 2 diabetes: A STARD compliant diagnosis research. Medicine 2020, 99, 1–7. [Google Scholar] [CrossRef]
- Tambe, E.; Gotmare, S. Ftir Analysis and Interpretation of Ir Spectra of Four Spice Oils Extracted By Hydrodistillation. World J. Pharm. Pharm. Sci. 2022, 11, 1346–1363. [Google Scholar] [CrossRef]
- Holland, T.; Abdul-Munaim, A.M.; Watson, D.G.; Sivakumar, P. Influence of Sample Mixing Techniques on Engine Oil Contamination Analysis by Infrared Spectroscopy. Lubricants 2019, 7, 4. [Google Scholar] [CrossRef] [Green Version]
- Holland, T.; Abdul-Munaim, A.M.; Watson, D.G.; Sivakumar, P. Importance of Emulsification in Calibrating Infrared Spectroscopes for Analyzing Water Contamination in Used or In-Service Engine Oil. Lubricants 2018, 6, 35. [Google Scholar] [CrossRef] [Green Version]
- Abdul-Munaim, A.M.; Holland, T.; Sivakumar, P.; Watson, D.G. Absorption Wavebands for Discriminating Oxidation Time of Engine Oil as Detected by FT-IR Spectroscopy. Lubricants 2019, 7, 24. [Google Scholar] [CrossRef] [Green Version]
- Holland, T.; Karunanithy, R.; Abdul-Munaim, A.M.; Mandrell, C.; Watson, D.G.; Sivakumar, P. P3412 Determination of Glycol Contamination in Engine Oil by Infrared and UV-Vis Spectroscopy. In Proceedings of the 73rd International Symposium on Molecular Spectroscopy, Champaign, IL, USA, 18–22 June 2018. [Google Scholar]
- ASTM International. ASTM E2412-10; Standard Practice for Condition Monitoring of Used Lubricants by Trend Analysis Using Fourier Transform Infrared (FT-IR) Spectrometry. ASTM International: West Conshohocken, PA, USA, 2010; pp. 1–22. [CrossRef]
- Guo, Y.-C.; Cai, C.; Zhang, Y.-H. Observation of conformational changes in ethylene glycol–water complexes by FTIR–ATR spectroscopy and computational studies. AIP Adv. 2018, 8, 055308. [Google Scholar] [CrossRef]
- Buckley, P.; Giguère, P.A. Infrared studies on rotational isomerism. I. Ethylene glycol. Can. J. Chem. 1967, 45, 397–407. [Google Scholar] [CrossRef]
- Mandrell, C.T.; Holland, T.E.; Wheeler, J.F.; Esmaeili, S.M.A.; Amar, K.; Chowdhury, F.; Sivakumar, P. Machine Learning Approach to Raman Spectrum Analysis of MIA PaCa-2 Pancreatic Cancer Tumor Repopulating Cells for Classification and Feature Analysis. Life 2020, 10, 181. [Google Scholar] [CrossRef]
- Holland, T.; Abdul-Munaim, A.M.; Mandrell, C.; Karunanithy, R.; Watson, D.G.; Sivakumar, P. UV-Visible Spectrophotometer for Distinguishing Oxidation Time of Engine Oil. Lubricants 2021, 9, 37. [Google Scholar] [CrossRef]
- Weng, L.; Chen, C.; Zuo, J.; Li, W. Molecular Dynamics Study of Effects of Temperature and Concentration on Hydrogen-Bond Abilities of Ethylene Glycol and Glycerol: Implications for Cryopreservation. J. Phys. Chem. A 2011, 115, 4729–4737. [Google Scholar] [CrossRef]
- Ma, X.; Wang, J. Differentiating Subtle Variation of Weak Intramolecular Hydrogen Bond in Vicinal Diols by Linear Infrared Spectroscopy. J. Phys. Chem. A 2009, 113, 6070–6076. [Google Scholar] [CrossRef]
- Ma, X.; Cai, K.; Wang, J. Dynamical Structures of Glycol and Ethanedithiol Examined by Infrared Spectroscopy, Ab Initio Computation, and Molecular Dynamics Simulations. J. Phys. Chem. B 2011, 115, 1175–1187. [Google Scholar] [CrossRef]
- Chen, Y.; Ozaki, Y.; Czarnecki, M.A. Molecular structure and hydrogen bonding in pure liquid ethylene glycol and ethylene glycol–water mixtures studied using NIR spectroscopy. Phys. Chem. Chem. Phys. 2013, 15, 18694–18701. [Google Scholar] [CrossRef] [Green Version]
- Howard, D.L.; Jørgensen, P.; Kjaergaard, H.G. Weak Intramolecular Interactions in Ethylene Glycol Identified by Vapor Phase OH−Stretching Overtone Spectroscopy. J. Am. Chem. Soc. 2005, 127, 17096–17103. [Google Scholar] [CrossRef]
- Kaiser, A.; Ritter, M.; Nazmutdinov, R.; Probst, M. Hydrogen Bonding and Dielectric Spectra of Ethylene Glycol–Water Mixtures from Molecular Dynamics Simulations. J. Phys. Chem. B 2016, 120, 10515–10523. [Google Scholar] [CrossRef]
- Rahimi, B.; Semnani, A.; Nezamzadeh-Ejhieh, A.; Shakoori Langeroodi, H.S.; Davood, M.H. Monitoring of the Physical and Chemical Properties of a Gasoline Engine Oil during Its Usage. J. Anal. Methods Chem. 2012, 2012, 819524. [Google Scholar] [CrossRef] [Green Version]
- Van Mourik, T.; Bühl, M.; Gaigeot, M.-P. Density functional theory across chemistry, physics and biology. Philos. Trans. R. Soc. London. Ser. A Math. Phys. Eng. Sci. 2014, 372, 20120488. [Google Scholar] [CrossRef]


| (a) Comparing equal volumes of different contaminants | |||
| Amount of Concentrated Antifreeze Contaminant (% v/v) | Amount of 50/50 Premixed Antifreeze/Water Contminant (% v/v) | Amount of Distilled Water Contaminant (% v/v) | |
| 0 | 0 | 0 | |
| 0.1 | 0.1 | 0.1 | |
| 0.2 | 0.2 | 0.2 | |
| 1.0 | 1.0 | 1.0 | |
| 2.0 | 2.0 | 2.0 | |
| (b) Comparing equal amount of antifreeze concentration by different contaminants | |||
| Concentration of Antifreeze by Contaminant (% v/v) | Amount of Concentrated Antifreeze (% v/v) | Amount of 50/50 Premixed Antifreeze/Water (% v/v) | |
| 0 | 0 | 0 | |
| 0.05 | 0.05 | 0.1 | |
| 0.1 | 0.1 | 0.2 | |
| 0.2 | 0.2 | 0.4 | |
| 1.0 | 1.0 | 2.0 | |
| 2.0 | 2.0 | 4.0 | |
| (c) Comparing equal amount of O-H concentration by different contaminants | |||
| Concentration of O–H bonds in contaminant (a.u.) | Amount of Concentrated Antifreeze (% v/v) | Amount of 50/50 Premixed Antifreeze/Water (% v/v) | Amount of Distilled Water (% v/v) |
| 0 | 0 | 0 | 0 |
| 0.5 | 0.5 | 0.244 | 0.161 |
| 1.0 | 1.0 | 0.487 | 0.322 |
| 2.0 | 2.0 | 0.975 | 0.645 |
| 4.0 | 4.0 | 1.95 | 1.289 |
| 8.21 | 8.21 | 4.0 | 2.646 |
| Percent Contamination | |||||||
|---|---|---|---|---|---|---|---|
| 0.0% | 0.1% | 0.2% | 0.5% | 1.0% | 2.0% | ||
| Contaminant Type | N | Mean * | Mean * | Mean * | Mean * | Mean * | Mean * |
| Water | 3 | 0.0011369 a | 0.0038145 a | 0.0085823 a | 0.0194665 a | 0.037366 a | 0.063110 a |
| Glycol/Water | 3 | 0.0011369 a | 0.0029290 a | 0.0037119 b | 0.0141760 b | 0.018696 b | 0.033128 b |
| Glycol | 3 | 0.0011369 a | 0.0025882 a | 0.0037100 b | 0.0068265 c | 0.009768 c | 0.018479 c |
| Percent Glycol Contamination | ||||||||
|---|---|---|---|---|---|---|---|---|
| 0.0% | 0.05% | 0.1% | 0.2% | 0.5% | 1.0% | 2.0% | ||
| Contaminant Type | N | Mean * | Mean * | Mean * | Mean * | Mean * | Mean * | Mean * |
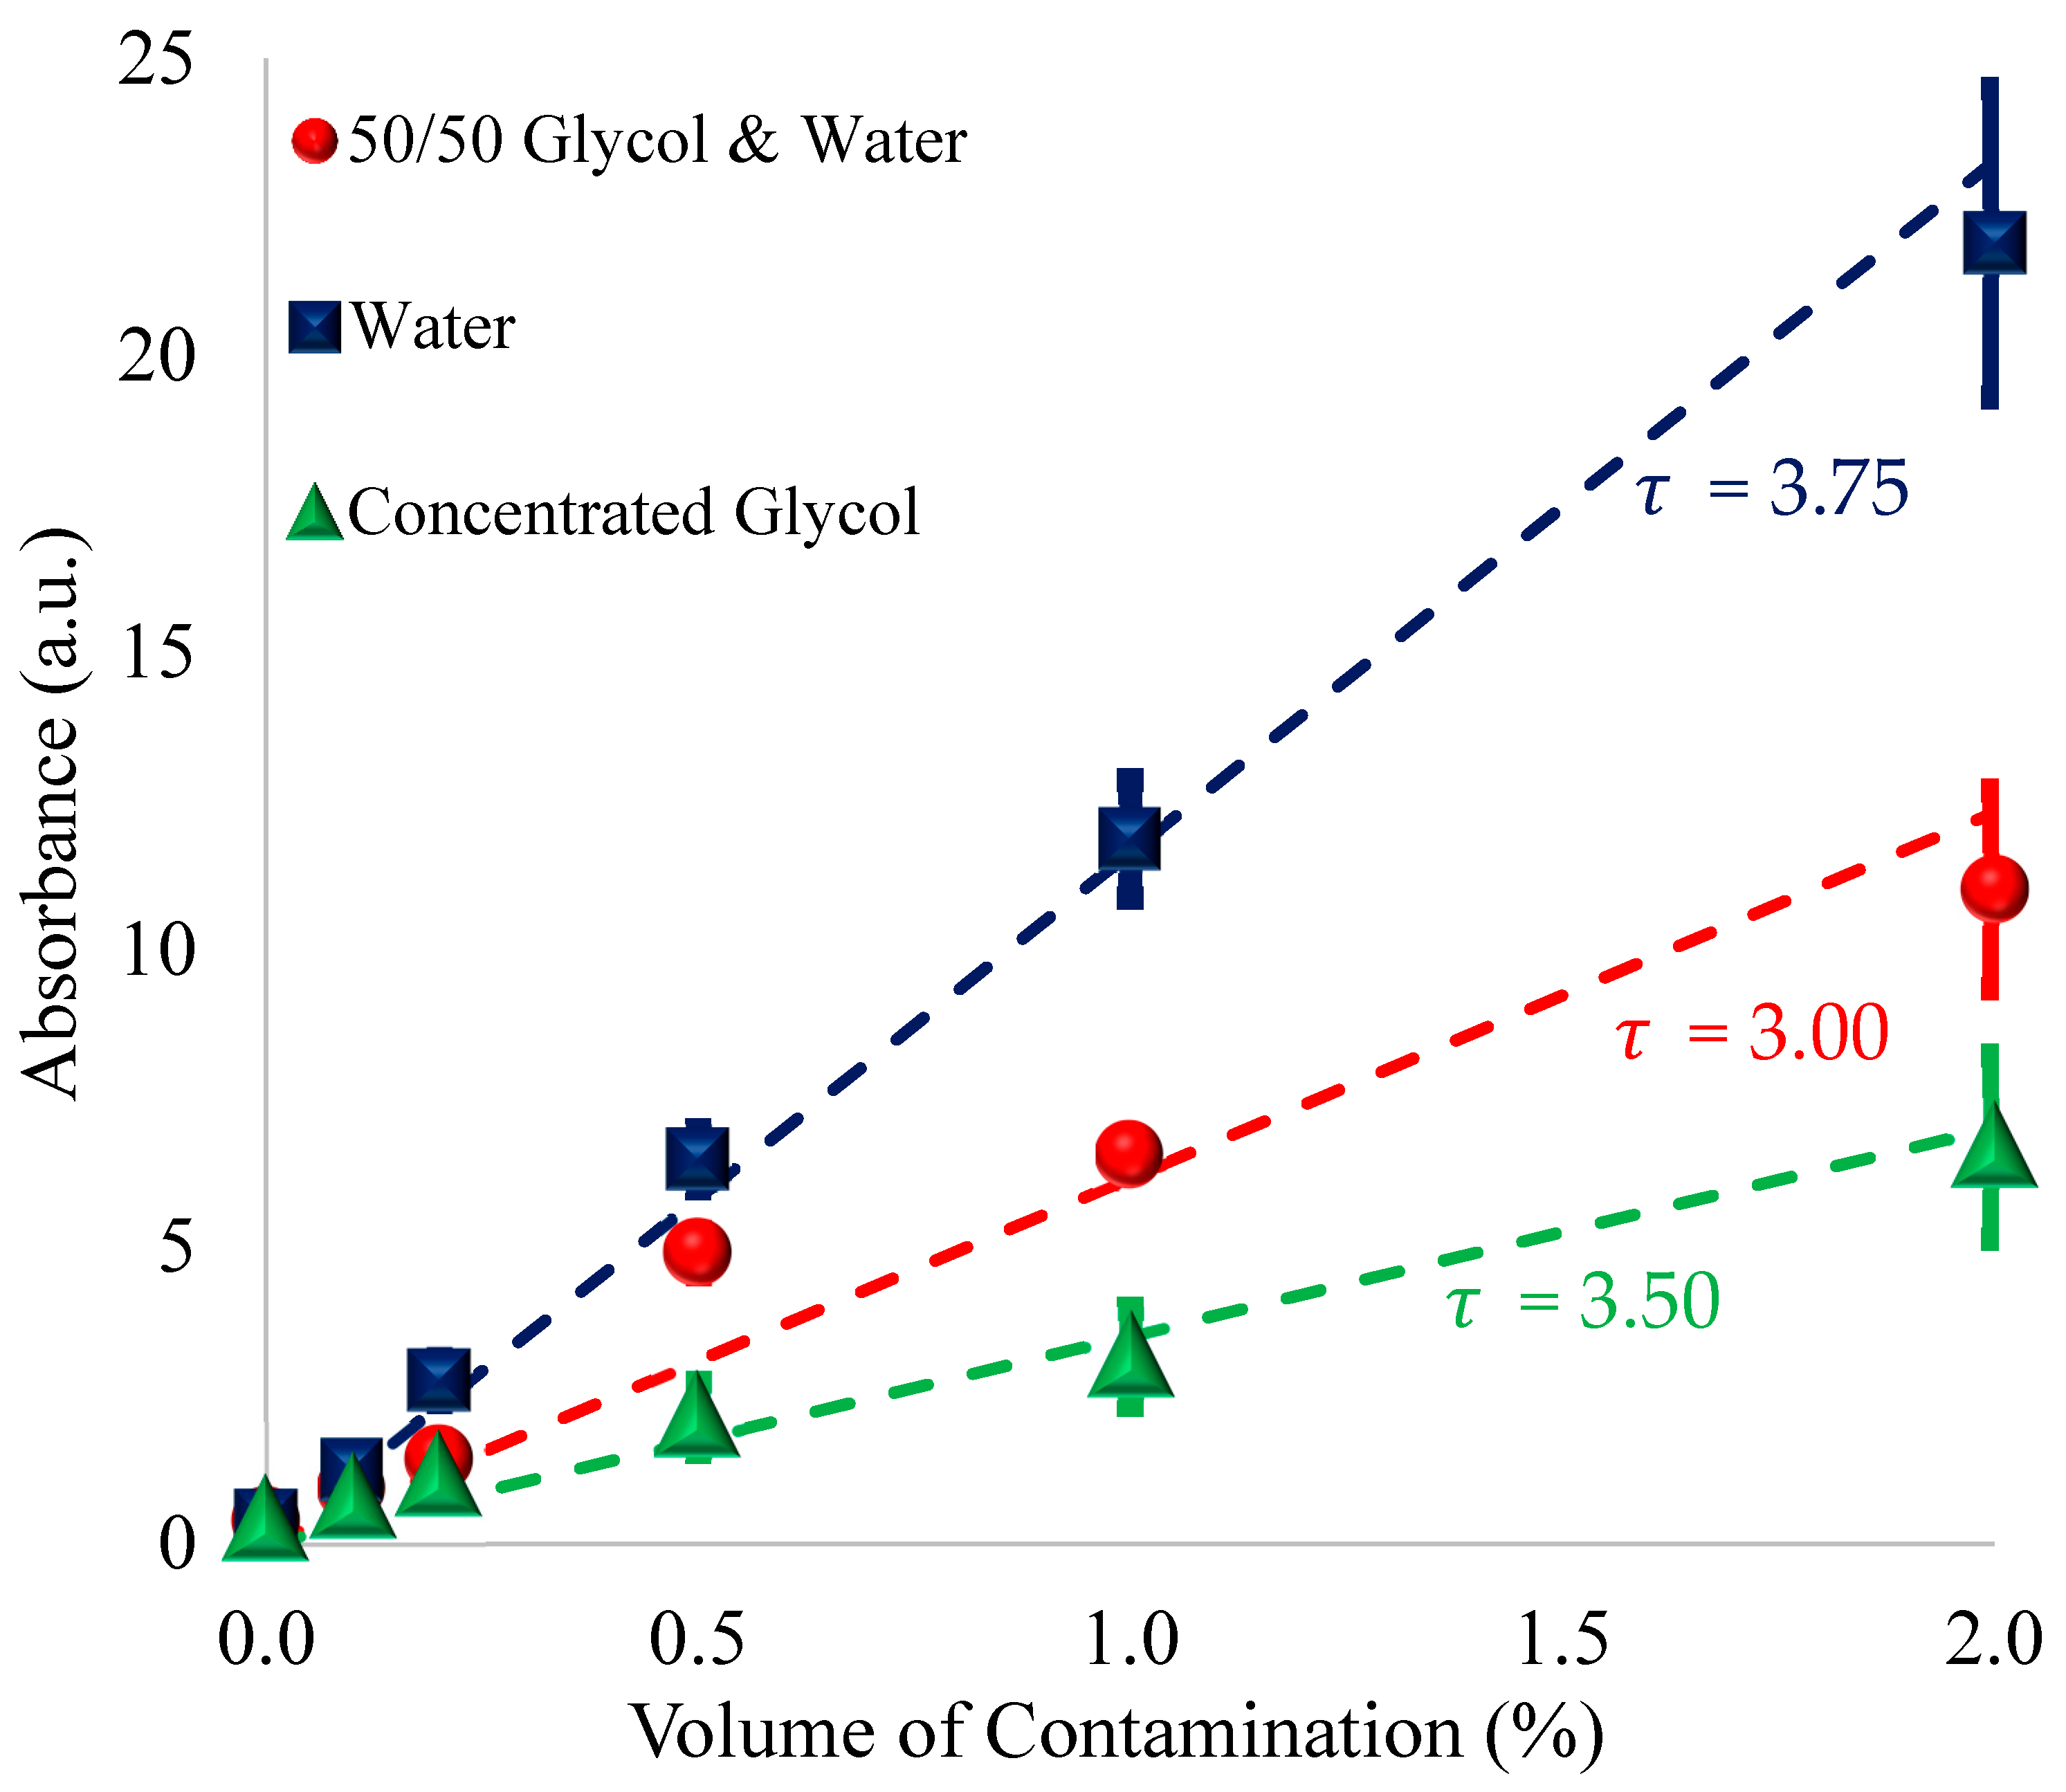
| Glycol/Water | 3 | 0.39452 a | 1.0167 a | 1.2892 a | 3.1154 a | 6.5002 a | 11.518 a | 21.1346 a |
| Glycol | 3 | 0.39452 a | 0.8295 a | 0.8969 a | 1.2906 b | 2.3758 b | 3.401 b | 6.4343 b |
| O–H Contamination | |||||||||||||
|---|---|---|---|---|---|---|---|---|---|---|---|---|---|
| 0.0 | 0.5 | 1.0 | 2.0 | 4.0 | 8.21 | ||||||||
| Contaminant Type | N | Mean * | % v/v | Mean * | % v/v | Mean * | % v/v | Mean * | % v/v | Mean * | % v/v | Mean * | % v/v |
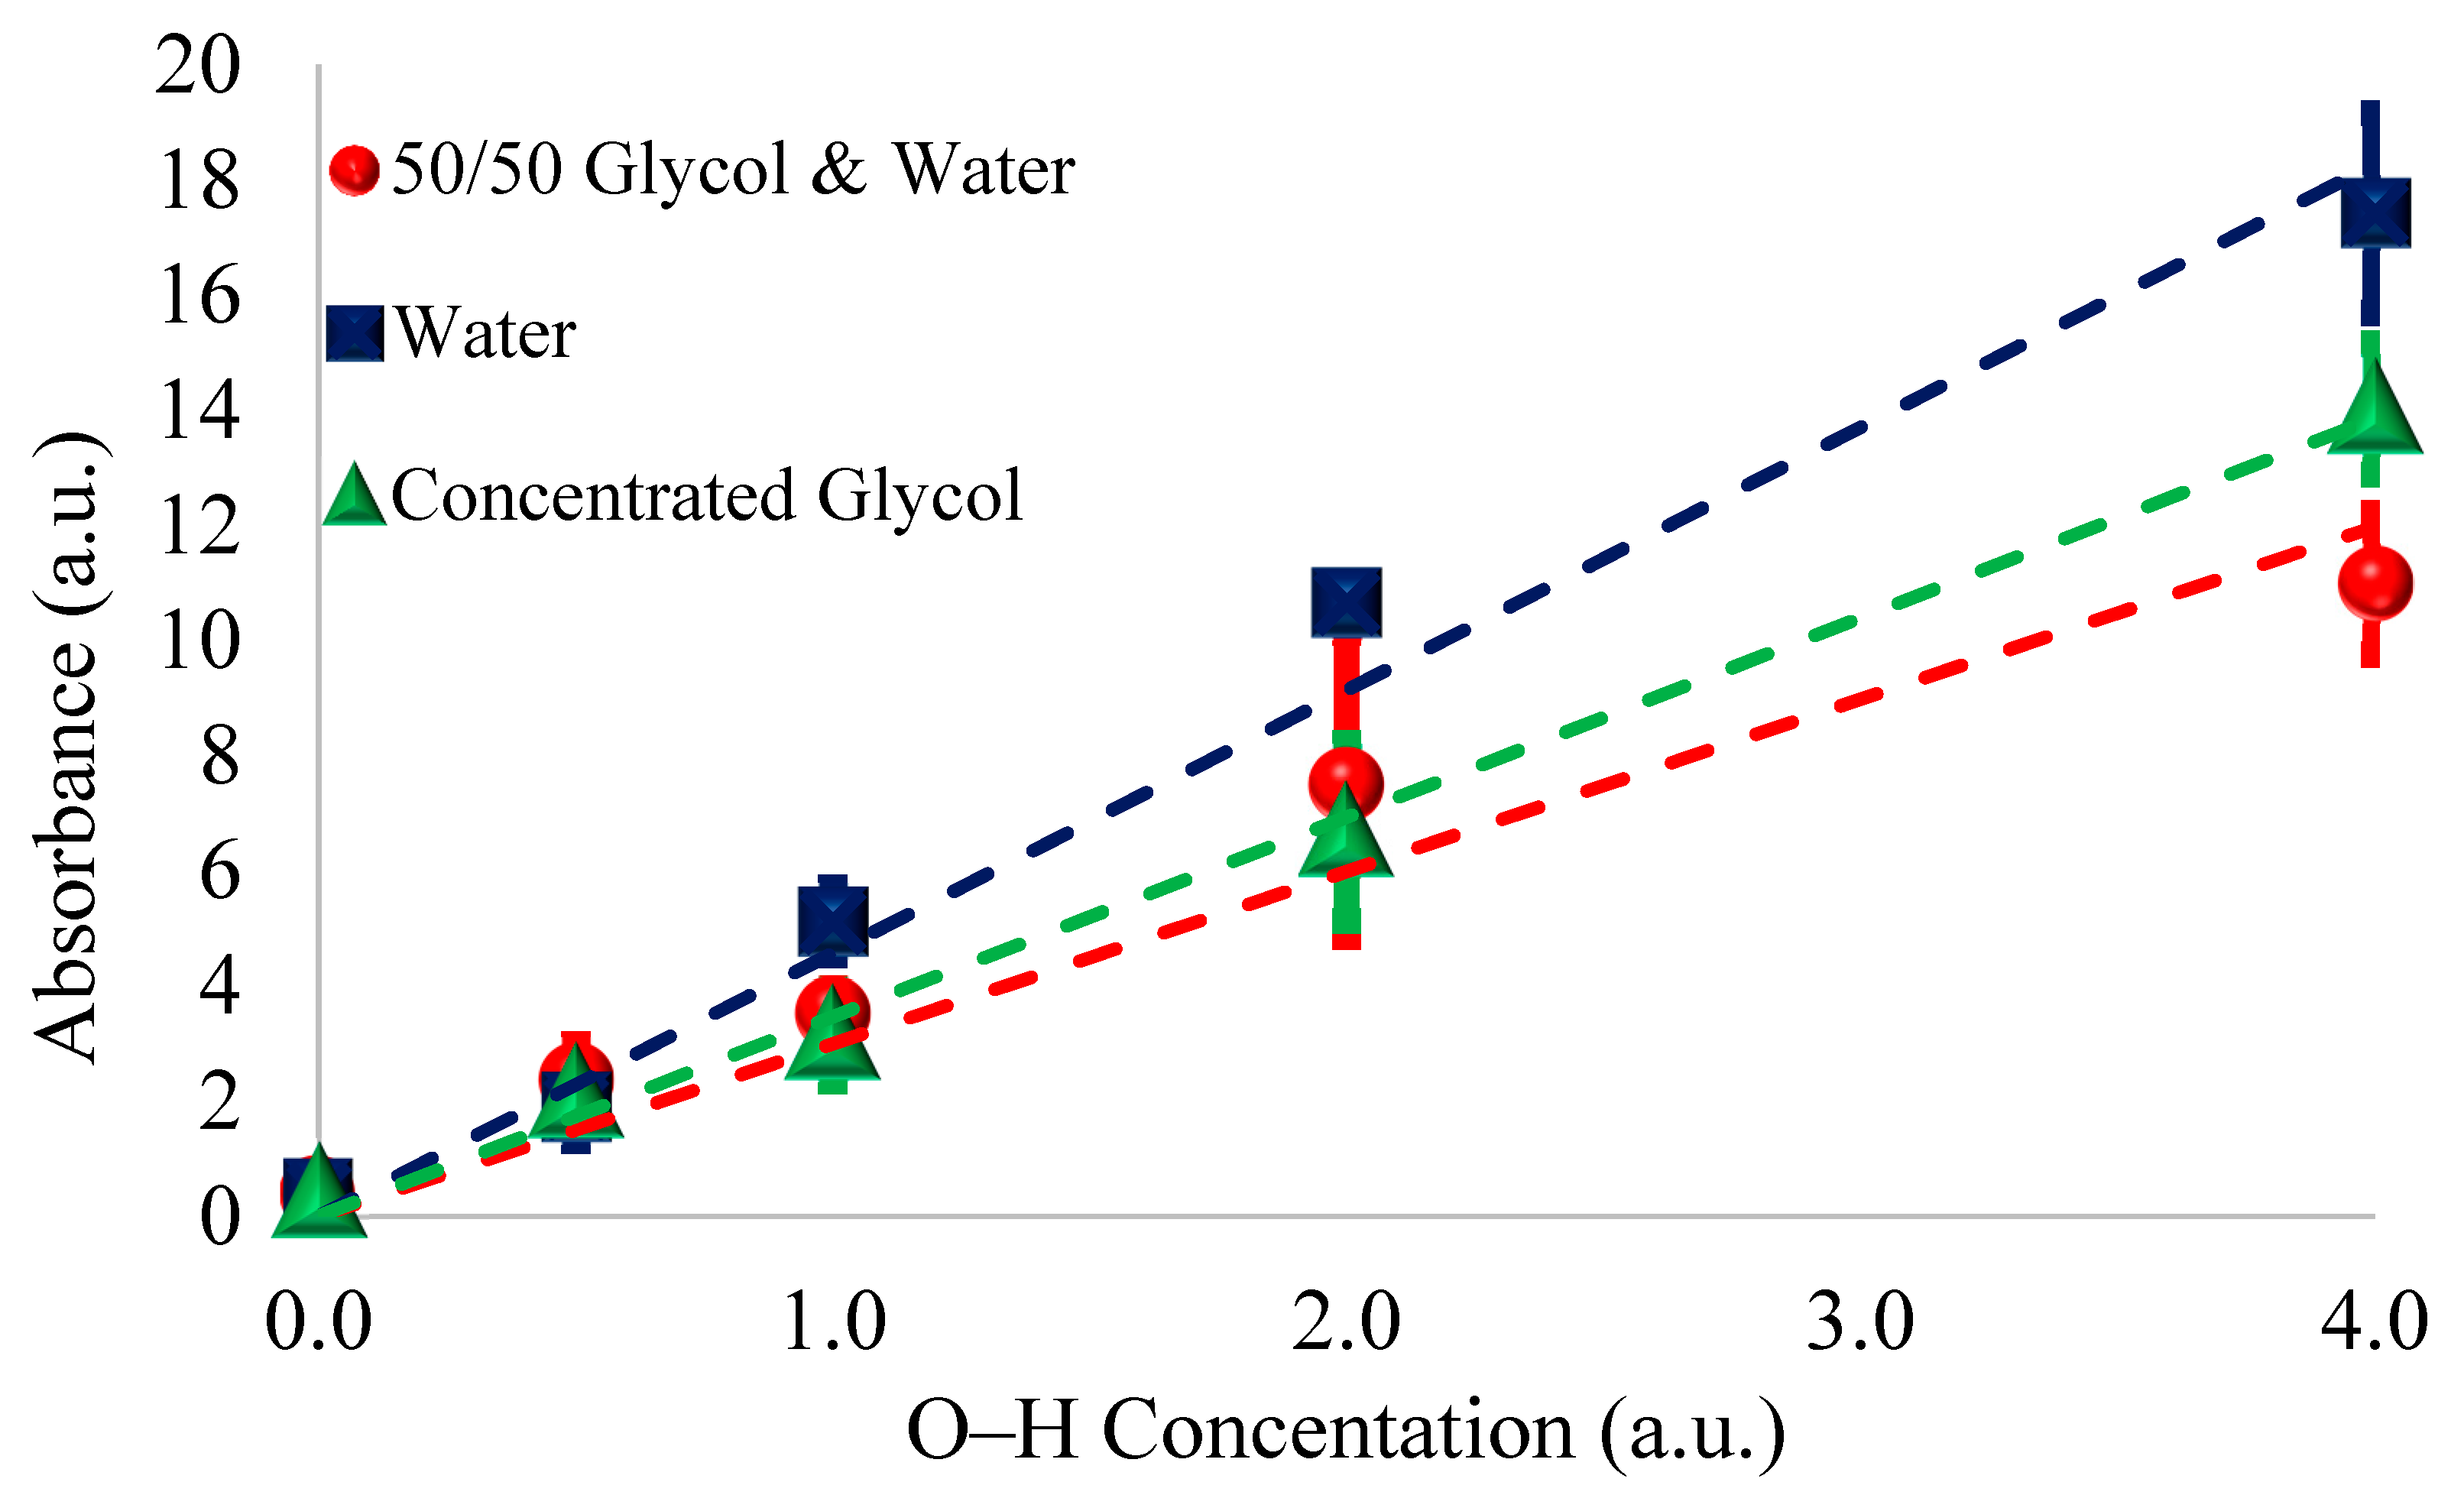
| Water | 3 | 0.39452 a | 0.0 | 1.9365 a | 0.161 | 5.1416 a | 0.322 | 10.684 a | 0.645 | 17.446 a | 1.289 | 28.897 a | 2.646 |
| Glycol/Water | 3 | 0.39452 a | 0.0 | 2.3748 a | 0.244 | 3.5487 b | 0.487 | 7.497 ab | 0.975 | 11.055 b | 1.95 | 21.135 b | 4.0 |
| Glycol | 3 | 0.39452 a | 0.0 | 2.3758 a | 0.5 | 3.4007 b | 1.0 | 6.434 b | 2.0 | 13.623 b | 4.0 | 24.527 ab | 8.21 |
Publisher’s Note: MDPI stays neutral with regard to jurisdictional claims in published maps and institutional affiliations. |
© 2022 by the authors. Licensee MDPI, Basel, Switzerland. This article is an open access article distributed under the terms and conditions of the Creative Commons Attribution (CC BY) license (https://creativecommons.org/licenses/by/4.0/).
Share and Cite
Holland, T.; Karunanithy, R.; Mandrell, C.; Abdul-Munaim, A.M.; Watson, D.G.; Sivakumar, P. Observation of a Signal Suppressing Effect in a Binary Mixture of Glycol-Water Contamination in Engine Oil with Fourier-Transform Infrared Spectroscopy. Standards 2022, 2, 474-483. https://doi.org/10.3390/standards2040032
Holland T, Karunanithy R, Mandrell C, Abdul-Munaim AM, Watson DG, Sivakumar P. Observation of a Signal Suppressing Effect in a Binary Mixture of Glycol-Water Contamination in Engine Oil with Fourier-Transform Infrared Spectroscopy. Standards. 2022; 2(4):474-483. https://doi.org/10.3390/standards2040032
Chicago/Turabian StyleHolland, Torrey, Robinson Karunanithy, Christopher Mandrell, Ali Mazin Abdul-Munaim, Dennis G. Watson, and Poopalasingam Sivakumar. 2022. "Observation of a Signal Suppressing Effect in a Binary Mixture of Glycol-Water Contamination in Engine Oil with Fourier-Transform Infrared Spectroscopy" Standards 2, no. 4: 474-483. https://doi.org/10.3390/standards2040032