
Bioaccumulation of Lead, Cadmium, and Arsenic in a Mining Area and Its Associated Health Effects
 ,
,
Abstract
:
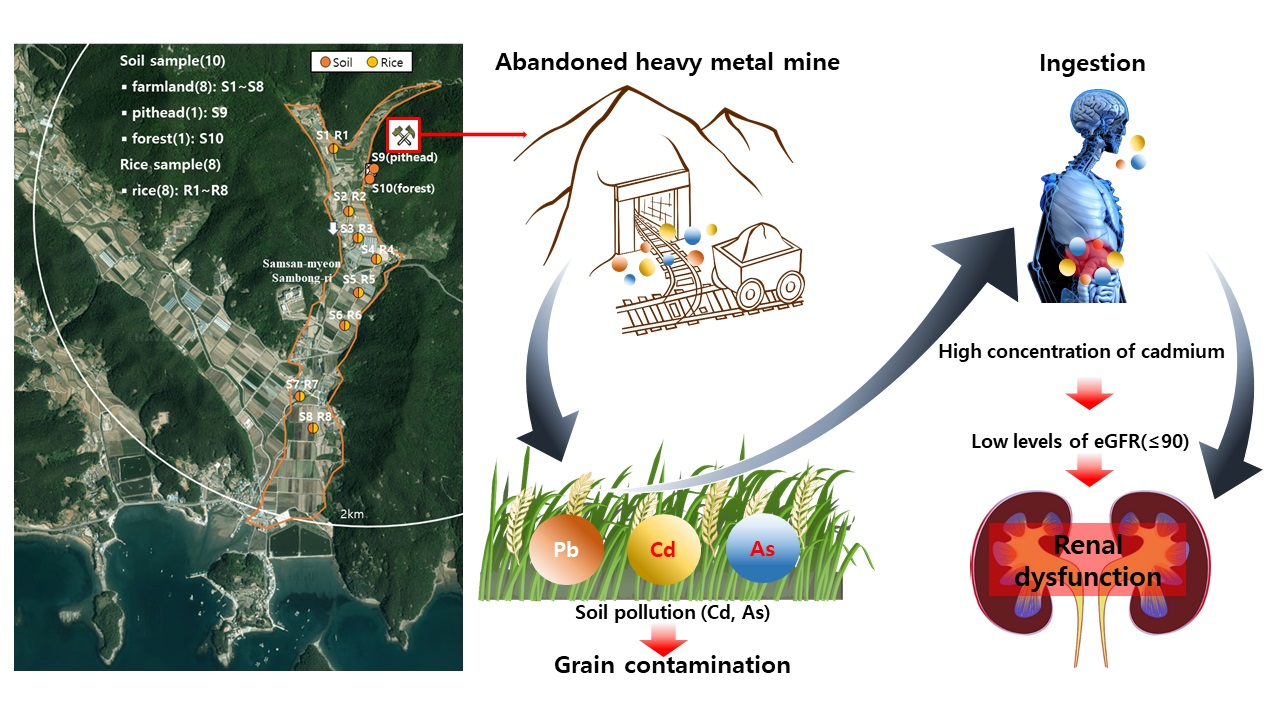
1. Introduction
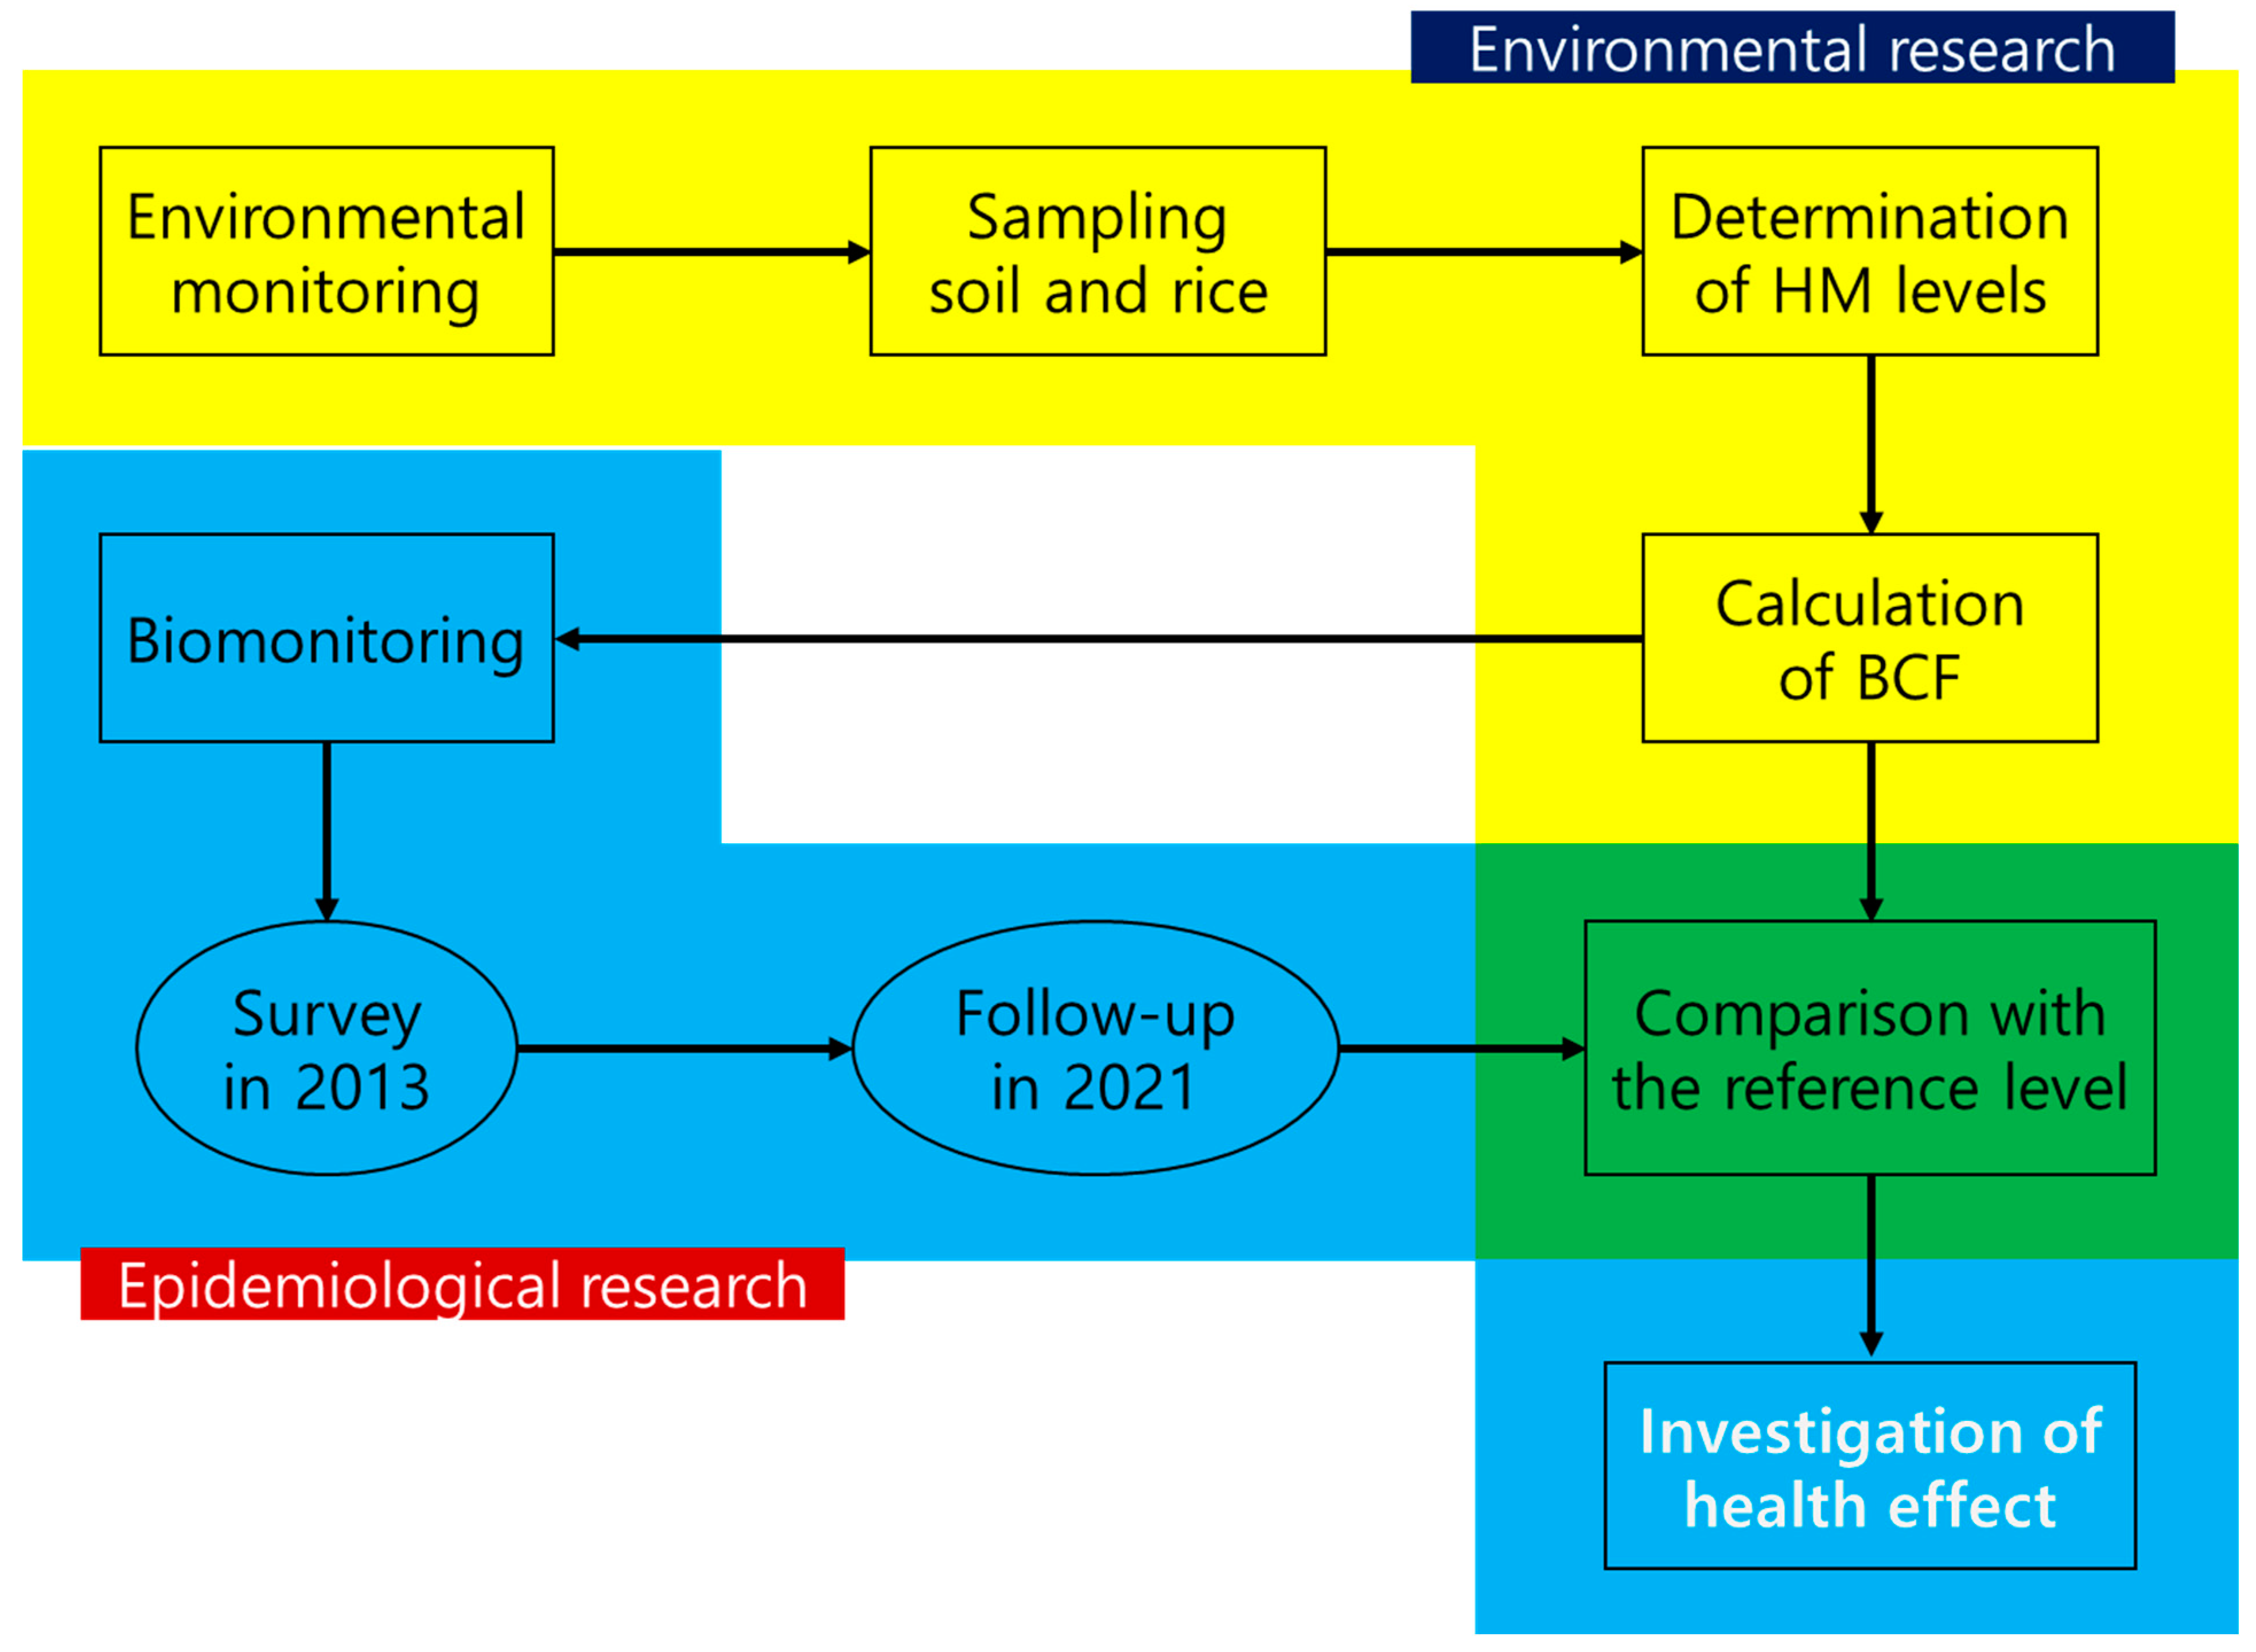
2. Materials and Methods
2.1. Participant Recruitment and Sample Collection
2.2. Sample Preparation and Instrumental Analysis
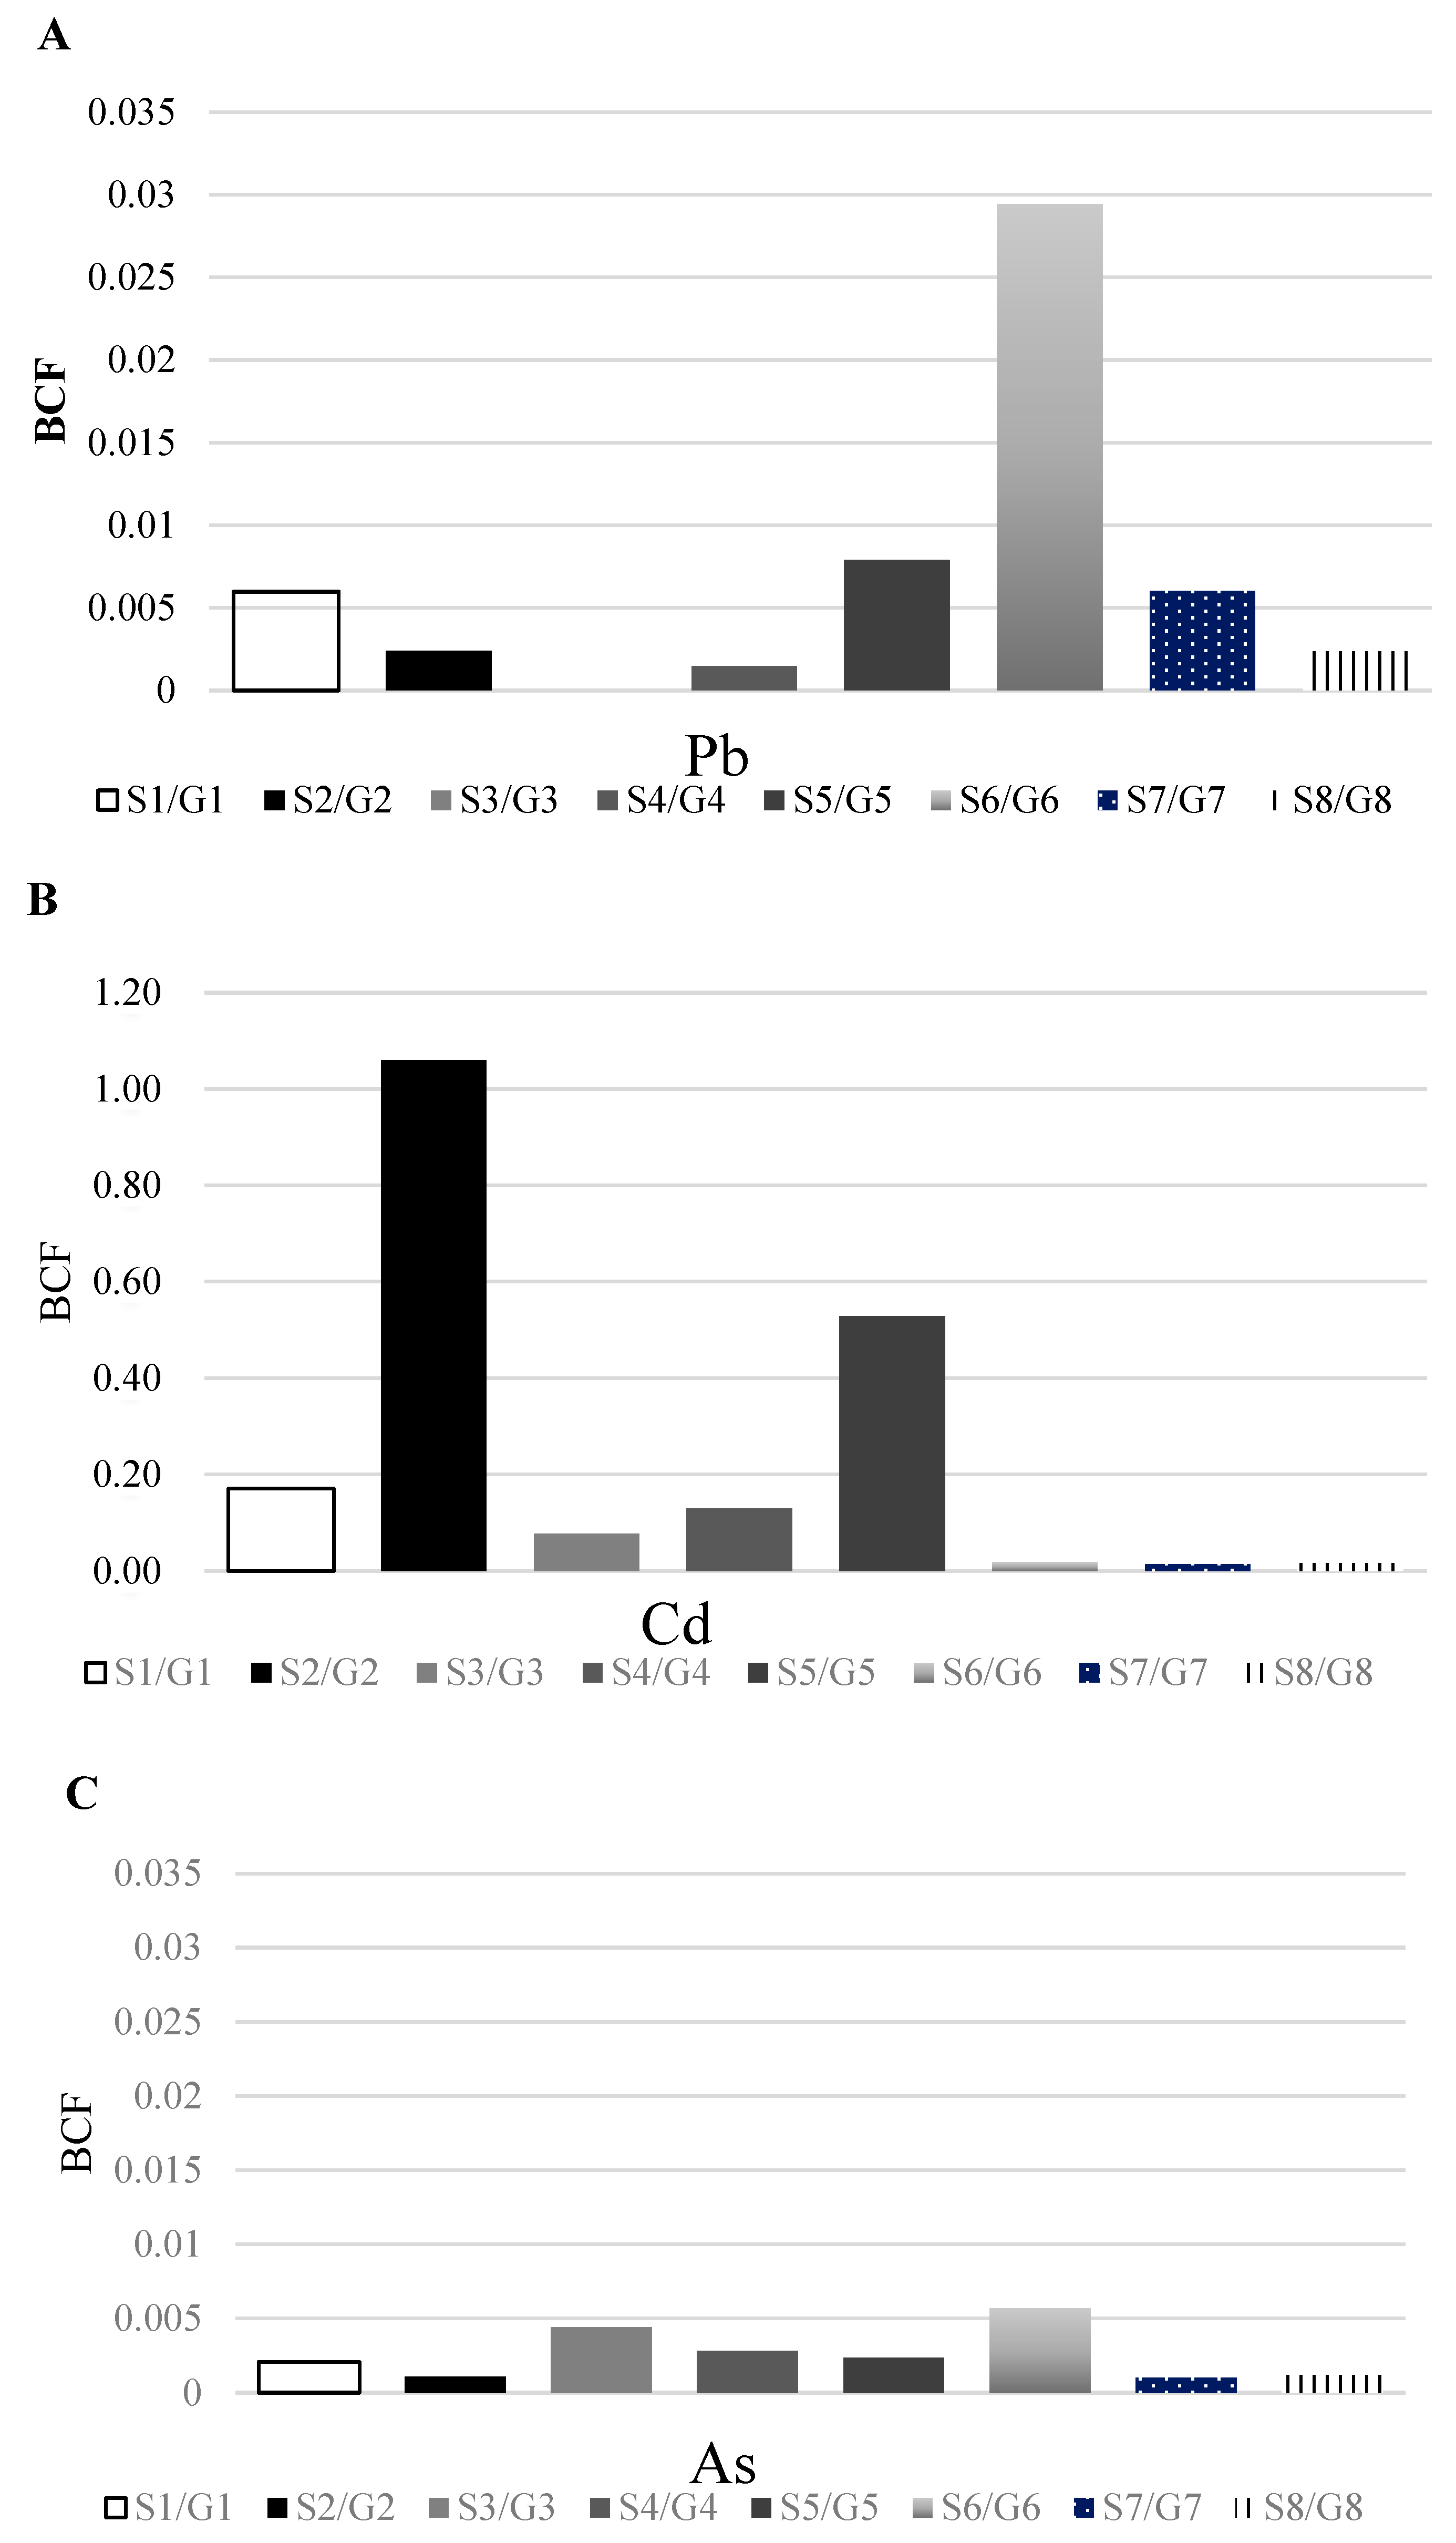
2.3. Bio-Concentration Factor
2.4. Calculation of Estimated Glomerular Filtration Rate
2.5. Statistical Analysis
3. Results
3.1. Heavy Metal Concentrations in Environmental Samples
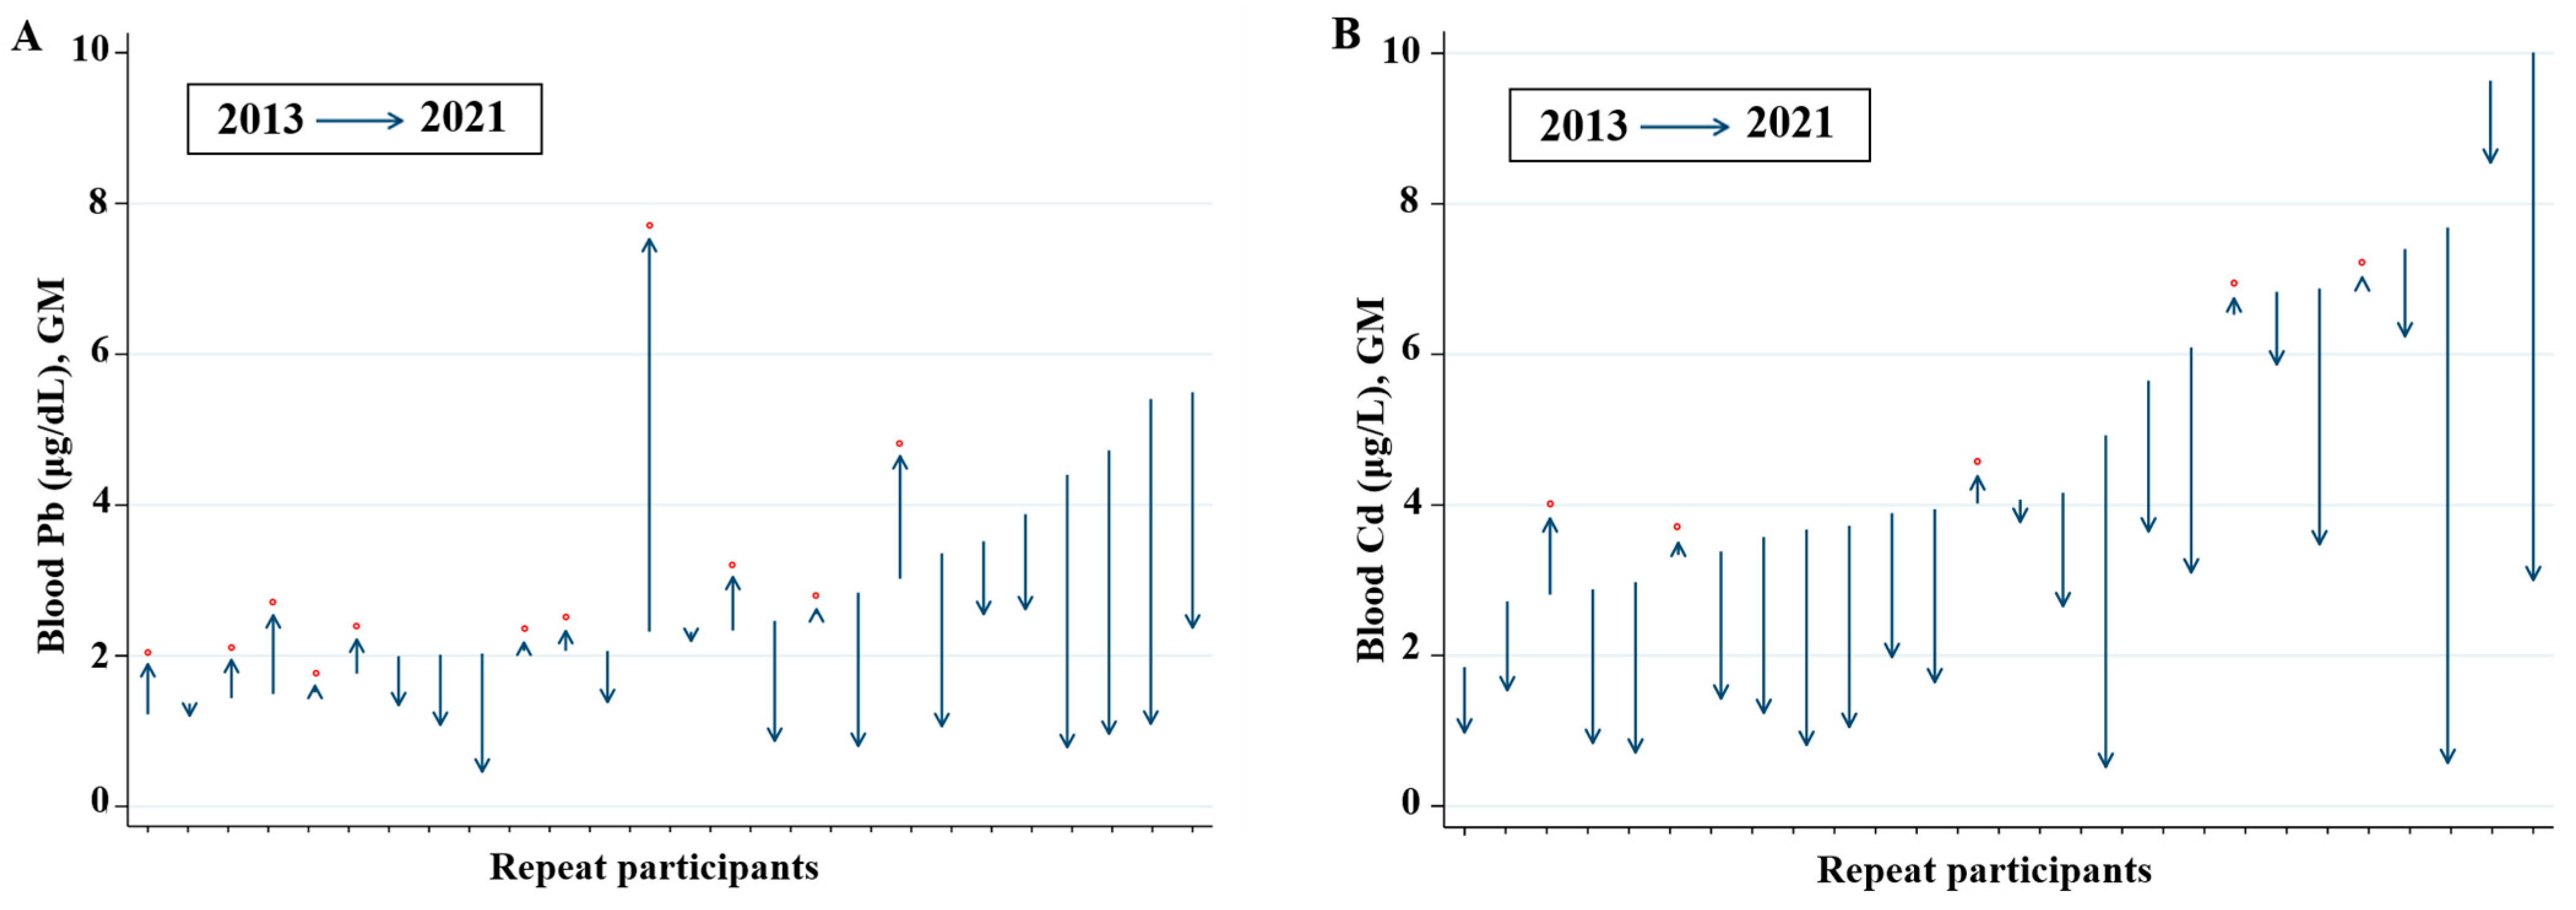
3.2. General Characteristics of the Study Participants and Concentrations of Heavy Metals in Biological Samples
3.3. Correlation between Cd Levels and Renal Function
4. Discussion
5. Conclusions
Supplementary Materials
Author Contributions
Funding
Institutional Review Board Statement
Informed Consent Statement
Data Availability Statement
Conflicts of Interest
Abbreviations
References
- Chowdhury, R.; Ramond, A.; O’keeffe, L.M.; Shahzad, S.; Kunutsor, S.K.; Muka, T.; Gregson, J.; Willeit, P.; Warnakula, S.; Khan, H.; et al. Environmental toxic metal contaminants and risk of cardiovascular disease: Systematic review and meta-analysis. BMJ 2018, 362, k3310. [Google Scholar] [CrossRef] [Green Version]
- Navas-Acien, A.; Tellez-Plaza, M.; Guallar, E.; Muntner, P.; Silbergeld, E.; Jaar, B.; Weaver, V. Blood Cadmium and Lead and Chronic Kidney Disease in US Adults: A Joint Analysis. Am. J. Epidemiol. 2009, 170, 1156–1164. [Google Scholar] [CrossRef] [PubMed] [Green Version]
- Yuan, Y.; Marshall, G.; Ferreccio, C.; Steinmaus, C.; Selvin, S.; Liaw, J.; Bates, M.N.; Smith, A.H. Acute Myocardial Infarction Mortality in Comparison with Lung and Bladder Cancer Mortality in Arsenic-exposed Region II of Chile from 1950 to 2000. Am. J. Epidemiol. 2007, 166, 1381–1391. [Google Scholar] [CrossRef] [PubMed] [Green Version]
- International Agency for Research on Cancer (IARC). IARC Monographs on the Evaluation of Carcinogenic Risks of Humans 2014. 2014. Available online: https://monographs.iarc.who.int/agents-classified-by-the-iarc/ (accessed on 10 February 2022).
- Moon, J.-Y.; Eom, S.-Y.; Seo, J.-W.; Lee, J.-E.; Choi, B.-S.; Kim, H.; Hong, Y.-S.; Chang, J.Y.; Jeon, M.-J.; Park, W.-J.; et al. Effects of Exposure to Lead and Cadmium on Health of Inhabitants of Abandoned Metal Mine Area in Korea. Arch. Environ. Contam. Toxicol. 2021, 80, 490–498. [Google Scholar] [CrossRef] [PubMed]
- Agency for Toxic Substances and Disease Registry. Toxicology Profile for Lead; U.S. Department of Health and Human Services; Agency for Toxic Substances and Disease Registry Press: Atlanta, GA, USA, 2020.
- Agency for Toxic Substances and Disease Registry. Toxicology Profile for Cadmium; Division of Toxicology and Human Health Sciences; Agency for Toxic Substances and Disease Registry Press: Atlanta, GA, USA, 2012.
- Agency for Toxic Substances and Disease Registry. Addendum to the Toxicology Profile for Arsenic; U.S. Division of Toxicology and Human Health Sciences; Agency for Toxic Substances and Disease Registry Press: Atlanta, GA, USA, 2016.
- Centers for Disease Control and Prevention. Fourth National Report on Human Exposure to Environmental Chemicals Updated Tables; Department of Health and Human Services: Atlanta, GA, USA, 2019; Volume 1.
- CHMS. Sixth Report on Human Biomonitoring of Environmental Chemicals in Canada. Results of the Canadian Health Measures Survey Cycle 6 (2018–2019); Minister of Health: Ottawa, ON, Canada, 2021. [Google Scholar]
- MOE. Ministry of Environment, 2020 White Paper Environment, 615–618; MOE: Sejong-si, Republic of Korea, 2021.
- Chang, I.W.; Park, C.B.; Choi, B.S.; Park, J.D.; Hong, Y.P. A Study of Exposure to Metals in Inhabitants Near a Closed-Mine in Kwangmyung; Chung-Ang University, College of Medicine: Seoul, Republic of Korea, 1995. [Google Scholar]
- Yoo, S.H.; Ro, K.J.; Lee, S.M.; Park, M.E.; Kim, K.H. Distribution of cadmium, copper, lead, and zinc in paddy soils around an old zinc mine. Korean J. Soil. Sci. Fert. 1996, 29, 424–431. [Google Scholar]
- Ji, K.; Kim, J.; Lee, M.; Park, S.; Kwon, H.-J.; Cheong, H.-K.; Jang, J.-Y.; Kim, D.-S.; Yu, S.; Kim, Y.-W.; et al. Assessment of exposure to heavy metals and health risks among residents near abandoned metal mines in Goseong, Korea. Environ. Pollut. 2013, 178, 322–328. [Google Scholar] [CrossRef]
- Cha, S.; Oh, E.; Oh, S.; Han, S.B.; Im, H. Development and verification of a simultaneous analytical method for whole blood metals and metalloids for biomonitoring programs. J. Environ. Health Sci. 2021, 47, 64–77. [Google Scholar] [CrossRef]
- Zeng, F.; Ali, S.; Zhang, H.; Ouyang, Y.; Qiu, B.; Wu, F.; Zhang, G. The influence of pH and organic matter content in paddy soil on heavy metal availability and their uptake by rice plants. Environ. Pollut. 2011, 159, 84–91. [Google Scholar] [CrossRef]
- NKF. National Kidney Foundation. 2022. Available online: https://www.kidney.org/professionals/kdoqi/gfr_calculator (accessed on 4 February 2022).
- Eknoyan, G.; Lameire, N.; Eckardt, K.; Kasiske, B.; Wheeler, D.; Levin, A.; Stevens, P.E.; Bilous, R.W.; Lamb, E.J.; Coresh, J.J. Kidney Disease Improving Global Outcomes 2012 Clinical Practice Guideline for the Evaluation and Management of Chronic Kidney Disease. Kidney Int. 2013, 3, 5–14. [Google Scholar]
- MOE. Soil Environment Conservation Act in Korea; Ministry of Environment: Sejong-si, Republic of Korea, 2019.
- Ministry of Food and Drug Safety in Korea (KMFDS). Korean Food Standard Codex. 2015. Available online: http://foodsafetykorea.go.kr/portal/safefoodlife/food/foodRvlv/foodRvlv.do (accessed on 8 February 2022).
- MOE. Ministry of Environment, 2020 Soil Measurement Network and Soil Contamination Survey Results; Ministry of Environment: Sejong-si, Republic of Korea, 2020.
- Jang, B.-K.; Park, S.-I.; Kim, N.-S.; Jung, K.-S.; Lee, B.-K.; Lee, J.-W. Relationship between Heavy Metal Concentrations in the Soil with the Blood and Urine of Residents around Abandoned Metal Mines. Korean J. Environ. Health Sci. 2011, 37, 348–357. [Google Scholar] [CrossRef] [Green Version]
- Ahn, S.C.; Chang, J.Y.; Lee, J.S.; Yu, H.Y.; Jung, A.-R.; Kim, J.-Y.; Choi, J.-W.; Hong, Y.-S.; Yu, S.D.; Choi, K. Exposure factors of cadmium for residents in an abandoned metal mine area in Korea. Environ. Geochem. Health 2017, 39, 1059–1070. [Google Scholar] [CrossRef] [PubMed] [Green Version]
- Zhuang, P.; McBride, M.B.; Xia, H.; Li, N.; Li, Z. Health risk from heavy metals via consumption of food crops in the vicinity of Dabaoshan mine, South China. Sci. Total. Environ. 2009, 407, 1551–1561. [Google Scholar] [CrossRef] [PubMed]
- United States Environmental Protection Agency. Soil Screening Guidance: Technical Background Document; Office of Solid Waste and Emergency Response: Washington, DC, USA, 1996; pp. 346–348.
- Kim, J.-Y.; Lee, J.-H.; Kunhikrishnan, A.; Kang, D.-W.; Kim, M.-J.; Yoo, J.-H.; Kim, D.H.; Lee, Y.-J.; Kim, W.I. Transfer Factor of Heavy Metals from Agricultural Soil to Agricultural Products. Korean J. Environ. Agric. 2012, 31, 300–307. [Google Scholar] [CrossRef] [Green Version]
- Lim, G.-H.; Kim, K.-H.; Seo, B.-H.; Kim, K.-R. Heavy Metal Accumulation in Edible Part of Eleven Crops Cultivated in Metal Contaminated Soils and Their Bio-concentration Factor. Korean J. Environ. Agric. 2015, 34, 260–267. [Google Scholar] [CrossRef] [Green Version]
- Lim, G.-H.; Kim, K.-H.; Seo, B.-H.; Kim, K.-R. Distribution of Phytoavailable Heavy Metals in the Korean Agricultural Soils Affected by the Abandoned Mining Sites and Soil Properties Influencing on the Phytoavailable Metal Pools. Korean J. Soil Sci. Fertil. 2014, 47, 191–198. [Google Scholar] [CrossRef] [Green Version]
- Kim, S.; Kwon, H.-J.; Cheong, H.-K.; Choi, K.; Jang, J.-Y.; Jeong, W.-C.; Kim, D.-S.; Yu, S.; Kim, Y.-W.; Lee, K.-Y.; et al. Investigation on Health Effects of an Abandoned Metal Mine. J. Korean Med. Sci. 2008, 23, 452–458. [Google Scholar] [CrossRef] [Green Version]
- Chung, J.H.; Kang, P.S.; Kim, C.Y.; Lee, K.S.; Hwang, T.Y.; Kim, G.T.; Park, J.S.; Park, S.Y.; Kim, D.S.; Lim, O.T.; et al. Blood Pb, Urine Cd and Health Assessment of Residents in the Vicinity of Abandoned Mines in Gyeongsangbuk-do. Korean J. Occup. Environ. Med. 2005, 17, 225–237. [Google Scholar] [CrossRef]
- Kjellström, T.; Nordberg, G.F. A kinetic model of cadmium metabolism in the human being. Environ. Res. 1978, 16, 248–269. [Google Scholar] [CrossRef]
- Nordberg, G.F.; Goyer, R.A.; Clarkson, T.W. Impact of effects of acid precipitation on toxicity of metals. Environ. Health Perspect. 1985, 63, 169–180. [Google Scholar] [CrossRef]
- Agency for Toxic Substances and Disease Registry. Case Studies in Environmental Medicine (CSEM). In Cadmium Toxicity; Division of Toxicology and Human Health Sciences: Atlanta, GA, USA, 2008. [Google Scholar]
- Butler-Dawson, J.; James, K.A.; Krisher, L.; Jaramillo, D.; Dally, M.; Neumann, N.; Pilloni, D.; Cruz, A.; Asensio, C.; Johnson, R.J.; et al. Environmental metal exposures and kidney function of Guatemalan sugarcane workers. J. Expo. Sci. Environ. Epidemiol. 2021, 32, 461–471. [Google Scholar] [CrossRef]
- Åkesson, A.; Lundh, T.; Vahter, M.; Bjellerup, P.; Lidfeldt, J.; Nerbrand, C.; Samsioe, G.; Strömberg, U.; Skerfving, S. Tubular and Glomerular Kidney Effects in Swedish Women with Low Environmental Cadmium Exposure. Environ. Health Perspect. 2005, 113, 1627–1631. [Google Scholar] [CrossRef] [PubMed] [Green Version]
- Wu, X.; Liang, Y.; Jin, T.; Ye, T.; Kong, Q.; Wang, Z.; Lei, L.; Bergdahl, I.A.; Nordberg, G.F. Renal effects evolution in a Chinese population after reduction of cadmium exposure in rice. Environ. Res. 2008, 108, 233–238. [Google Scholar] [CrossRef]
- Liang, Y.; Lei, L.; Nilsson, J.; Li, H.; Nordberg, M.; Bernard, A.; Nordberg, G.F.; Bergdahl, I.A.; Jin, T. Renal Function after Reduction in Cadmium Exposure: An 8-Year Follow-up of Residents in Cadmium-Polluted Areas. Environ. Health Perspect. 2012, 120, 223–228. [Google Scholar] [CrossRef] [PubMed] [Green Version]
- Lee, E.Y.; Shin, H.; Jung, Y.; Chun, B.; Rim, H. A case of rapidly progressive renal failure induced by cadmium intoxication. Korean J. Med. 2010, 78, 761–765. [Google Scholar]
- Wu, M.-S.; Hong, J.-J.; Lin, J.-L.; Yang, C.-W.; Chien, H.-C. Multiple tubular dysfunction induced by mixed Chinese herbal medicines containing cadmium. Nephrol. Dial. Transplant. 1996, 11, 867–870. [Google Scholar] [CrossRef]
- Lee, S.; Shin, M.; Hong, Y.-C.; Kim, J.H. Temporal variability of blood lead, mercury, and cadmium levels in elderly panel study (2008–2014). Int. J. Hyg. Environ. Health 2017, 220, 407–414. [Google Scholar] [CrossRef] [PubMed]
- Guo, W.; Zhang, Z.; Wang, H.; Qin, H.; Fu, Z. Exposure characteristics of antimony and coexisting arsenic from multi-path exposure in typical antimony mine area. J. Environ. Manag. 2021, 289, 112493. [Google Scholar] [CrossRef] [PubMed]
- Qu, C.-S.; Ma, Z.-W.; Yang, J.; Liu, Y.; Bi, J.; Huang, L. Human Exposure Pathways of Heavy Metals in a Lead-Zinc Mining Area, Jiangsu Province, China. PLoS ONE 2012, 7, e46793. [Google Scholar] [CrossRef] [Green Version]


| Sample | Pb | Criteria | Cd | Criteria | As | Criteria | ||||
|---|---|---|---|---|---|---|---|---|---|---|
| Soil | Rice * | Soil | Rice * | Soil | Rice * | |||||
| Farm land | S1/G1 | 25.04 | 0.15 | Concern: 200 Measured: 600 | 0.82 | 0.14 | Concern: 4 Measured: 12 | 19.25 | 0.04 | Concern: 25 Measured: 75 |
| S2/G2 | 16.61 | 0.04 | 1.50 | 1.59 | 27.66 | 0.03 | ||||
| S3/G3 | 14.40 | 0.00 | 1.80 | 0.14 | 27.16 | 0.12 | ||||
| S4/G4 | 13.50 | 0.02 | 1.16 | 0.15 | 35.14 | 0.10 | ||||
| S5/G5 | 12.64 | 0.10 | 1.55 | 0.82 | 38.18 | 0.09 | ||||
| S6/G6 | 14.27 | 0.42 | 1.11 | 0.02 | 24.62 | 0.14 | ||||
| S7/G7 | 14.97 | 0.09 | 0.71 | 0.01 | 9.77 | 0.01 | ||||
| S8/G8 | 12.66 | 0.03 | 0.62 | 0.01 | 8.38 | 0.01 | ||||
| Forest land | S9/- | 14.91 | Concern: 400 Measured: 1200 | 11.09 | Concern: 10 Measured: 30 | 182.23 | Concern: 50 Measured: 150 | |||
| S10/- | 18.24 | 1.23 | 63.47 | |||||||
| Total | Men | Women | p-Value ^ | ||
|---|---|---|---|---|---|
| Total * | 58 (100) | 19 (32.8) | 39 (67.2) | ||
| Age (years), AM ± SD | 69.4 ± 11.9 | 67.9 ± 10.2 | 70.1 ± 12.7 | 0.513 | |
| BMI (kg/m2), AM ± SD | 23.8 ± 3.9 | 23.7 ± 3.5 | 23.9 ± 4.1 | 0.810 | |
| Duration of residence (years), AM ± SD | 45.3 ± 20.0 | 49.4 ± 21.1 | 43.2 ± 19.4 | 0.272 | |
| Mining work experience * | 2 (3.5) | 1 (5.3) | 1 (2.6) | 0.279 | |
| Smoker (past and current) * | 12 (20.7) | 12 (63.2) | - | <0.001 | |
| Drinker (past and current) * | 28 (48.3) | 16 (84.2) | 12 (30.8) | <0.001 | |
| Local rice consumption >50% *† | 40 (69.0) | 15 (78.9) | 25 (64.1) | 0.251 | |
| Hypertension * | 25 (44.6) | 7 (38.9) | 18 (47.4) | 0.551 | |
| Diabetes * | 9 (15.5) | 4 (21.1) | 5 (12.8) | 0.416 | |
| Metal concentration, geometric mean (95% confidence interval) unit: μg/L | |||||
| Blood Pb (μg/dL) | 1.80 (1.54, 2.09) | 1.66 (1.25, 2.21) | 1.87 (1.55, 2.25) | 0.489 | |
| Blood Cd | 2.12 (1.73–2.59) | 1.21 (0.99–1.50) | 2.77 (2.17–3.54) | <0.001 | |
| Urinary Cd | 2.69 (2.23–3.25) | 2.02 (1.53–2.66) | 3.09 (2.43–3.93) | 0.022 | |
| Urinary inorganic arsenic (total As sum of As3+, As5+, MMA, and DMA) | 0.22 (0.14, 0.33) | 0.27 (0.11, 0.62) | 0.20 (0.12, 0.32) | 0.519 | |
| Urinary total As | 51.8 (42.4, 63.2) | 48.8 (36.3, 65.5) | 53.3 (40.8, 69.6) | 0.706 | |
| Factors | Estimated Glomerular Filtration Rate (mL/min/1.73 m²) | p-Value | ||
|---|---|---|---|---|
| <60 (n = 2) | 60–89 (n = 9) | ≥90 (n = 47) | ||
| Male * | - | 3 (33.3) | 16 (34.0) | 0.603 ^ |
| Female * | 2 (100) | 6 (66.7) | 31 (66.0) | |
| Age (years) † | 82 ± 5.7 | 78.8 ± 9.3 | 67.0 ± 11.4 | 0.004 |
| Residence (years) † | 68 ± 2.8 | 49.9 ± 21.7 | 43.4 ± 19.6 | 0.093 |
| Smoker (past and current) * | - | 2 (22.2) | 10 (21.3) | 0.762 ^ |
| Drinker (past and current) * | - | 6 (66.7) | 22 (46.8) | 0.209 ^ |
| Hypertension * | 1(50.0) | 5 (62.5) | 25 (54.4) | 0.902 ^ |
| Diabetes * | 2(100) | - | 7 (14.9) | 0.002 ^ |
| Blood Cd # | 7.74 (2.21, 27.09) | 2.15 (1.14, 4.07) | 1.99 (1.61, 2.48) | 0.076 |
| Urine Cd # | 3.66 (0.14, 93.53) | 3.88 (2.56, 5.89) | 2.48 (1.99, 3.07) | 0.253 |
Disclaimer/Publisher’s Note: The statements, opinions and data contained in all publications are solely those of the individual author(s) and contributor(s) and not of MDPI and/or the editor(s). MDPI and/or the editor(s) disclaim responsibility for any injury to people or property resulting from any ideas, methods, instructions or products referred to in the content. |
© 2023 by the authors. Licensee MDPI, Basel, Switzerland. This article is an open access article distributed under the terms and conditions of the Creative Commons Attribution (CC BY) license (https://creativecommons.org/licenses/by/4.0/).
Share and Cite
Surenbaatar, U.; Lee, S.; Kwon, J.-Y.; Lim, H.; Kim, J.-J.; Kim, Y.-H.; Hong, Y.-S. Bioaccumulation of Lead, Cadmium, and Arsenic in a Mining Area and Its Associated Health Effects. Toxics 2023, 11, 519. https://doi.org/10.3390/toxics11060519
Surenbaatar U, Lee S, Kwon J-Y, Lim H, Kim J-J, Kim Y-H, Hong Y-S. Bioaccumulation of Lead, Cadmium, and Arsenic in a Mining Area and Its Associated Health Effects. Toxics. 2023; 11(6):519. https://doi.org/10.3390/toxics11060519
Chicago/Turabian StyleSurenbaatar, Ulziikhishig, Seungho Lee, Jung-Yeon Kwon, Hyunju Lim, Jeong-Jin Kim, Young-Hun Kim, and Young-Seoub Hong. 2023. "Bioaccumulation of Lead, Cadmium, and Arsenic in a Mining Area and Its Associated Health Effects" Toxics 11, no. 6: 519. https://doi.org/10.3390/toxics11060519