
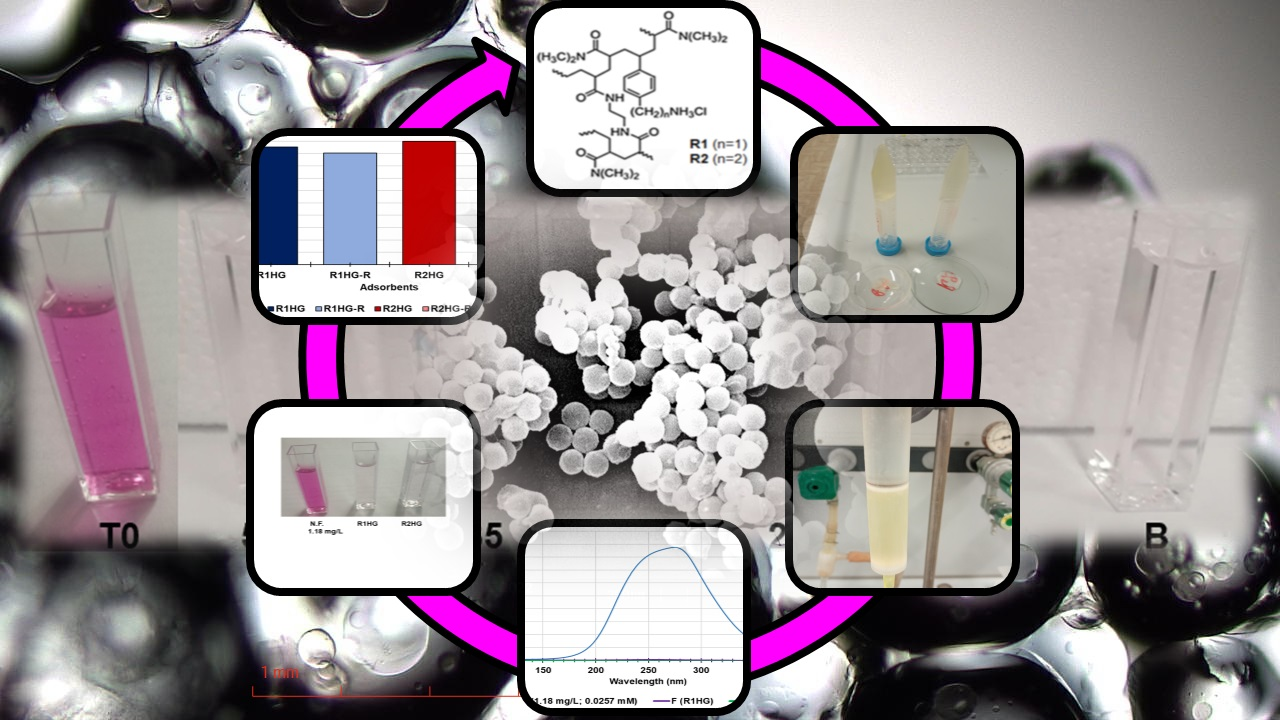
Cationic Polystyrene-Based Hydrogels: Low-Cost and Regenerable Adsorbents to Electrostatically Remove Nitrites from Water


Abstract
:
1. Introduction
1.1. Sources of Inorganic Nitrogen Pollutants
1.2. Toxicity of Nitrites and Nitrates
1.3. Nitrite: A Water Pollutant That Needs to Be More Carefully Pondered
2. Materials and Methods
2.1. Chemicals and Instruments
2.2. Adsorption of Nitrites with R1, R2, R1HG, and R2HG
2.2.1. Calibration Curves
2.2.2. Batch Experiments: Effect of Contact Time
2.2.3. Adsorption Experiments by Filtration
Regeneration of Adsorbents R1 and R2
3. Results and Discussion
3.1. Resins R1 and R2 and Related Hydrogels R1HG and R2HG
3.2. Removal of Nitrites from Water by R1HG and R2HG
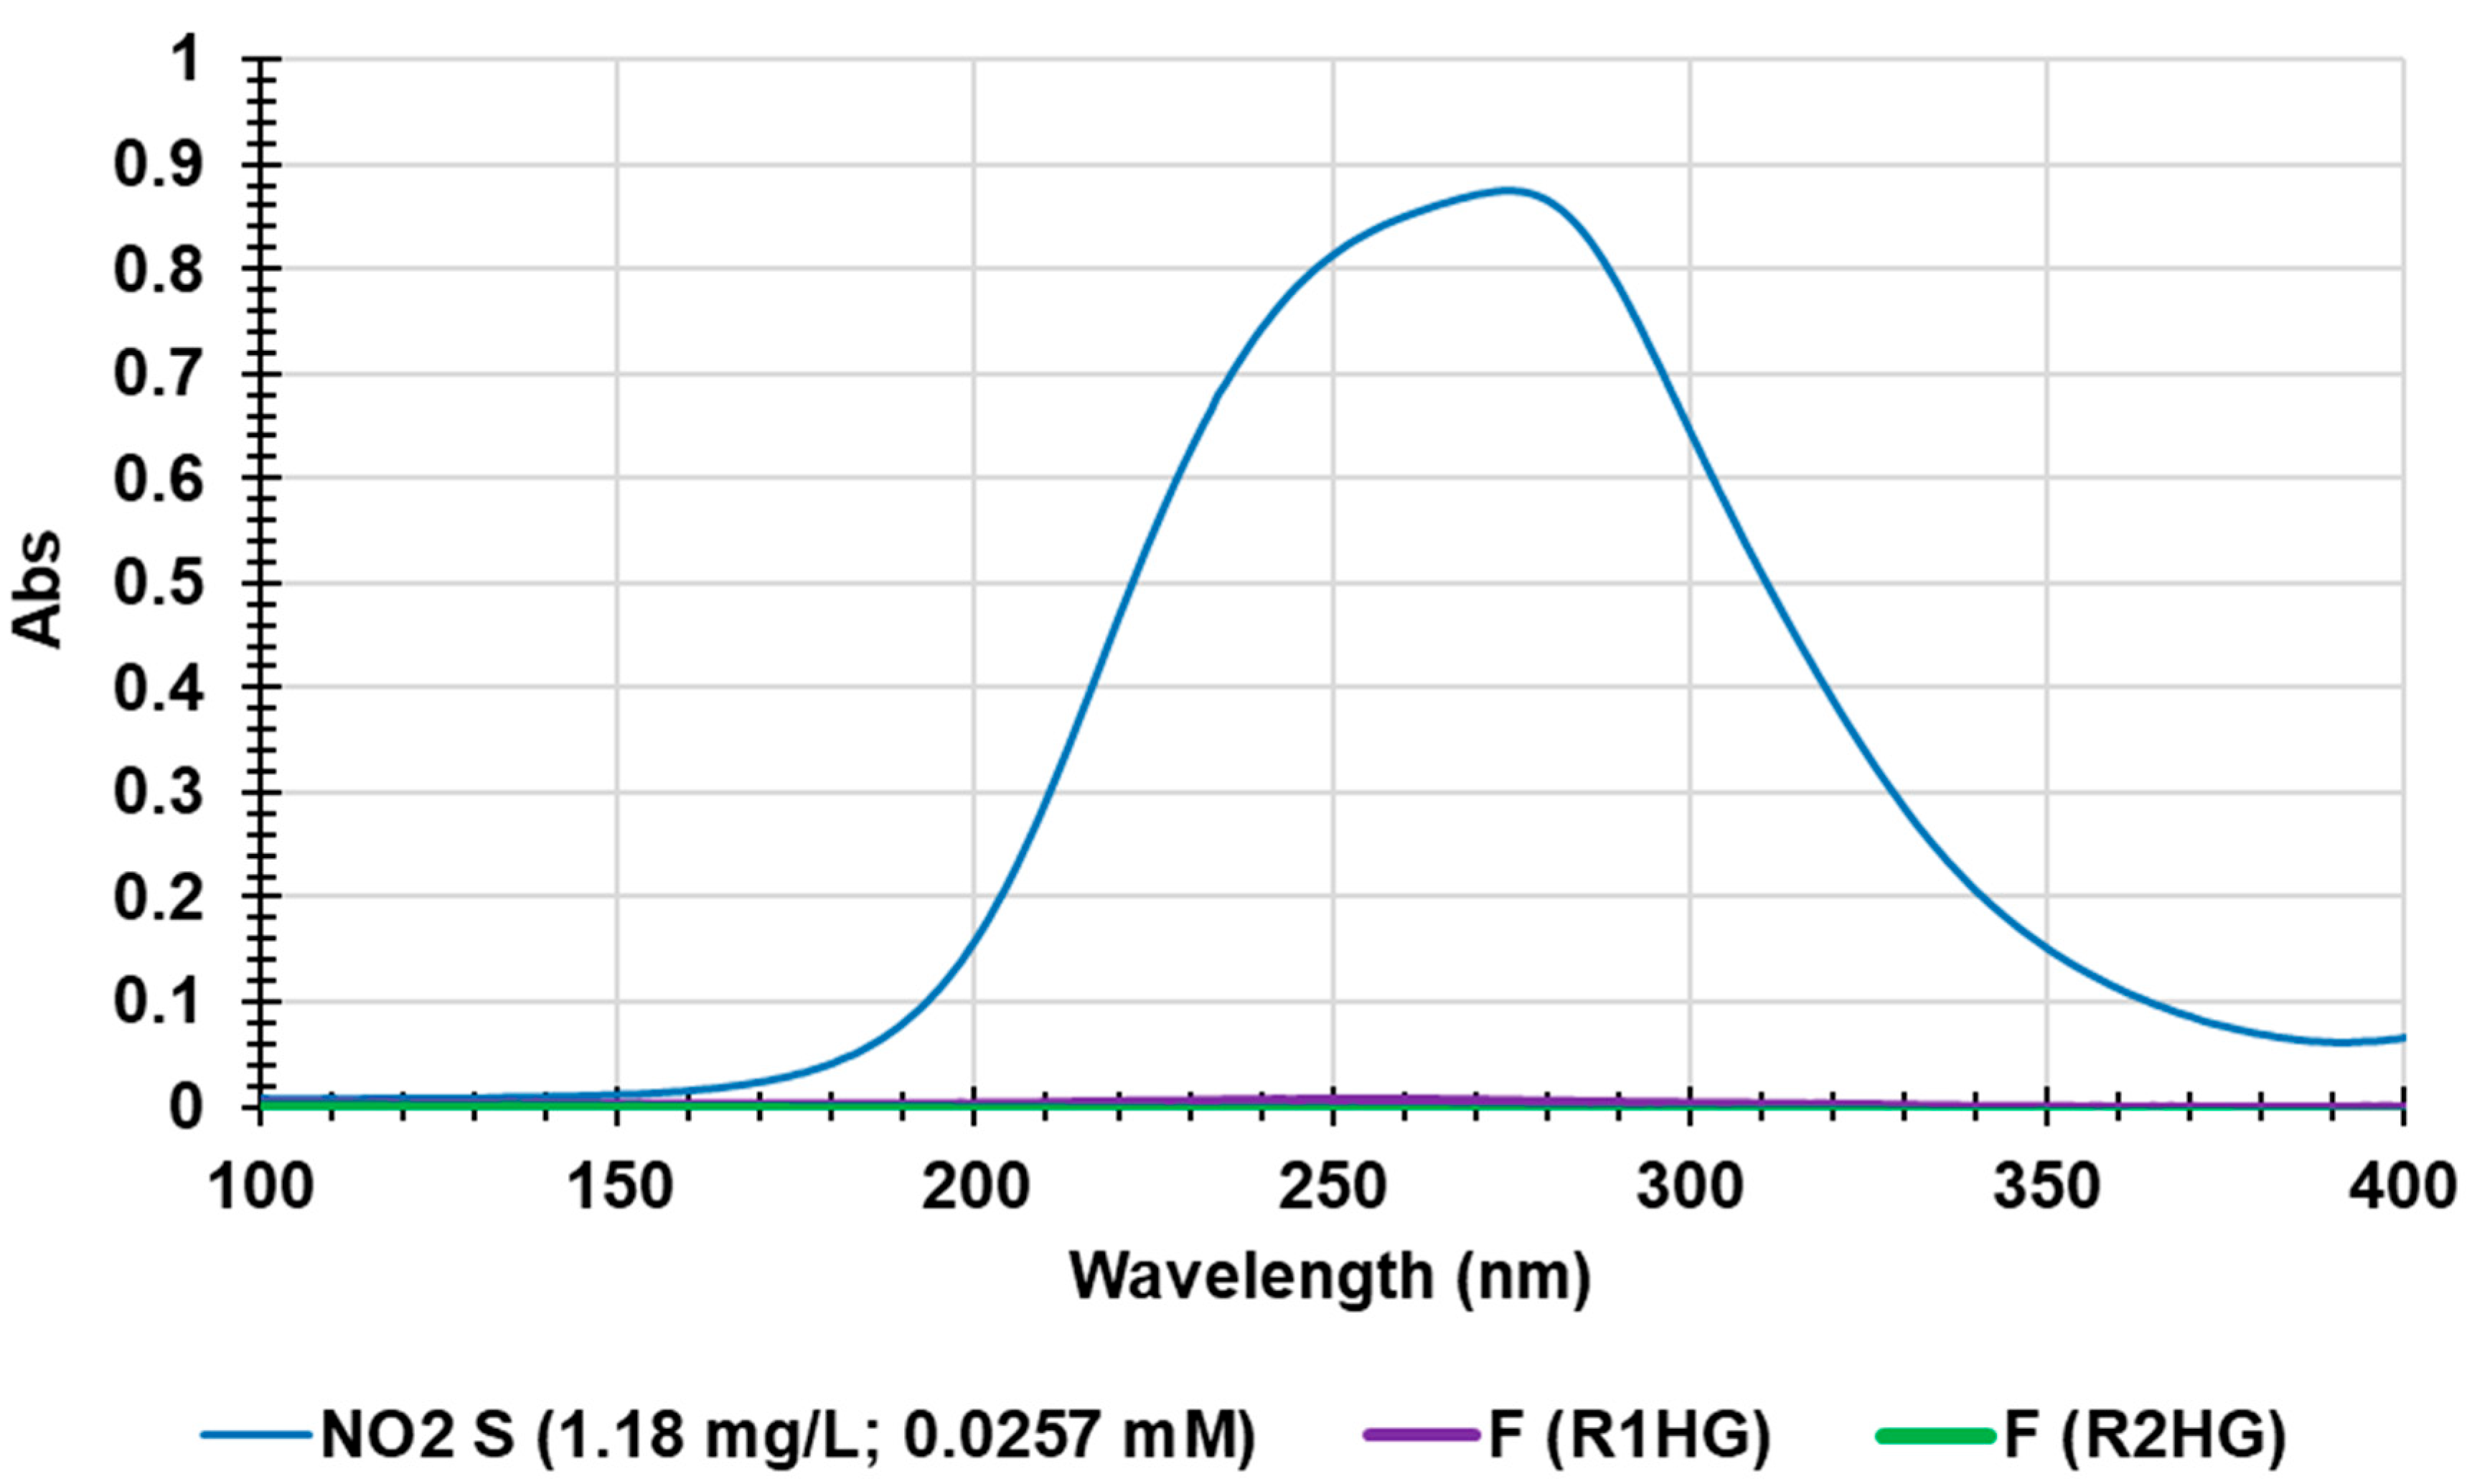
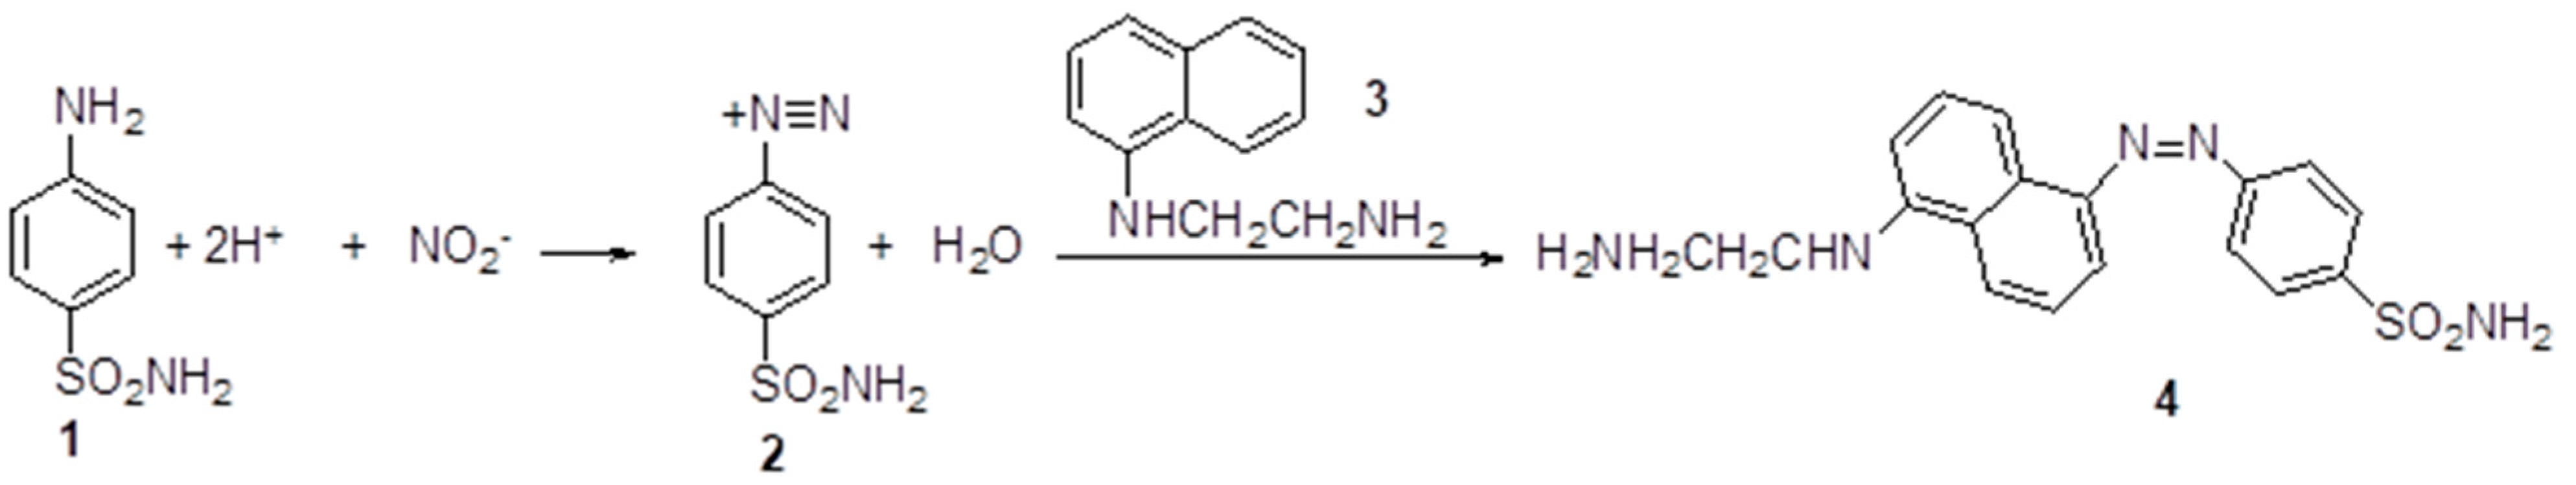
3.2.1. The Griess Reagent System (GRS) Method
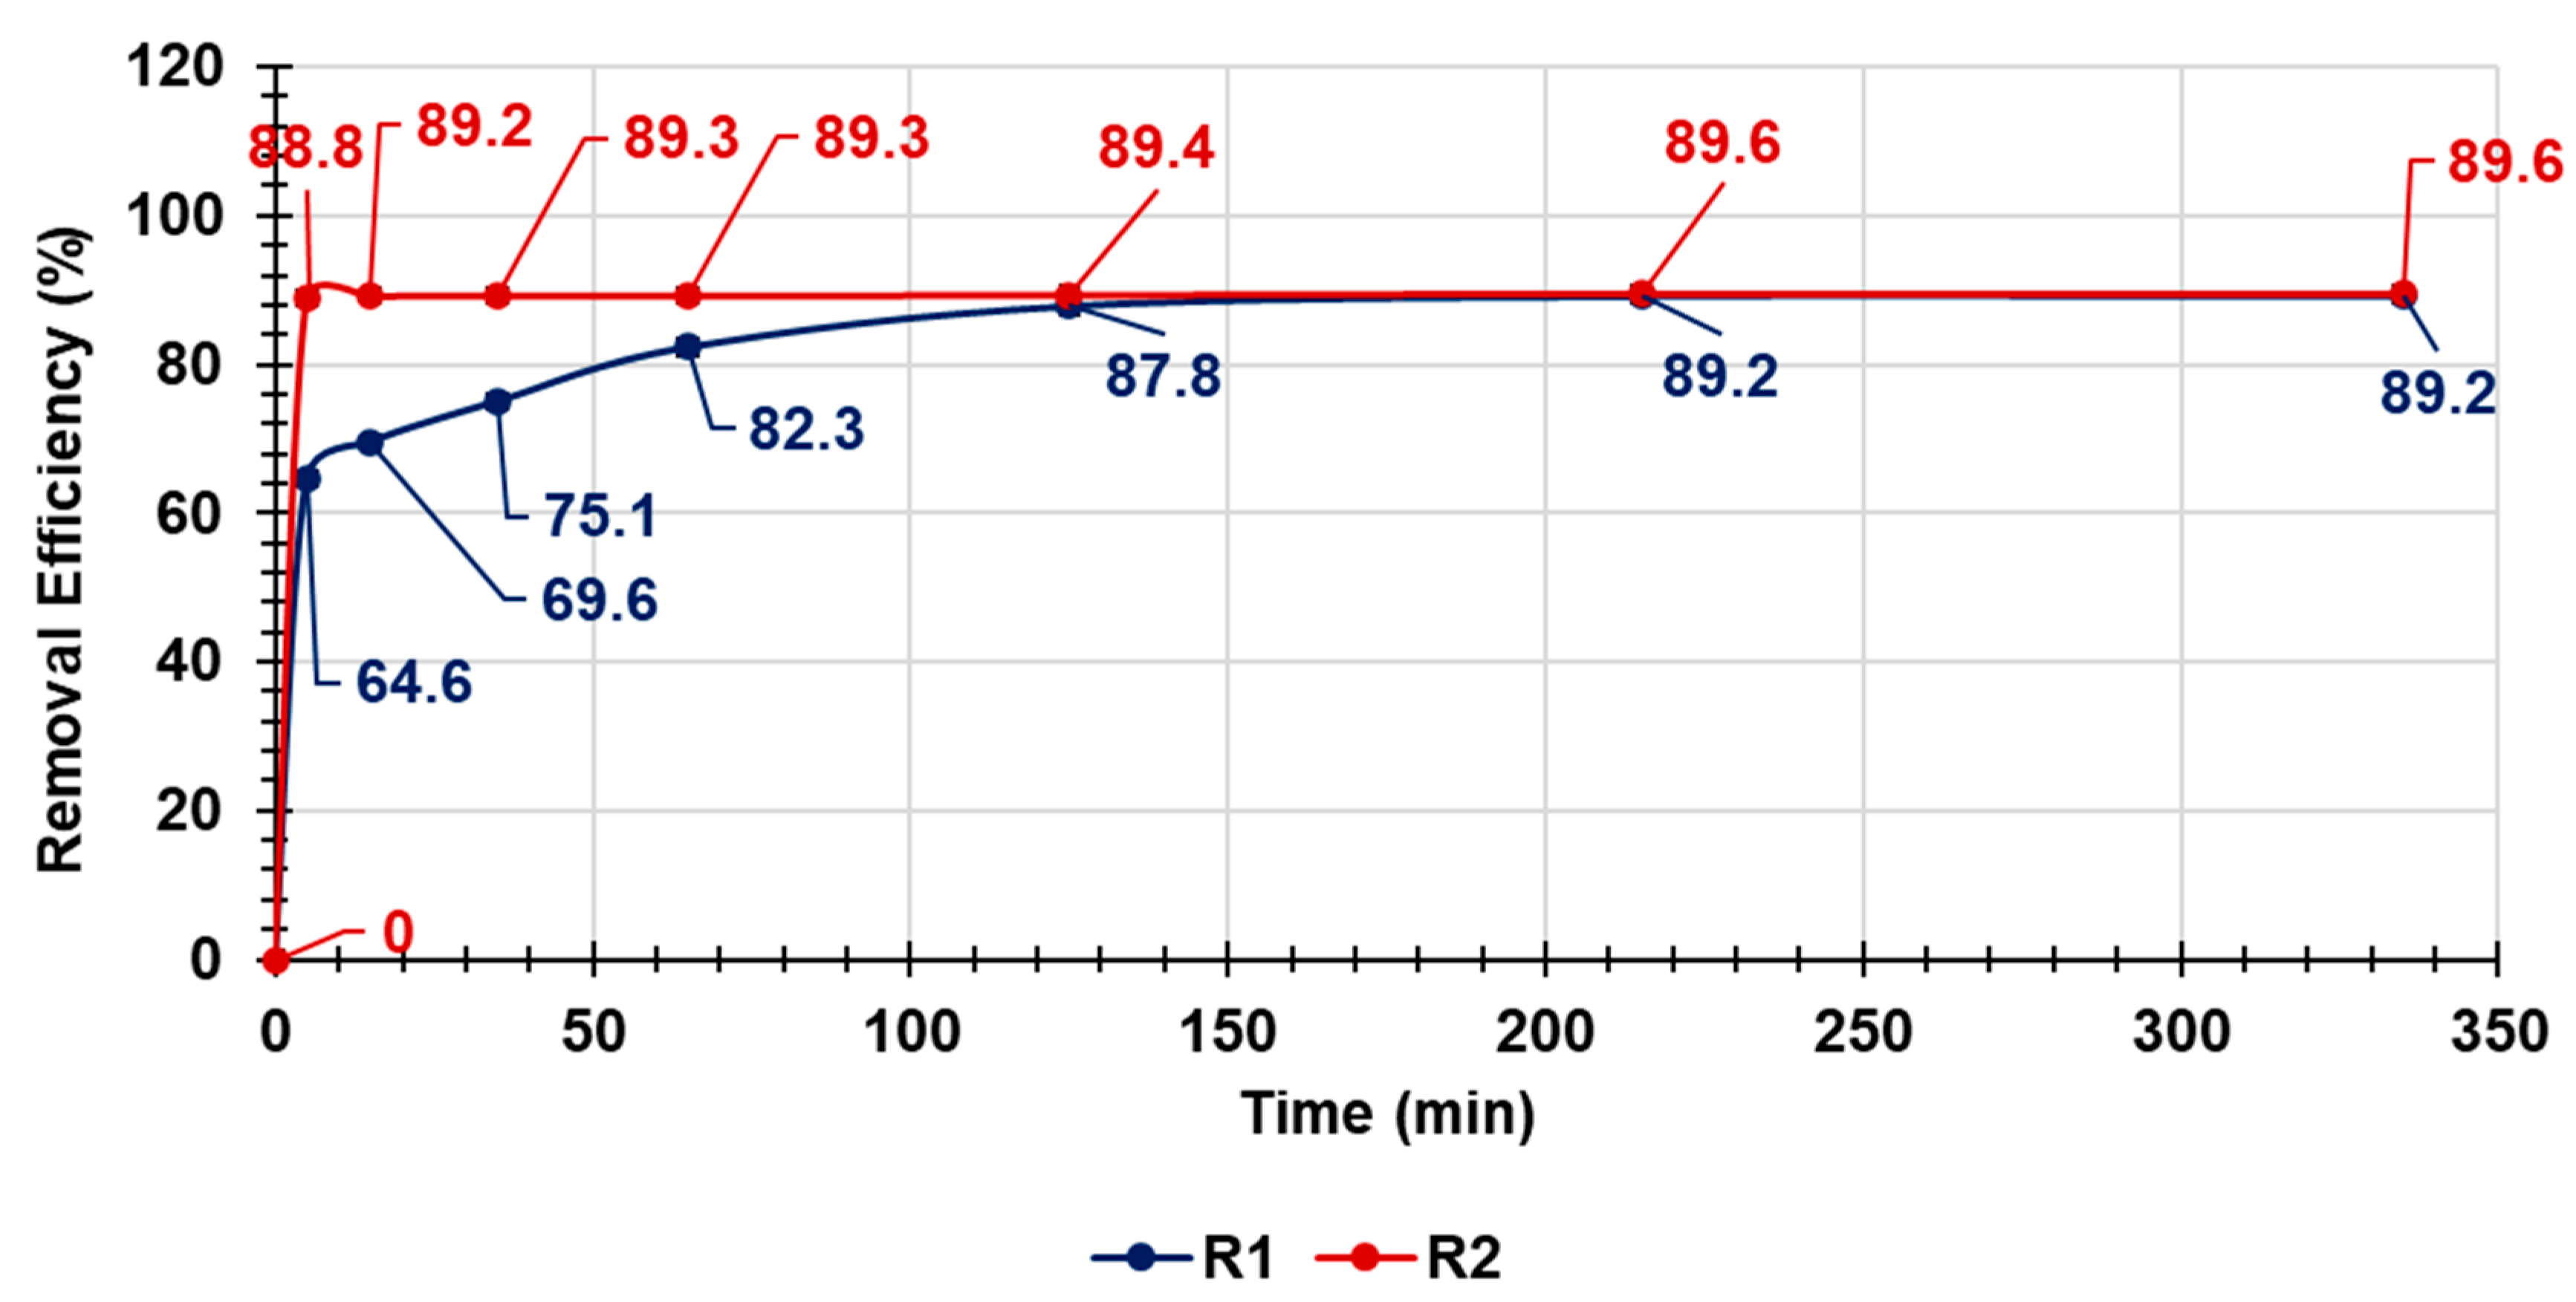
3.2.2. Batch Experiments: Removal of Nitrites from Water by R1HG and R2HG upon Contact
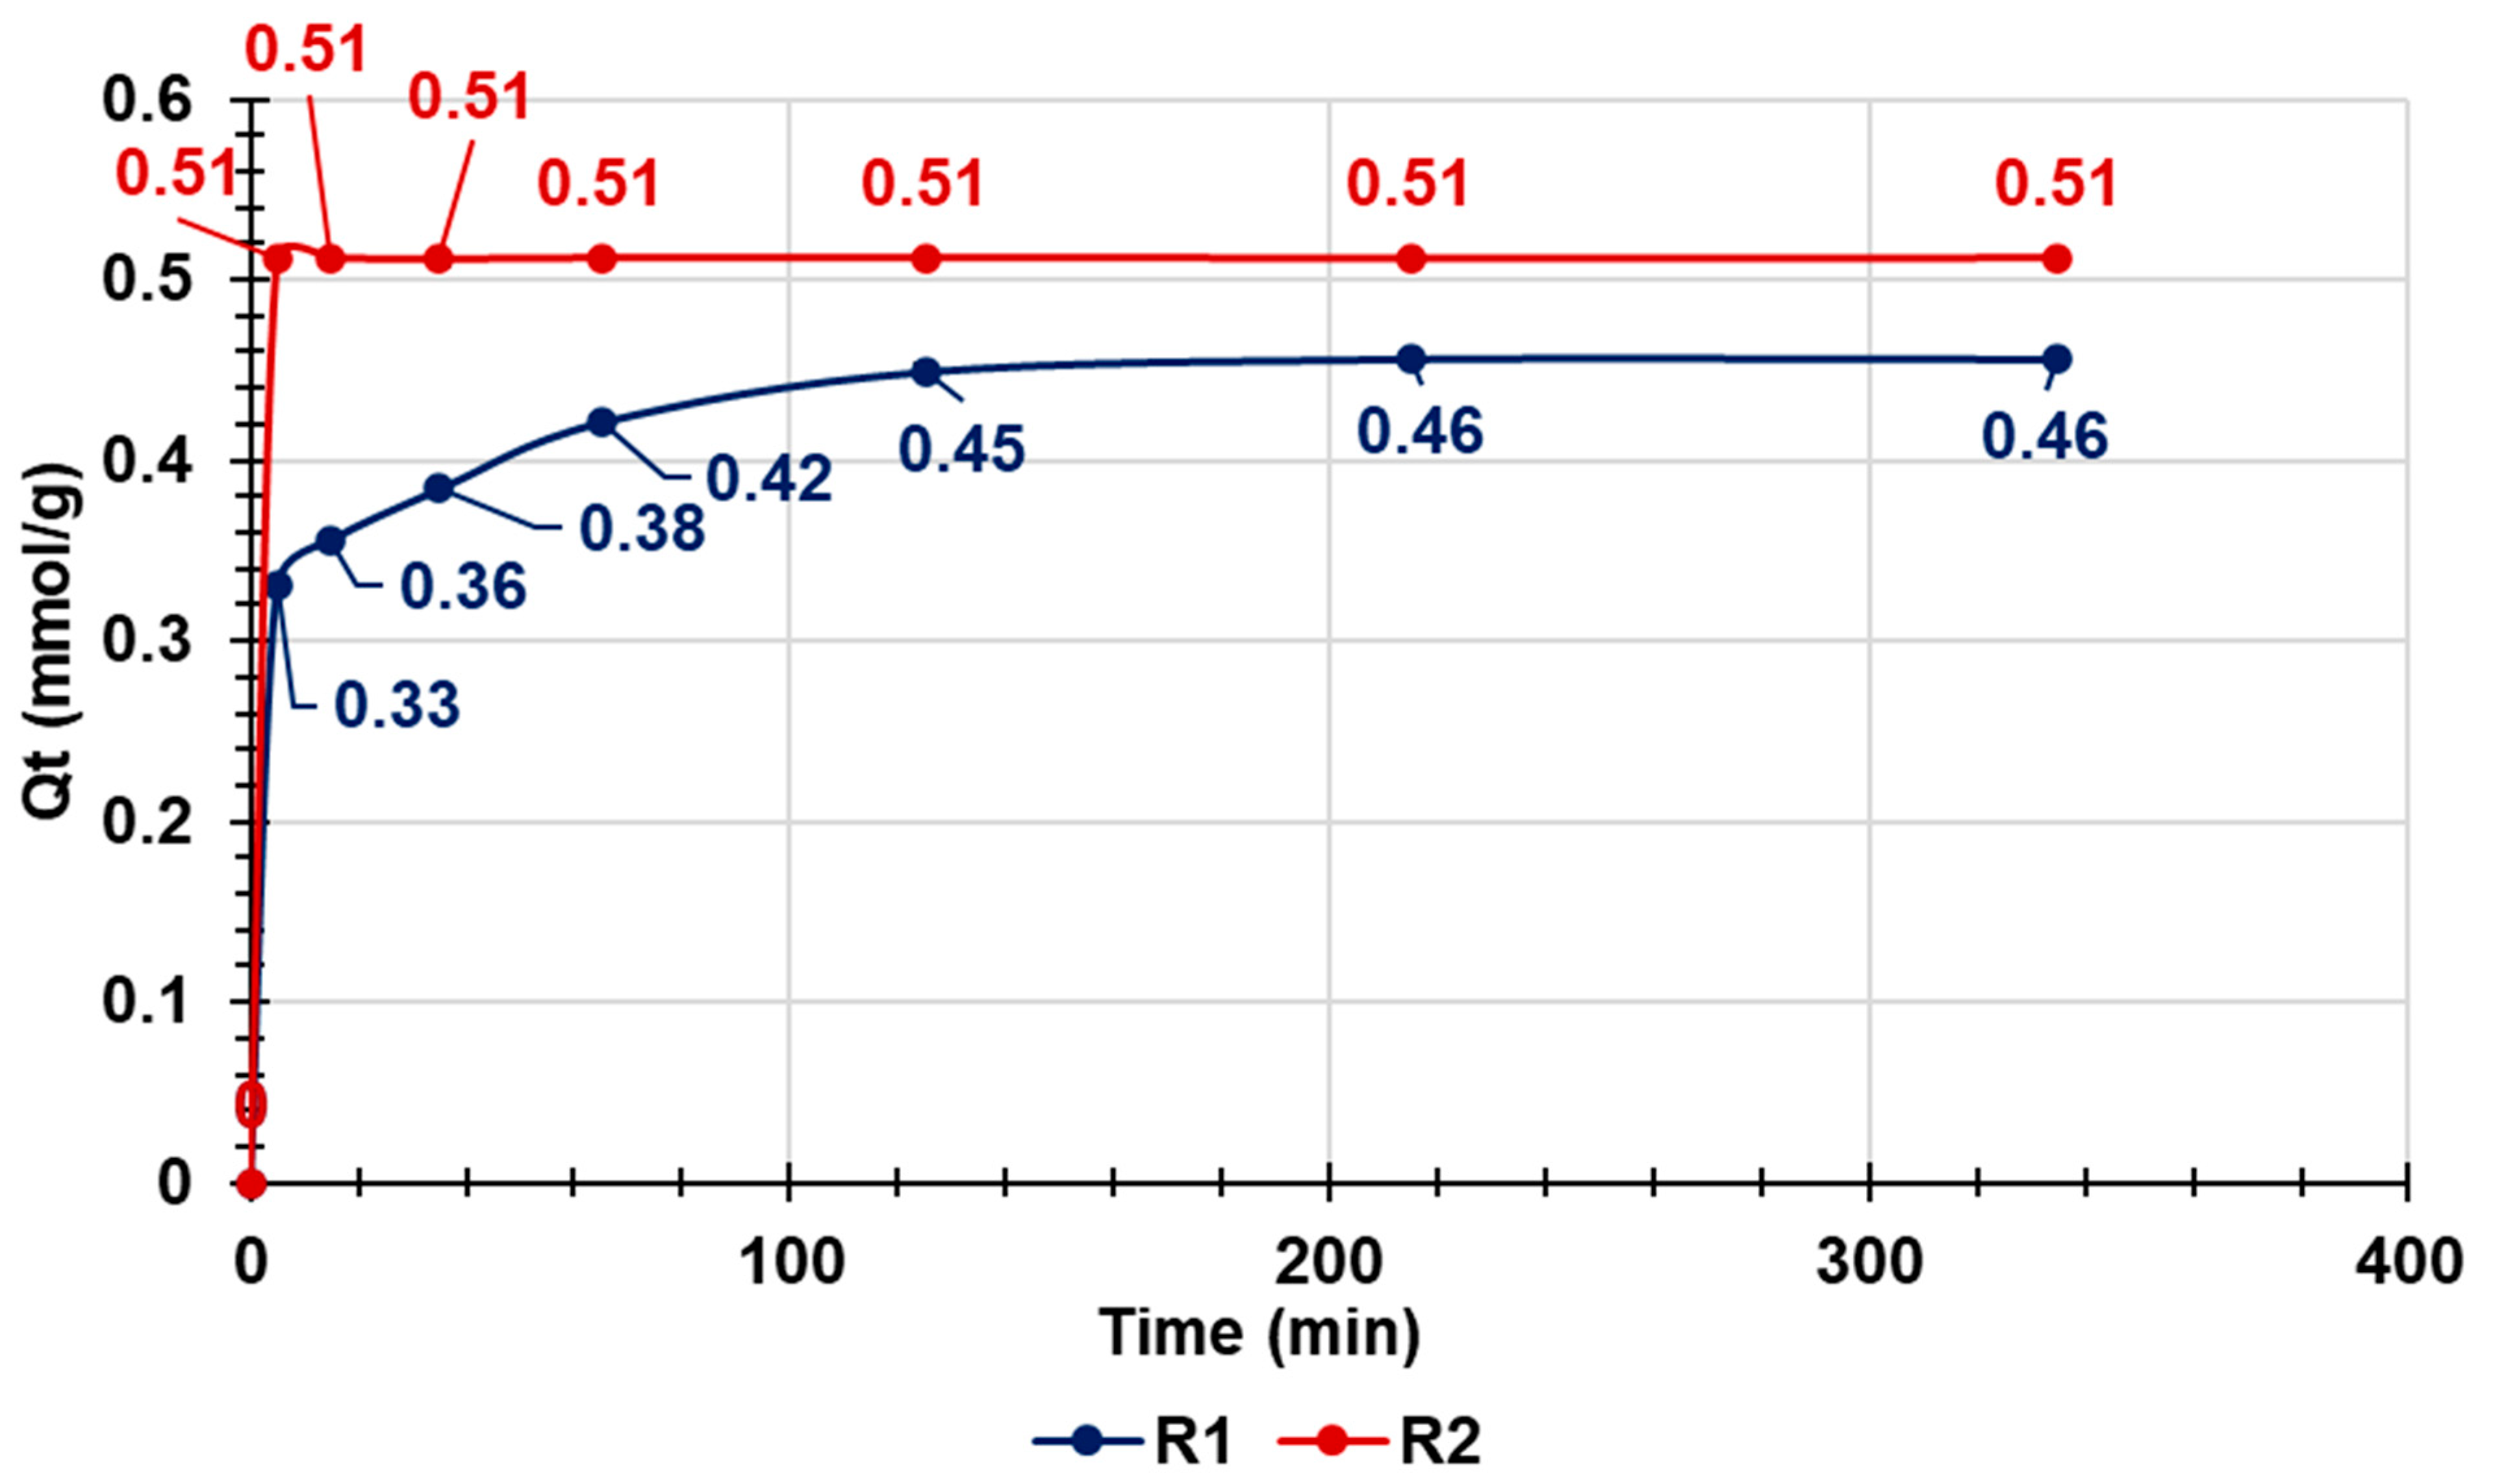
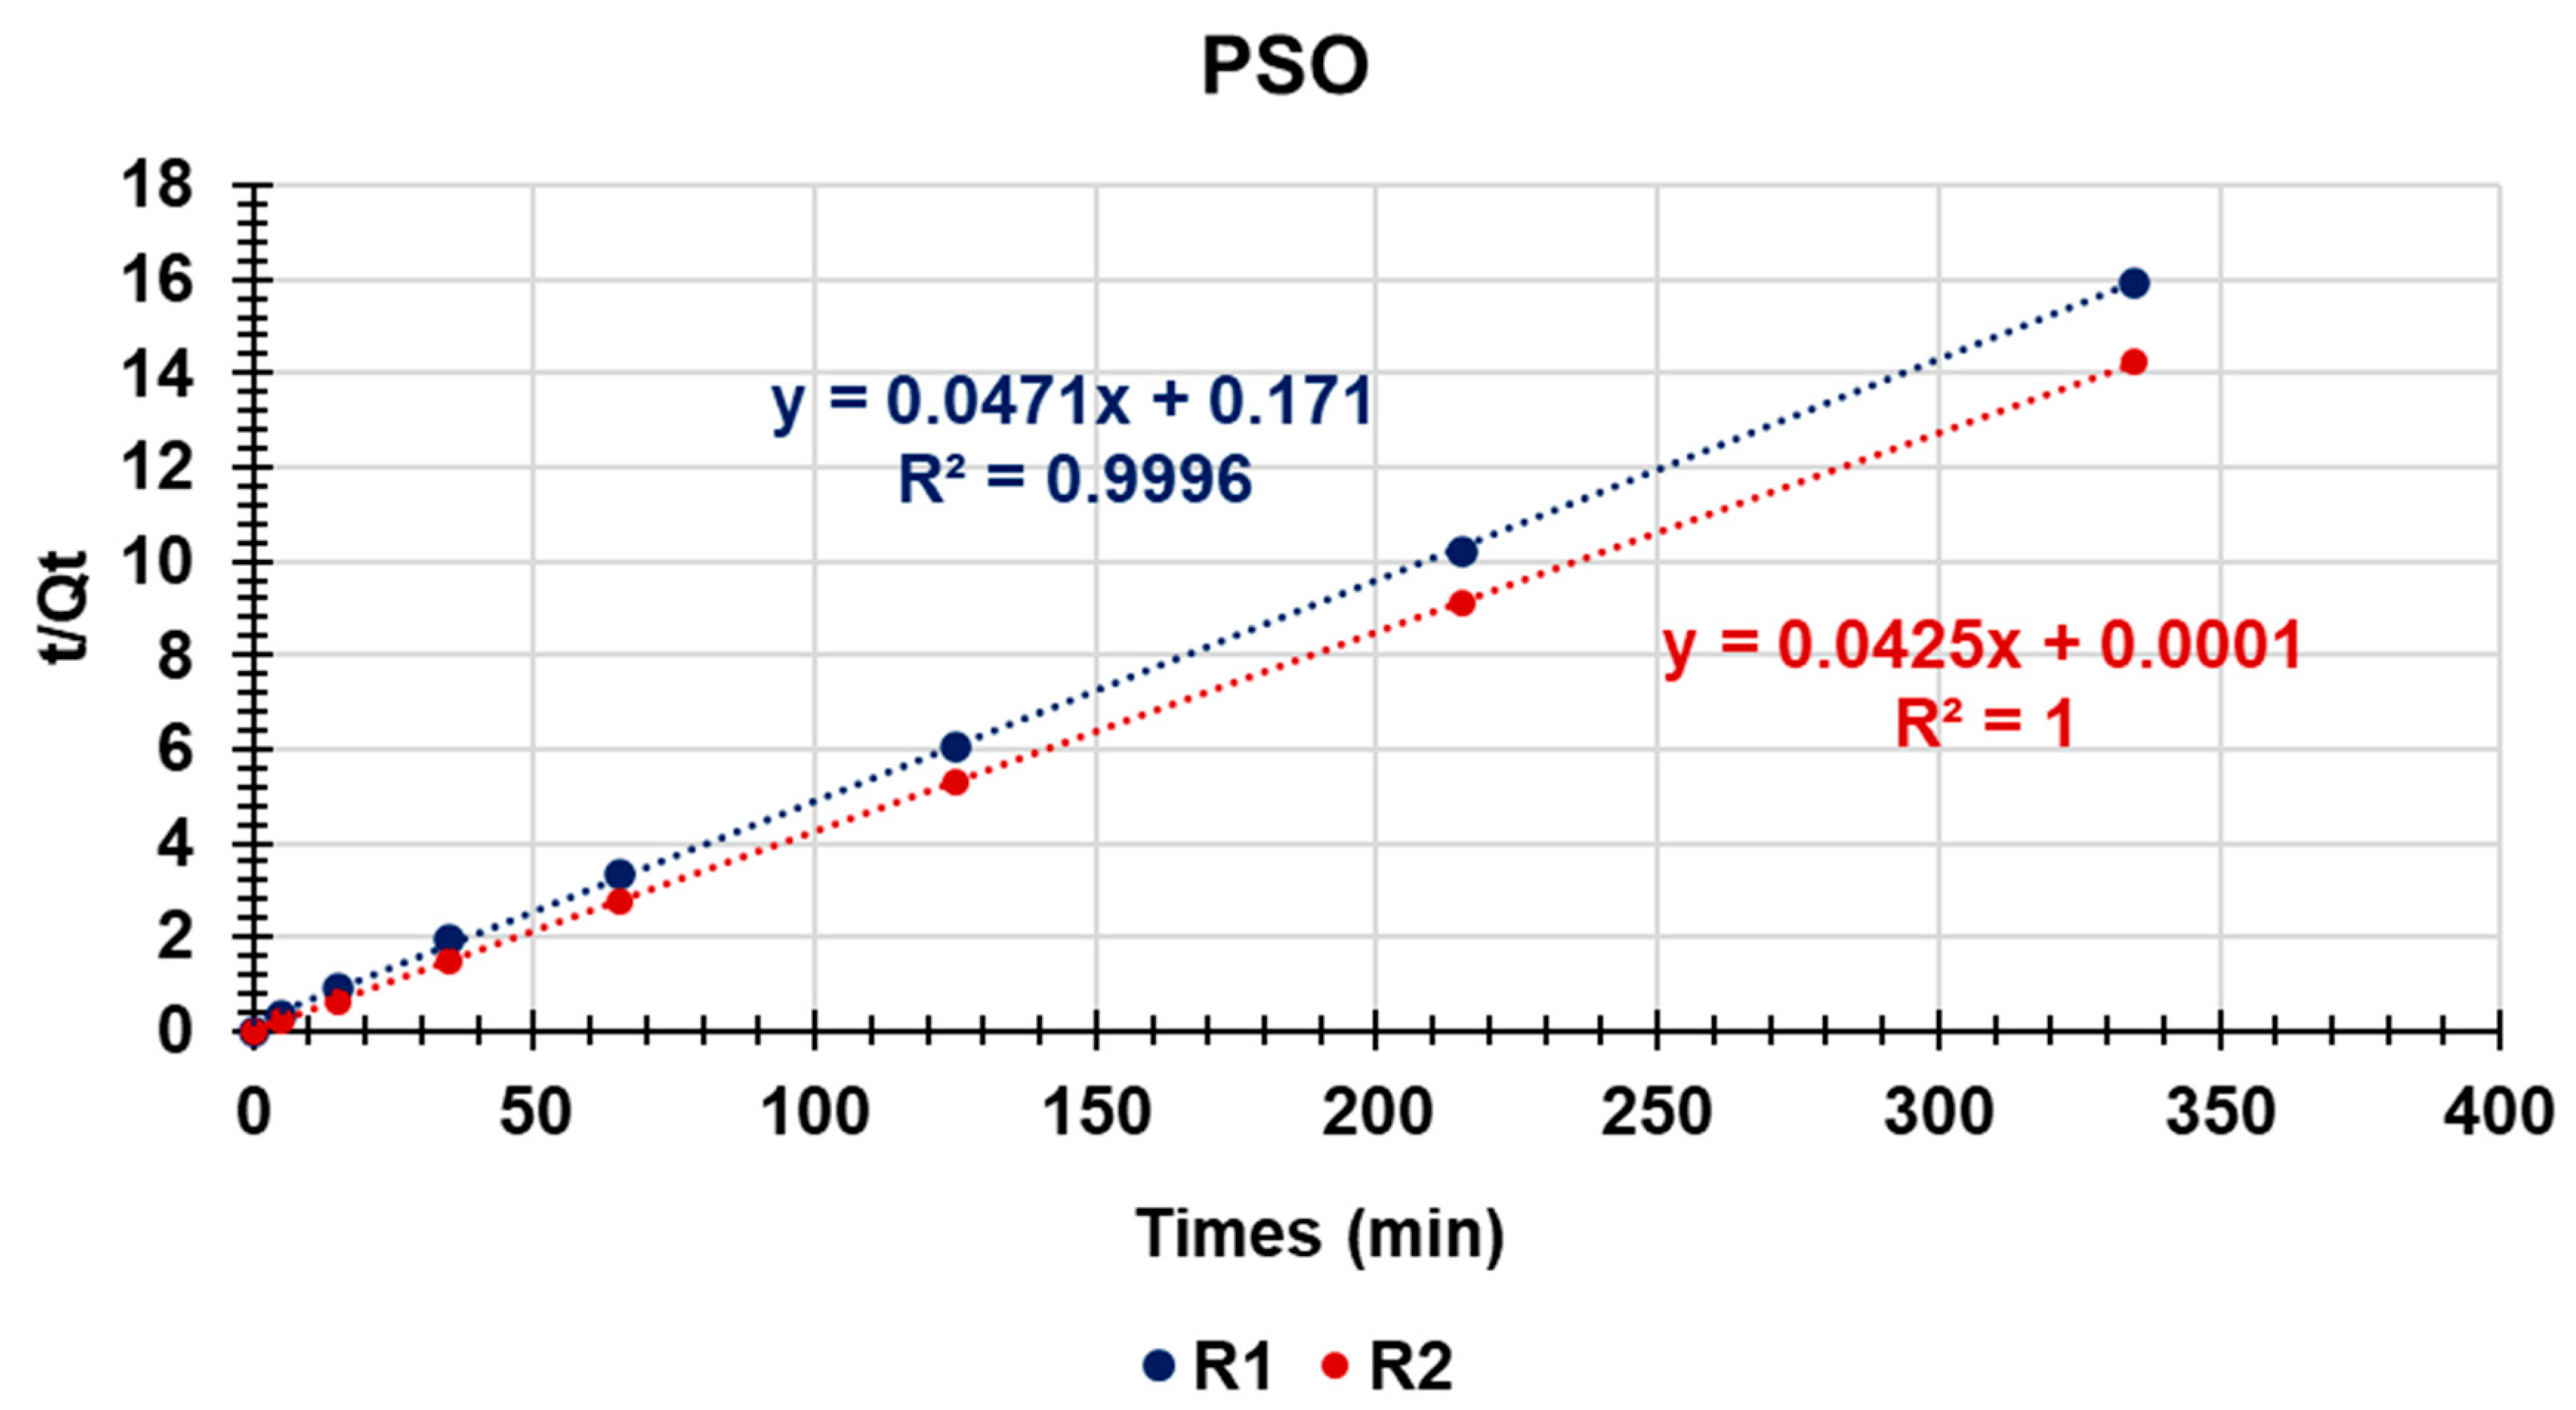
Kinetic Studies
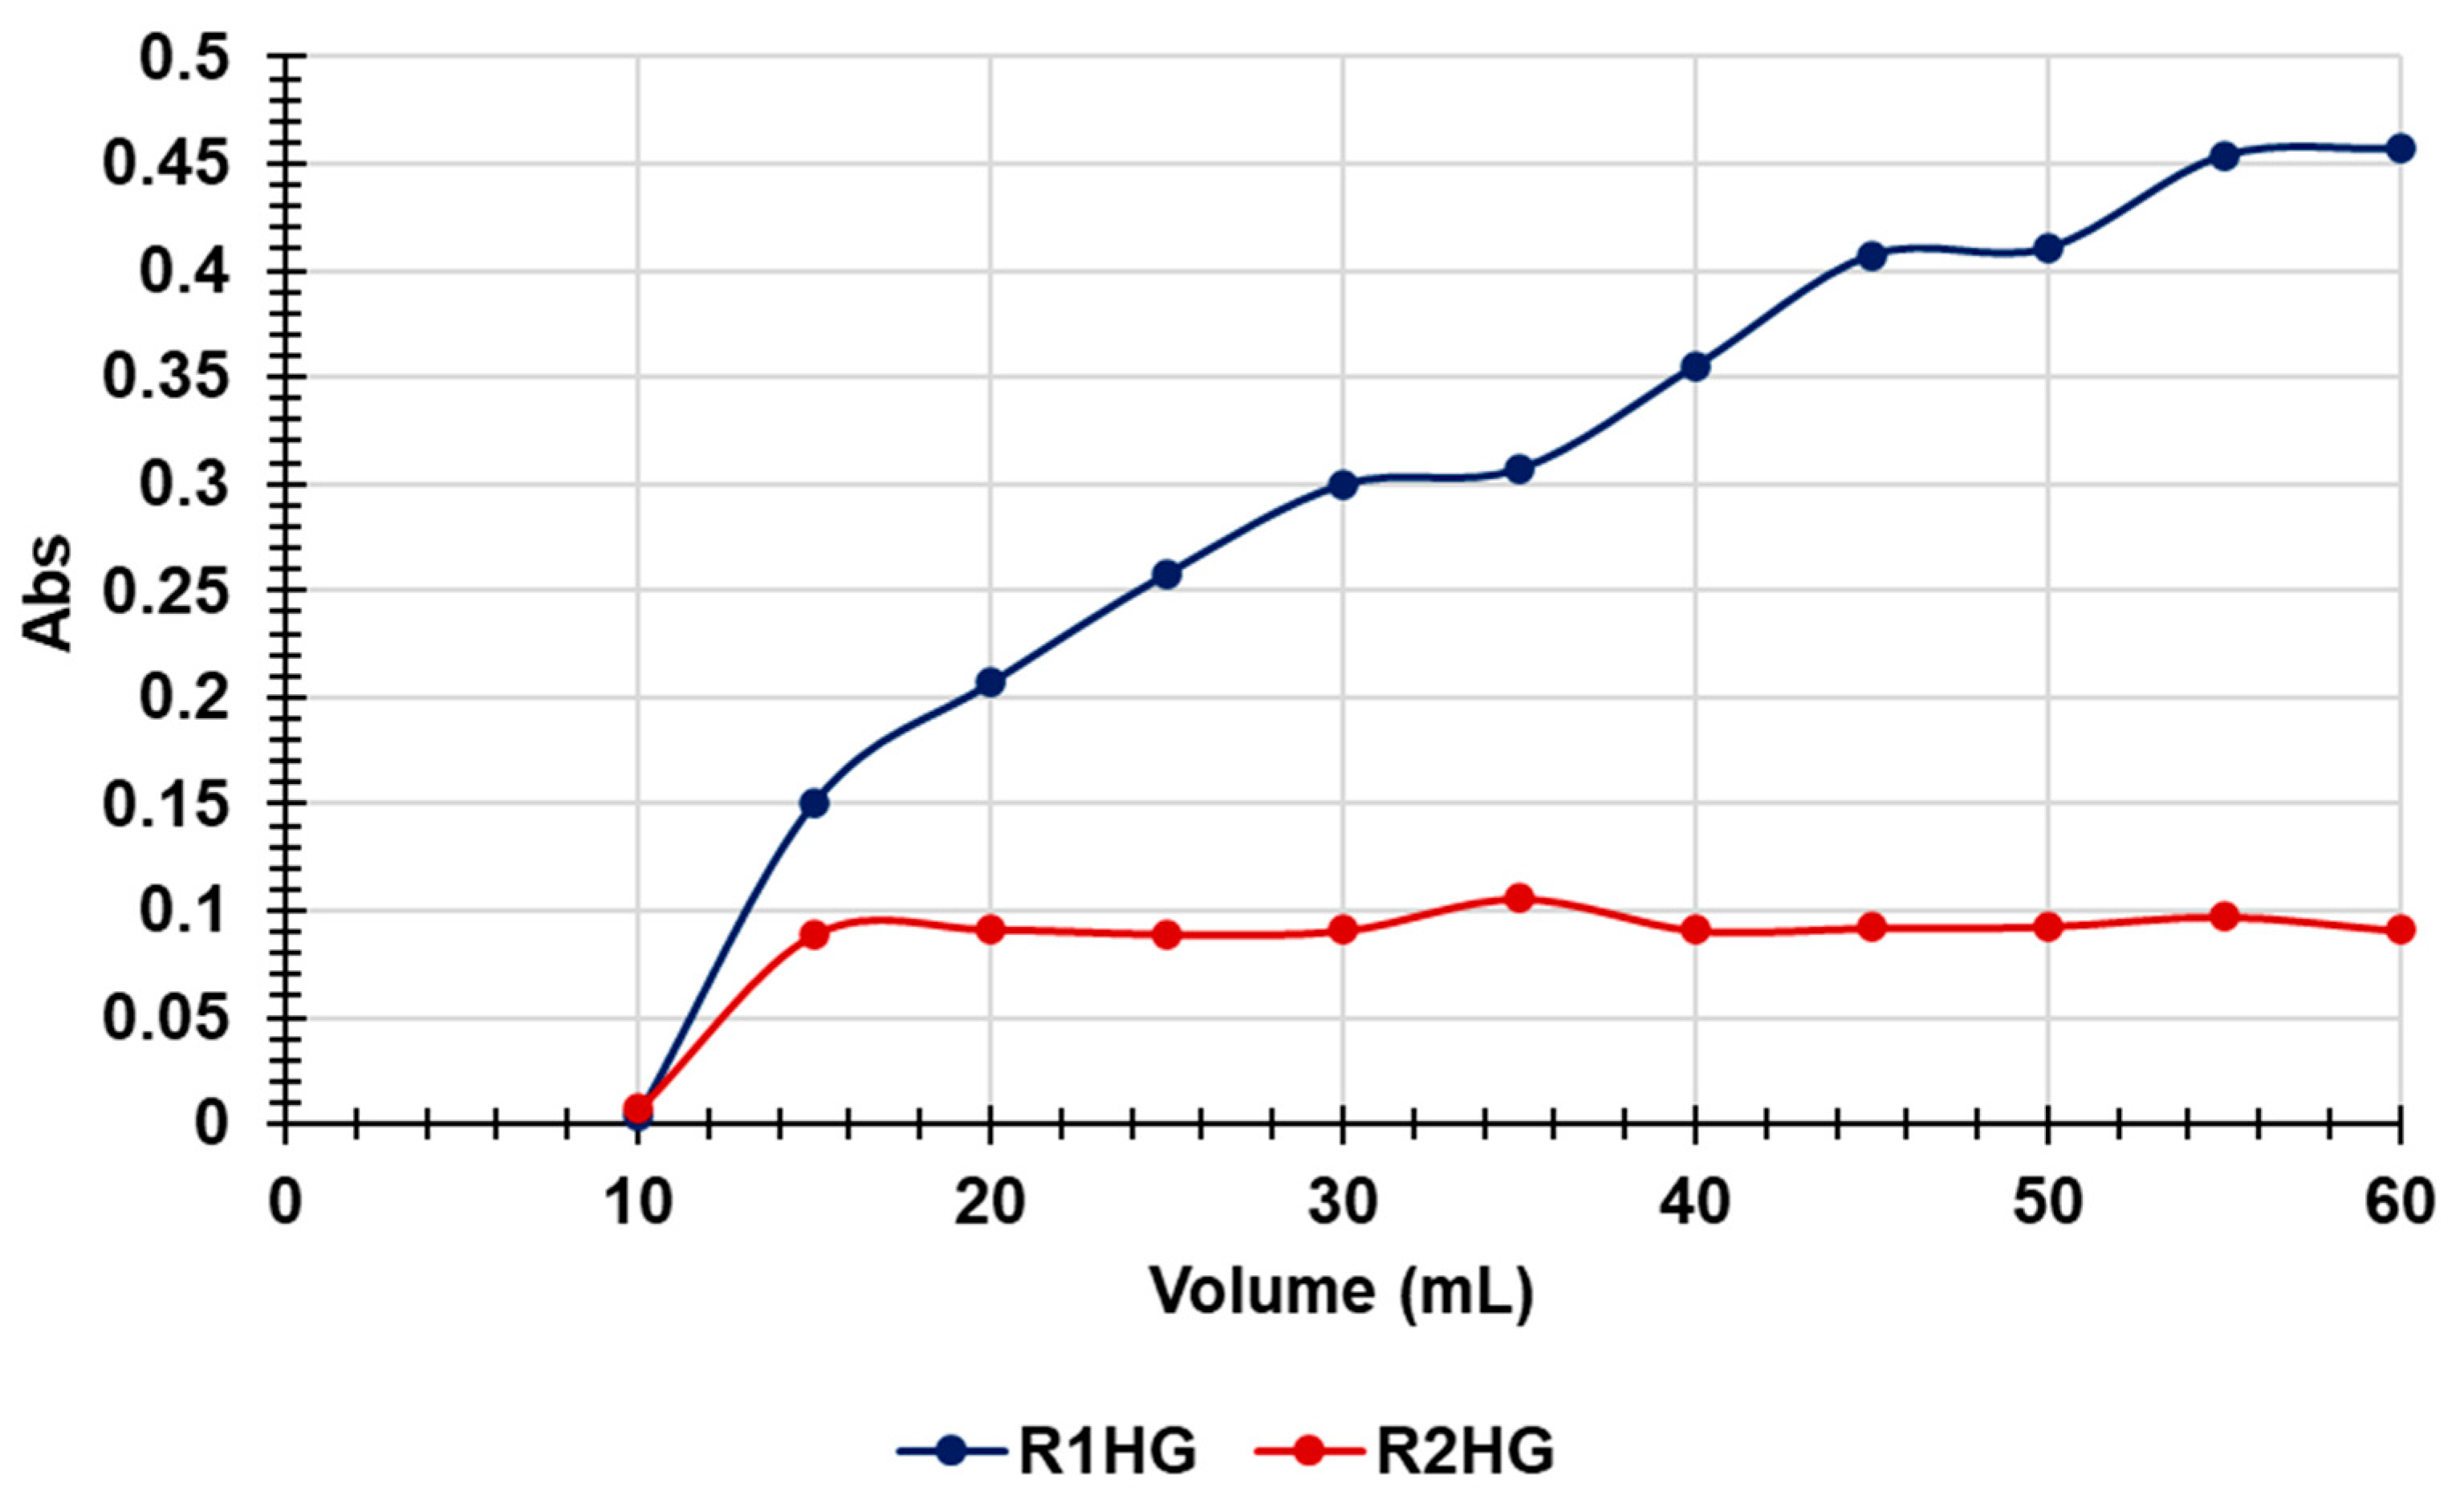
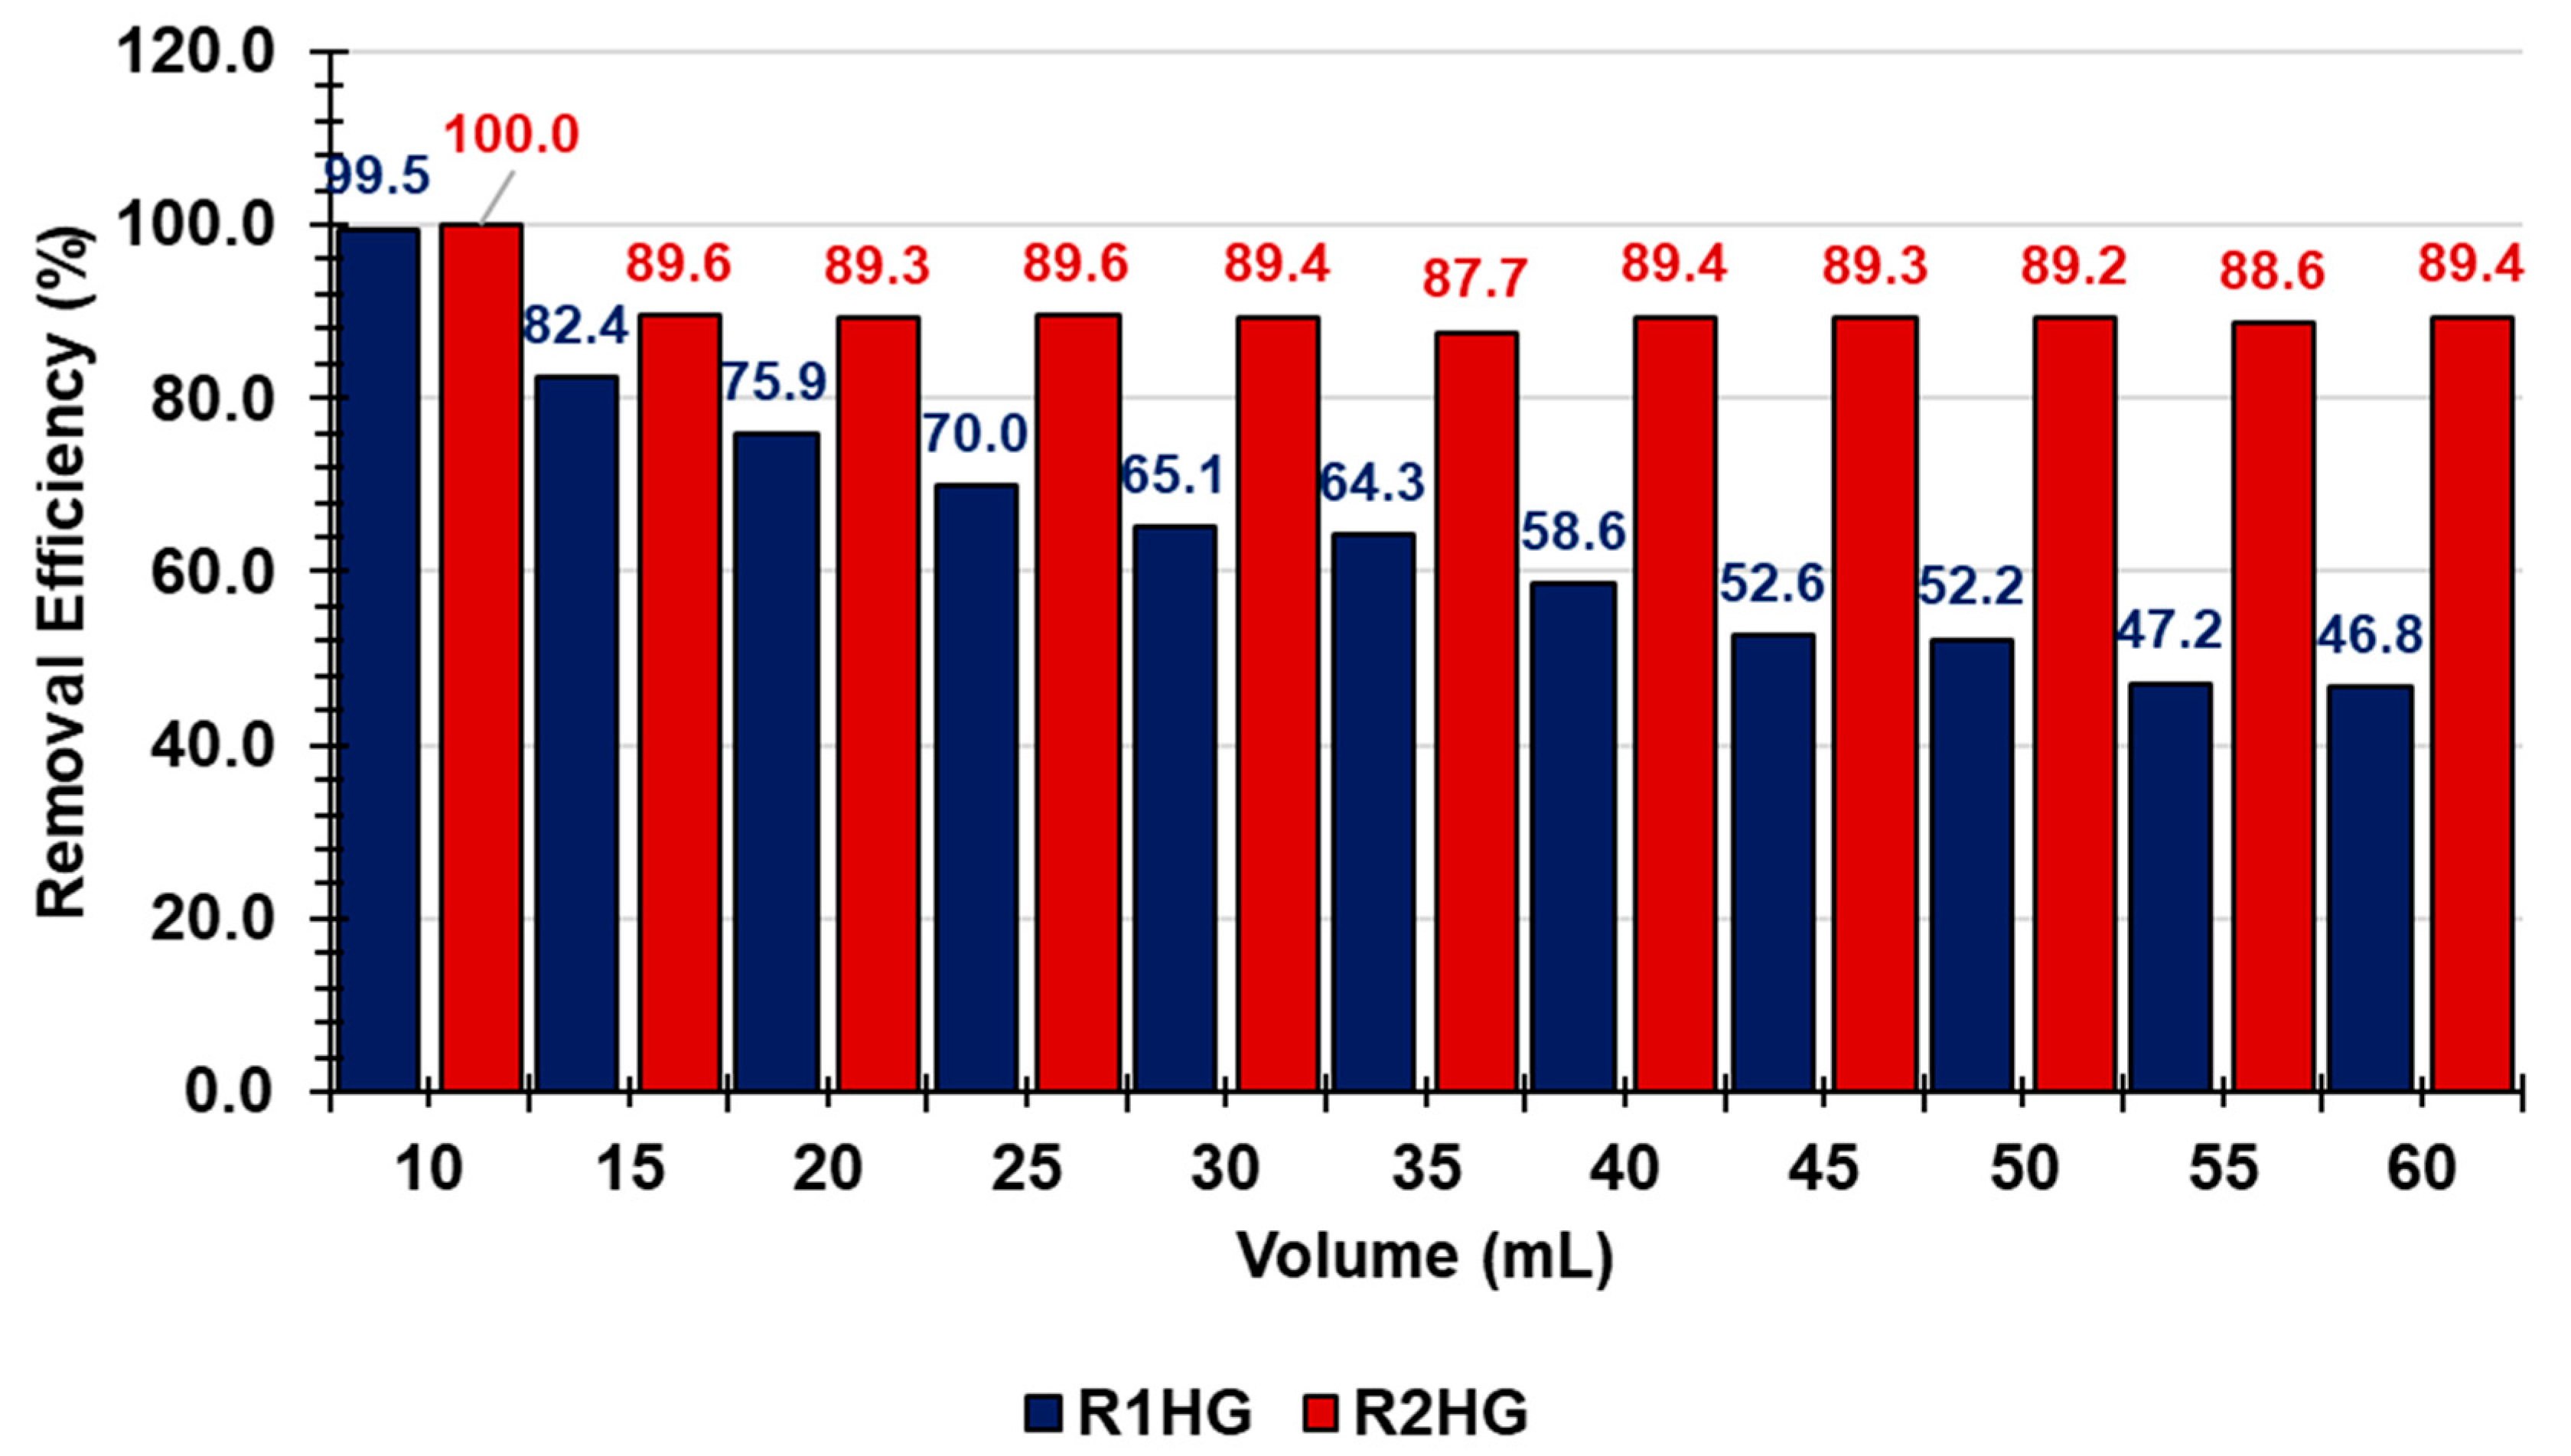
3.2.3. Removal of Nitrite from Water upon Filtration on R1HG- and R2HG-Based Columns
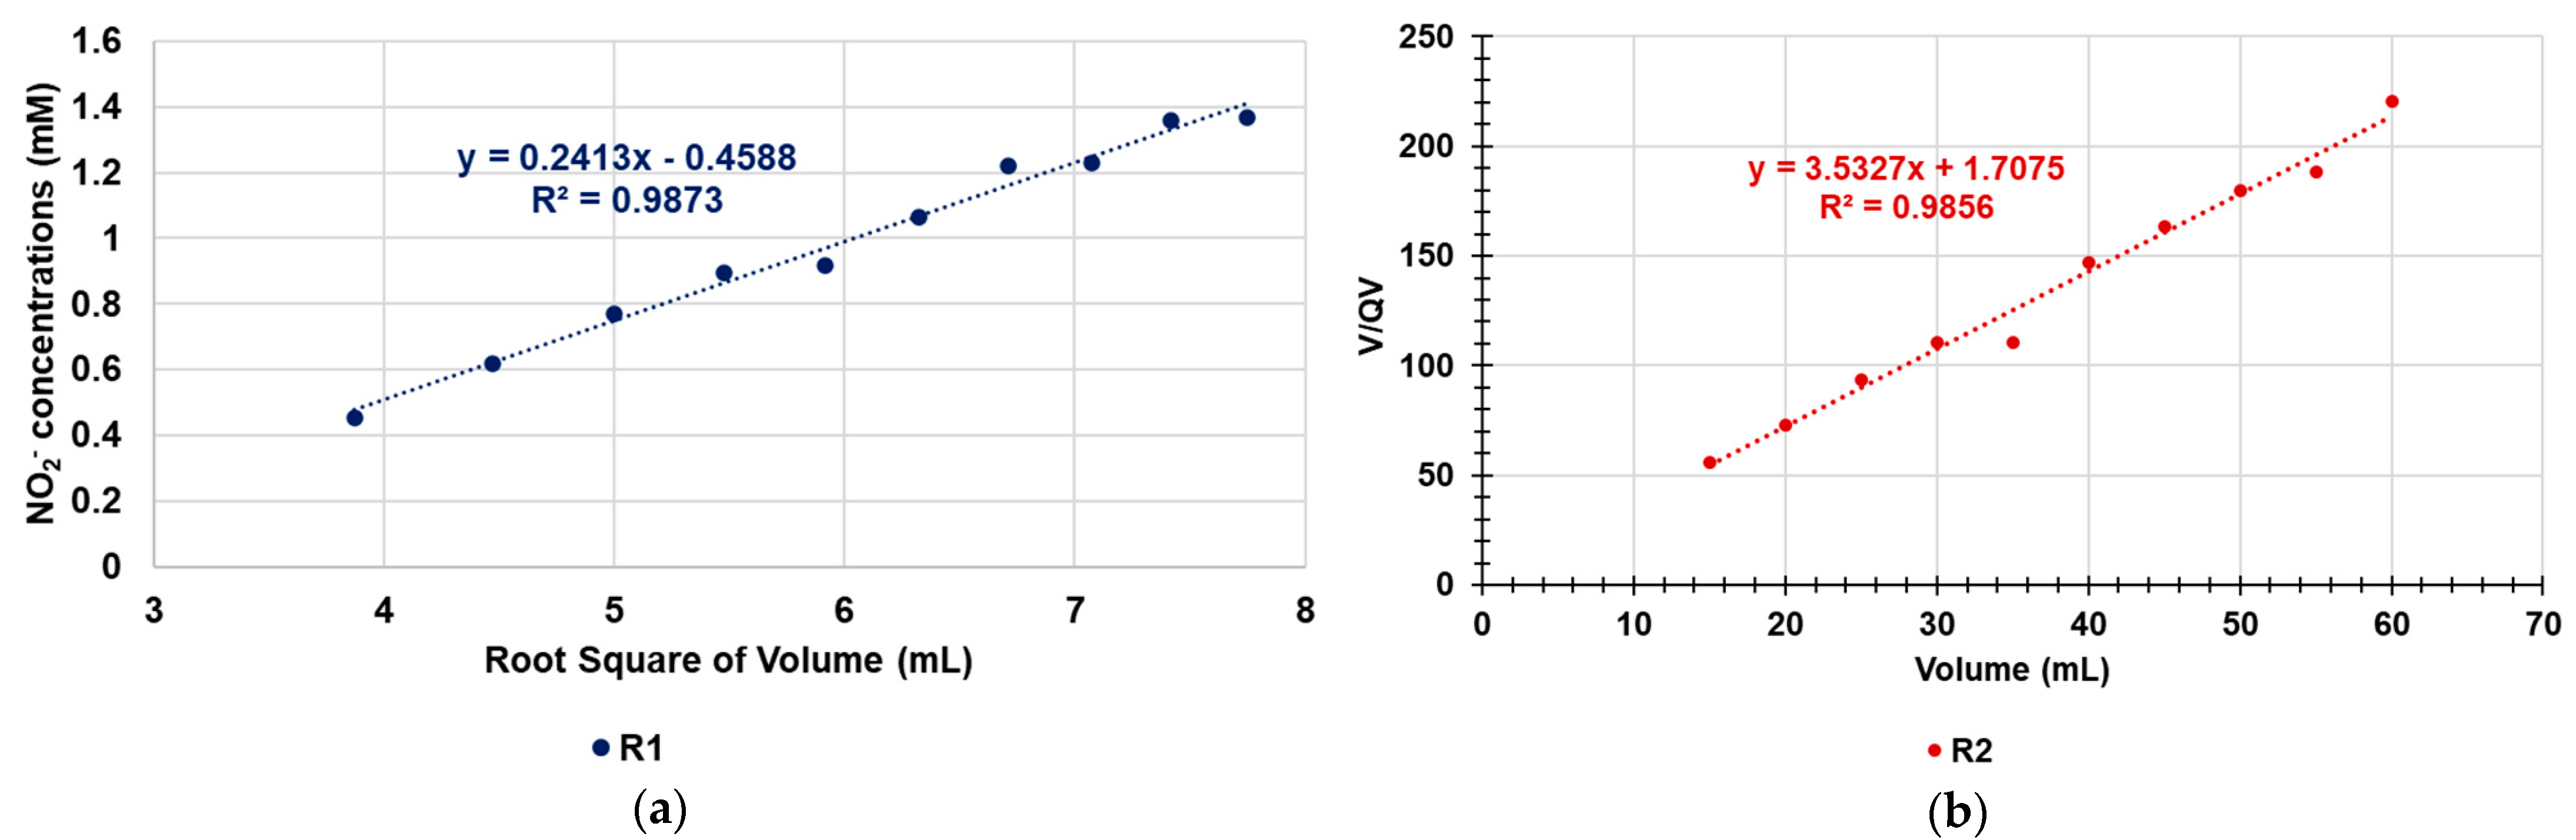
Saturation Kinetics Studies
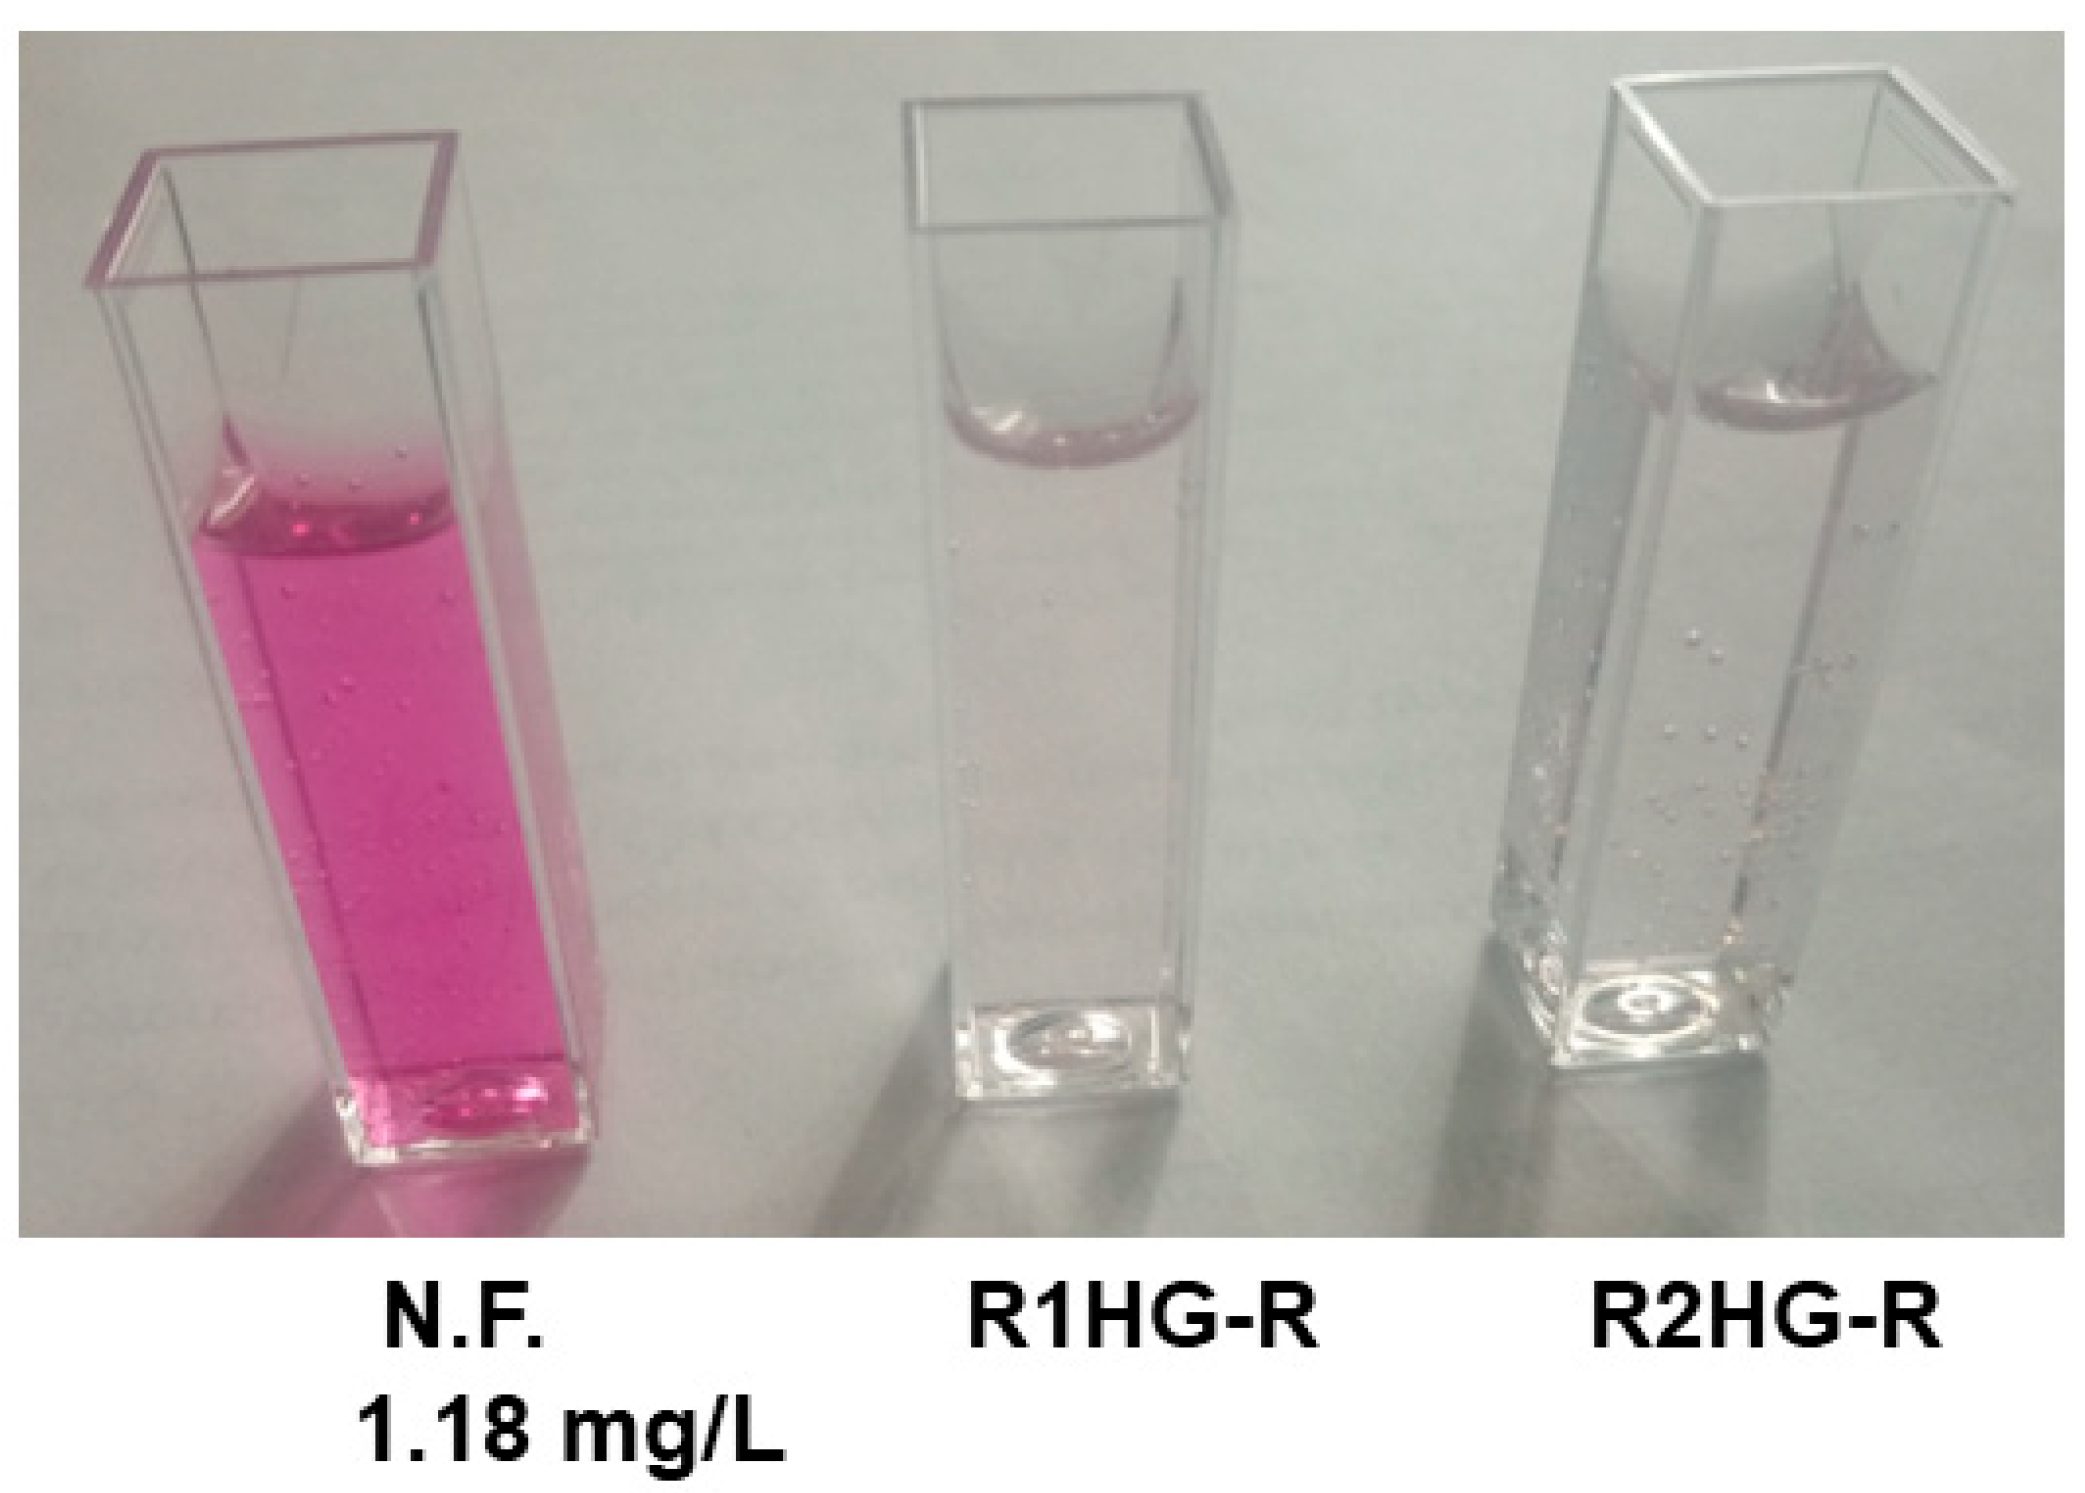
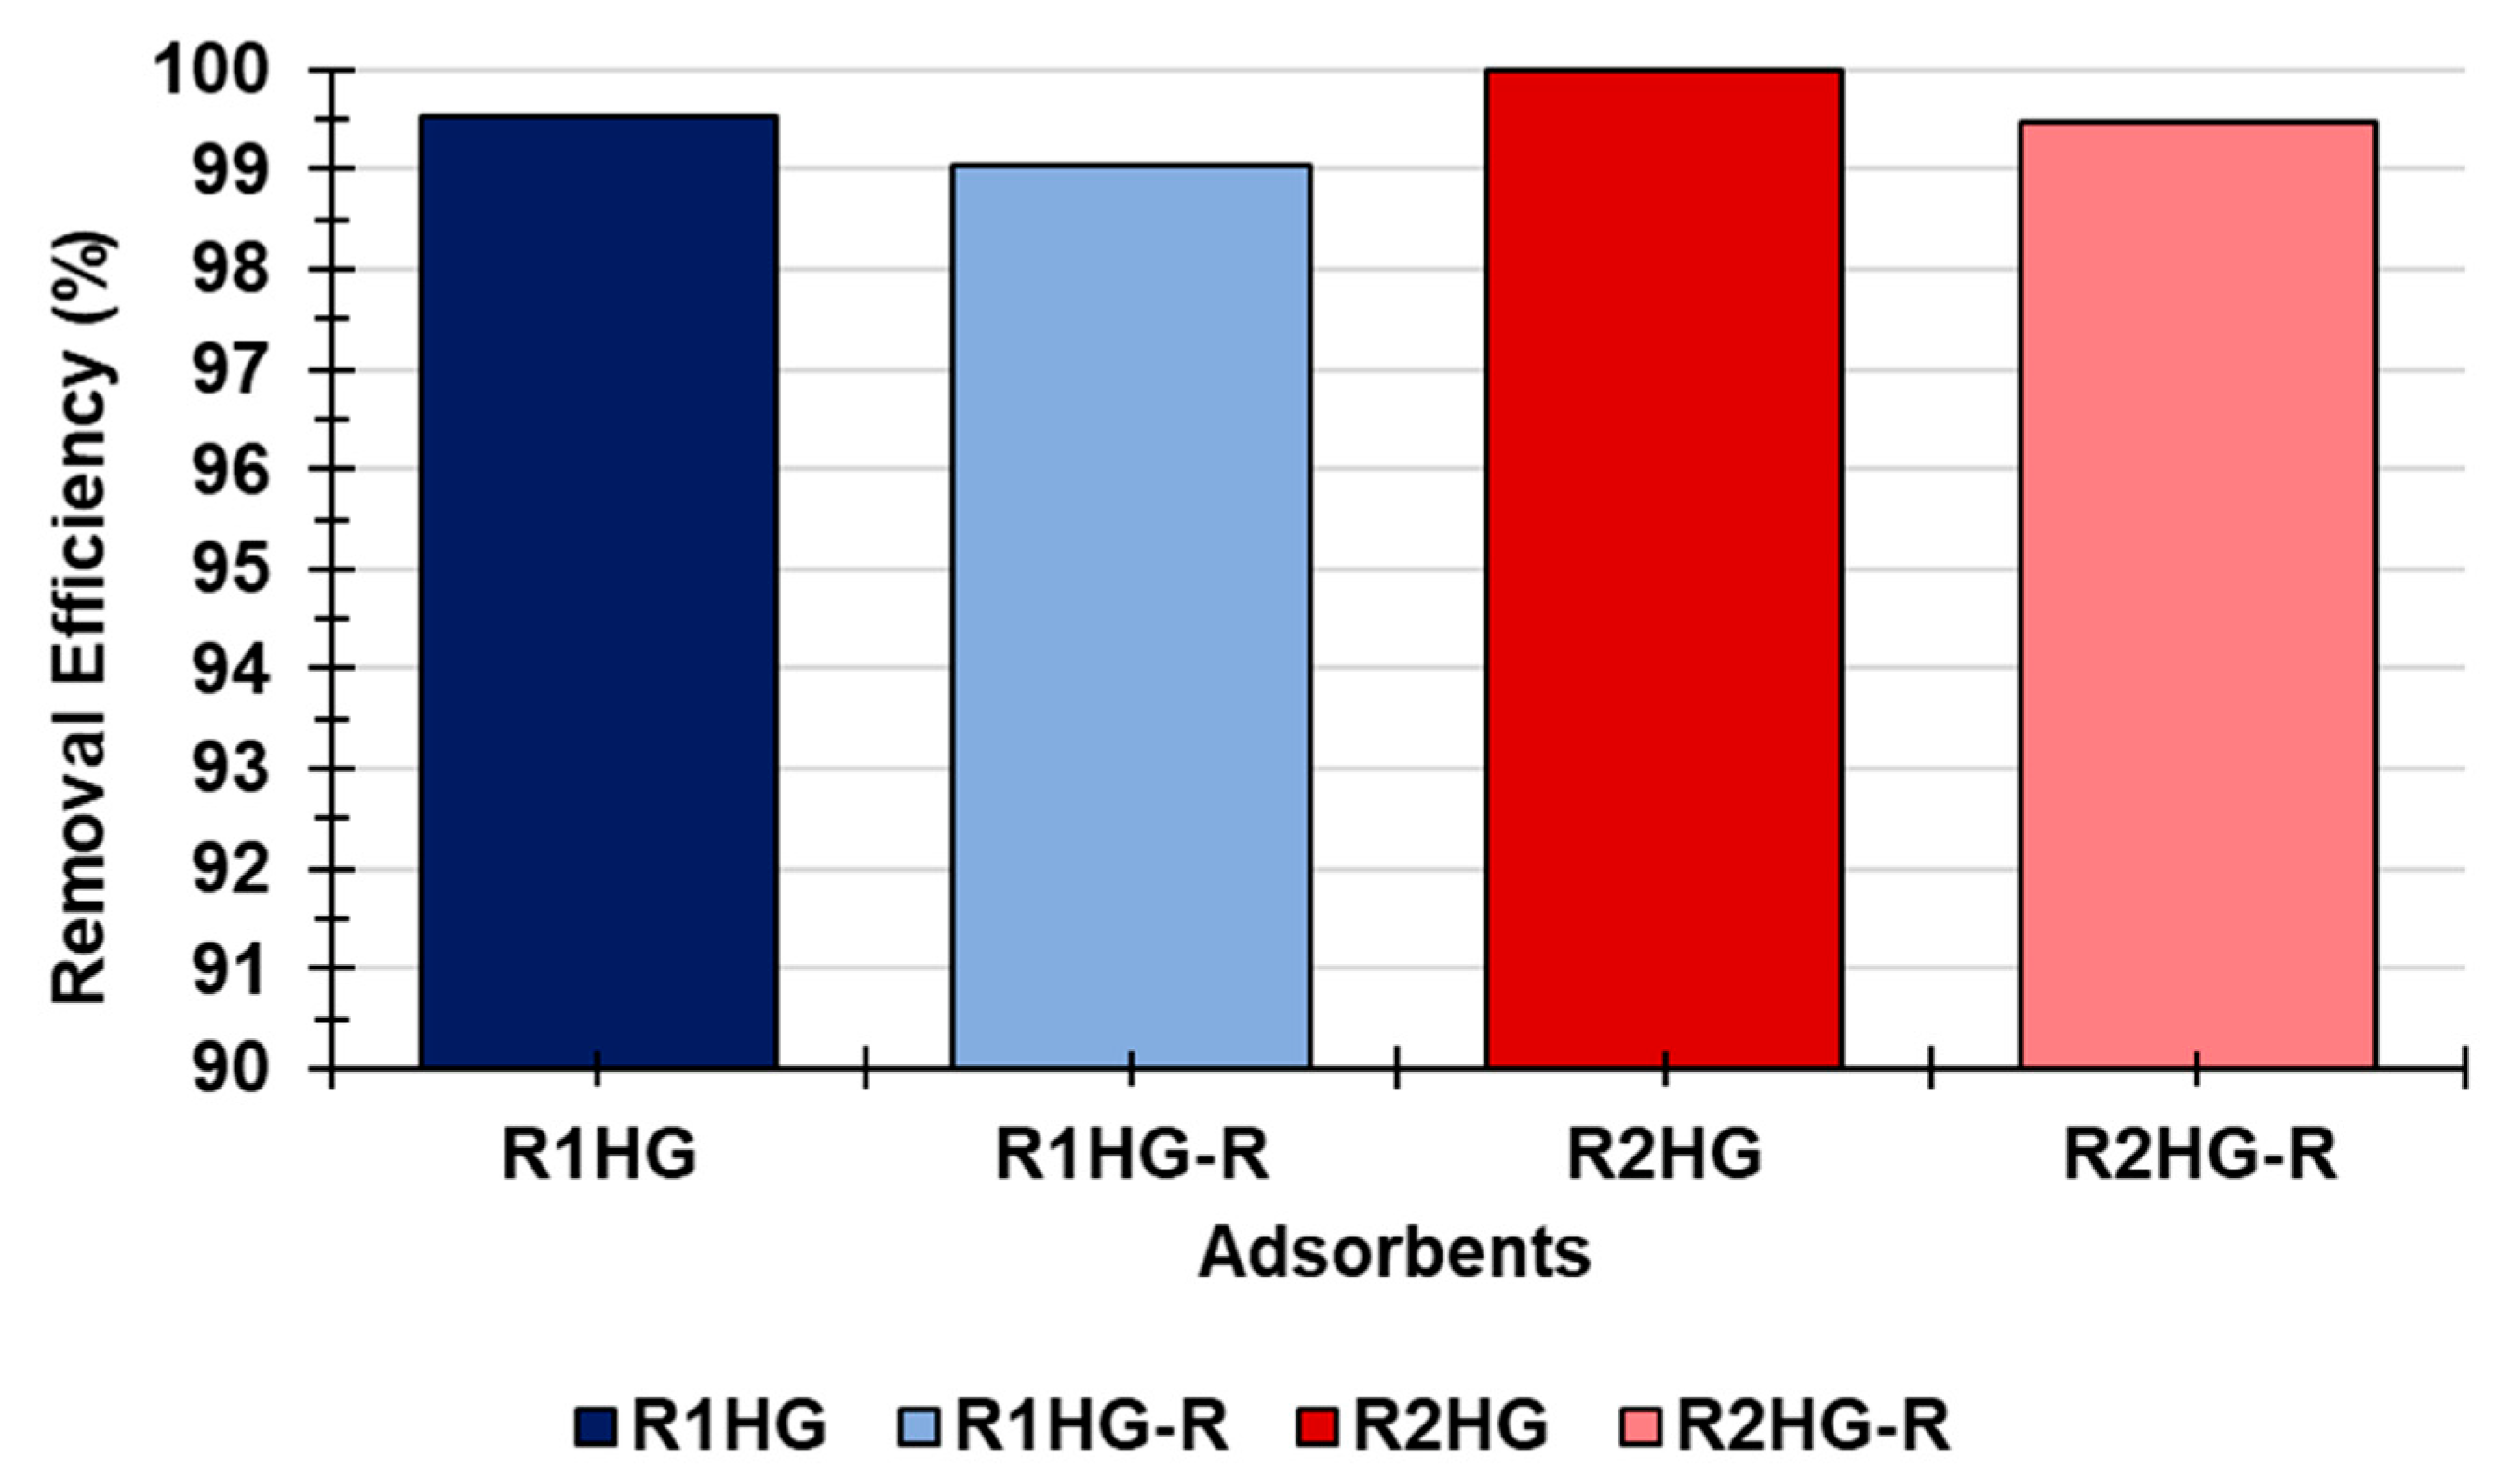
Regeneration of Adsorbents R1 and R2
4. Conclusions
Supplementary Materials
Author Contributions
Funding
Institutional Review Board Statement
Informed Consent Statement
Data Availability Statement
Acknowledgments
Conflicts of Interest
References
- Alo, B.T. Scinecing. Available online: https://sciencing.com/list-water-pollutants-6309497.html (accessed on 17 February 2023).
- Rabalais, N.N. Nitrogen in aquatic ecosystems. Ambio 2002, 31, 102–112. [Google Scholar] [CrossRef] [PubMed]
- The Nitrogen Cycle. Available online: https://www.khanacademy.org/science/biology/ecology/biogeochemical-cycles/a/the-nitrogen-cycle (accessed on 7 February 2023).
- Camargo, J.A.; Alonso, A. Ecological and toxicological effects of inorganic nitrogen pollution in aquatic ecosystems: A global Assessment. Environ. Int. 2006, 32, 831–849. [Google Scholar] [CrossRef] [PubMed]
- Water Science School. Nitrogen and Water. USGS Science for a Changing World. Available online: https://www.usgs.gov/special-topics/water-science-school/science/nitrogen-and-water (accessed on 7 February 2023).
- ATSDR. Agency for Toxic Substances and Diseases Registry. Nitrate/Nitrite Toxicity. Where Are Nitrate and Nitrite Found? Available online: https://www.atsdr.cdc.gov/csem/nitrate-nitrite/where_are.html (accessed on 7 February 2023).
- Wang, W.; Wang, J.; Feng, X.; Gao, H. A Common Target of Nitrite and Nitric Oxide for Respiration Inhibition in Bacteria. Int. J. Mol. Sci. 2022, 23, 13841. [Google Scholar] [CrossRef] [PubMed]
- Wang, Q.-H.; Yu, L.-J.; Liu, Y.; Lin, L.; Lu, R.; Zhu, J.; He, L.; Lu, Z.-L. Methods for the detection and determination of nitrite and nitrate: A review. Talanta 2017, 165, 709–720. [Google Scholar] [CrossRef]
- Santamaria, P. Nitrate in vegetables: Toxicity, content, Intake and EC regulation. J. Sci. Food Agric. 2006, 86, 10–17. [Google Scholar] [CrossRef]
- Nitrite in Drinking Water. Published 13 March 2019. Available online: https://www.filterwater.com/t-nitrite.aspx (accessed on 10 March 2023).
- European Commission. Environment. Nitrates. Available online: https://environment.ec.europa.eu/topics/water/nitrates_en (accessed on 7 February 2023).
- Hao, D.; Liu, Y.; Gao, S.; Arandiyan, H.; Bai, X.; Kong, Q.; Wei, W.; Shen, P.K.; Ni, B.-J. Emerging artificial nitrogen cycle processes through novel electrochemical and photochemical synthesis. Mater. Today 2021, 46, 212–233. [Google Scholar] [CrossRef]
- Pugh, D.B.; Saxena, A.; Barta, L.E.; Pinkerton, C.; Bajic, J.; Boettcher, B.T.; Woehlck, H.J. A Case Report of Hypotension and Methemoglobinemia Associated with Gunshot Residue Poisoning: Nitrite-Induced Methemoglobinemia. AA Pract. 2022, 16, e01631. [Google Scholar] [CrossRef]
- Wettstein, Z.S.; Yarid, N.A.; Shah, S. Fatal methaemoglobinemia due to intentional sodium nitrite ingestion. BMJ Case Rep. 2022, 15, e252954. [Google Scholar] [CrossRef] [PubMed]
- Manassaram, D.M.; Backer, L.C.; Messing, R.; Fleming, L.E.; Luke, B.; Monteilh, C.P. Nitrates in drinking water and methemoglobin levels in pregnancy: A longitudinal study. Environ. Health 2010, 9, 60. [Google Scholar] [CrossRef] [PubMed] [Green Version]
- Knobeloch, L.; Salna, B.; Hogan, A.; Postle, J.; Anderson, H. Blue babies and nitrate-contaminated well water. Environ. Health Perspect. 2000, 108, 675–678. [Google Scholar] [CrossRef]
- Suzuki, H.; Iijima, K.; Moriya, A.; McElroy, K.; Scobie, G.; Fyfe, V.; McColl, K.E. Conditions for acid catalysed luminal nitrosation are maximal at the gastric cardia. Gut 2003, 52, 1095–1101. [Google Scholar] [CrossRef] [Green Version]
- Honikel, K.-O. The use and control of nitrate and nitrite for the processing of meat products. Meat Sci. 2008, 7, 68–76. [Google Scholar] [CrossRef] [PubMed]
- Loganathan, P.; Vigneswaran, S.; Kandasamy, J. Enhanced removal of nitrate from water using surface modification of adsorbents-A review. J. Environ. Manag. 2013, 131, 363–374. [Google Scholar] [CrossRef]
- Research Gate. Available online: https://www.researchgate.net/post/Removal-of-Nitrites-from-Wastewater (accessed on 21 March 2023).
- Peng, Y.Z.; Chen, T.; Tian, W.J. Nitrogen removal via nitrite at normal temperature in A/O process. J. Environ. Sci. Health. Part A Toxic/Hazard. Subst. Environ. Eng. 2003, 38, 1007–1015. [Google Scholar] [CrossRef] [PubMed]
- Mohsenipour, M.; Shahid, S.; Ebrahimi, K. Removal Techniques of Nitrate from Water. Asian J. Chem. 2014, 26, 7881–7886. [Google Scholar] [CrossRef]
- Pourhakkak, P.; Taghizadeh, A.; Taghizadeh, M.; Ghaedi, M.; Haghdoust, S. Fundamentals of Adsorption Technology. In Interface Science and Technology; Ghaedi, M., Ed.; Elsevier: Amsterdam, The Netherlands, 2021; Chapter 1; Volume 33, pp. 1–70. ISBN 9780128188057. ISSN 1573. [Google Scholar] [CrossRef]
- Pourhakkak, P.; Taghizadeh, M.; Taghizadeh, A.; Ghaedi, M. Adsorbent. In Interface Science and Technology; Ghaedi, M., Ed.; Elsevier: Amsterdam, The Netherlands, 2021; Chapter 2; Volume 33, pp. 71–210. ISBN 9780128188057. ISSN 1573-4285. [Google Scholar] [CrossRef]
- How to Lower Nitrite in an Aquarium. Available online: https://fishkeepingguide.net/how-to-lower-nitrite-in-an-aquarium/ (accessed on 10 February 2023).
- Joseph, J.; Radhakrishnan, R.C.; Johnson, J.K.; Joy, S.P.; Thomas, J. Ion-Exchange Mediated Removal of Cationic Dye-Stuffs from Water Using Ammonium Phosphomolybdate. Mater. Chem. Phys. 2020, 242, 122488. [Google Scholar] [CrossRef]
- Alfei, S.; Grasso, F.; Orlandi, V.; Russo, E.; Boggia, R.; Zuccari, G. Cationic Polystyrene-Based Hydrogels as Efficient Adsorbents to Remove Methyl Orange and Fluorescein Dye Pollutants from Industrial Wastewater. Int. J. Mol. Sci. 2023, 24, 2948. [Google Scholar] [CrossRef]
- Babel, S.; Kurniawan, T.A. Low-cost adsorbents for heavy metals uptake from contaminated water: A review. J. Hazard. Mater. 2003, 97, 219–243. [Google Scholar] [CrossRef]
- Kim, S.; Park, C.; Kim, T.H.; Lee, J.; Kim, S.W. COD reduction and decolourisation of textile effluents using a combined process. J. Biosci. Bioeng. 2003, 95, 102–105. [Google Scholar] [CrossRef] [PubMed]
- Safarzadeh, H.; Peighambardoust, S.J.; Mousavi, S.H.; Foroutan, R.; Mohammadi, R.; Peighambardoust, S.H. Adsorption ability evaluation of the poly (methacrylic acid-co-acrylamide)/cloisite 30B nanocomposite hydrogel as a new adsorbent for cationic dye removal. Environ. Res. 2022, 212, 113349. [Google Scholar] [CrossRef]
- Khatooni, H.; Peighambardoust, S.J.; Foroutan, R.; Mohammadi, R.; Ramavandi, B. Adsorption of methylene blue using sodium carboxymethyl cellulose-g-poly (acrylamide-co-methacrylic acid)/Cloisite 30B nanocomposite hydrogel. J. Polym. Environ. 2023, 31, 297–311. [Google Scholar] [CrossRef]
- Alshorifi, F.T.; Ali, S.L.; Salama, R.S. Promotional Synergistic Effect of Cs–Au NPs on the Performance of Cs–Au/MgFe2O4 Catalysts in Catalysis 3,4-Dihydropyrimidin-2(1H)-Ones and Degradation of RhB Dye. J. Inorg. Organomet. Polym. Mater. 2022, 32, 3765–3776. [Google Scholar] [CrossRef]
- Alfei, S.; Zuccari, G.; Russo, E.; Villa, C.; Brullo, C. Hydrogel Formulations of Antibacterial Pyrazoles Using a Synthesized Polystyrene-Based Cationic Resin as a Gelling Agent. Int. J. Mol. Sci. 2023, 24, 1109. [Google Scholar] [CrossRef]
- Alfei, S.; Caviglia, D.; Piatti, G.; Zuccari, G.; Schito, A.M. Synthesis, Characterization and Broad-Spectrum Bactericidal Effects of Ammonium Methyl and Ammonium Ethyl Styrene-Based Nanoparticles. Nanomaterials 2022, 12, 2743. [Google Scholar] [CrossRef] [PubMed]
- Alfei, S.; Spallarossa, A.; Lusardi, M.; Zuccari, G. Successful Dendrimer and Liposome-Based Strategies to Solubilize an Antiproliferative Pyrazole Otherwise Not Clinically Applicable. Nanomaterials 2022, 12, 233. [Google Scholar] [CrossRef] [PubMed]
- Öztürk, N.; Bektaş, T.E. Nitrate removal from aqueous solution by adsorption onto various materials. J. Hazard. Mater. 2004, 112, 155–162. [Google Scholar] [CrossRef]
- Wang, Y.; Zhang, P.; Liu, C.F.; Huang, C.Z. A Facile and Green Method to Fabricate Graphene-Based Multifunctional Hydrogels for Miniature-Scale Water Purification. RSC Adv. 2013, 3, 9240–9246. [Google Scholar] [CrossRef]
- ChemService. La Chimica al Tuo Servizio. Determinazione dei Nitriti Nelle Acque. Available online: https://www.chem-service.it/laboratorio/relazioni-di-laboratorio/197-determinazione-dei-nitriti-nelle-acque (accessed on 10 February 2023).
- He, Z.; Zhang, L.; Peng, G.; Wang, G.; Liang, X. Chemical Redox-Modulated Etching of Plasmonic Nanoparticles for Nitrite Detection: Comparison Among Gold Nanosphere, Nanorod, and Nanotriangle. J. Anal. Test. 2021, 5, 350–359. [Google Scholar] [CrossRef]
- Alshorifi, F.T.; Alswat, A.A.; Mannaa, M.A.; Alotaibi, M.T.; El-Bahy, S.M.; Salama, R.S. Facile and Green Synthesis of Silver Quantum Dots Immobilized onto a Polymeric CTS–PEO Blend for the Photocatalytic Degradation of p-Nitrophenol. ACS Omega 2021, 6, 30432–30441. [Google Scholar] [CrossRef]
- Del Rosso, T.; Louro, S.R.W.; Deepak, F.L.; Romani, E.C.; Zaman, Q.; Tahir; Pandoli, O.; Cremona, M.; Freire Junior, F.L.; De Beule, P.A.A.; et al. Biocompatible Au@Carbynoid/Pluronic-F127 Nanocomposites Synthesized by Pulsed Laser Ablation Assisted CO2 Recycling. Appl. Surf. Sci. 2018, 441, 347–355. [Google Scholar] [CrossRef]
- Miranda-Andrades, J.R.; Pérez-Gramatges, A.; Pandoli, O.; Romani, E.C.; Aucélio, R.Q.; da Silva, A.R. Spherical Gold Nanoparticles and Gold Nanorods for the Determination of Gentamicin. Spectrochim. Acta Part A Mol. Biomol. Spectrosc. 2017, 172, 126–134. [Google Scholar] [CrossRef] [PubMed]
- Del Rosso, T.; Rey, N.A.; Rosado, T.; Landi, S.; Larrude, D.G.; Romani, E.C.; Junior, F.L.F.; Quinteiro, S.M.; Cremona, M.; Aucelio, R.Q.; et al. Synthesis of Oxocarbon-Encapsulated Gold Nanoparticles with Blue-Shifted Localized Surface Plasmon Resonance by Pulsed Laser Ablation in Water with CO2 Absorbers. Nanotechnology 2016, 27, 255602. [Google Scholar] [CrossRef] [PubMed]
- Griess, P. Bemerkungen zu der Abhandlung der HH. Weselsky und Benedikt. Ueber einige Azoverbindungen. Ber. Dtsch. Chem. Ges. 1879, 12, 426–428. [Google Scholar] [CrossRef] [Green Version]
- Carbon Nanomaterials as Adsorbents for Environmental and Biological Applications. In Carbon Nanostructures, 1st ed.; Bergmann, C.P.; Machado, F.M. (Eds.) Springer: Cham, Switzerland, 2015; pp. 1–122. [Google Scholar]
- Nizam, N.U.M.; Hanafiah, M.M.; Mahmoudi, E.; Halim, A.A.; Mohammad, A.W. The removal of anionic and cationic dyes from an aqueous solution using biomass-based activated carbon. Sci. Rep. 2021, 11, 8623. [Google Scholar] [CrossRef] [PubMed]


| Solution | WS Aliquot (mL) | Water Added (mL) | Standard Concentrations (mg/L; mM) | GRS (µL) |
|---|---|---|---|---|
| STD1 | 0.2 | 9.8 | 0.2; 0.0043 | 250 |
| STD2 | 0.3 | 9.7 | 0.3; 0.0065 | 250 |
| STD3 | 0.5 | 9.5 | 0.5; 0.0109 | 250 |
| STD4 | 0.75 | 9.25 | 0.75; 0.0163 | 250 |
| STD5 | 1 | 9 | 1; 0.0217 | 250 |
| STD6 | 2 | 8 | 2; 0.0435 | 500 |
| Blank | 0 | 10 | 0; 0 | 250 |
| Entry | Size | −NH3+ | R1/R2 Concentrations | EDS 1 | EWC 2 | Weight Loss | ESR 3 |
|---|---|---|---|---|---|---|---|
| (µm) | (mmol/g) | (mg */mL)(% wt */v) | (%) | (%) | (%)/min | (%)/min | |
| R1 | 125–250 | 13.20 ± 0.062 | N.A. | N.A. | N.A. | N.A. | (1226)/10 |
| R2 | 16.15 ± 0.062 | (1669)/20 | |||||
| R1HG | 500–550 | 0.9972 ± 0.0057 | 82.7 (8.3) | 900 | 90.0 | (94)/410 | N.A. |
| R2HG | 1.0373 ± 0.0059 | 68.5 (6.9) | 1000 | 90.9 | (94)/340 |
| F | MO | F in MOF | MO in MOF | |
|---|---|---|---|---|
| Qe (mg/g) | 47.8 (R1); 49.0 (R2) | 47.7 (R1); 48.5 (R2) | 65.3 (R1); 65.2 (R2) | 40.3 (R1); 40.3 (R2) |
| Time * | 90 (R1); 20 (R2) | 120 (R1); 30 (R2) | 90 (R1); 60 (R2) | 90 (R1); 30 (R2) |
| Entry | MO | F | MOF | |
|---|---|---|---|---|
| Abs; mg/L * | Abs; mg/L * | Abs; mg/L * | ||
| Not treated | 0.3488 ± 0.0001; 44.3 ± 0.1 | 0.9700 ± 0.0002; 50.3 ± 0.9 | 0.4187 ± 0.0152; 107.0 ± 0.14 2 | 0.6894 ± 0.0037; 71.0 ± 0.14 3 |
| R1HG | 0.0058 ± 0.0013; 0 ** | 0.0039 ± 0.0007; 0 ** | −0.0044 ± 0.0001; 0 2 | −0.0031 ± 0.0002; 0 3 |
| R1HG R (%) 1 | 100 | 100 | 100 | 100 |
| R2HG | 0.0079 ± 0.0009; 0 ** | 0.0047 ± 0.0014; 0 ** | −0.0051 ± 0.0002; 0 2 | −0.0038 ± 0.0001; 0 3 |
| R2HG R (%) 1 | 100 | 100 | 100 | 100 |
| F | MO | F in MOF | MO in MOF | |
|---|---|---|---|---|
| Qe (cal) *(mg/g) | 47.8 (R1); 49.0 (R2) | 47.8 (R1); 47.8 (R2) | 64.5 (R1); 65.4 (R2) | 40.3 (R1); 40.7 (R2) |
| K2 ** | 8.4 (R1); 34 (R2) | 1.6 (R1); 5.5 (R2) | 6.2 (R1); 38.2 (R2) | 5.1 (R1); 15.4 (R2) |
| Kinetic Model | R1 | R2 |
|---|---|---|
| PFO | 0.4374 | 0.1189 |
| PSO | 0.9996 | 1 |
| IPD | 0.5416 | 0.2641 |
| R1 | R2 | |
|---|---|---|
| Qe (cal) *(mg/g) | 21.2 (21.0) # | 23.5 (23.5) # |
| K2 ** | 0.0130 | 18.1 |
| Volume mL | Not Treated Abs (mM) * | R1HG Abs (mM) ** | R2HG Abs (mM) ** |
|---|---|---|---|
| 10 | 0.8559 ± 0.0055 (2.57 ± 0.02) | 0.0040 ± 0.0002 (0.0120 ±0.0006) | −0.0071 ± 0.0002 (−0.0212 ± 0.0006) |
| 15 | 0.1511 ± 0.0002 (0.4521 ± 0.0006) | 0.0894 ± 0.0001 (0.2675 ± 0.0003) | |
| 20 | 0.2066 ± 0.0002 (0.6182 ± 0.0006) | 0.0915 ± 0.0003 (0.2738 ± 0.0009) | |
| 25 | 0.2578 ± 0.0003 (0.7714 ± 0.0009) | 0.0894 ± 0.0003 (0.2675 ± 0.0009) | |
| 30 | 0.2996 ± 0.0007 (0.8964 ± 0.0021) | 0.0909 ± 0 (0.2720 ± 0) | |
| 35 | 0.3069 ± 0.0004 (0.9183 ± 0.0021) | 0.106 ± 0.0002 (0.3172 ± 0.0006) | |
| 40 | 0.3552 ± 0.0004 (1.0629 ± 0.0021) | 0.0911 ± 0.0004 (0.2726 ± 0.0012) | |
| 45 | 0.4072 ± 0.0004 (1.2185 ± 0.0021) | 0.0922 ± 0.0004 (0.2759 ± 0.0012) | |
| 50 | 0.4105 ± 0.0003 (1.2283 ± 0.0009) | 0.0929 ± 0.0002 (0.2780 ± 0.0006) | |
| 55 | 0.4538 ± 0.0004 (1.3579 ± 0.0021) | 0.0976 ± 0.0024 (0.2920 ± 0.0072) | |
| 60 | 0.4571 ± 0.0002 (1.3678 ± 0.0006) | 0.0909 ± 0.0002 (0.2720 ± 0.0006) |
| Volume (mL) | R1HG R (%) | R2HG R (%) |
|---|---|---|
| 10 | 99.53 | 100.00 |
| 15 | 82.41 | 89.59 |
| 20 | 75.95 | 89.35 |
| 25 | 69.98 | 89.59 |
| 30 | 65.12 | 89.42 |
| 35 | 64.27 | 87.66 |
| 40 | 58.64 | 89.39 |
| 45 | 52.59 | 89.26 |
| 50 | 52.20 | 89.18 |
| 55 | 47.16 | 88.64 |
| 60 | 46.78 | 89.42 |
| Kinetic Model | R1HG | R2HG |
|---|---|---|
| PFO | 0.7707 | 0.4111 |
| PSO | 0.8784 | 0.9856 |
| IPD | 0.9873 | 0.3609 |
| R1HG | R2HG | |
|---|---|---|
| K int | 0.2413 | N.A. |
| I | 0.4588 | N.A. |
| Q60 (cal) (mM) | N.A. | 0.2831 |
| K2 | N.A. | 7.3115 |
| Not Treated Abs (mM) * | R1HG-R Abs (mM) ** R (%) | R2HG-R Abs (mM) ** R (%) |
|---|---|---|
| 0.8559 ± 0.0055 (2.57 ± 0.02) | 0.0082 ± 0.0002 (0.02453 ± 0.0006) 99.04 (99.53) *** | 0.0045 ± 0.0002 (0.0135 ± 0.0006) 99.48 (100.00) *** |
Disclaimer/Publisher’s Note: The statements, opinions and data contained in all publications are solely those of the individual author(s) and contributor(s) and not of MDPI and/or the editor(s). MDPI and/or the editor(s) disclaim responsibility for any injury to people or property resulting from any ideas, methods, instructions or products referred to in the content. |
© 2023 by the authors. Licensee MDPI, Basel, Switzerland. This article is an open access article distributed under the terms and conditions of the Creative Commons Attribution (CC BY) license (https://creativecommons.org/licenses/by/4.0/).
Share and Cite
Alfei, S.; Orlandi, V.; Grasso, F.; Boggia, R.; Zuccari, G. Cationic Polystyrene-Based Hydrogels: Low-Cost and Regenerable Adsorbents to Electrostatically Remove Nitrites from Water. Toxics 2023, 11, 312. https://doi.org/10.3390/toxics11040312
Alfei S, Orlandi V, Grasso F, Boggia R, Zuccari G. Cationic Polystyrene-Based Hydrogels: Low-Cost and Regenerable Adsorbents to Electrostatically Remove Nitrites from Water. Toxics. 2023; 11(4):312. https://doi.org/10.3390/toxics11040312
Chicago/Turabian StyleAlfei, Silvana, Valentina Orlandi, Federica Grasso, Raffaella Boggia, and Guendalina Zuccari. 2023. "Cationic Polystyrene-Based Hydrogels: Low-Cost and Regenerable Adsorbents to Electrostatically Remove Nitrites from Water" Toxics 11, no. 4: 312. https://doi.org/10.3390/toxics11040312