
Logistics Sector Turnover: Forecasting for Turkey, EU27 and EA19 under Effects of COVID-19

1
Industrial Engineering Department, Faculty of Engineering, University of Turkish Aeronautical Association, Ankara 06790, Turkey
2
Logistics Management Department, Faculty of Management, University of Turkish Aeronautical Association, Ankara 06790, Turkey
*
Author to whom correspondence should be addressed.
Logistics 2023, 7(2), 23; https://doi.org/10.3390/logistics7020023
Submission received: 12 February 2023
/
Revised: 23 March 2023
/
Accepted: 29 March 2023
/
Published: 7 April 2023
(This article belongs to the Section Artificial Intelligence, Logistics Analytics, and Automation)
Abstract
:Background: The logistics sector is the backbone of today’s global trade, and is vital for the continuity of goods and services. The sector is gaining increased importance as logistics operate under the extreme conditions the world is passing through (COVID-19, earthquakes, wars). Methods: A comparative study is offered for Turkey and the EU27 and EA19 countries utilizing Eurostat database time series data for logistics turnover, based on regression analysis with and without COVID-19-affected data. General trends are identified regarding the logistics turnover and average turnover by different transportation modes in Turkey. Linear, exponential, logarithmic and polynomial regressions are fitted to the dataset to find the best fit. Afterwards, forecasting is performed based on the polynomial equation, which is identified as the best fit. A similar approach is repeated for the EU27 and EA19 countries to put forward the trends and forecasts as well as a detailed comparative discussion among countries. Results: Our study reveals the dramatic effect of COVID-19 on the turnover of different logistics modes and the radical shift that Turkey experienced from land transportation towards air transportation. Conclusions: Our study provides forecasting and a comparative picture for the logistics sector, shows the growth trends with respect to different transportation modes and reveals the effects of the pandemic on the logistics sector for Turkey and the EU27 and EA19 countries.
1. Introduction
In today’s global and networked world, logistics are the backbone of global trade [1] and lifeblood of supply network activities. Logistics activities are essential for the continuity of goods and services flows [2]; they are directly related to the reliability, overall quality and performance of the supply chains [3] and trade relationships between countries [4]. Logistics performance plays a vital role for developing countries to increase their share in global trade. It develops in parallel to globalization, and provides cost savings to companies seeking differentiation [3,4,5,6,7]. Logistics becomes the most important factor for globally competing companies to provide the products and services with correct quantities, timing and location at the right cost. With improvements in logistics, countries with high logistics performance exhibit larger international trade volumes, product variability and foreign capital investments. By having a vital impact on reducing costs and affecting customer satisfaction, logistics can be considered a significant strategic factor to gain a global competitive advantage [4,8,9] and fundamental for the global competitiveness, profitability and survival of an enterprise [10].
Formerly considered within the limited scope of transportation, logistics has assumed an increasingly integrated and strategic character with broadened scope [5,11,12], determining the survival of enterprises as well as supply networks. As such, enterprises must develop intimate relations with logistics providers, which appear as one of the vital sets of relations.
The sector gains an increasing share of the economy each year [13] and the demand for product transportation shows very strong empirical connection with economic growth [5,14]. Economies and international trade are heavily dependent on transportation logistics [1,15,16,17]. Within the globalization context, effective logistics systems are considered a key component of expanding exports, and powerful logistics infrastructures are supported to positively affect exports [18]. As such, logistics performance is a critical predictor for the economic growth of a country [19]. Logistics and transportation have a significant and positive effect on economic growth by disseminating trade, enabling infrastructure development and contributing to the increase in business investments. Hence, investments made in the transportation sector positively support economic growth, especially in countries with high trade volume. For example, one of the main reasons for the growth of Hong Kong and Singapore’s economies is the investments made in the transportation and logistics sectors [20].
Regulations, infrastructure, technology and integration are four crucial drivers for obtaining a competitive advantage in logistics [15]. Regional, geographical and country-based conditions affect the development of these conditions, resulting in significant variability in terms of the performance of the countries. Undoubtedly, the mode of transportation utilized (land, water, air, rail, pipeline) assumes a critical importance in logistics, each mode having its own characteristics, advantages and disadvantages [15,21,22,23]. Finding the correct hybrid of these modes within the concepts of intermodal and multimodal transportation determines the overall cost, lead time, effectiveness and efficiency of the activities [21,24,25]. The development of relevant infrastructure is vital in logistics performance. The quality of logistics infrastructure, number and network of intermodal facilities, number of logistics service providers, and availability of airports and seaports are undoubtedly key infrastructural factors for gaining an international competitive advantage.
COVID-19 affected multiple sectors and multiple aspects of human life. It radically shaped e-learning systems [26], affected tourism [27] and resulted in labor market dislocations [28]. With the pandemic, the logistics sector gained even more importance for the continuity of material and money flows. The pandemic resulted in changing logistics demands, transportation capacity restrictions and network disruptions, as well as a change in the service modes and cost structures [23,29]. It reduced supply availabilities and increased demands in essential goods [30]. The pandemic has negatively affected all dimensions, dynamics and modes of transportation [28,31]. Along with the pandemic, a boom was experienced in retail cargo transfers during lockdown periods which required deliveries of a variety of items to individual homes, with an unprecedented amplification in e-commerce [32,33]. Additional demands and challenging logistics and transportation requirements appeared regarding medical supplies (such as protective masks, disinfectants, medicine), blood demand [34] and food [35]. Sudden cold chain requirements happened due to vaccine transportation and distribution. The very recent and dramatically devastating earthquake in Turkey and Syria once again put forward the vital importance of logistics. Totally unexpected and dramatic logistics requirements can arise which have to be handled in a very short time for all sorts of supplies. In this context, logistics has become one of the most demanded and vital sectors during extreme conditions with an amplified importance.
This study is motivated by this increased importance of logistics under extreme conditions the world is passing through. The aim is to put forward trends and forecasts for Turkey, as well as the EU27 (twenty-seven European Union countries excluding UK) and EA19 (nineteen European countries using euro) countries, in a comparative manner to reveal the effects of the COVID-19 pandemic. Therefore, this article attempts to answer the following research question:
“How are the general trends and logistics sector turnover growth forecasts for Turkey, EU27 and EA19 countries compare and contrast under pandemic affect?”.
The article is of interest for logistics practitioners and researchers. By providing an overall sectoral perspective, this study also provides insight for policy- and decision-makers for their prioritization and investment efforts.
The section structure for the rest of the article is as follows: After offering the literature review in Section 2, the methodology is provided in Section 3. General trends for logistics sector turnover for Turkey are identified and discussed in Section 4. Section 5 provides analysis and evaluation, including forecasting based on regression for logistics sector turnover in Turkey (Section 5.1) and comparative trend analysis and forecasting against EU19 and EU27 countries (Section 5.2). Section 6 includes the discussion, and Section 7 provides a conclusion and further research suggestions.
2. Literature Review
In the literature review, a brief overview of the general trends shaping the logistics sector is first provided. Then, the leading countries in the sector are examined to provide a global perspective. Afterwards, the global positioning of Turkey in logistics is explored to provide the country-level view. Then, an overview of time-series-based approaches in relation to logistics under COVID-19 is provided.
This review section is organized into the following subsections:
- Main trends in logistics;
- Leading countries in logistics;
- Global positioning of Turkey in logistics;
- Time-series-based approaches in logistics under COVID-19.
2.1. Main Trends in Logistics
The main logistics trends in today’s technology-intensive business world can be briefly summarized as outsourcing of logistics activities; technological and IT-related developments in logistics; and the rise of logistics centers and villages.
Outsourcing the logistics activities to partners which have developed relevant core competencies has resulted in the establishment of long-term partnerships with logistics providers with different scopes of capabilities and roles within the overall supply network. Thus, the use of logistics providers became a commonly accepted part of doing business for economic benefits, survival and competitiveness [12,36,37,38,39,40], with a variety of drivers, motivations and benefits [12,41,42,43,44]. Logistics providers have started to assume increasing responsibilities in widening process scopes [38,43], and logistics is supported to be one of the most outsourced activities [45], with the concept of “logistics service level” assuming increasing importance.
Breakthrough developments in IT and the recent concepts of autonomous vehicles, drones, robotics, blockchains, cloud, Industry 4.0, IoT, big data, artificial intelligence, big data and analytics are undoubtedly major game-changers for the logistics sector, leading to the concepts of “smart logistics”, “logistics 4.0” and “collaborative logistics” [45,46,47,48]. These technologies are utilized along with the rather mature technologies of RFID, sensors and vehicle tracking systems. Leveraged and hybrid use of these innovative technologies provides logistics and supply chain partners with digitalization, automation and unprecedented degrees of online real-time visibility and connectivity, enabling collaboration across the network [49,50]. All transportation and logistics activities, including import/export and customs clearance, are tracked and traced transparently across partners. Hence, the management of logistics activities are becoming increasingly automated, integrated and traceable to provide overall supply chain transparency and cross-partner collaborations with real-time analytics.
With globalization and competition, use of logistics centers also assumed significant importance as one of the most critical policies to develop the trade potential and obtain more efficient logistics operations [51,52]. Logistics center applications are increasingly utilized in a number of countries ranging from the Far East to the US. In Europe, there are more than 60 logistics centers in Turkey, Denmark, Italy, Hungary, Spain, Greece, Ukraine, Portugal, France and Luxembourg [53]. With initial applications appearing as seaports and airports, these centers evolved to the point where all logistics-related activities are conducted with integrated transportation systems [54]. They are beneficial for providing more than one type of logistics activity, including transportation, smart warehousing, vehicle maintenance, distribution facilities and additional support services such as vehicle renting and parking [6].
In a similar direction, the concept of a logistics village is also becoming widespread in Europe. They refer to places where all logistics activities regarding national and international freight are executed and coordinated. The activities they provide include not only warehousing but also many others such as assembly, customization, distribution and reverse-logistics. Thus, logistics centers and villages ensure coordinated, planned, systematic and organized execution of all the logistics-related activities. Ten European countries—Greece, France, Germany, Spain, Italy, Denmark, Luxembourg, Portugal, Ukraine and Hungry—have a large number of operating logistics villages [51,55]. Logistics villages in France were one of the first applications; for example, Garanor in Paris and Sogaris. In Italy and Germany, the concept started in the 1970s. The idea, which originated in the USA, was adopted in Europe, its diffusion happening in the 1980s and 1990s; assimilation gained speed in France, Germany, Italy, Holland, Belgium and the UK [21,52,56].
2.2. Leading Countries in Logistics
When considered globally, the USA, England, Singapore, Japan, Germany, Holland, France and Sweden appear as the main countries that stand out in the logistics context; the USA and Europe have more than half of the logistics market [57]. Global companies such as DHL, UPS, BAX, Ryder System and Caterpillar Logistics are among the most important logistics provider companies conducting operations all across the globe [7]. Dubai and Hong Kong again gained momentum towards becoming main logistics bases, considered as part of the regions which will be significantly developed in the Asia-Pacific, Eastern Europe, Russia and the Middle East [57].
European countries forming a bridge between East and West, such as Bulgaria, Italy, Poland, Spain, Belgium and Germany own important logistics centers. Poznan in Poland, Zaragoza and Barcelona in Spain, Trieste in Italy, Varna in Bulgaria, Hamburg in Germany, Antwerp in Belgium and Rotterdam in Holland are the major examples. Amsterdam Schiphol Airport can be mentioned again as one of the most important airports for freight [45,57]. Logistics sector is experiencing a constant growth and Western-European countries (and Poland) are the leading countries.
Having DHL, Maersk, Schenker, TNT and Kuehne Nagel as important service providers, Germany is one of the most important logistics centers of Europe [7]. Logistics is among the top three sectors in Germany, having advanced transportation infrastructure and borders with nine European countries, sitting at the center of transportation networks, and having superiority in railway and highway networks when compared with other European countries [57].
Singapore, being one of the major countries for logistics, has the largest port and the most important logistics center of the world. Malesia and Thailand also have critical logistics centers. DHL, Schenker, Linfox, UPS, Nippon Express, TNT and Kuehne Nagel are the critical logistics companies in the region. Land way and inland waterway transportation is developing in China, whereas railways are distributed and slow. The main international logistics providers can be mentioned as DHL, TNT, FedEx and UPS [7].
2.3. Global Positioning of Turkey in Logistics
Due to its geographic importance at the intersection of three different continents and being at the epicenter of transport corridors connecting Europe to the Caucasus, Asia and Middle East [58], Turkey has significant geopolitical advantages which enable all transportation modes and shipments [21,57,59]. Undoubtedly, a strategic target is to make Turkey a global logistics base with its geopolitical position [57].
In Turkey, logistics is gaining more and more importance, with the share of transportation and warehousing activities in GDP steadily on the rise. Land transportation has the greatest share, followed by railway and pipeline [21,59]. The logistics sector is one of the key sectors given priority in Turkey, and the importance attributed to the sector is evident when considering investments [60]. At this point, investments made in air transportation infrastructure in recent years are worth highlighting [61]. The recently constructed İstanbul Airport is an example of the giant investments in this regard, further increasing the strategic importance of the city as one of the main global hubs. Logistics village infrastructure is also developing, and various logistics villages are being established. The first logistics village in Turkey was established starting in 2006; various logistics villages are established in different regions. Its maritime transportation as well as 3PL services in Turkey have potential for further development within the scope of transforming Turkey into a logistics hub [58].
Based on The World Bank International LPI (logistics performance index) calculated using the dimensions of customs, infrastructure, international shipments, logistics competence, tracking–tracing and timeliness, Turkeys’ position is provided in the below table.
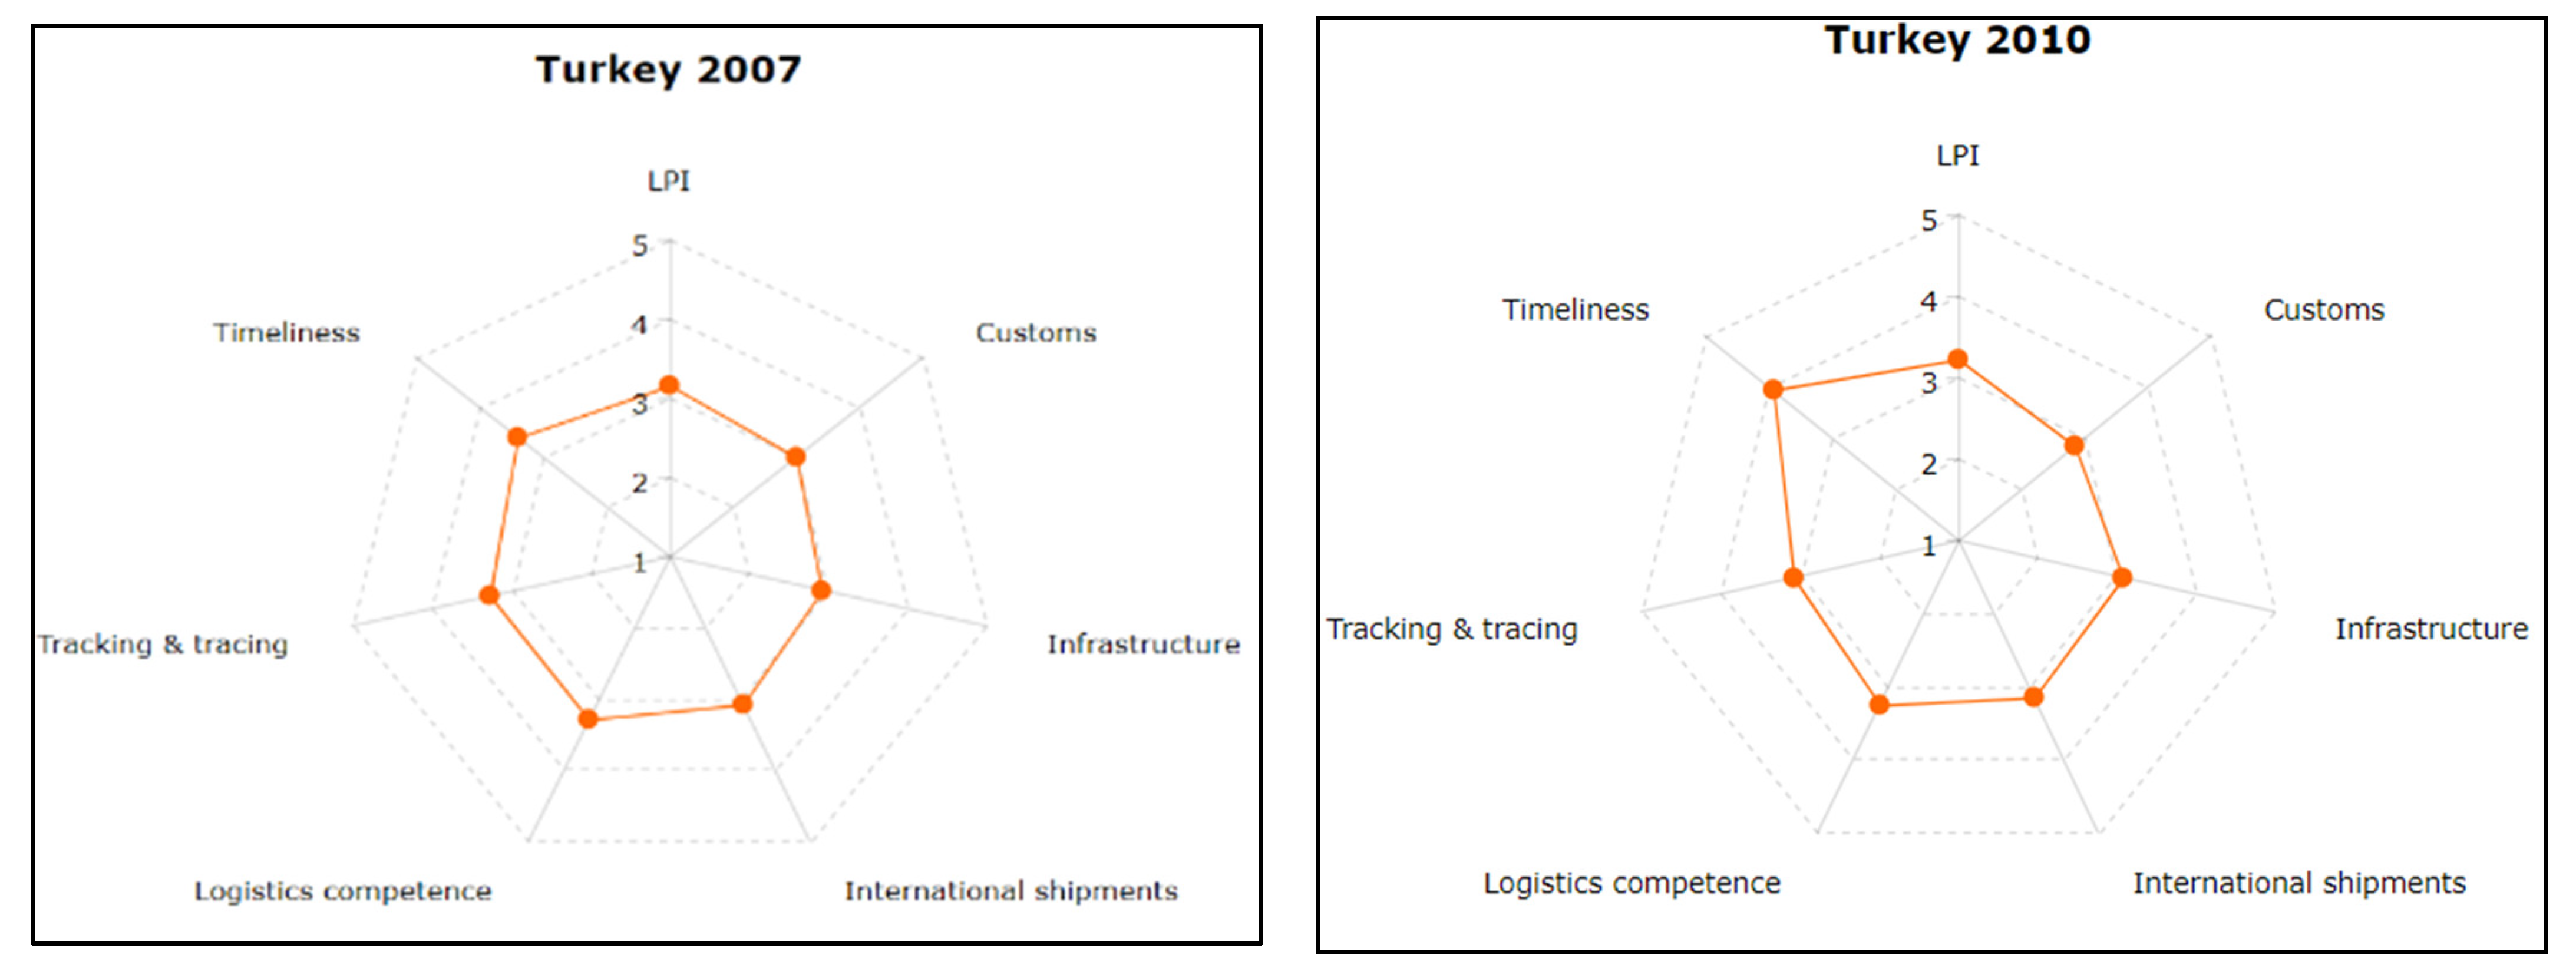
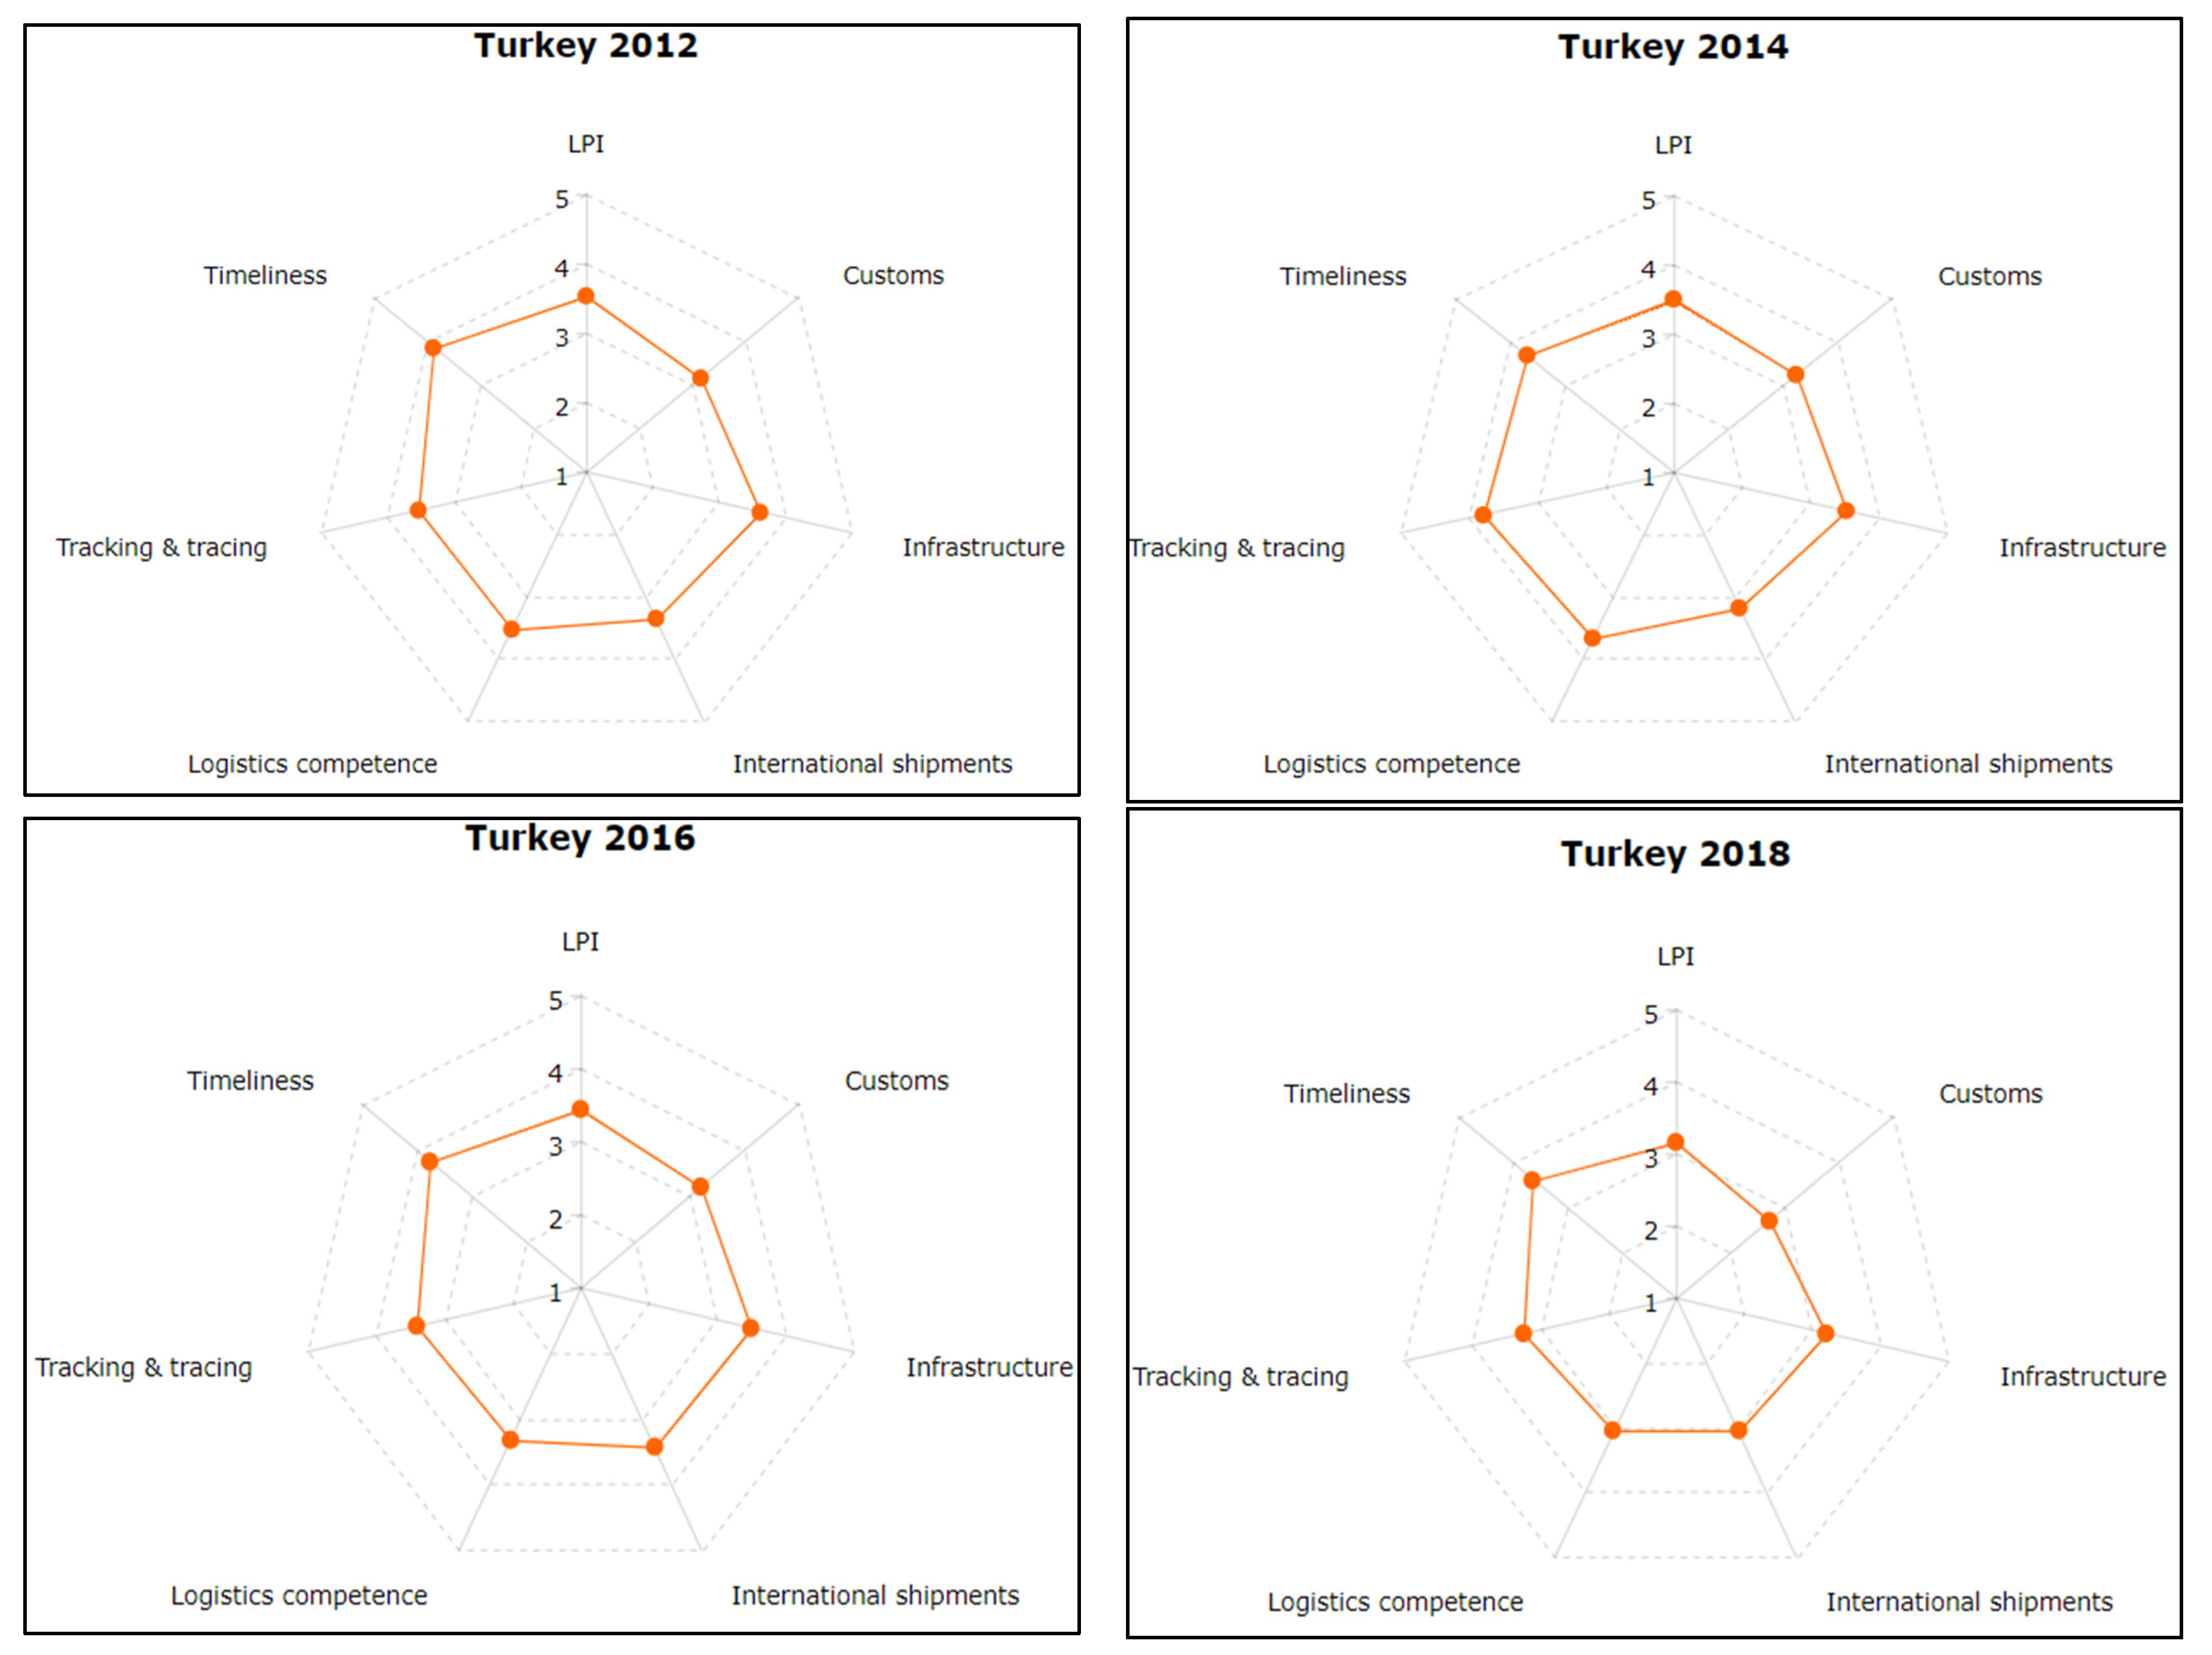
Table 1 clearly shows a significant decline for Turkey’s position despite all the investments and priorities provided to the sector. It can be easily argued that Turkey is not using its full potential in the logistics sector. The following set of six radar charts provided in Figure 1 shows the position of Turkey in different sub-dimensions of LPI through years.
It can be observed that: (a) the timeliness dimension showed an increase from 2007 to 2012 and declined slightly until 2018; (b) the tracking and tracing dimension stayed roughly the same in the time interval of 2007–2018; (c) logistics competence again stayed roughly the same; (d) international shipments showed an increase from 2007 to 2010, then dropped to the level of 2007; (e) the infrastructure index showed a slight increase during 2007–2018; and (f) a radical drop is observed in the customs dimension.
Based on “production value by economic activities” in the Turkstat database, Table 2 shows the percent share of each transportation mode in logistics turnover for Turkey.
In Table 2, the first column shows a significant decrease in the share of land transportation and transport via pipelines from 57.58% to 44.72% within a 10-year period, and an increase in the share of air transport from 13.54% to 22.82% in the overall turnover. This supports the overall transformation of the logistics infrastructure and activities of Turkey from land transport to air transport.
2.4. Time-Series-Based Approaches in Logistics under COVID-19
Various studies in the literature indicate the multiplicity of methods and approaches used in relation to COVID-19 and logistics/supply chains, ranging from mixed integer modelling and simulation to stochastic approaches, petri-nets and bibliometric analysis [64,65,66,67,68].
As is important in all sectors, objectively analyzing the trends and making forecasts is vital in logistics and supply chains [69]. In this context, various time-series-based approaches are fundamental under “quantitative” forecasting techniques [69,70,71].
Time-series data are a sequence of vectors dependent on time (past data), utilized to make estimations [70]. Regression is a fundamental approach to assess the results of the changes of the independent variable on the dependent variable [72]; regression analysis can be further classified into univariate and multivariate regression, based on the number of variables involved [73].
Various forms of time series analysis and regression analysis are frequently used in relation to different aspects of transportation and logistics-related studies, such as transport mode choices, logistics performance and effects of digitalization [74,75,76,77,78,79]. SARIMA modelling is used to forecast the COVID-19 impact in container throughput in a maritime context [80]. Again, in the maritime context, the study in [81] provides time-series analysis conducted to reveal the performance of the car carrier shipping sector. A multivariate time-series deep learning model is used to forecast the blood demand during COVID-19 in [34]. In an air passenger transportation context, the air passenger load factor is forecasted in [31] using the variables of available seat kilometer, revenue passenger kilometer, passenger load factor, gross domestic products and domestic and international passenger numbers. The study in [75] uses univariate multilinear regression to find the potential number of passengers.
Consequently, regression based on the available time-series data is a frequently used method in the literature in the context of different logistics and transportation modes and aspects.
This study differs from the studies in the literature by providing a comparative and comprehensive picture of Turkey, EA19 and EU27 countries.
3. Methodology
3.1. Data Gathering/Dataset Description
In this paper, regression analysis is performed using the time-series data from the Eurostat database [82].
While obtaining the data, classification of economic activities is selected as “transportation and storage” with the NACE (Nomenclature of Economic Activities) Rev.2 code of “H”. The business trend indicator is selected as “total index of turnover”, with the unit of measure “index (2015 = 100)”. Monthly, seasonal and calendar-adjusted data are used for the time interval January 2009–January 2021, corresponding to a time series of 145 monthly data obtained for Turkey, EU27 and EA19 countries. The index of turnover is selected to be an indicator of the overall business value of the logistics sector and monetary contribution to the sector for the economy.
3.2. Methodological Flowchart
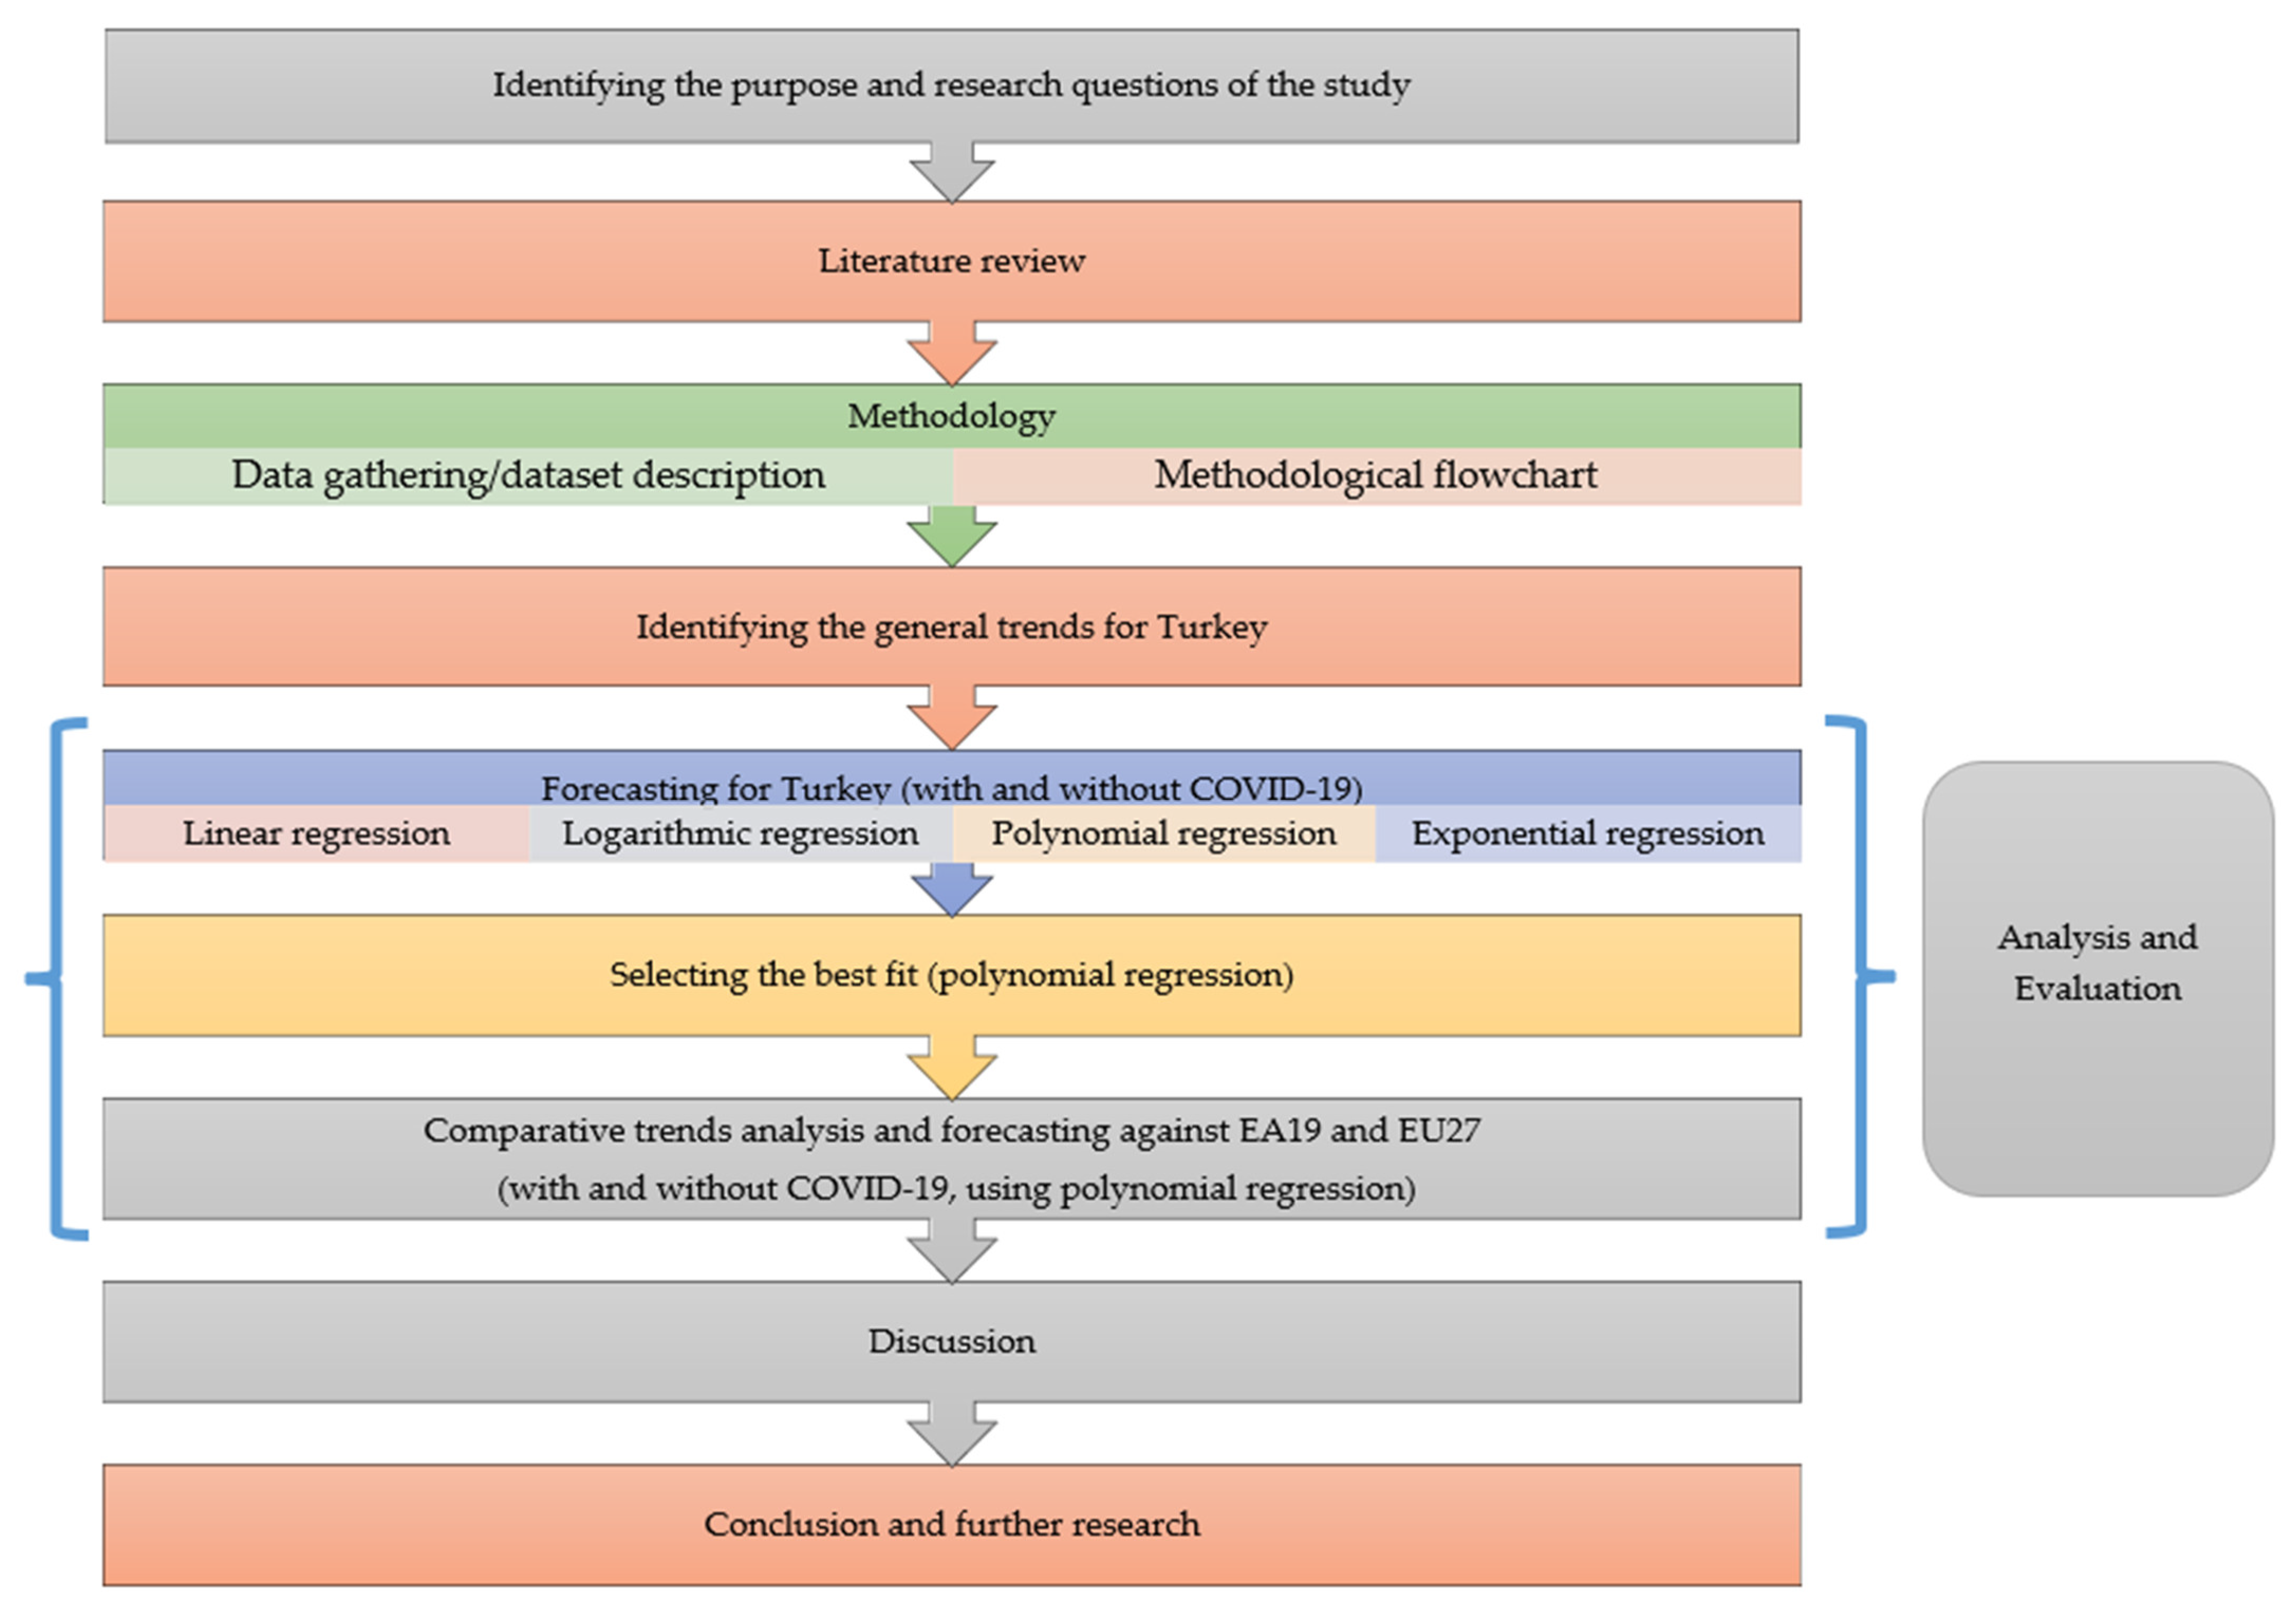
Using the above-described dataset, the approach provided in the following methodological flowchart (Figure 2) is used in the study.
General trends are identified regarding the turnover and average turnover by different transportation modes in Turkey. Afterwards, different regression equations (linear, exponential, logarithmic and polynomial) are fitted to the dataset to find the best fit for Turkey. Regression equations are determined for each case.
R2 values are used for evaluating the goodness of fit which is practically evaluated as a fit for values higher than 0.70 [83]. Afterwards, forecasting is performed based on the polynomial equation, which is identified to be the best fit. While deciding on the forecasting horizon, it is generally considered appropriate to use 20 percent of the total sample size [84,85]. For the dataset used, 20 percent of 145 periods is approximately 30 periods. Therefore, horizon is extended by 30 periods and forecasted values are determined until the end of July 2023 for Turkey. A similar approach is repeated for EU27 and EA19 countries to analyze the trends, make forecasts with polynomial regression and provide a comparative trend analysis. Predicted mean percent errors are calculated over the dataset for the forecast horizon.
To demonstrate the impact of COVID-19, all the above-mentioned regression cases are re-performed by including and excluding 11 periods of data starting from March 2020 to January 2021, during which COVID-19 conditions prevailed.
4. Logistics Sector Turnover in Turkey: General Trends
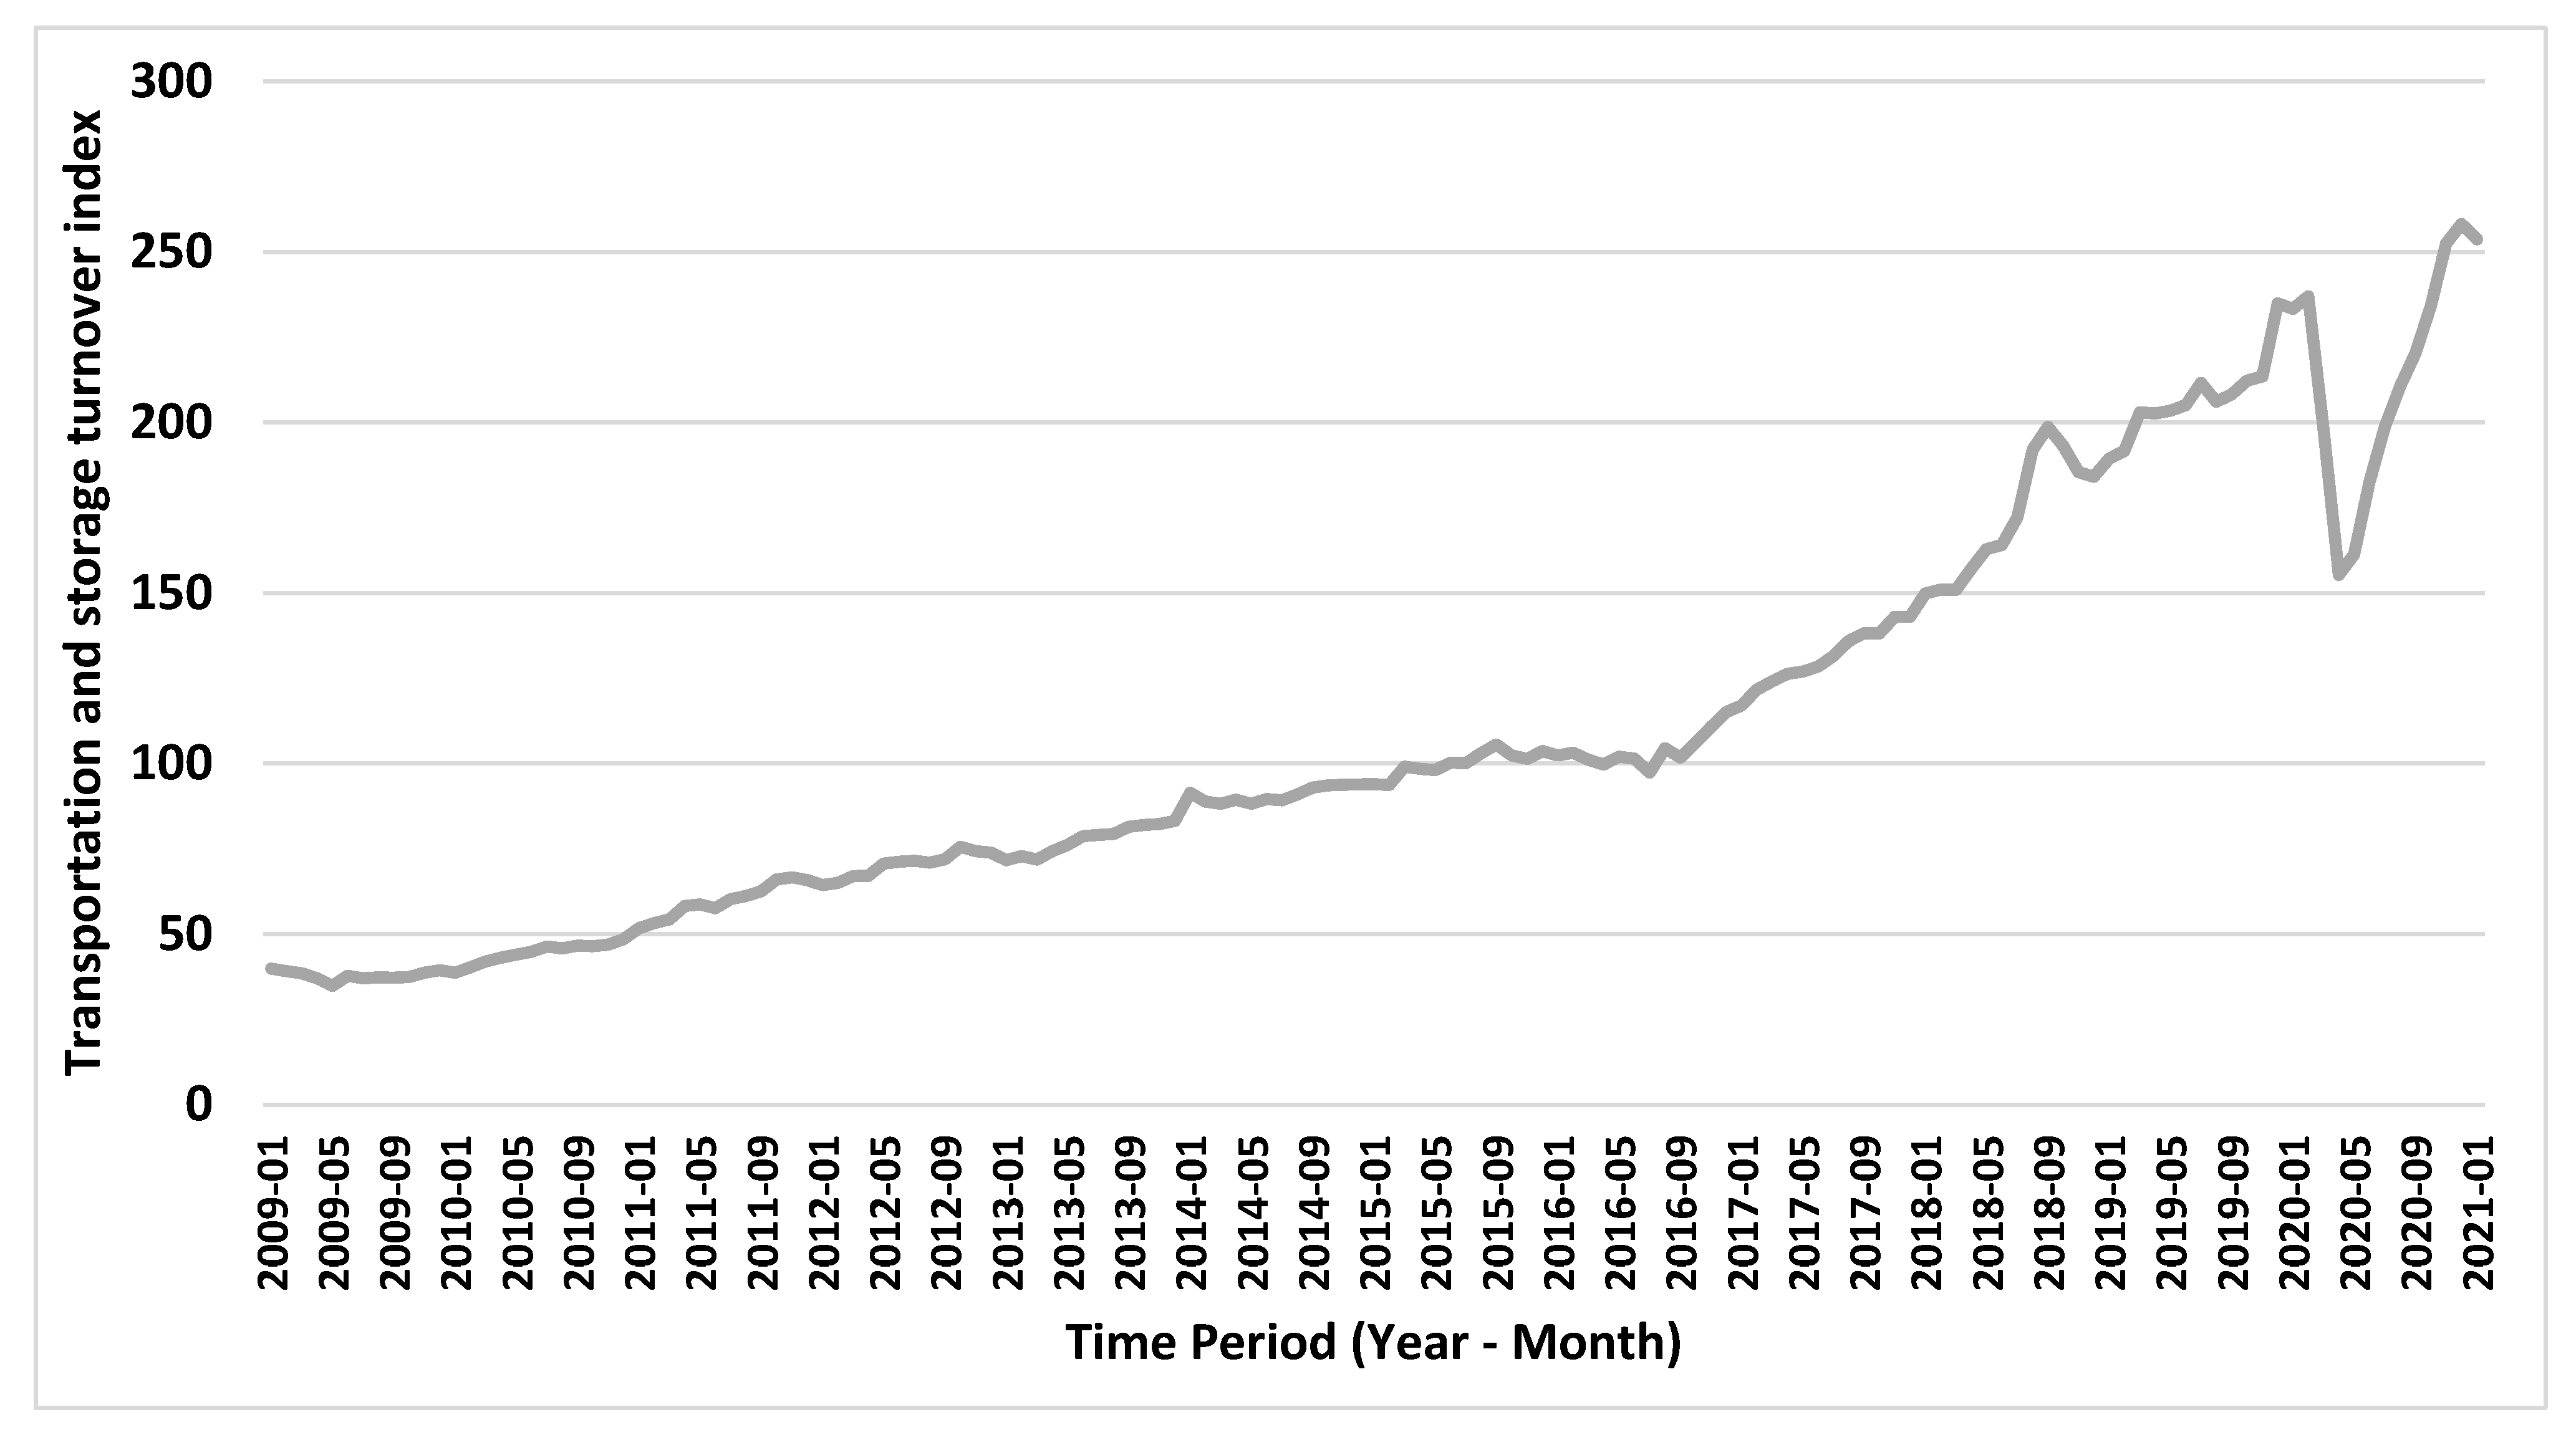
The plot in Figure 3 offers the turnover index against time period for transportation and storage turnover. This indicator is selected as the overall representation of the logistics sector in Turkey. This graph shows a steady rise during the period January 2009 to September 2016. For the interval October 2016 to January 2020, the graph shows again an increasing trend with a higher slope value. Starting with the 2020 data, a drastic drop in the turnover is observed until April 2020, after which a sudden recovery is observed. Apparently, this change in the pattern can be related with COVID-19.
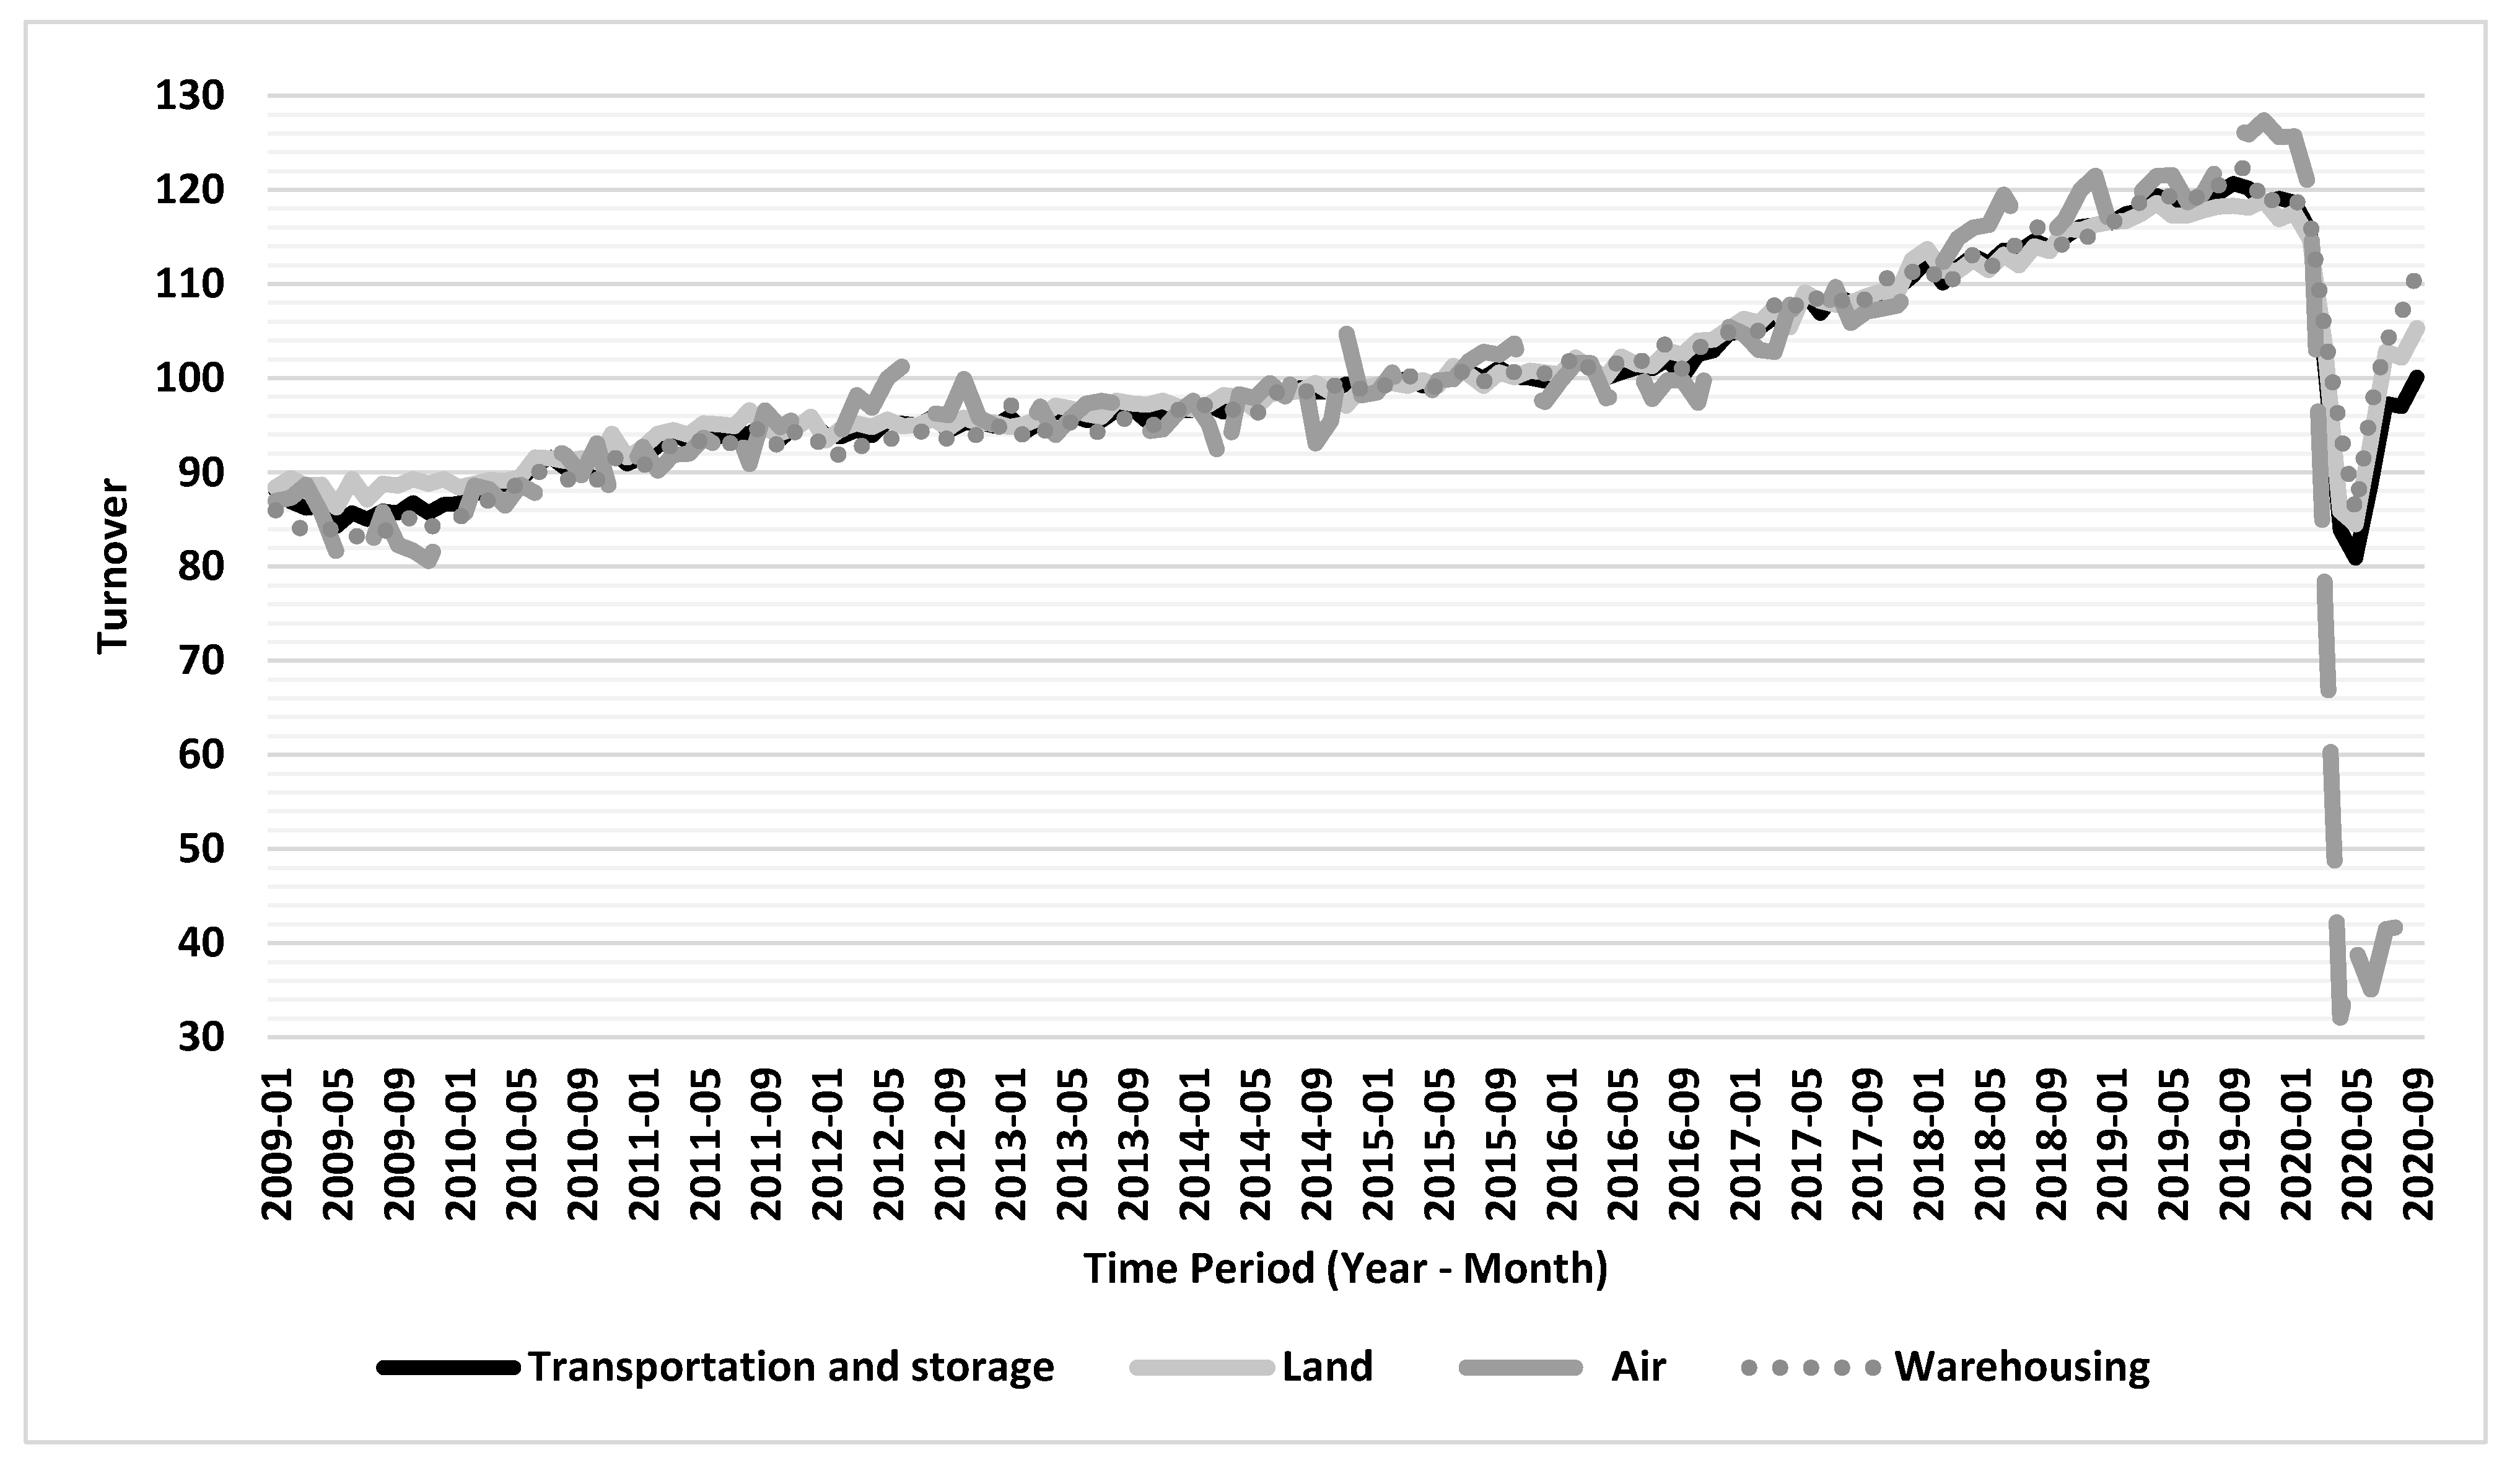
Figure 4 shows the average turnover of transportation and storage, as well as its breakdown in terms of different transportation modes utilized (land, water, air, warehousing, postal). In this classification, the land mode covers “land transport and transport via pipelines”, warehousing includes “all warehousing and support activities for transportation”, and postal contains “postal and courier activities”.
Figure 4 indicates that different transportation modes exhibit similar trends up until January 2017 except for an extreme point of water transportation in January 2014. For the corresponding region from February 2017 to February 2020, the air transportation mode and warehousing activities exhibited a volume higher than the average. Starting from March 2020, a sudden drop is observed for all the modes, experienced more dramatically in air transportation. The graph clearly shows that warehousing activities exhibit an increase more than the average. This growth of warehousing activities started in February 2017, and continued to rise more than the average behavior of the other modes.
Due to pandemic effects, warehousing also experienced a sudden drop until May 2020 along with the other activities. After this period, a steep recovery that is above the average of the other modes is observed for warehousing. This can be explained by all the disruptions in material flows including raw material purchases, manufacturing processes and buildup of semi-finished and finished goods inventories due to pandemic-affected shrinking of economic activities. It is important to highlight that air transportation seems to be more negatively affected when compared to the other modes. Undoubtedly, air traffic shut downs due to pandemic are the main reason for this situation. While the other transportation modes were active, air transportation experienced closures in the initial days of the pandemic.
Before the pandemic, air and land transportation are above the average. However, it is observed that starting with 2021 this situation is reversed and they turned out to be below the sectoral average. Hence, pandemic conditions appeared to change the relative positioning of these modes on the graph. It is also worth mentioning that water transportation stayed above the average during pandemics.
5. Analysis and Evaluation
5.1. Logistics Sector Turnover in Turkey: Forecasting Based on Regression
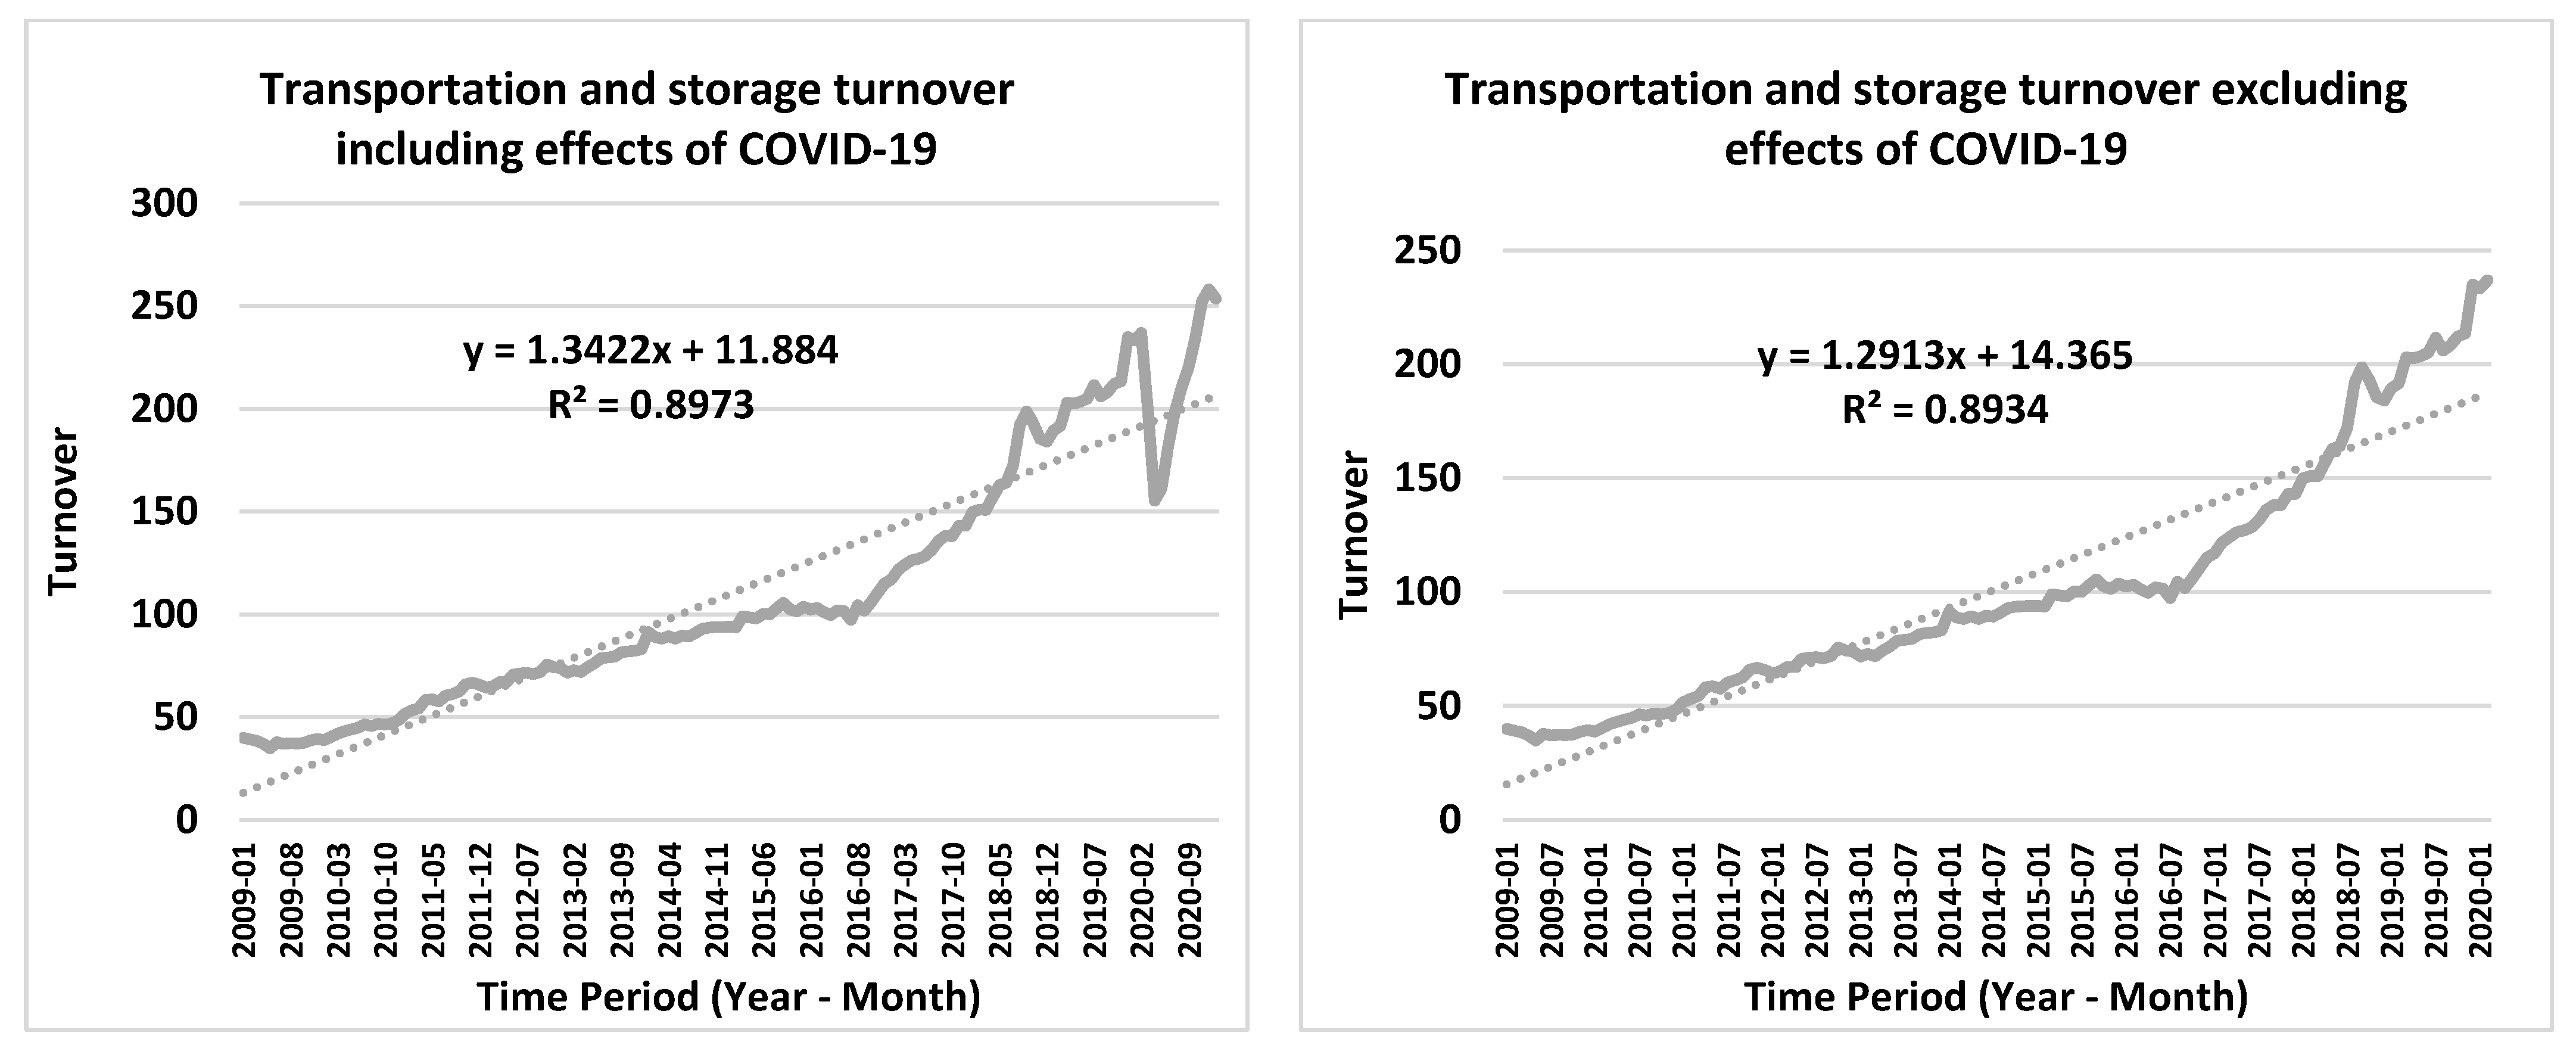
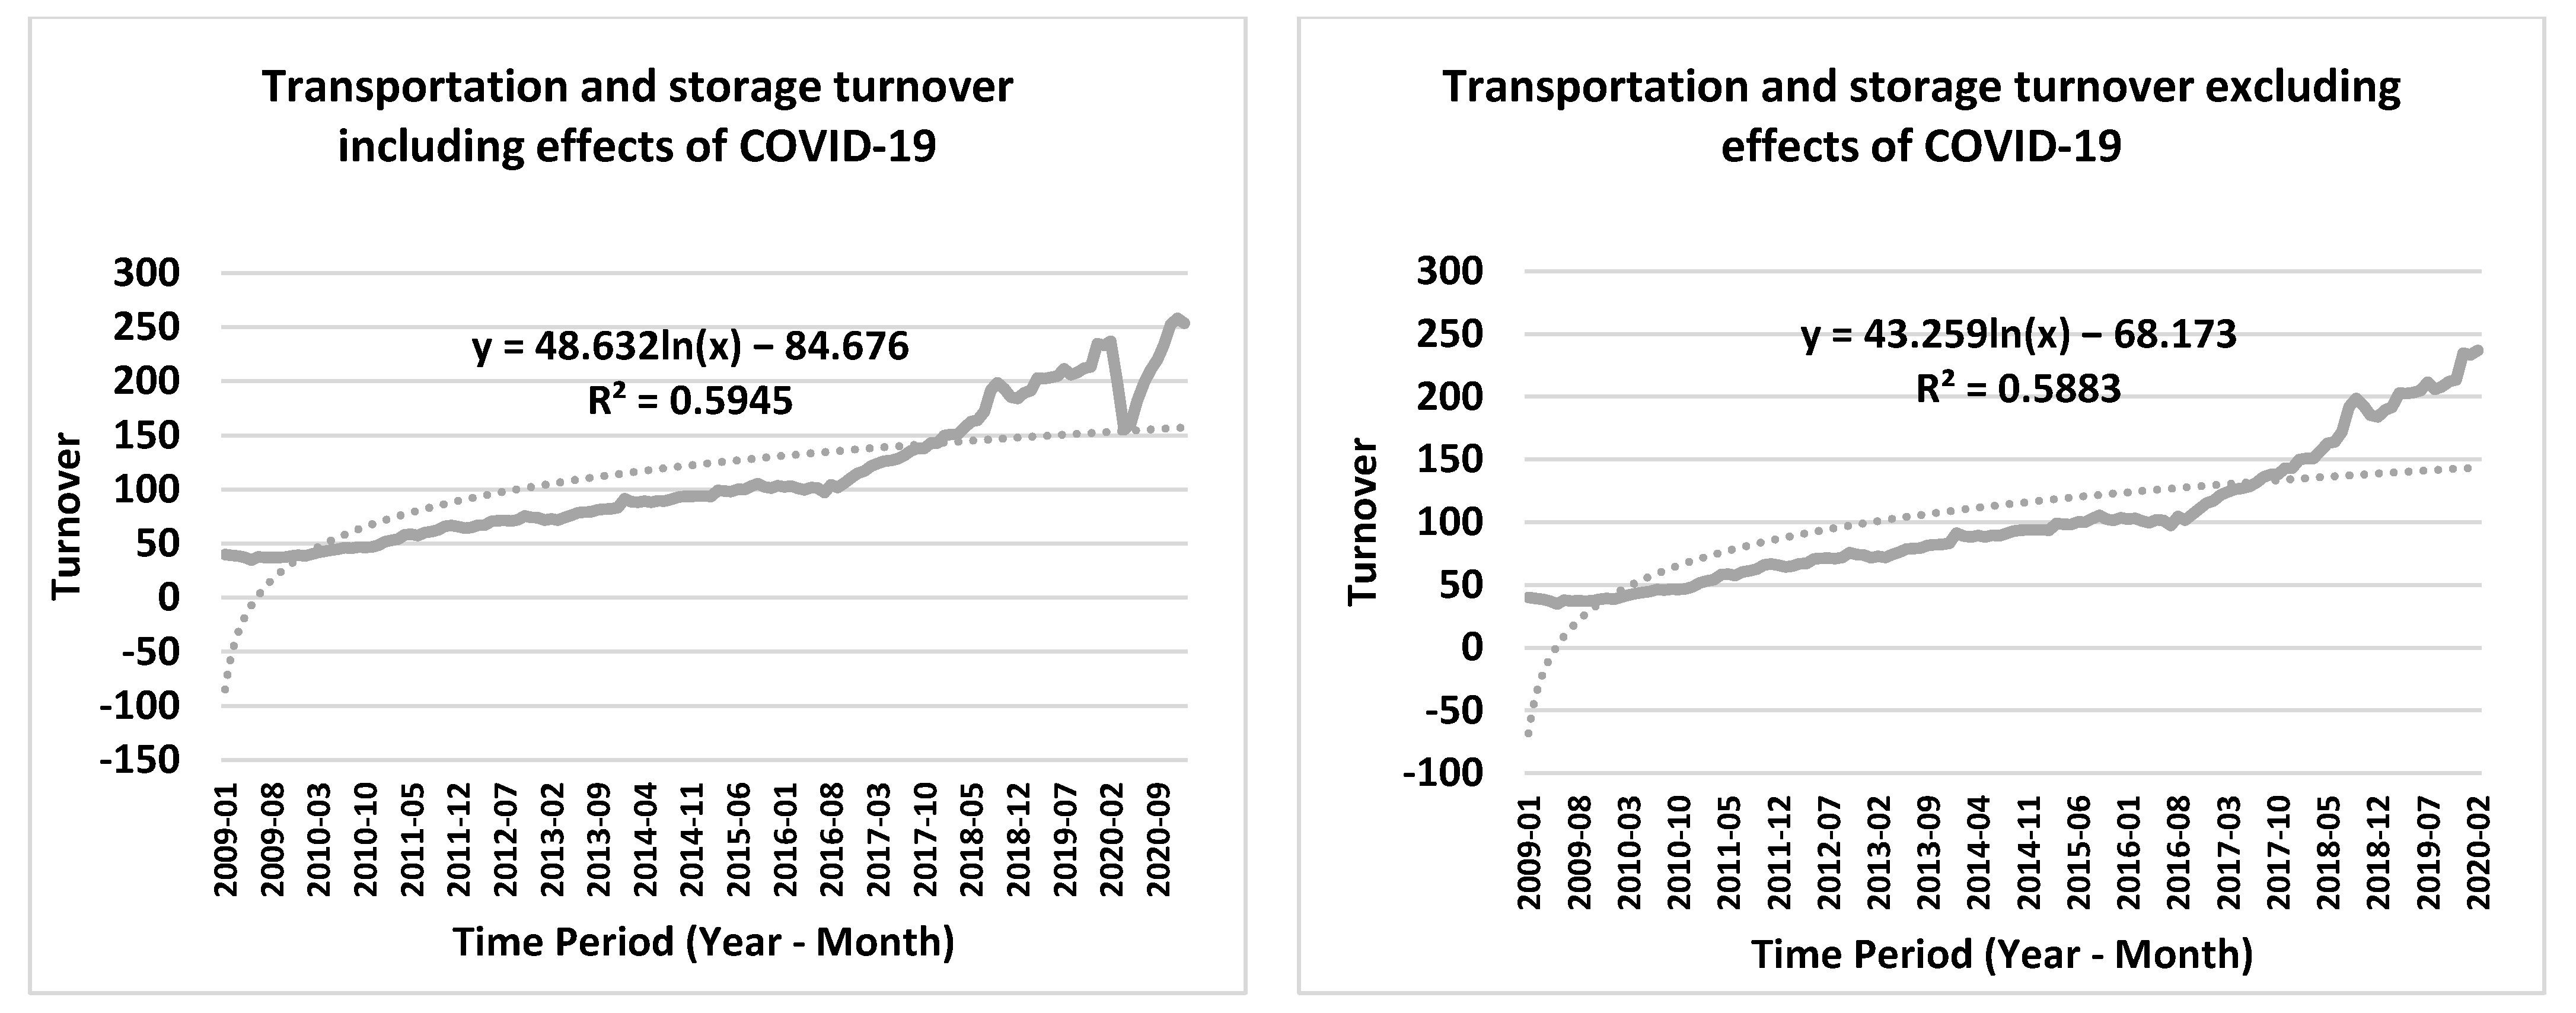
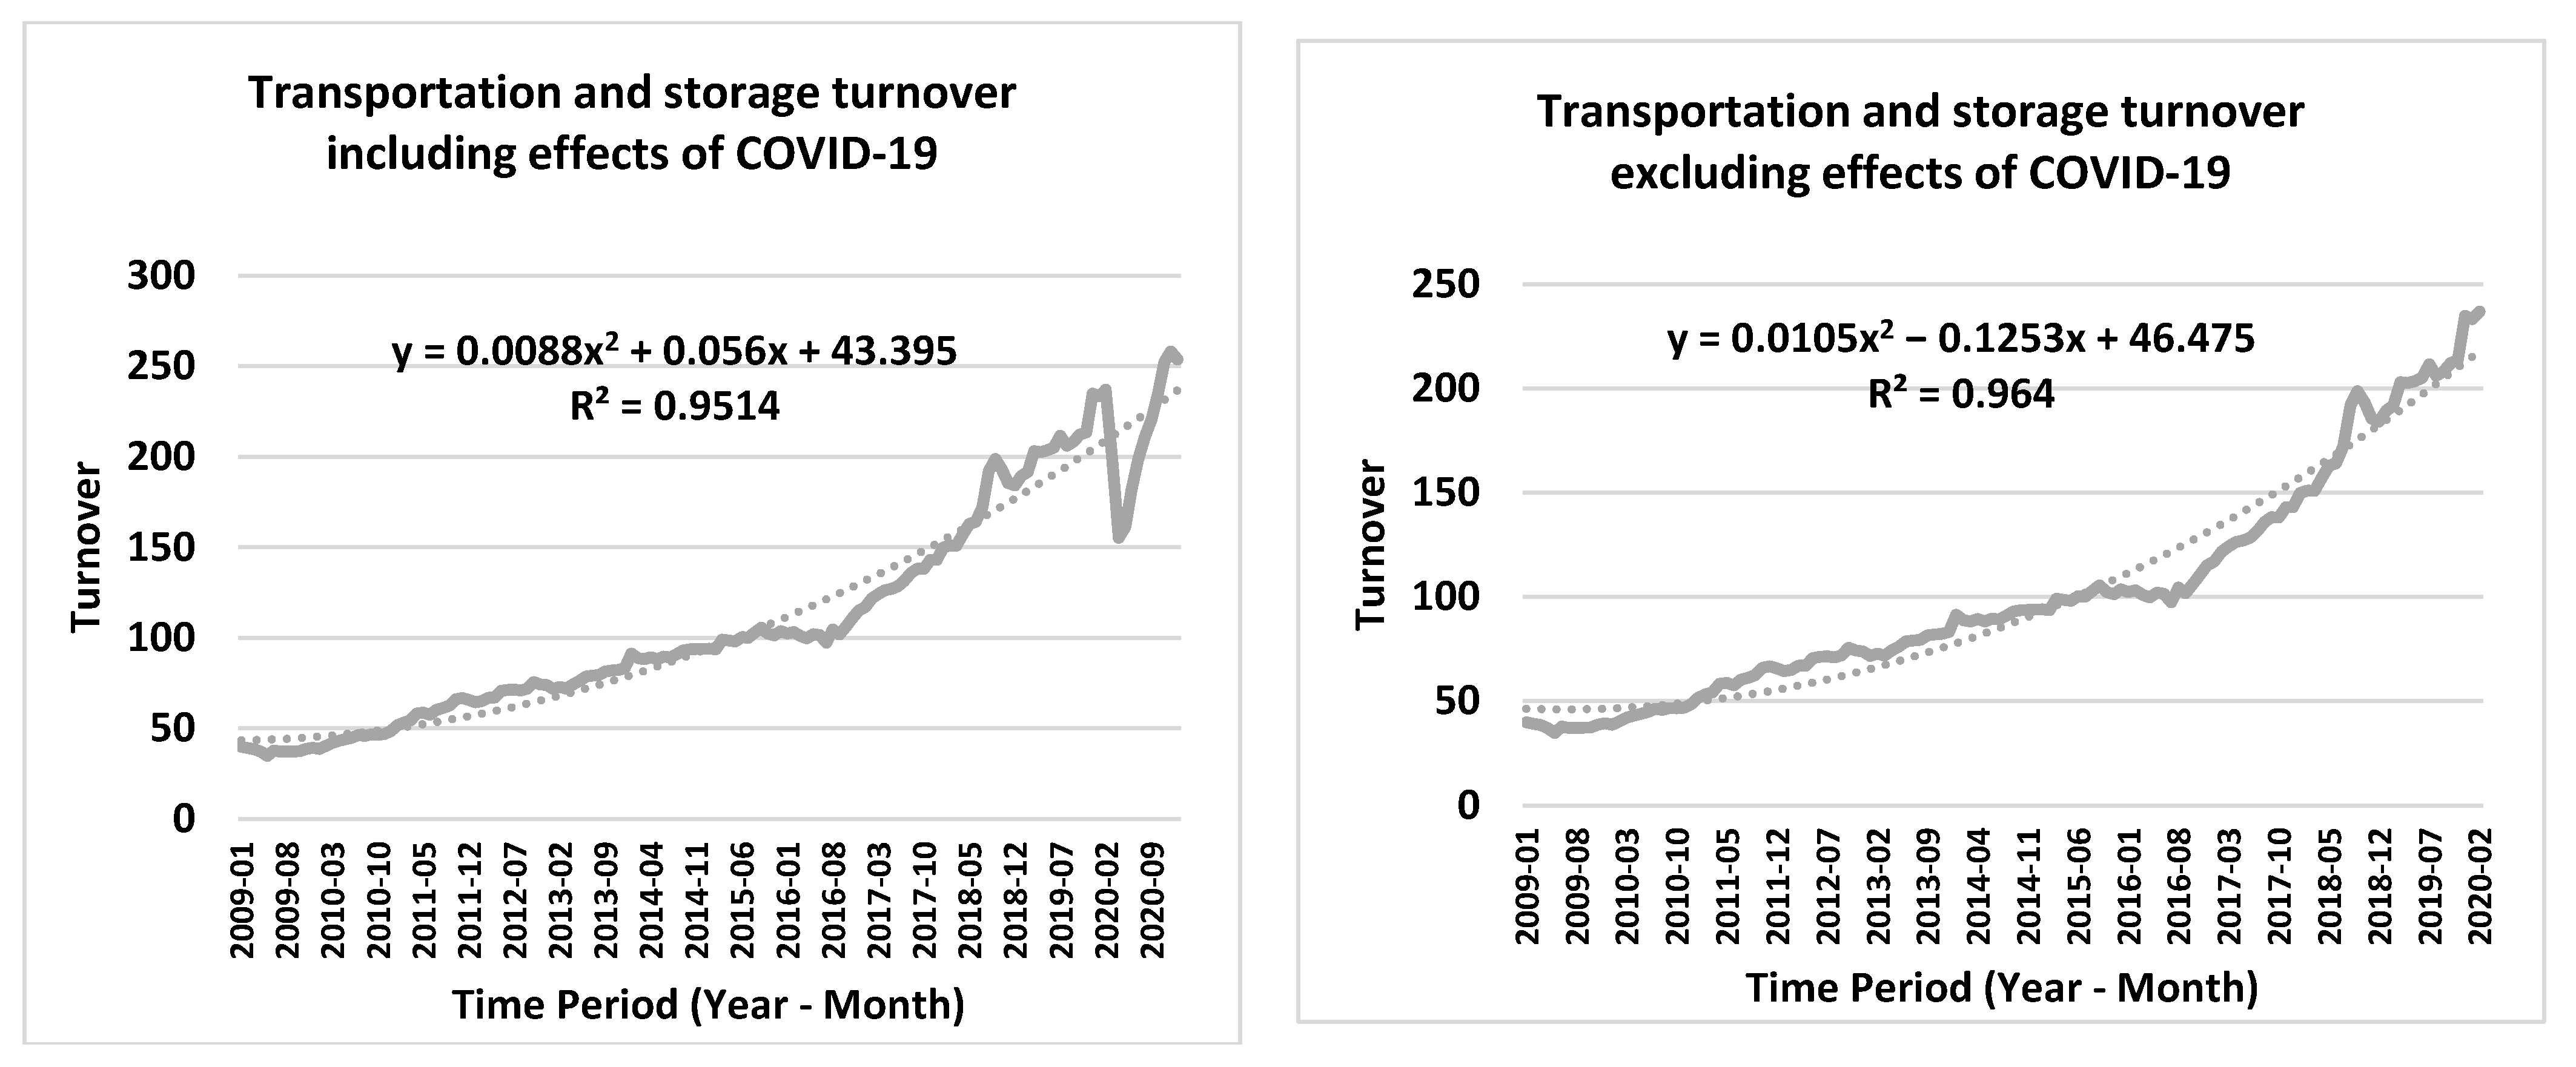
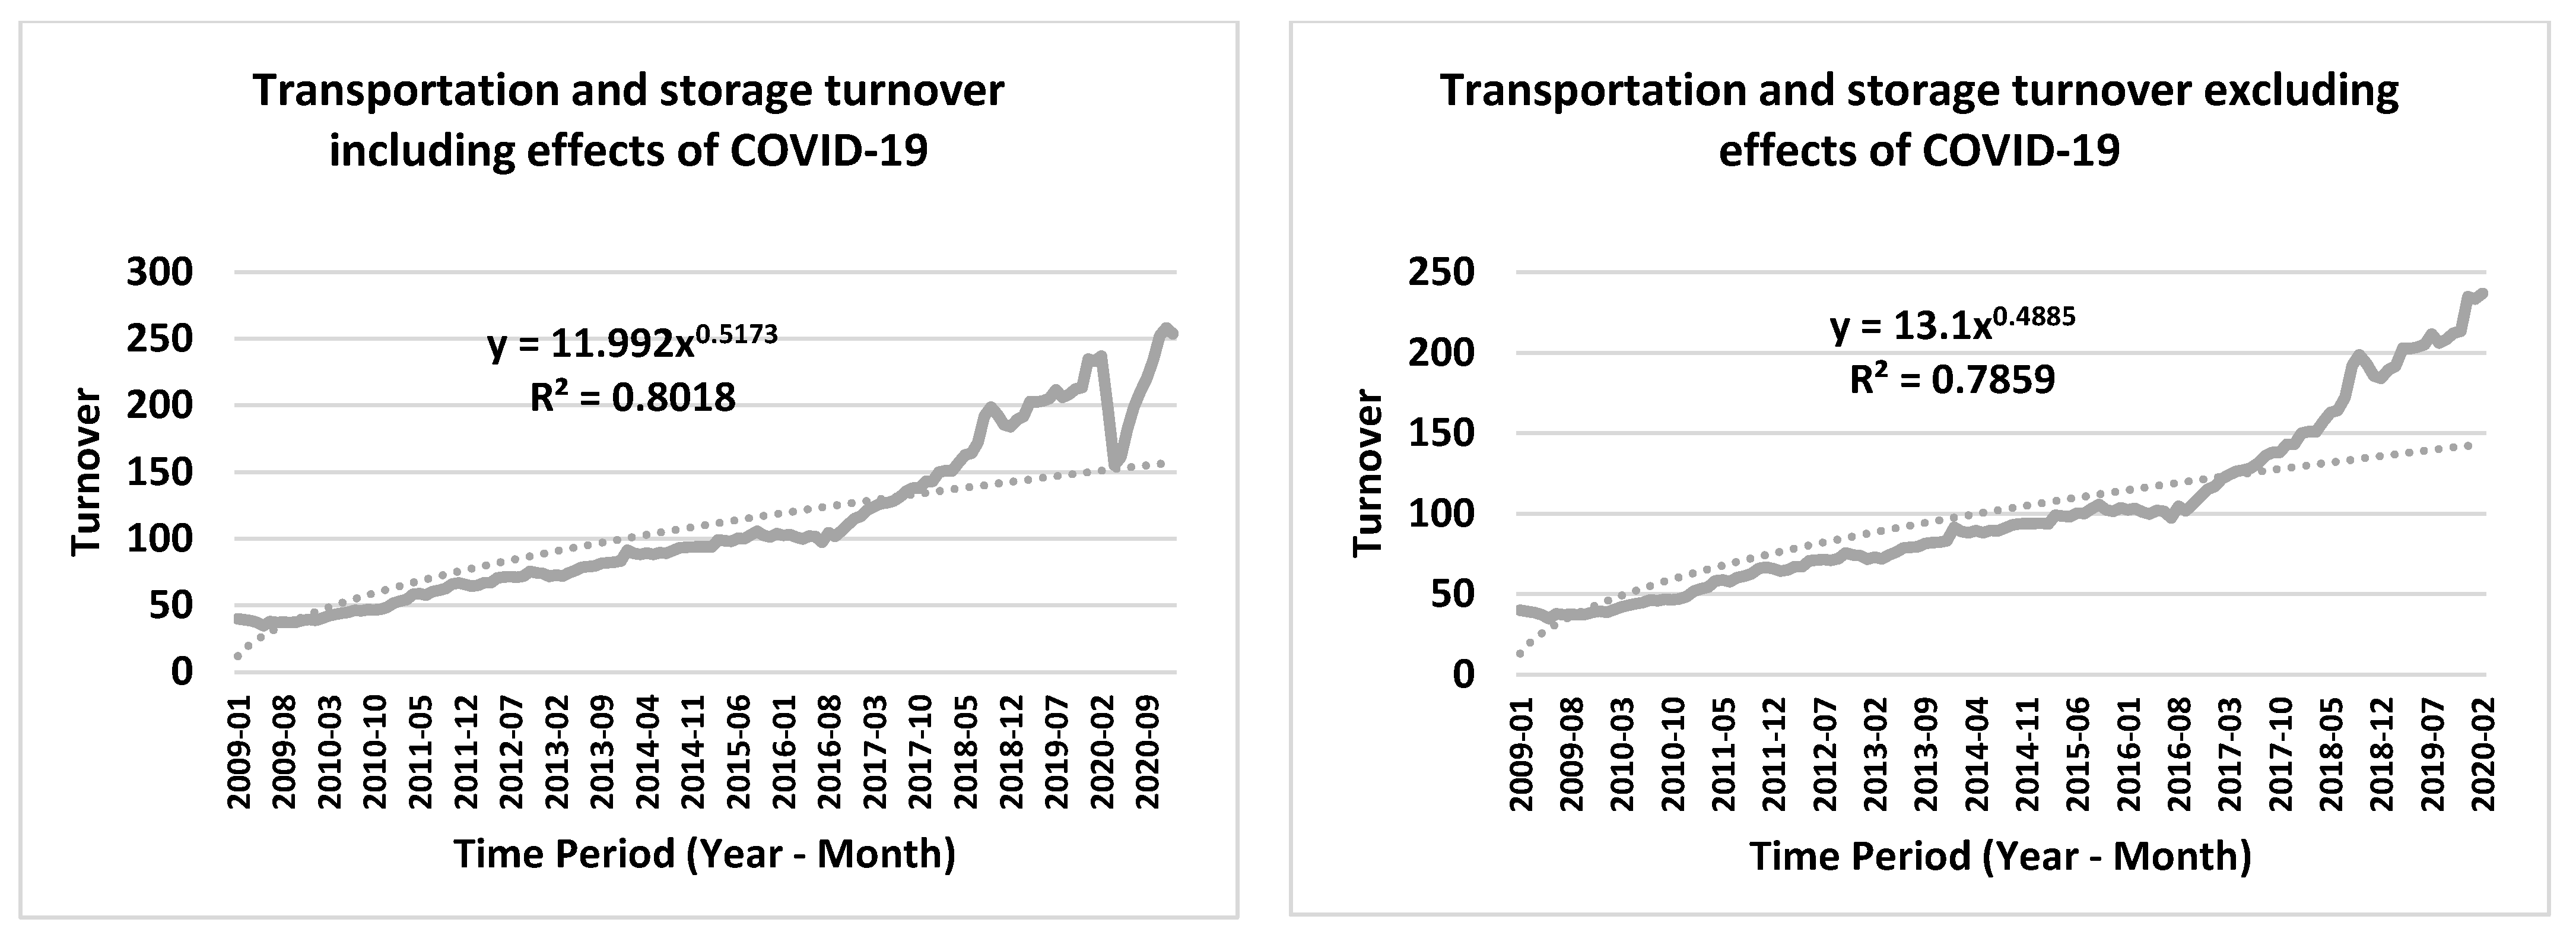
This section offers the regression results for Turkey using total index of turnover as the dependent variable (y) in the “transportation and storage” sector, and monthly time periods as the independent variable (x). Figure 5, Figure 6, Figure 7 and Figure 8 offer the results for linear, exponential, logarithmic and polynomial cases, including and excluding the data corresponding to the COVID-19 effect. As described in the methodology, the forecast horizon is extended until July 2023. Best fit equations and R2 values for each case are provided on the figures.
These figures indicate that polynomial regression provided the best fit, with the highest R2 value obtained by the polynomial equation. R2 values calculated for both polynomial cases indicate a fit of more than 95%, which is a highly significant fit. Among the tested equations, logarithmic equation provided the lowest value of R2 and linear regression provided a better fit than the exponential equation, with R2 values of around 0.89 and 0.79, respectively. It is important to highlight that these results provide acceptable and meaningful fits. Hence, forecasting is based on the polynomial equations:
y = 0.0088x2 + 0.056x + 43.395 for the case including effects of COVID-19 (R2 = 0.9514)
y = 0.0105x2 − 0.1253x + 46.475 for the case excluding effects of COVID-19 (R2 = 0.964)
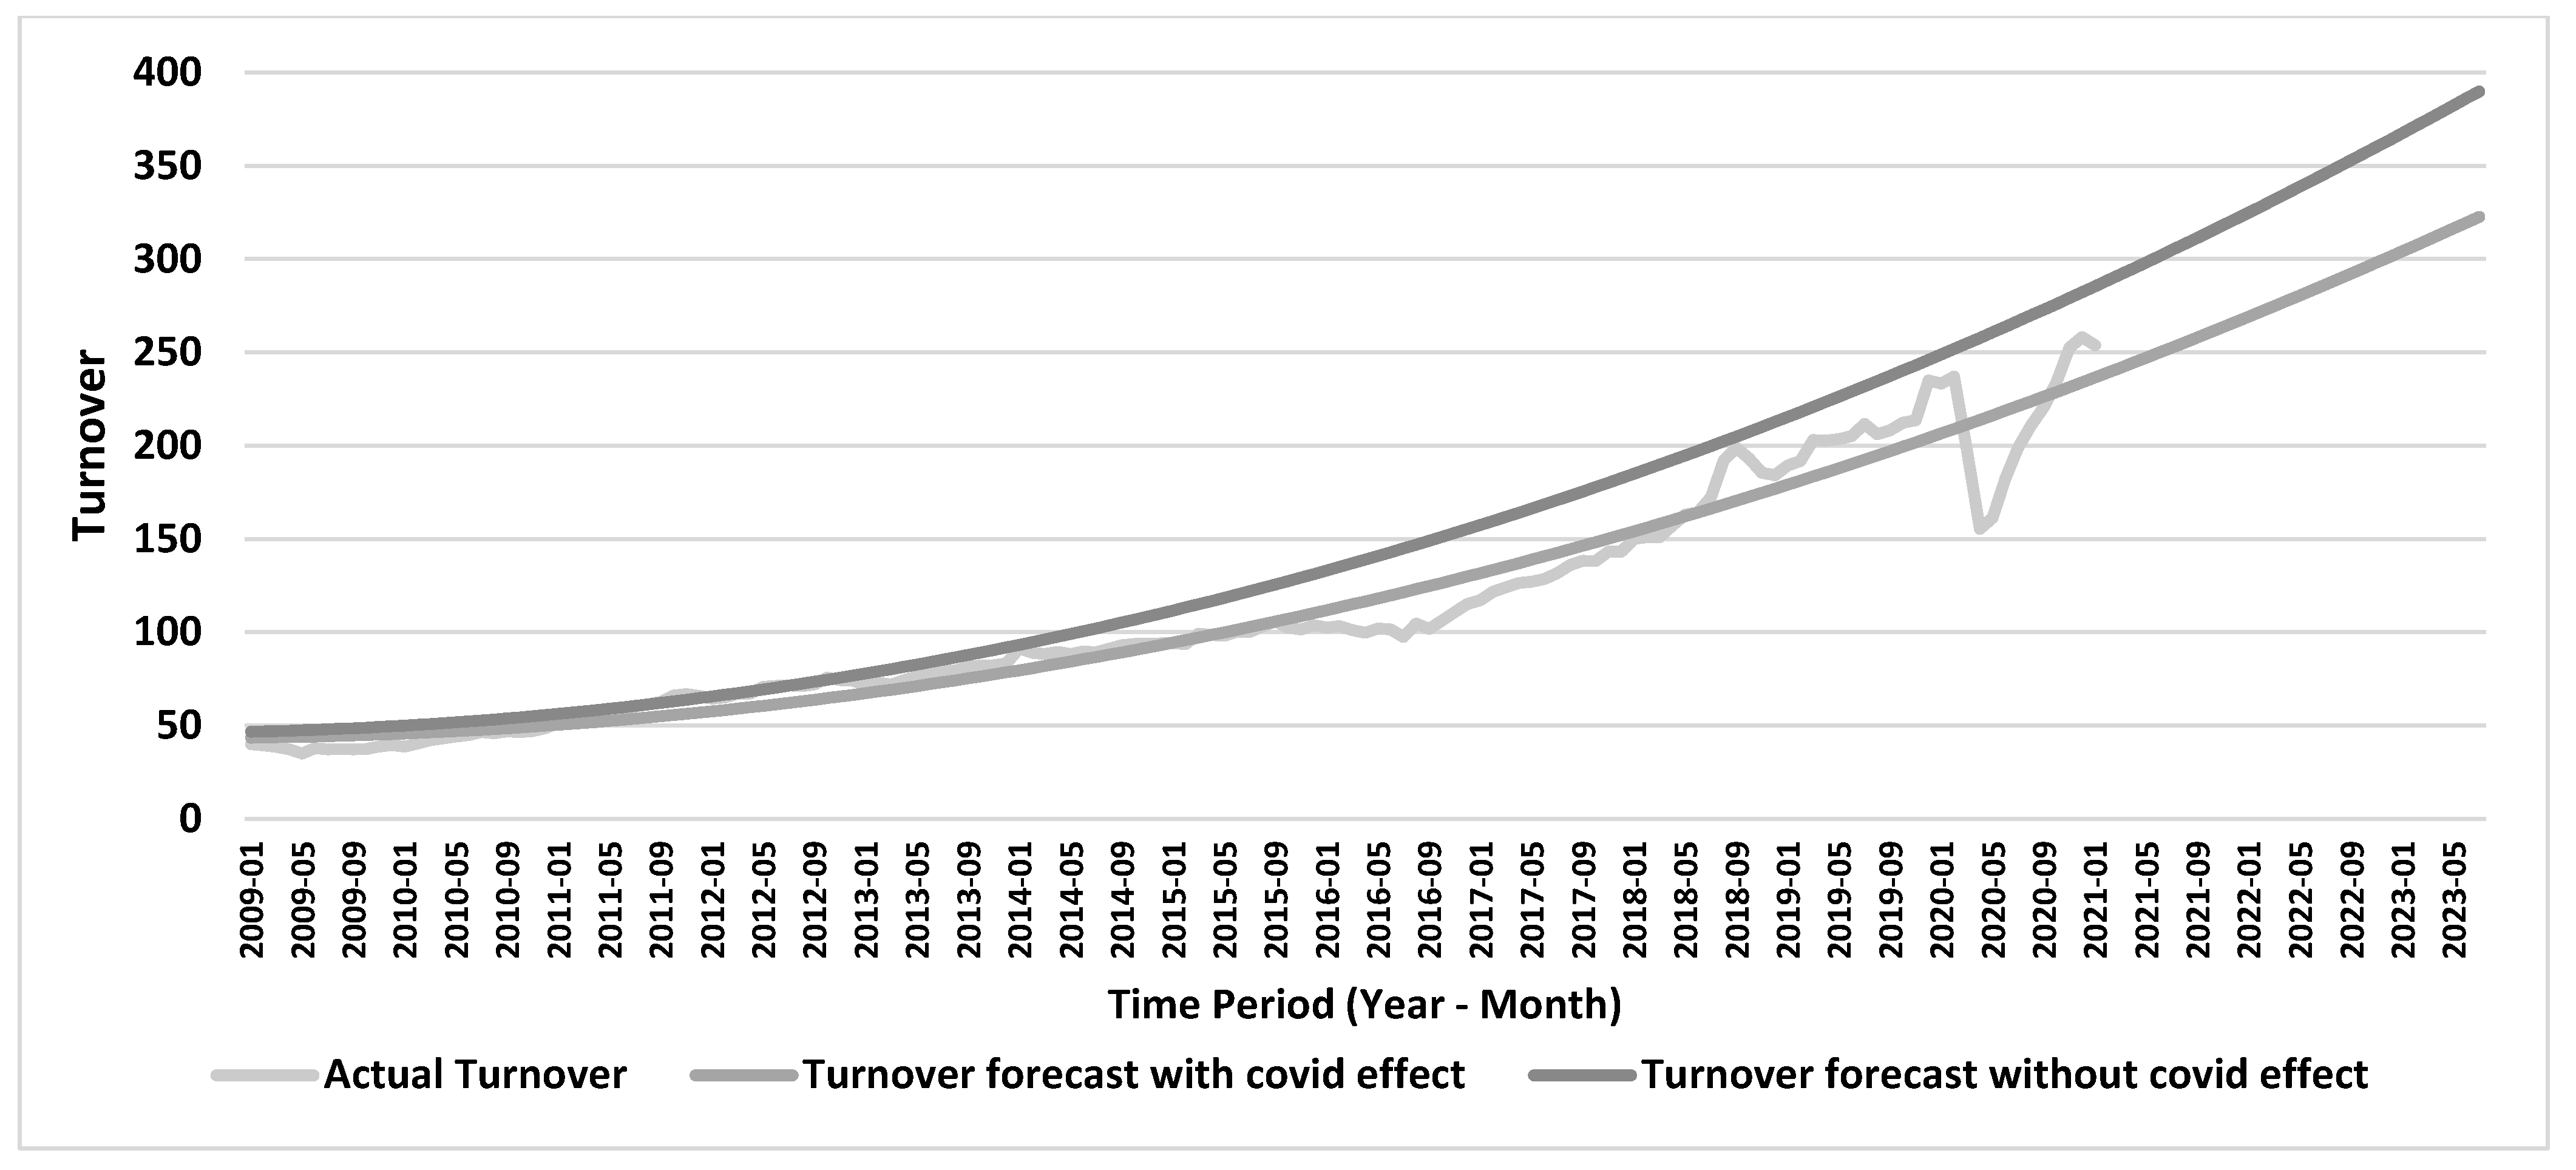
Figure 9 provides the comparative graph of actual logistics turnover and forecasted values with and without the effects of COVID-19 in Turkey.
Figure 9 clearly shows an exponential increase and a widening gap between with and without COVID-19 cases. Undoubtedly, this gap can decrease in time depending on the pandemic situations. In general, actual turnover curve lies in between two forecast curves. However, deviations are observed for the periods July 2016 and April 2020. This deviation is especially larger for April 2020, which directly corresponds to pandemic global closures in the world and Turkey alike.
5.2. Comparative Trend Analysis and Forecasting against EA19 and EU27 Countries
With the similar methodology, this section offers the regression analysis and forecasting models for EU27 (European Union—27 countries) and EA19 (Euro area—19 countries) based on the data from the same EUROSTAT database (European Union 2021). For both EA19 and EU27, polynomial regression provides the best results, in compatibility with the results of Turkey with slightly lower R2 results. Regressions applied for EA19 and EU27 countries lead to the following equations:
For EA19:
y = −0.006x2 + 0.2712x + 84.38 for the case including effects of COVID-19 (R2 = 0.6525)
y = 0.0013x2 + 0.0666x + 87.954 for the case excluding effects of COVID-19 (R2 = 0.9605)
For EU27:
y = −0.00003x2 + 0.28x + 80.794 for the case including effects of COVID-19 (R2 = 0.7659)
y = 0.0014x2 + 0.0895x + 84.191 for the case excluding effects of COVID-19 (R2 = 0.9774)
Figure 10 below provides the forecast with and without the effects of COVID-19 on the same graph, using again polynomial regression for EU27 countries.
Figure 10 shows that, for EU27 countries, the curve exhibits a steady behavior, and does not show an increasing trend as experienced in Turkey. This steady behavior continues up until February 2020, which corresponds to the initial periods of pandemics. Water transportation is quite differentiated from the average behavior, which is in contrast with the trend experienced in Turkey. Water transportation is generally above the average trend in Turkey whereas it generally stays below or at the average for EU27 countries. This shows the superiority of Turkey for water transport when compared with the EU27 average. While the dropdown due to COVID-19 exhibits a sharp character in Turkey, the dropdown is a much smoother concave curve for EU27 countries. So, this can represent a more sudden recovery for Turkey. Warehouse activities are also above the average behavior in EU27 countries for the same COVID-19-related reasons, as in the case of Turkey.
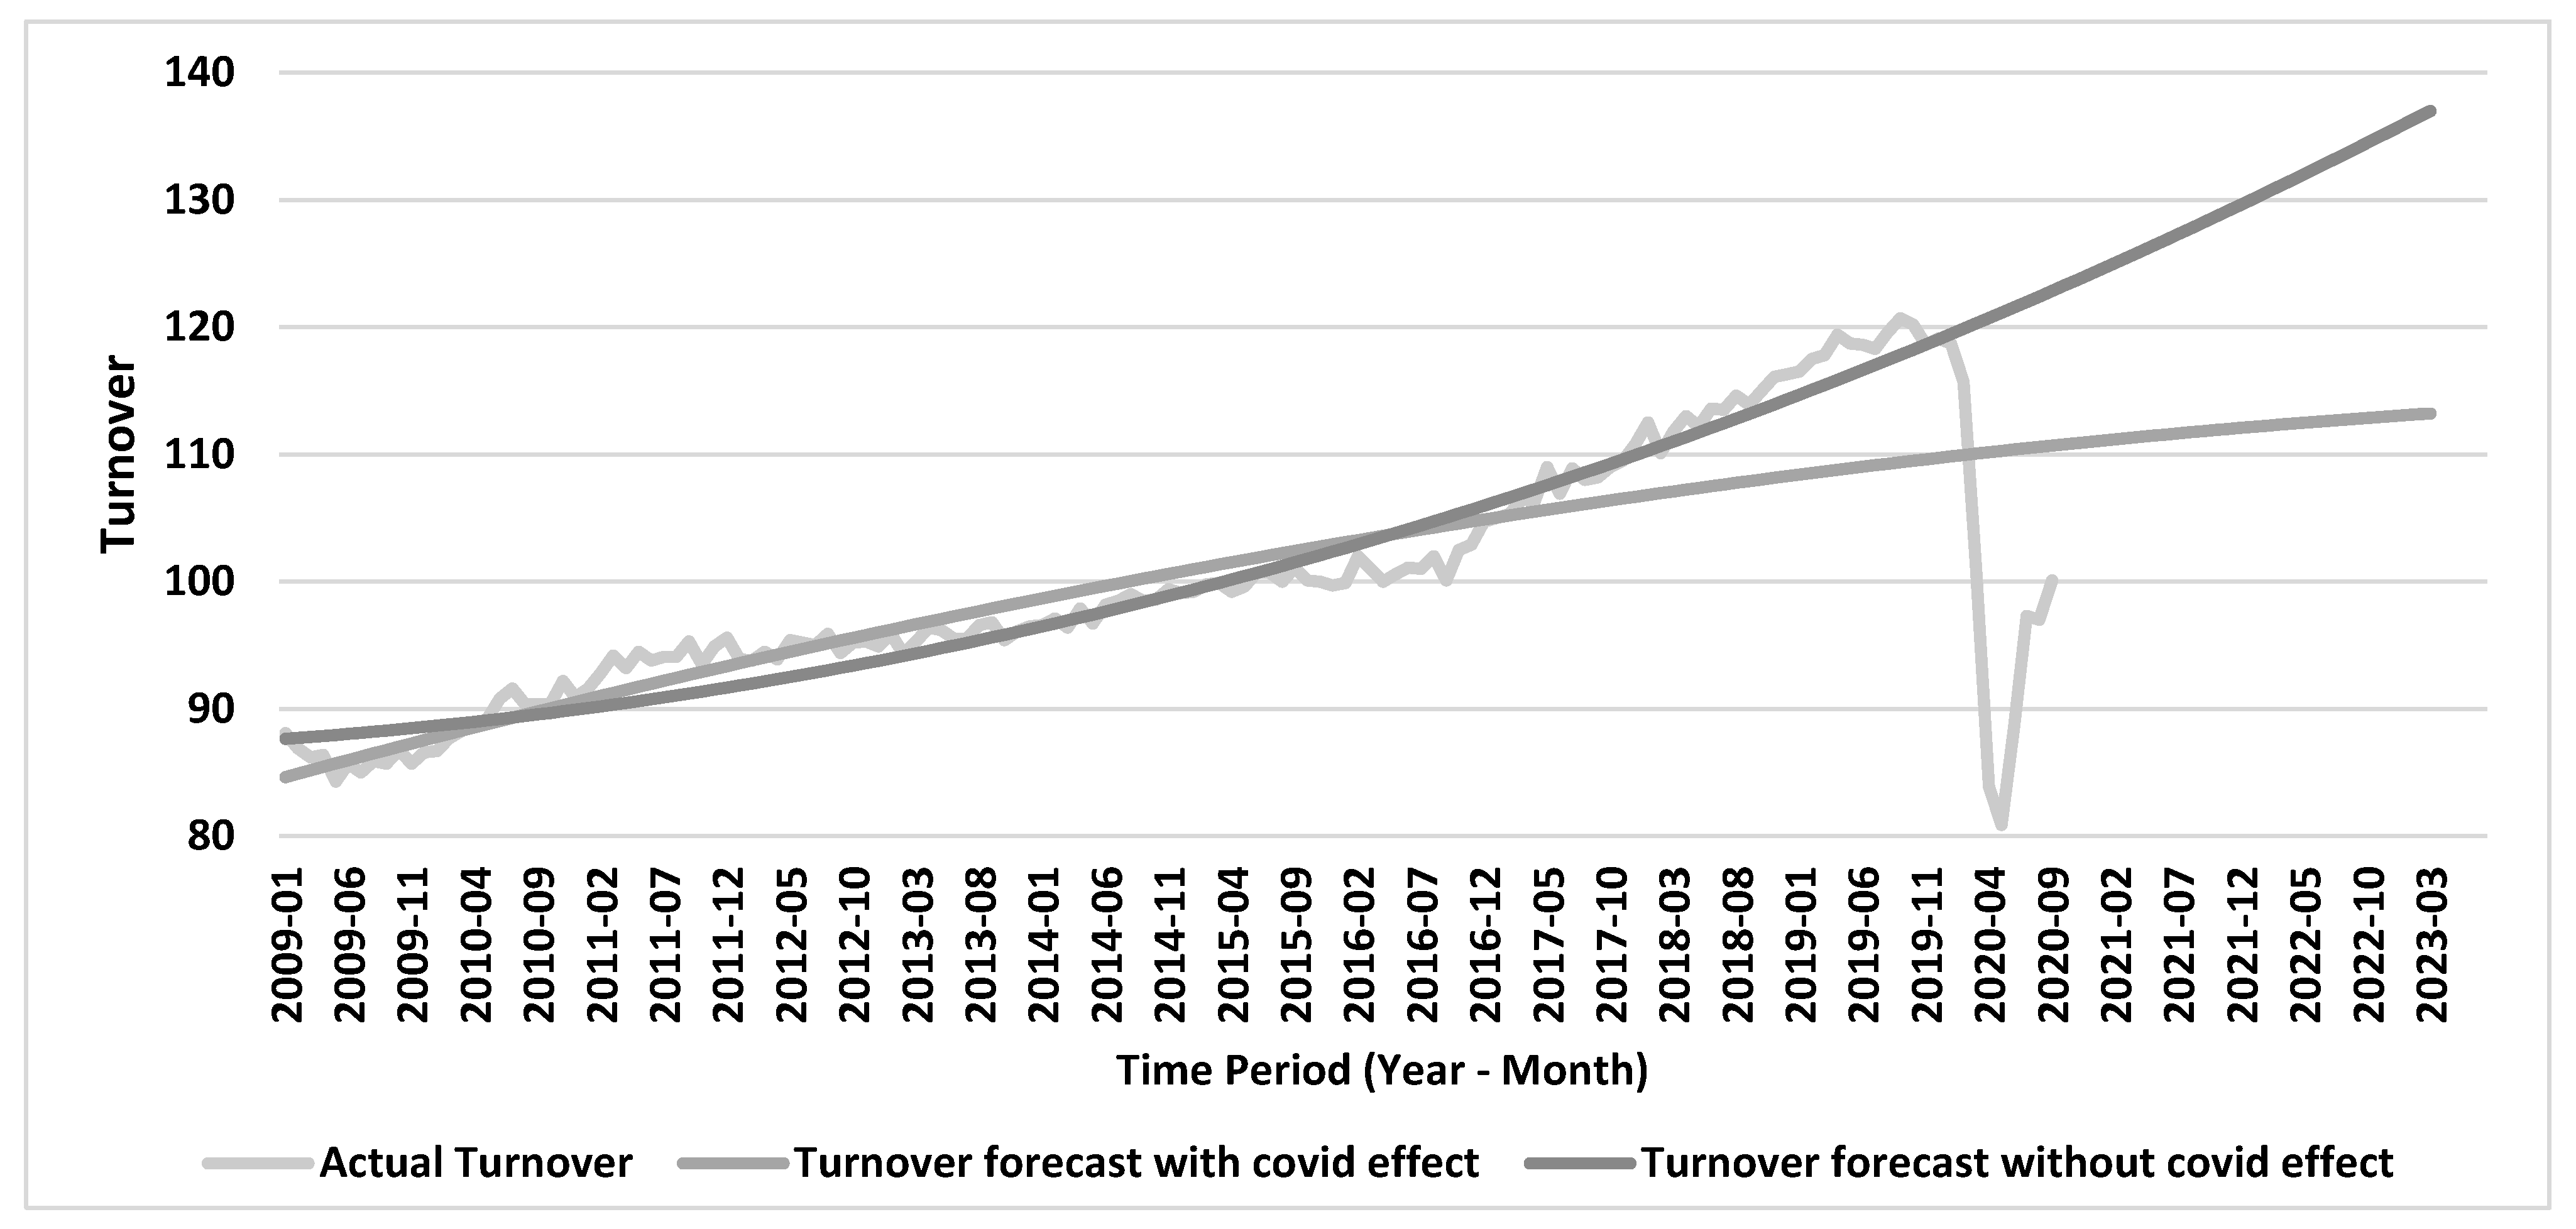
Figure 11 offers the comparative graph of actual logistics turnover and forecasted values with and without COVID-19 effects in EU27 countries. Drastic deviation in May 2020 is undoubtedly related to lockdowns and closures in EU27 countries. Until September 2019, actual values show minor positive and negative deviations around the forecast curve without effects of COVID-19. Starting with May 2020, the recovery effect can be observed in the graph.
In Figure 12, none of the modes stand out until the COVID-19-affected region in EA19 countries. This is in contrast with EU27 countries where water transportation is clearly differentiated. Just like the case of EU27 countries, air transportation experienced a sharper dropdown than the other modes experienced. When compared against Turkey’s graph in Figure 2, EA19 countries show a worse recovery than Turkey for air transportation as of September 2020.
Similar graph shown in Figure 13 is obtained for EA19 countries. When compared with Figure 10 for EU27 countries, larger deviations are observed around the forecasts. Effects of the dropdown due to COVID-19 appear to be more dramatic for May 2020. This means that the eight additional countries included in the calculations appear to have an overall smoothing effect.
Table 3 shows that the mean percent deviation for EU27 countries is the lowest. This is totally expected since percent deviations are smoothed across multiple countries. Due to the aggregation effect, the higher number of countries resulted in a lower mean percent deviation over thirty months. However, deviation magnitudes are much higher due to the aggregation of deviations coming from different country forecasts.
Percent growth rates and average monthly percent growth are provided in Table 4 across the analysis horizon for Turkey, as well as the EU27 and EA19 countries.
Table 4 shows that there is a dramatic difference among the growth rates of Turkey and the EU27 and EA19 countries. An overall percent growth of 535.84 percent is observed for Turkey, whereas this value is only 18.58 for EU27 countries and 13.62 for EA19 countries. This dramatic difference is the evidence for the sudden growth of logistics in Turkey. It seems that priorities and investments in this sector in Turkey have achieved returns.
For Turkey, the largest growth rate is in the warehousing activities, followed by postal and air, and the lowest percent appears in land transportation. Percent growth in warehousing also shows the biggest growth rate in the EU27 and EA19 countries. While European countries experienced a negative growth of around 53.86 percent for air transportation, Turkey experienced a 657.14 percent growth for the air transportation mode. This can be attributable to the radical investments made in the air transportation sector in Turkey, despite the serious dropdowns observed in the infrastructure index provided by the radar charts in Figure 1.
6. Discussion
In this study, the role and importance of the logistics sector for the economy is revealed. The logistics sector, having an important share within the service sector, significantly contributes to national as well as global economies by impacting investments, employment and GDP.
A broad perspective is provided for the world and Europe in the study. Afterwards, a detailed Turkey perspective is offered. Although Turkey is dropping down in the LPI index ranking (starting from rank 34 in 2007, dropping to rank 47 in 2018), significant growth is observed in the projections for the different transportation modes when compared with EU27 and EA19 countries.
Various regression models applied have shown that polynomial regression was the best fit with the highest R2 value. One of the main findings of the study is that COVID-19-related dropdowns are sharper for Turkey but show a more sudden recovery when compared with the Eurozone. In particular, the air transportation recovery of Turkey is better when compared with EU27 and EA19 countries. It is also observed that forecast deviations obtained out of the study are the lowest for EA27 countries.
By performing detailed regression analysis based on different regression models, the study revealed that logistics sector turnovers for Turkey, as well as the EU27 and EA19 countries, were affected negatively by COVID-19 pandemic. Figure 3 clearly shows the radical effect of COVID-19. Slowdowns experienced in different manufacturing sectors undoubtedly changed the logistics requirements, reducing the overall volume of business in the sector. Furthermore, all sources of mobility including of raw material, products, and people were restricted due to lockdowns. Hence, all these related pandemic conditions are reflected as sudden drops in the overall turnover of logistics activities.
During the analysis, significant differences are observed among the comparative growth rates of different transportation modes for Turkey and the EU27 and EA19 countries. Table 4 indicates that average monthly percent growth for the overall transportation and storage index is radically better for Turkey. In addition, the dominance of warehousing activities in all the countries stood out. This is more prominent for Turkey. The growth rate for the air transportation is again significantly higher in Turkey. Hence, the growth rates of Turkey—which are significantly higher than EU27 and EA19 countries—support the overall logistics potential of the country.
It is evident that infrastructural investments, especially in the air transportation, have started to show their impact. Together with the established air transportation network and huge investment made in the Istanbul Airport, radical developments in airway transportation have been achieved. This is evident in Table 2, showing the continuously increasing percent share of air transportation and changes to the dominance of land transportation. With all these long-term investments in the air transportation, Turkey is the biggest candidate for becoming one of the most critical logistics hubs connecting all the world. The rising importance of the airway logistics can also be supported by the Turkish Airlines, with revenues, profits and share values growing significantly. This improvement in airlines provides huge potential for the development of logistics centers/villages. In addition, previous IT-related investments in Turkey in terms of the Internet network infrastructure and production of autonomous vehicles provides Turkey with additional strength in the logistics sector.
It can easily be argued that very recent colossal devastation caused by the earthquake in Turkey will also have significant consequences and reflections in these trends. Dramatic highway and air traffic created during humanitarian logistics activities to meet sudden and extreme logistics requirements are still going on, and they will be reflected in these indices. Disruptions caused in the logistics network infrastructure (such as damages in the airport runways, highways, and vehicles) will require urgent recovery investments to be prioritized for the logistics sector in Turkey. Undoubtedly, this tragic earthquake will affect the Turkish economy negatively, requiring financial resources for recovering not only logistics but also every aspect of life (health, education, construction).
7. Conclusions and Further Research Suggestions
This study put forward a regression-based analysis to obtain a forecast for logistics turnover for Turkey and the EU27 and EA19 countries with and without effects of COVID-19. This study is valuable for:
- Providing forecasting and a comparative picture for logistics sector in Turkey and the EU27 and EA19 countries;
- Showing the growth trends with respect to different transportation modes for Turkey and the EU27 and EA19 countries;
- Revealing the effects of pandemic on logistics sector for Turkey and the EU27 and EA19 countries.
The study has shown that strategic decisions of policy-makers and long-term investments made in the logistics sector can cause dramatic transformation across different transportation modes and turnover. Therefore, the authors believe that the trends and forecasts identified in this study can guide the policy-makers towards accelerating the recovery from the effects of the pandemic. In this regard, this study can also shed light on the long-term investments related to sectoral infrastructure.
Growth percentages identified can be especially useful for planning new infrastructural investments for the subsectors, determining various incentives and subventions and guiding local and foreign investors to find investment opportunities. Warehousing activities, which represent the largest growth potential for the countries, show significantly higher growth rates in Turkey. This can be utilized as a strategic advantage and can be a base of collaborative opportunities across the countries.
It is also important to highlight the significant growth rate of Turkey in air transportation, and its increasing share among all the transportation modes, along with the Istanbul Airport becoming a critical hub in the world. It is revealed that land transportation is still the dominant transportation mode in Turkey. This is an indication for the policy-makers that further strategies and policies are required to support other modes of transportation (railway and sea). In this regard, shifting from land transportation to other modes of transportation demands strategic collaboration and decisions among different players in the logistics and transportation sector (ministries along with all the partners from public and private sectors). Infrastructural investment, privatization policies for railways, subvention and support policies should consider the balance across different transportation modes.
New data available under pandemic conditions can definitely change the picture. Therefore, recovery patterns can be further analyzed with new time-series data. Different indicators other than turnover, such as production value of the sector, number of firms and number of workers in the sector and value added at factor costs can be used. Different time-series approaches can also be applied on logistics-related sectoral data. With a similar regression methodology, pairwise country comparisons can also be subjected to further research. Forecasting can also be performed for every transportation mode for Turkey, as well as the EU27 and EA19 countries. Various further studies can also be designed to reveal the effects of the earthquake on the logistics sector.
Author Contributions
The authors collaborated in all the sections of the paper, and both authors participated in the conceptualization, analysis, writing, revising and finalizing the paper. All authors have read and agreed to the published version of the manuscript.
Funding
This research received no external funding.
Institutional Review Board Statement
Not applicable.
Informed Consent Statement
Not applicable.
Data Availability Statement
Data available publicly from [82] Eurostat, (2021). https://ec.europa.eu/eurostat/web/main/data/database (accessed on 24 May 2021).
Conflicts of Interest
The authors declare no conflict of interest.
References
- Wong, W.P.; Tang, C.F. The major determinants of logistic performance in a global perspective: Evidence from panel data analysis. Int. J. Logist. Res. Appl. 2018, 21, 431–443. [Google Scholar] [CrossRef]
- Yıldız, D.; Wolff, R.A. Türkiye’de lojistik yönetimindeki gelişmeler: Stratejik bir bakış açısı. Sos. Bilim. Araştırma Derg. 2018, 7, 187–198. [Google Scholar]
- Suki, N.M.; Sharif, A.; Afshan, S. The role of logistics performance for sustainable development in top Asian countries: Evidence from advance panel estimations. Sustain. Dev. 2021, 29, 595–606. [Google Scholar] [CrossRef]
- Isik, O.; Aydin, Y.; Kosaroglu, S.M. The assessment of the logistics performance index of CEE countries with the new combination of SV and MABAC methods. LogForum 2020, 16, 549–559. [Google Scholar] [CrossRef]
- Özceylan, E.; Çetinkaya, C.; Erbaş, M.; Kabak, M. Logistic performance evaluation of provinces in Turkey: A GIS-based multi criteria decision analysis. Transp. Res. Part A Policy Pract. 2016, 94, 323–337. [Google Scholar] [CrossRef]
- Oğuztürk, B.S.; Çetin, B. TR61 Bölgesine lojistik açıdan bir bakış. Süleyman Demirel Üniversitesi Sos. Bilim. Enstitüsü Derg. 2012, 16, 149–166. [Google Scholar]
- Yılmaz, Z.; Pietrzyk, K. Karma taşımacılığın ekonomik gelişimi ve büyümesi-Polonya ve Türkiye’nin karşılaştırmalı analizi. Kara Harp Okulu Bilim Derg. 2014, 24, 21–43. [Google Scholar]
- Karcıoğlu, R.; Temelli, F. Liman Işletmelerinde Geleneksel maliyetleme ve faaliyet tabanlı maliyetleme: Bir uygulama. Dokuz Eylül Üniversitesi Denizcilik Fakültesi Derg. 2015, 8, 71–98. [Google Scholar]
- Ustalı, N.K.; Tosun, Ö. Investigation of logistic performance of G-20 countries using data envelopment analysis and malmquist total factor productivity analysis. Mehmet Akif Ersoy Üniversitesi İktisadi Ve İdari Bilim. Fakültesi Derg. 2020, 7, 755–781. [Google Scholar]
- Karadeniz, M.; Balcı, M. Lojistik Faaliyetlerde Algilanan Hizmet Kalitesinin Marka Sadakatine Etkisi. Marmara Üniversitesi İktisadi Ve İdari Bilim. Derg. 2014, 36, 293–315. [Google Scholar]
- Medina, A.C.; Nardin, L.G.; Pereira, N.N.; Botter, R.C.; Sichman, J.S.; Kacprzyk, J.; Ören, T. A Distributed simulation model of the maritime logistics in an iron ore supply chain management. In Proceedings of the 3rd International Conference on Simulation and Modeling Methodologies, Technologies and Applications (Simultech-2013), Reykjavik, Iceland, 29–31 July 2013; pp. 453–460. [Google Scholar]
- Rintala, O.; Solakivi, T.; Laari, S.; Töyli, J.; Ojala, L. Drivers of logistics outsourcing: Examining transaction costs, core competences and planned behavior. Int. J. Phys. Distrib. Logist. Manag. 2021, 51, 259–280. [Google Scholar] [CrossRef]
- Akdoğan, M.Ş.; Durak, A. Logistic and marketing performances of logistics companies: A comparison between Germany and Turkey. Procedia-Soc. Behav. Sci. 2016, 235, 576–586. [Google Scholar] [CrossRef]
- Ofluoğlu, N.Ö.; Kalayci, C.; Artan, S.; Bal, H.Ç. Lojistik performansındaki gelişmelerin uluslararası ticaret üzerindeki etkileri: AB ve MENA ülkeleri örneği. Gümüşhane Üniversitesi Sos. Bilim. Enstitüsü Elektron. Derg. 2018, 9, 92–109. [Google Scholar]
- Chang, C.H.; Lu, C.S.; Lai, P.L. Examining the drivers of competitive advantage of the international logistics industry. Int. J. Logist. Res. Appl. 2021, 25, 1523–1541. [Google Scholar] [CrossRef]
- Bentley, Y. Managers’ perspectives of logistics and supply chain changes during the recent economic downturn. Int. J. Logist. Res. Appl. 2011, 14, 427–441. [Google Scholar] [CrossRef]
- Tongzon, J.; Cheong, I. The challenges of developing a competitive logistics industry in ASEAN countries. Int. J. Logist. Res. Appl. 2014, 17, 323–338. [Google Scholar] [CrossRef]
- Töngür, Ü.; Türkcan, K.; Ekmen-Özçelik, S. Logistics performance and export variety: Evidence from Turkey. Cent. Bank Rev. 2020, 20, 143–154. [Google Scholar] [CrossRef]
- Katrakylidis, I.; Madas, M. International trade and logistics: An empirical panel investigation of the dynamic linkages between the logistics and trade and their contribution to economic growth. Int. J. Econ. Bus. Adm. 2019, 7, 3–21. [Google Scholar] [CrossRef] [PubMed] [Green Version]
- Kalaycı, S. Dışsal Faktörlerin Ulaşım Sektörüne Etkisi: Lojistik Firmalarından Kanıtlar. Ph.D. Thesis, Beykent Üniversitesi, İstanbul, Turkey, 2015. [Google Scholar]
- Kişman, Z.A.; Aydin, F. Uluslararası ticaret lojistiğinde Türkiye ve Avrupa’nın yeri. Acad. Knowl. 2020, 3, 49–58. [Google Scholar]
- Kaynak, M. Uluslararası taşımacılık ve lojistik bağlamında avrasya ulaştırma koridorlarında bölgesel rekabet ve Türkiye. Ekon. Yaklasim 2004, 15, 3–34. [Google Scholar] [CrossRef]
- Liu, W.; Wang, S.; Lin, Y.; Xie, D.; Zhang, J. Effect of intelligent logistics policy on shareholder value: Evidence from Chinese logistics companies. Transp. Res. Part E Logist. Transp. Rev. 2020, 137, 101928. [Google Scholar] [CrossRef]
- Kılcı, H. Taşımacılık faaliyetlerinin rekabet üstünlüğü oluşturmada işletmecilikte yeri ve önemi: Türkiye örneği ve Türkiye’de taşımacılığın gelişimi. Balk. Sos. Bilim. Derg. 2017, 74–86. [Google Scholar]
- Wagener, N. Intermodal logistics centres and freight corridors-concepts and trends. LogForum 2017, 13, 273–283. [Google Scholar] [CrossRef]
- Shokouhifar, M.; Pilevari, N. Combined adaptive neuro-fuzzy inference system and genetic algorithm for E-learning resilience assessment during COVID-19 Pandemic. Concurr. Comput. Pract. Exp. 2022, 34, e6791. [Google Scholar] [CrossRef]
- Wang, C.; Meng, X.; Siriwardana, M.; Pham, T. The impact of COVID-19 on the Chinese tourism industry. Tour. Econ. 2022, 28, 131–152. [Google Scholar] [CrossRef]
- Ando, M.S.; Balakrishnan, M.R.; Gruss, B.; Hallaert, M.J.J.; Jirasavetakul, L.B.F.; Kirabaeva, K.; Solovyeva, A. European Labor Markets and the COVID-19 Pandemic: Fallout and the Path Ahead; International Monetary Fund: Singapore, 2022. [Google Scholar]
- Genç, E.; Kaya, E. COVID-19 Pandemi sürecindeki gümrük mevzuatı değişikliklerinin lojistik faaliyetlerine ve çalışanlarin iş motivasyonuna etkisi. Avrasya Sos. Ve Ekon. Araştırmaları Derg. 2021, 8, 161–175. [Google Scholar]
- Sharma, A.; Adhikary, A.; Borah, S.B. COVID-19’s impact on supply chain decisions: Strategic insights from NASDAQ 100 firms using Twitter data. J. Bus. Res. 2020, 117, 443–449. [Google Scholar] [CrossRef]
- İnan, T.T.; Neslihan, G.İ. Forecasting the recovery period of air passenger transportation by using vector error correction model. Int. Soc. Sci. J. 2022, 72, 813–828. [Google Scholar]
- Wang, C.N.; Dang, T.T.; Nguyen, N.A.T. Outsourcing reverse logistics for e-commerce retailers: A two-stage fuzzy optimization approach. Axioms 2021, 10, 34. [Google Scholar] [CrossRef]
- Florido-Benitez, L. The Role of the Top 50 US cargo airports and 25 air cargo airlines in the logistics of e-commerce companies. Logistics 2023, 7, 8. [Google Scholar] [CrossRef]
- Shokouhifar, M.; Ranjbarimesan, M. Multivariate time-series blood donation/demand forecasting for resilient supply chain management during COVID-19 pandemic. Clean. Logist. Supply Chain 2022, 5, 100078. [Google Scholar] [CrossRef]
- Shanker, S.; Sharma, H.; Barve, A. Analysing the critical success factors and the risks associated with third-party logistics in the food supply chain: A case of coffee industry. J. Adv. Manag. Res. 2021, 19, 161–197. [Google Scholar] [CrossRef]
- Demirbilek, A. Küresel Ticarette Lojistik Performans Düzeyi Ile Havayolu Kargo Taşımacılığı Ilişkisi. Master’s Thesis, İstanbul Ticaret Üniversitesi, İstanbul, Turkey, 2018. [Google Scholar]
- Agrawal, S.; Singh, R.K.; Murtaza, Q. A literature review an perspectives in reverse logistics. Resour. Conserv. Recycl. 2015, 97, 76–92. [Google Scholar] [CrossRef]
- Simon, A.; Scheidl, H.; Campos, R.S.; Matana, G. Performance management in logistics outsourcing: A study on sugar-energy industry. Int. J. Product. Perform. Manag. 2020, 70, 1772–1792. [Google Scholar] [CrossRef]
- Kenyon, G.N.; Meixell, M.J. Success factors and cost management strategies for logistics outsourcing. J. Manag. Mark. Res. 2011, 7, 1. [Google Scholar]
- Magoutas, B.; Riemer, D.; Apostolou, D.; Ma, J.; Mentzas, G.; Stojanovic, N. An event-driven system for business awareness management in the logistics domain. In Proceedings of the International Conference on Business Process Management 2012, Tallinn, Estonia, 3–6 September 2012; Springer: Berlin/Heidelberg, Germany; pp. 402–413. [Google Scholar]
- Khahro, S.H.; Ali, T.H.; Hassan, S.; Zainun, N.Y.; Javed, Y.; Memon, S.A. Risk severity matrix for sustainable public-private partnership projects in developing countries. Sustainability 2021, 13, 3292. [Google Scholar] [CrossRef]
- Jaafar, H.S.; Rafiq, M. Logistics outsourcing practices in the UK: A survey. Int. J. Logist. Res. Appl. 2005, 8, 299–312. [Google Scholar] [CrossRef]
- Premkumar, P.; Gopinath, S.; Mateen, A. Trends in third party logistics–the past, the present & the future. Int. J. Logist. Res. Appl. 2020, 24, 551–580. [Google Scholar] [CrossRef]
- Jazairy, A.; Lenhardt, J.; von Haartman, R. Improving logistics performance in cross-border 3PL relationships. Int. J. Logist. Res. Appl. 2017, 20, 491–513. [Google Scholar] [CrossRef]
- Kovács, G.; Kot, S. New logistics and production trends as the effect of global economy changes. Pol. J. Manag. Stud. 2016, 14, 115–126. [Google Scholar] [CrossRef]
- Speranza, M.G. Trends in transportation and logistics. Eur. J. Oper. Res. 2018, 264, 830–836. [Google Scholar] [CrossRef]
- Issaoui, Y.; Khiat, A.; Bahnasse, A.; Ouajji, H. Smart Logistics: Blockchain trends and applications. J. Ubiquitous Syst. Pervasive Netw. 2020, 12, 9–15. [Google Scholar] [CrossRef]
- Strandhagen, J.O.; Vallandingham, L.R.; Fragapane, G.; Strandhagen, J.W.; Stangeland, A.B.H.; Sharma, N. Logistics 4.0 and emerging sustainable business models. Adv. Manuf. 2017, 5, 359–369. [Google Scholar] [CrossRef]
- Akyuz, G.A.; Gursoy, G. Strategic management perspectives on supply chain. Manag. Rev. Q. 2019, 70, 213–241. [Google Scholar] [CrossRef]
- Akyuz, G.A.; Gursoy, G. Transformation of supply chain activities in blockchain environment. In Digital Business Strategies in Blockchain Ecosystems; Springer: Berlin/Heidelberg, Germany, 2020; pp. 153–175. [Google Scholar]
- Europlatforms EEIG. Logistics Centres Directions for Use Report; Europlatforms EEIG: Bologna, Italy, 2004; Available online: https://unece.org/DAM/trans/main/eatl/docs/EN-REV-What_is_a_Freight_VillageFinalcorretto.pdf (accessed on 17 May 2022).
- Gourdin, K. Logistics strategies. In Global Logistics Management: A Competitive Advantage for the New Millennium; Blackwell Business: Warwickshire, UK, 2001; pp. 211–228. [Google Scholar]
- Başlangıç, S.Ö. Uluslararası Lojistik Uygulamalarında Teslim Şekilleri ve Teslim Şekli Seçimini Etkileyen Unsurların Belirlenmesi. Ph.D. Thesis, Adnan Menderes Üniversitesi İşletme Ana Bilim Dalı, Aydin, Turkey, 2015. [Google Scholar]
- Karataş, Z. Sosyal bilim araştırmalarında paradigma değişimi: Nitel yaklaşımın yükselişi. Türkiye Sos. Hizmet Araştırmaları Derg. 2017, 1, 68–86. [Google Scholar]
- Kaynak, M.; Zeybek, H. Intermodal terminallerin gelişiminde lojistik merkezler, dağıtım parklari ve Türkiye’deki durum. Gazi Üniversitesi İktisadi Ve İdari Bilim. Fakültesi Derg. 2007, 9, 39–58. [Google Scholar]
- Çekerol, G.S.; Gunyashev, E. Kazakistan lojistik sektörü ve sektör paydaşlarının lojistik köy ile ilgili görüşlerinin SWOT analizi ile değerlendirilmesi. Akad. Bakış Uluslararası Hakemli Sos. Bilim. Derg. 2017, 60, 127–168. [Google Scholar]
- Terzi, N.; Bolukbas, O. An analysis of logistics villages in Turkey: Halkali and Yenice. J. Manag. Mark. Logist. 2016, 3, 190–204. [Google Scholar] [CrossRef]
- Aktas, E.; Ulengin, F. Outsourcing logistics activities in Turkey. J. Enterp. Inf. Manag. 2005, 18, 316–329. [Google Scholar] [CrossRef] [Green Version]
- Yurdakul, E.M. Türkiye’de lojistik sektörü ve ekonomik büyüme arasindaki ilişkinin var analizi ile incelenmesi. Sos. Ekon. Araştırmalar Derg. 2020, 20, 174–185. [Google Scholar]
- Yıldız, K.; Tabak, Ç. LPI based comparison of Turkey and Mexican logistics sector. Politek. Derg. 2019, 22, 1061–1067. [Google Scholar] [CrossRef]
- Şahin, B.G.; Özkaya, S. Türkiye’de lojistik sektörünün incelenmesi ve sektör araştırmasının bulguları. Uluslararası Sos. Bilim. Ve Eğitim Derg. 2020, 2, 113–137. [Google Scholar]
- Worldbank International Scorecard. International Logistics Performance Indicator (LPI). 2022. Available online: https://lpi.worldbank.org/international/scorecard/radar/254/C/TUR (accessed on 10 November 2022).
- Turkish Statistical Institute. 2022. Available online: https://data.tuik.gov.tr/Kategori/GetKategori?p=ticaret-ve-hizmet-115&dil=1 (accessed on 15 November 2022).
- Queiroz, M.M.; Ivanov, D.; Dolgui, A.; Fosso Wamba, S. Impacts of epidemic outbreaks on supply chains: Mapping a research agenda amid the COVID-19 pandemic through a structured literature review. Ann. Oper. Res. 2022, 319, 1159–1196. [Google Scholar] [CrossRef] [PubMed]
- Salama, M.R.; McGarvey, R.G. Resilient supply chain to a global pandemic. Int. J. Prod. Res. 2021, 61, 2563–2593. [Google Scholar] [CrossRef]
- Singh, S.; Kumar, R.; Panchal, R.; Tiwari, M.K. Impact of COVID-19 on logistics systems and disruptions in food supply chain. Int. J. Prod. Res. 2021, 59, 1993–2008. [Google Scholar] [CrossRef]
- Swanson, D.; Santamaria, L. Pandemic supply chain research: A structured literature review and bibliometric network analysis. Logistics 2021, 5, 7. [Google Scholar] [CrossRef]
- Nagao, T.; Ijuin, H.; Yamada, T.; Nagasawa, K.; Zhou, L. COVID-19 disruption strategy for redesigning global supply chain network across TPP countries. Logistics 2021, 6, 2. [Google Scholar] [CrossRef]
- Mircetic, D.; Rostami-Tabar, B.; Nikolicic, S.; Maslaric, M. Forecasting hierarchical time series in supply chains: An empirical investigation. Int. J. Prod. Res. 2022, 60, 2514–2533. [Google Scholar] [CrossRef]
- Kim, S. Forecasting short-term air passenger demand using big data from search engine queries. Autom. Constr. 2016, 70, 98–108. [Google Scholar] [CrossRef]
- Rawlings, J.O.; Pantula, S.G.; Dickey, D.A. (Eds.) Applied Regression Analysis: A Research Tool; Springer: New York, NY, USA, 1998. [Google Scholar]
- Kong, Y.S.; Abdullah, S.; Schramm, D.; Omar, M.Z.; Haris, S.M. Development of multiple linear regression-based models for fatigue life evaluation of automotive coil springs. Mech. Syst. Signal Process. 2019, 118, 675–695. [Google Scholar] [CrossRef]
- Chang, C.Z.; Chen, X.M.; Wang, M. Study on combinational scheduling optimization of bus transit rapid based on tabu search & genetic algorithm. In Applied Mechanics and Materials; Trans Tech Publications Ltd.: Zurich, Switzerland, 2015; Volume 744, pp. 1827–1831. [Google Scholar]
- D’Aleo, V. The mediator role of Logistic Performance Index: A comparative study. J. Int. Trade Logist. Law 2015, 1, 1–7. [Google Scholar]
- Khan, S.A.R.; Jian, C.; Zhang, Y.; Golpîra, H.; Kumar, A.; Sharif, A. Environmental, social and economic growth indicators spur logistics performance: From the perspective of South Asian Association for Regional Cooperation countries. J. Clean. Prod. 2019, 214, 1011–1023. [Google Scholar] [CrossRef]
- Min, B.; Lee, G.; Kim, S. Effects of Land-Use Characteristics on Transport Mode Choices by Purpose of Travel in Seoul, South Korea, Based on Spatial Regression Analysis. Sustainability 2021, 13, 1767. [Google Scholar] [CrossRef]
- Loske, D.; Klumpp, M. Verifying the effects of digitalisation in retail logistics: An efficiency-centred approach. Int. J. Logist. Res. Appl. 2020, 25, 203–227. [Google Scholar] [CrossRef]
- Garver, M.S. Threats to the validity of logistics and supply chain management research. J. Bus. Logist. 2019, 40, 30–43. [Google Scholar] [CrossRef] [Green Version]
- Furdato, P. Epidemiology SIR with Regression, ARIMA, and Prophet in Forecasting COVID-19. Eng. Proc. 2021, 5, 52. [Google Scholar] [CrossRef]
- Koyuncu, K.; Tavacioğlu, L.; Gökmen, N.; Arican, U.Ç. Forecasting COVID-19 impact on RWI/ISL container throughput index by using SARIMA models. Marit. Policy Manag. 2021, 48, 1096–1108. [Google Scholar] [CrossRef]
- Esteve-Pérez, J.; Gutiérrez-Romero, J.E.; Mascaraque-Ramírez, C. Performance of the car carrier shipping sector in the Iberian peninsula under the COVID-19 scenario. J. Mar. Sci. Eng. 2021, 9, 1295. [Google Scholar] [CrossRef]
- Eurostat. Turnover in Services. 2021. Available online: https://ec.europa.eu/eurostat/web/main/data/database (accessed on 24 May 2021).
- Zikmund, W.G.; Carr, J.C.; Griffin, M. Business Research Methods; Cengage Learning: Boston, MA, USA, 2013. [Google Scholar]
- Otext. Evaluating Forecast Accuracy. 2021. Available online: https://otexts.com/fpp2/accuracy.html (accessed on 24 May 2021).
- Frost, J. Regression Analysis. In An Intuitive Guide for Using and Interpreting Linear Models; Statistic by Jim Publishing: State College, PA, USA, 2013. [Google Scholar]
Figure 1.
Radar chart for performance index in multiple dimensions through years. Data Source: https://lpi.worldbank.org/international/scorecard/radar/254/C/TUR (accessed on 10 November 2022) [62].
Figure 1.
Radar chart for performance index in multiple dimensions through years. Data Source: https://lpi.worldbank.org/international/scorecard/radar/254/C/TUR (accessed on 10 November 2022) [62].


Figure 2.
Methodological flowchart of the study.

Figure 3.
Transportation and storage turnover index versus time period for Turkey.

Figure 4.
Average turnover by different transportation modes in Turkey.

Figure 5.
Transportation and storage turnover versus time including and excluding effects of COVID-19 (linear regression).
Figure 5.
Transportation and storage turnover versus time including and excluding effects of COVID-19 (linear regression).

Figure 6.
Transportation and storage turnover versus time including and excluding effects of COVID-19 (logarithmic regression).
Figure 6.
Transportation and storage turnover versus time including and excluding effects of COVID-19 (logarithmic regression).

Figure 7.
Transportation and storage turnover versus time including and excluding effects of COVID-19 (polynomial regression).
Figure 7.
Transportation and storage turnover versus time including and excluding effects of COVID-19 (polynomial regression).

Figure 8.
Transportation and storage turnover versus time including and excluding effects of COVID-19 (exponential regression).
Figure 8.
Transportation and storage turnover versus time including and excluding effects of COVID-19 (exponential regression).

Figure 9.
Comparative graph of actual logistics turnover and forecasted values with and without COVID-19 effect in Turkey.
Figure 9.
Comparative graph of actual logistics turnover and forecasted values with and without COVID-19 effect in Turkey.

Figure 10.
Average turnover by different transportation modes in EU27.

Figure 11.
Comparative graph of actual logistics turnover and forecasted values with and without effects of COVID-19 in EU27 countries.
Figure 11.
Comparative graph of actual logistics turnover and forecasted values with and without effects of COVID-19 in EU27 countries.

Figure 12.
Average turnover by different transportation modes in EA19 countries.

Figure 13.
Comparative graph of actual logistics turnover and forecasted values with and without effects of COVID-19 in EA19 countries.
Figure 13.
Comparative graph of actual logistics turnover and forecasted values with and without effects of COVID-19 in EA19 countries.


Table 1.
Global Position of Turkey according to logistics performance index.
| 2007 | 2010 | 2012 | 2014 | 2016 | 2018 | |
|---|---|---|---|---|---|---|
| Turkey | 34 | 39 | 27 | 30 | 34 | 47 |
| Number of Countries | 150 | 155 | 155 | 160 | 160 | 160 |
Table 2.
Percent share of each transportation mode in logistics turnover for Turkey, 2009–2018. DataSource: https://data.tuik.gov.tr/Kategori/GetKategori?p=ticaret-ve-hizmet-115&dil=1 (accessed on 15 November 2022) [63].
Table 2.
Percent share of each transportation mode in logistics turnover for Turkey, 2009–2018. DataSource: https://data.tuik.gov.tr/Kategori/GetKategori?p=ticaret-ve-hizmet-115&dil=1 (accessed on 15 November 2022) [63].
| NACE Code | 49 | 50 | 51 | 52 | 53 |
|---|---|---|---|---|---|
| Division | Land Transport and Transport via Pipelines | Water Transport | Air Transport | Warehousing and Support Activities for Transportation | Postal and Courier Activities |
| 2009 | 57.58% | 6.28% | 13.54% | 18.01% | 4.59% |
| 2010 | 56.17% | 6.58% | 13.86% | 18.98% | 4.40% |
| 2011 | 55.43% | 6.44% | 15.06% | 18.88% | 4.19% |
| 2012 | 56.27% | 5.90% | 15.28% | 18.33% | 4.22% |
| 2013 | 54.36% | 5.33% | 16.52% | 19.49% | 4.30% |
| 2014 | 52.70% | 5.25% | 18.00% | 19.94% | 4.10% |
| 2015 | 52.82% | 4.87% | 18.25% | 20.01% | 4.05% |
| 2016 | 55.21% | 4.60% | 16.53% | 19.55% | 4.11% |
| 2017 | 51.36% | 4.77% | - | 21.62% | - |
| 2018 | 44.72% | 5.59% | 22.82% | 23.18% | 3.70% |
Table 3.
Mean percent deviations of the forecasts over 30 months for Turkey, EA19, EU27.
| Months | Percent Deviation of Two Forecasts—TR | Percent Deviation of Two Forecasts—EA19 | Percent Deviation of Two Forecasts—EU27 |
|---|---|---|---|
| February 2021 | 17.13 | 10.12 | 8.06 |
| March 2021 | 17.14 | 10.36 | 8.26 |
| April 2021 | 17.14 | 10.59 | 8.46 |
| May 2021 | 17.15 | 10.83 | 8.66 |
| June 2021 | 17.15 | 11.07 | 8.86 |
| July 2021 | 17.16 | 11.31 | 9.07 |
| August 2021 | 17.17 | 11.56 | 9.27 |
| September 2021 | 17.17 | 11.80 | 9.48 |
| October 2021 | 17.18 | 12.04 | 9.68 |
| November 2021 | 17.18 | 12.29 | 9.89 |
| December 2021 | 17.19 | 12.53 | 10.10 |
| January 2022 | 17.19 | 12.78 | 10.31 |
| February 2022 | 17.20 | 13.03 | 10.51 |
| March 2022 | 17.20 | 13.28 | 10.72 |
| April 2022 | 17.20 | 13.53 | 10.93 |
| May 2022 | 17.21 | 13.78 | 11.15 |
| June 2022 | 17.21 | 14.03 | 11.36 |
| July 2022 | 17.22 | 14.28 | 11.57 |
| August 2022 | 17.22 | 14.54 | 11.78 |
| September 2022 | 17.22 | 14.79 | 12.00 |
| October 2022 | 17.23 | 15.04 | 12.21 |
| November 2022 | 17.23 | 15.30 | 12.42 |
| December 2022 | 17.23 | 15.55 | 12.64 |
| January 2023 | 17.23 | 15.81 | 12.85 |
| February 2023 | 17.24 | 16.07 | 13.07 |
| March 2023 | 17.24 | 16.33 | 13.29 |
| April 2023 | 17.24 | 16.58 | 13.50 |
| May 2023 | 17.25 | 16.84 | 13.72 |
| June 2023 | 17.25 | 17.10 | 13.94 |
| July 2023 | 17.25 | 17.36 | 14.16 |
| Mean Percent Deviation over 30 Months | 17.20 | 13.68 | 11.06 |
Table 4.
A comparison of growth percentages in Turkey and the EU27 and EA19 countries for different transportations modes.
Table 4.
A comparison of growth percentages in Turkey and the EU27 and EA19 countries for different transportations modes.
| Turkey | EU27 | EA19 | |||||
|---|---|---|---|---|---|---|---|
| Percent Growth | Average Monthly Percent Growth | Percent Growth | Average Monthly Percent Growth | Percent Growth | Average Monthly Percent Growth | ||
| H | Transportation and storage | 535.84 | 3.70 | 18.58 | 0.13 | 13.62 | 0.09 |
| H49 | Land | 403.33 | 2.78 | 26.64 | 0.19 | 19.12 | 0.13 |
| H50 | Water | 526.40 | 3.63 | 21.49 | 0.15 | - | 0.00 |
| H51 | Air | 657.14 | 4.53 | −53.86 | −0.38 | −53.68 | −0.37 |
| H52 | Warehousing | 1025.32 | 7.07 | 30.72 | 0.22 | 29.30 | 0.20 |
| H53 | Postal | 693.14 | 4.78 | 9.06 | 0.06 | - | 0.00 |
Disclaimer/Publisher’s Note: The statements, opinions and data contained in all publications are solely those of the individual author(s) and contributor(s) and not of MDPI and/or the editor(s). MDPI and/or the editor(s) disclaim responsibility for any injury to people or property resulting from any ideas, methods, instructions or products referred to in the content. |
© 2023 by the authors. Licensee MDPI, Basel, Switzerland. This article is an open access article distributed under the terms and conditions of the Creative Commons Attribution (CC BY) license (https://creativecommons.org/licenses/by/4.0/).
Share and Cite
MDPI and ACS Style
Balkan, D.; Akyuz, G.A. Logistics Sector Turnover: Forecasting for Turkey, EU27 and EA19 under Effects of COVID-19. Logistics 2023, 7, 23. https://doi.org/10.3390/logistics7020023
AMA Style
Balkan D, Akyuz GA. Logistics Sector Turnover: Forecasting for Turkey, EU27 and EA19 under Effects of COVID-19. Logistics. 2023; 7(2):23. https://doi.org/10.3390/logistics7020023
Chicago/Turabian StyleBalkan, Dursun, and Goknur Arzu Akyuz. 2023. "Logistics Sector Turnover: Forecasting for Turkey, EU27 and EA19 under Effects of COVID-19" Logistics 7, no. 2: 23. https://doi.org/10.3390/logistics7020023