
A Simulation Approach for Waste Reduction in the Bread Supply Chain


Abstract
:1. Introduction
- RQ1—What are the sources of bread waste?
- RQ2—What effective strategies can mitigate bread waste?
- RQ3—To propose a mitigation strategy to minimize bread wastage throughout the bread supply chain.
- Phase I—Planning for the bread loss percentage and source.
- Phase II—Concerning the texture of the bread.
- Phase III—Discussing the bread waste mitigation strategies.
1.1. Phase I
1.2. Phase II
1.3. Phase III
- To tackle the bread returned from the retailer and TBA (take back agreement) problem.
- To maintaining the quality of returned bread waste for making some by-products.
- To achieving a negligible amount of bread wastage from the bakery.
- To creating a hygienic and secure environment for society.
2. Methods and Analysis
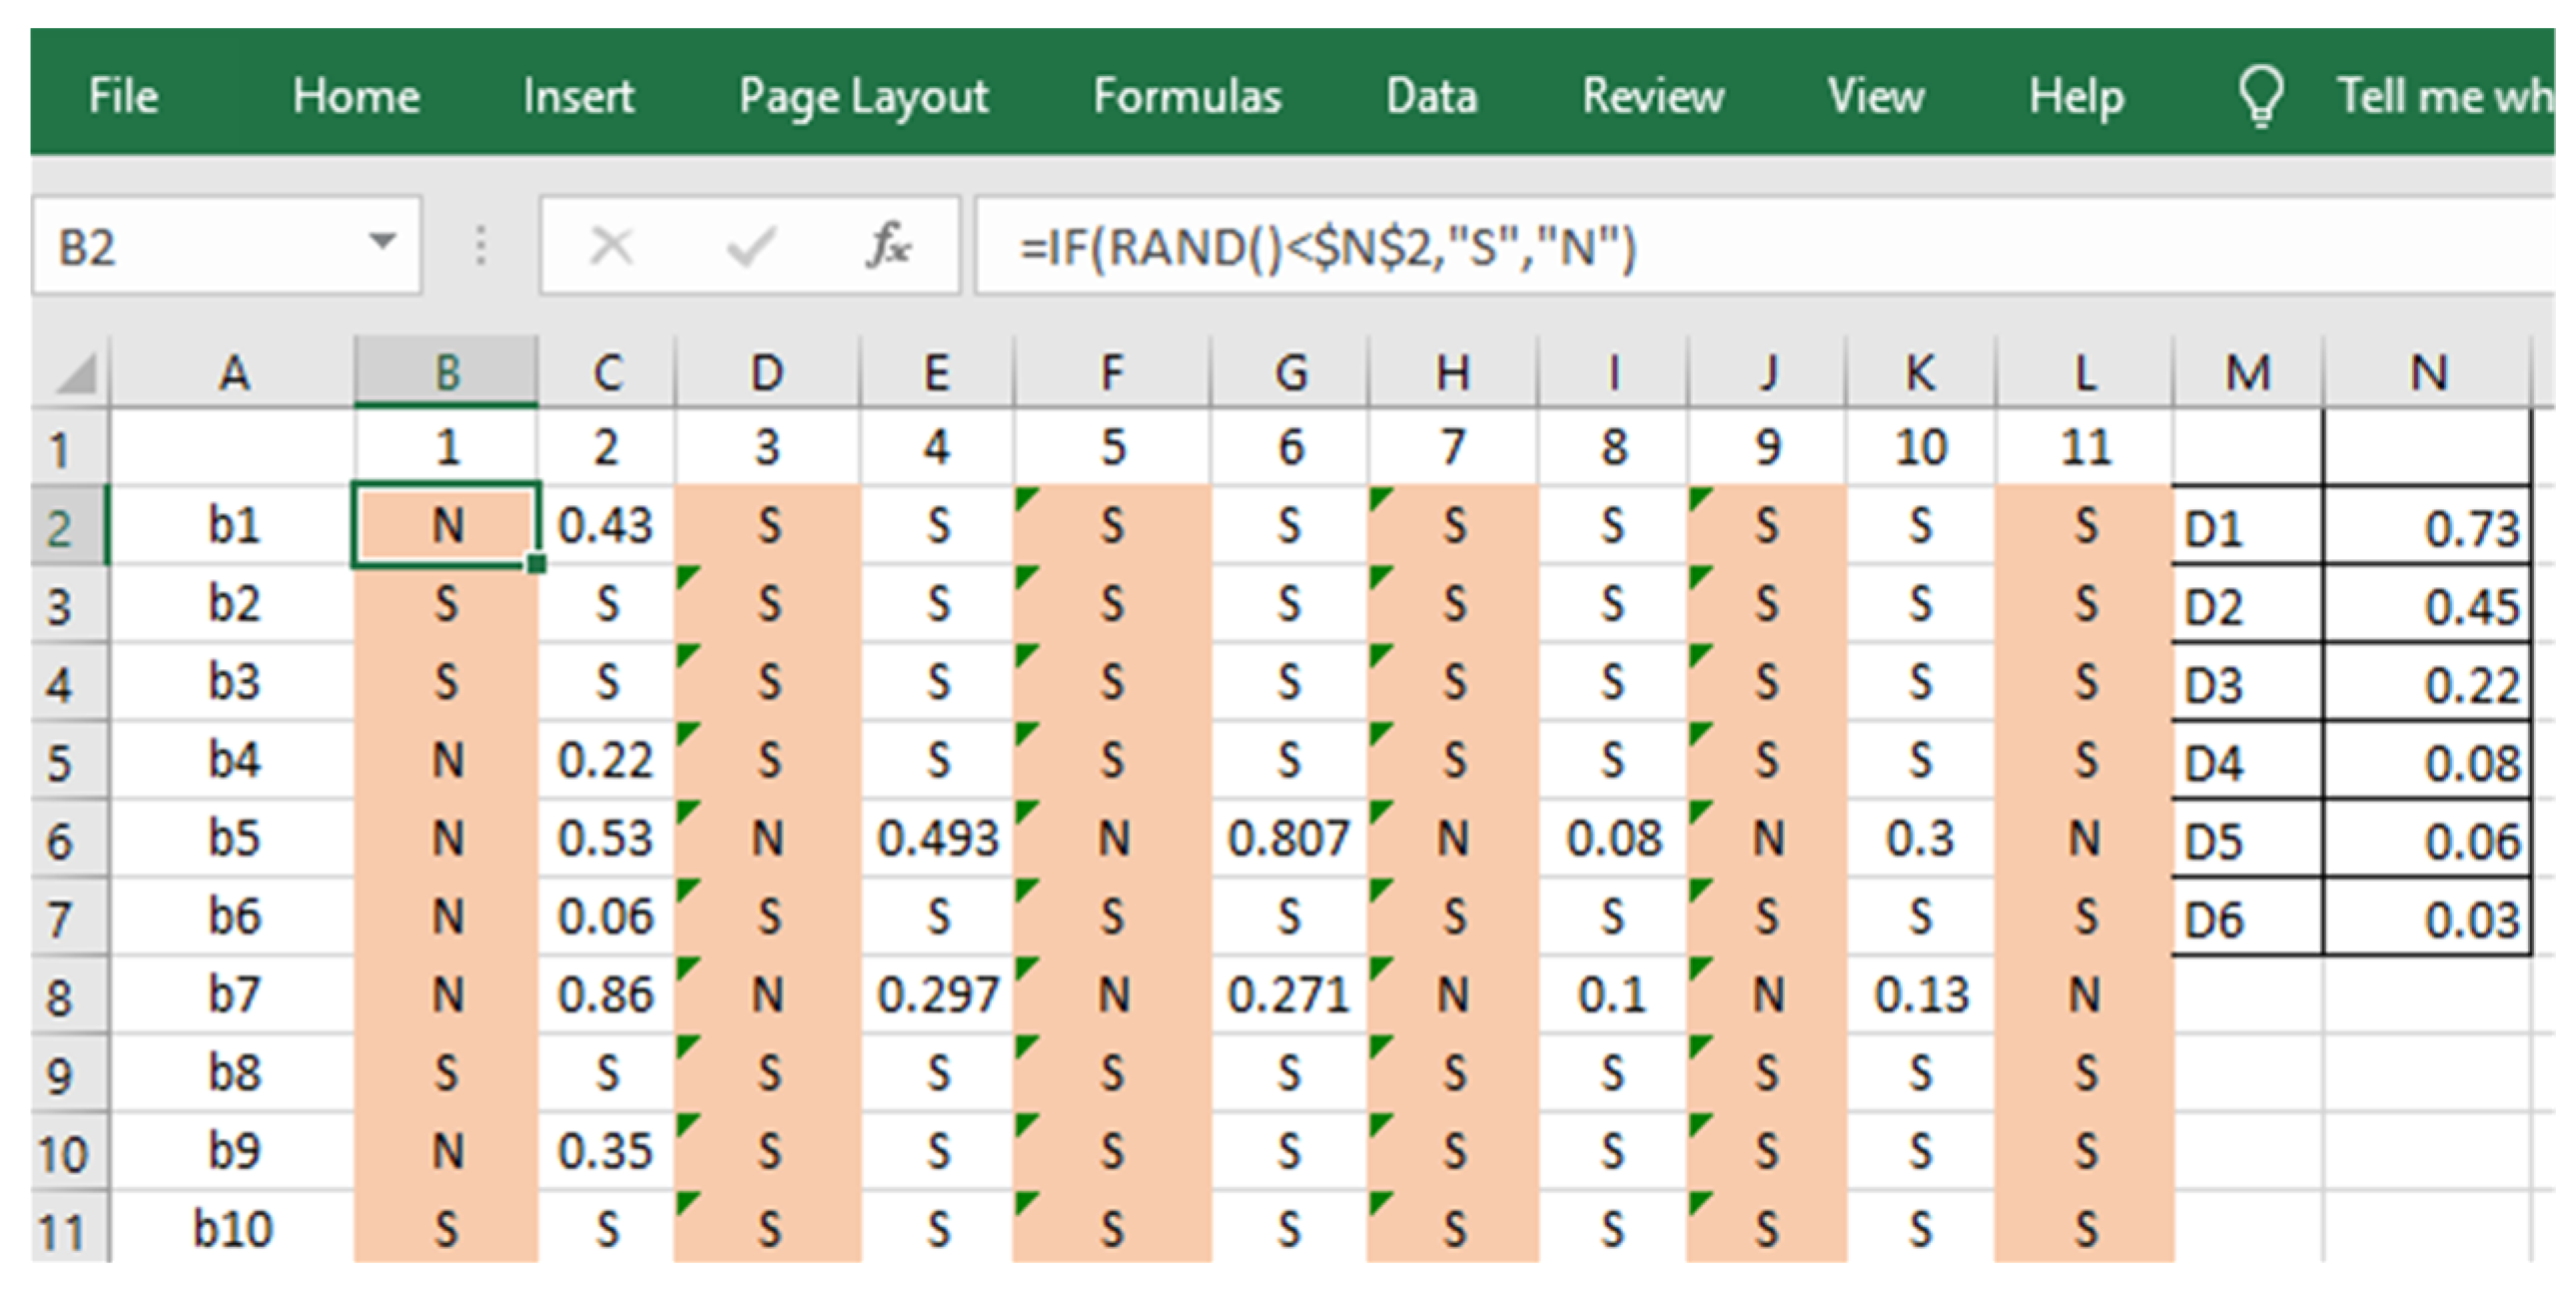
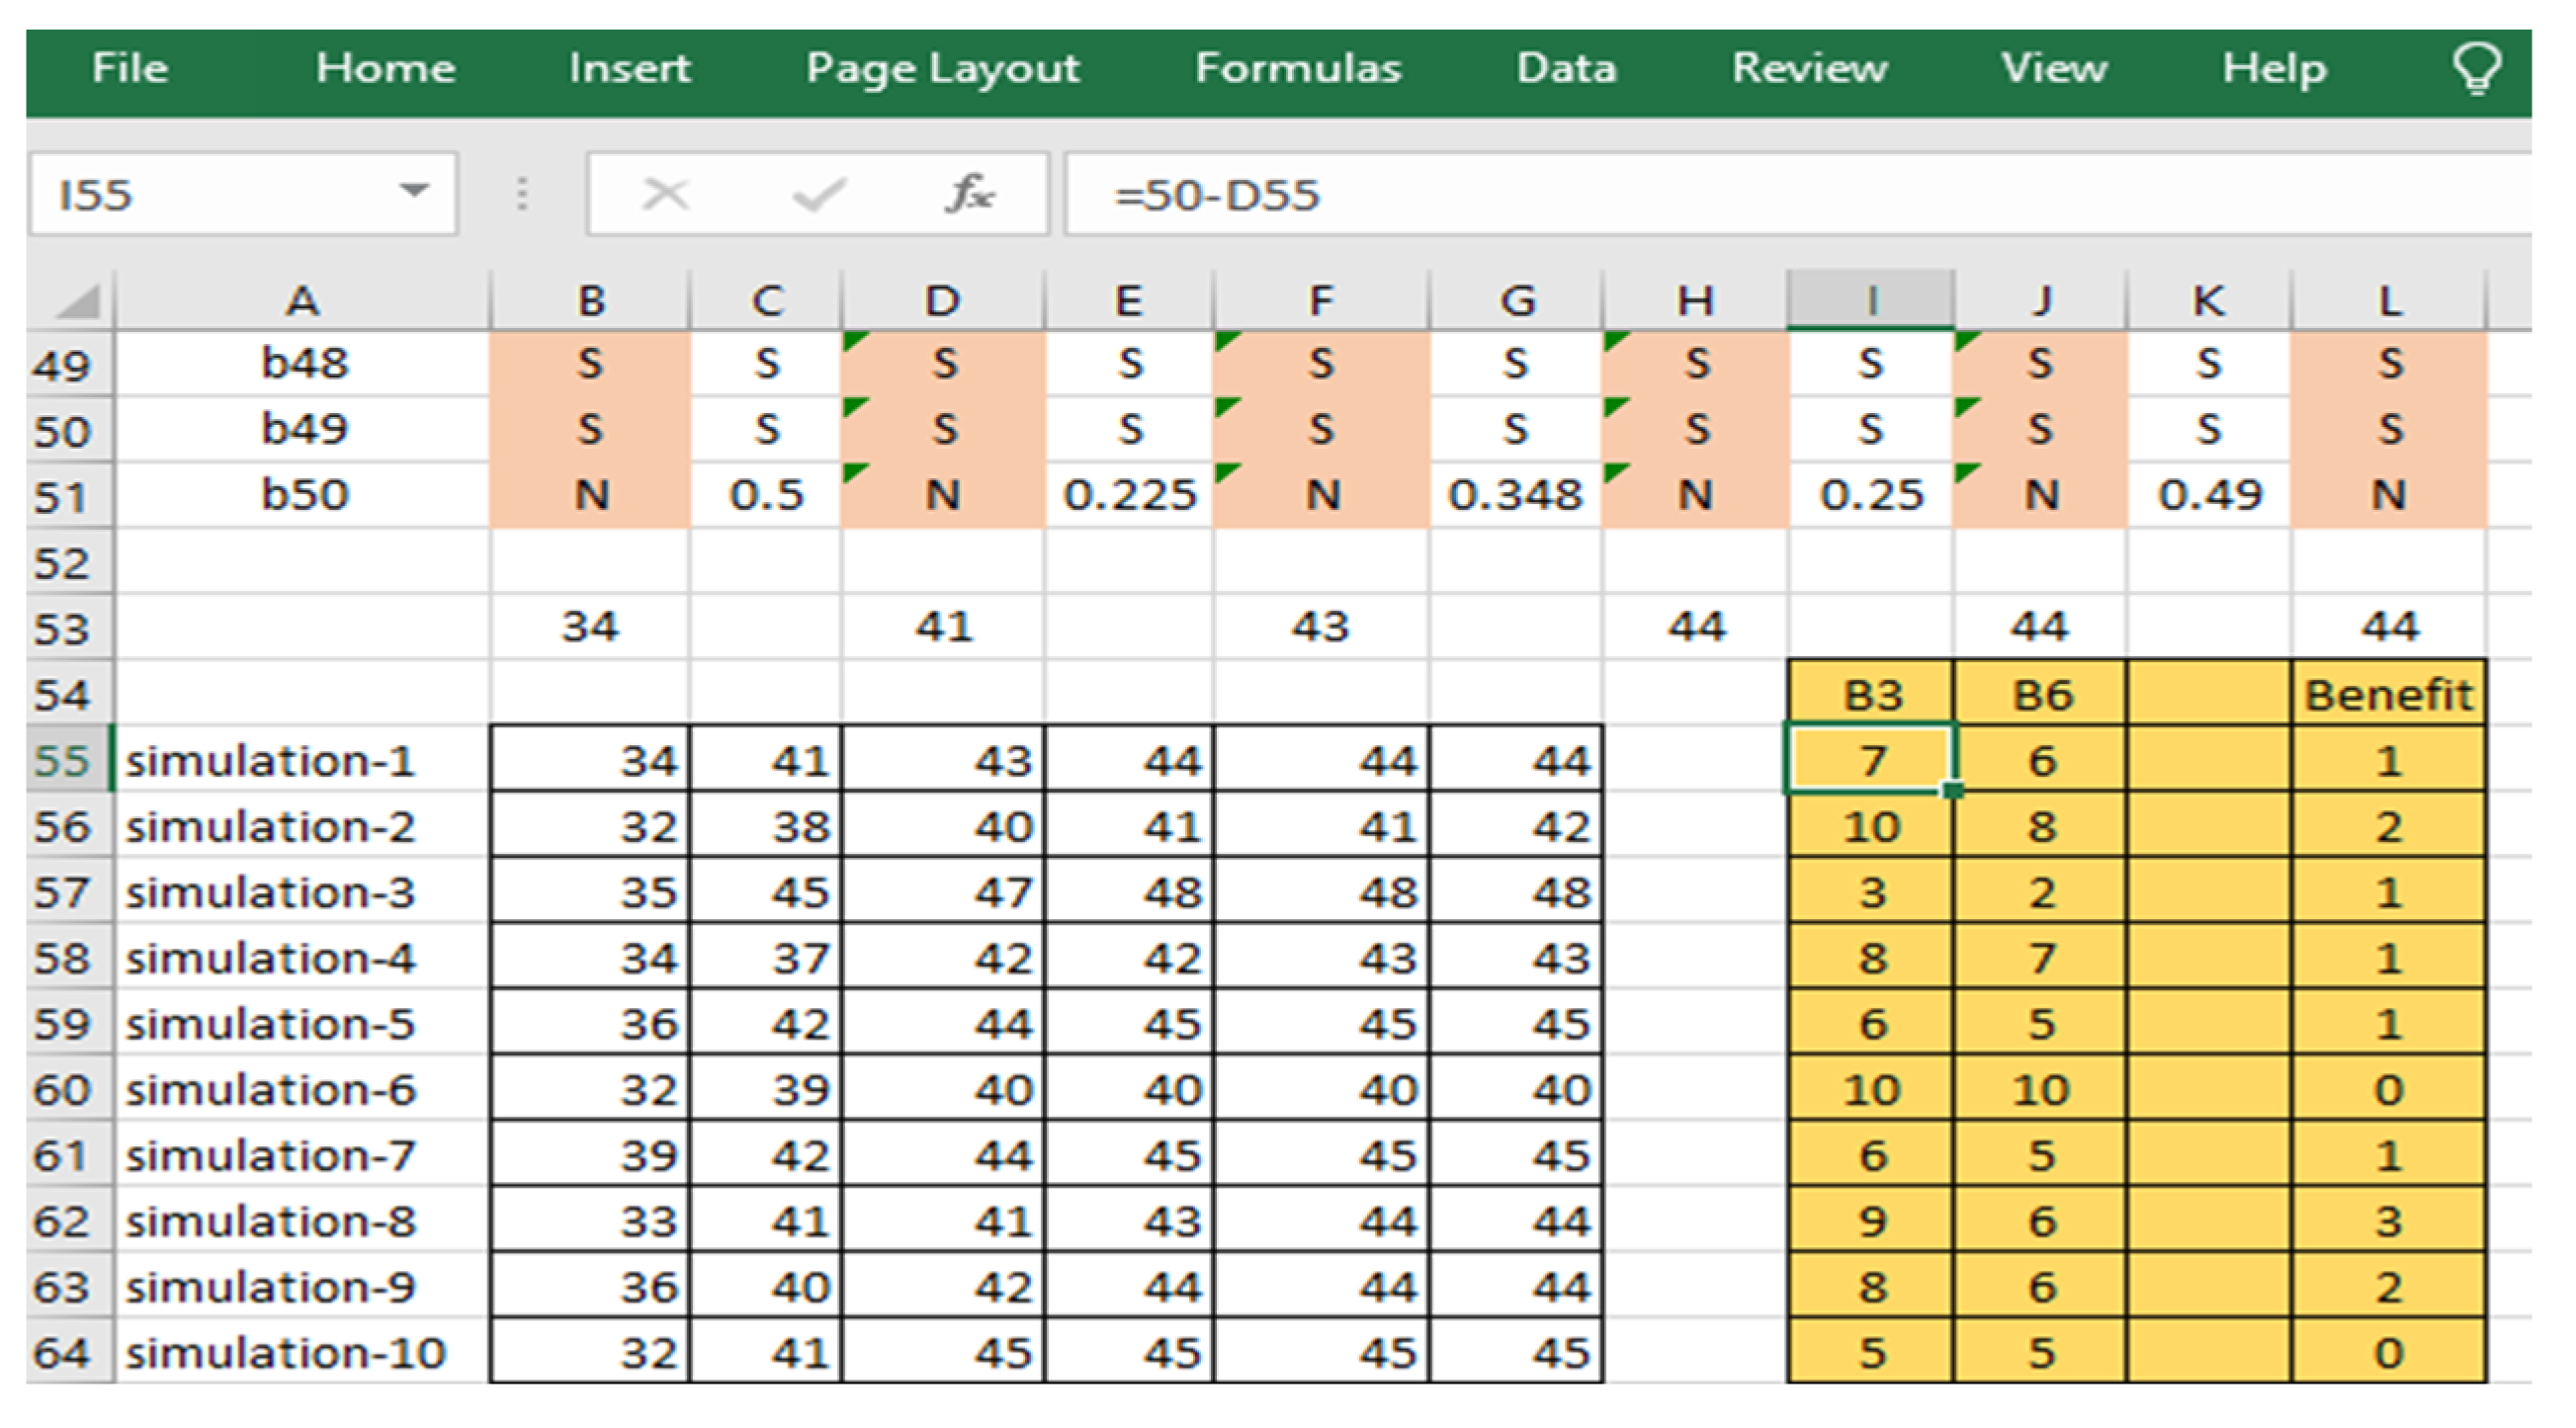
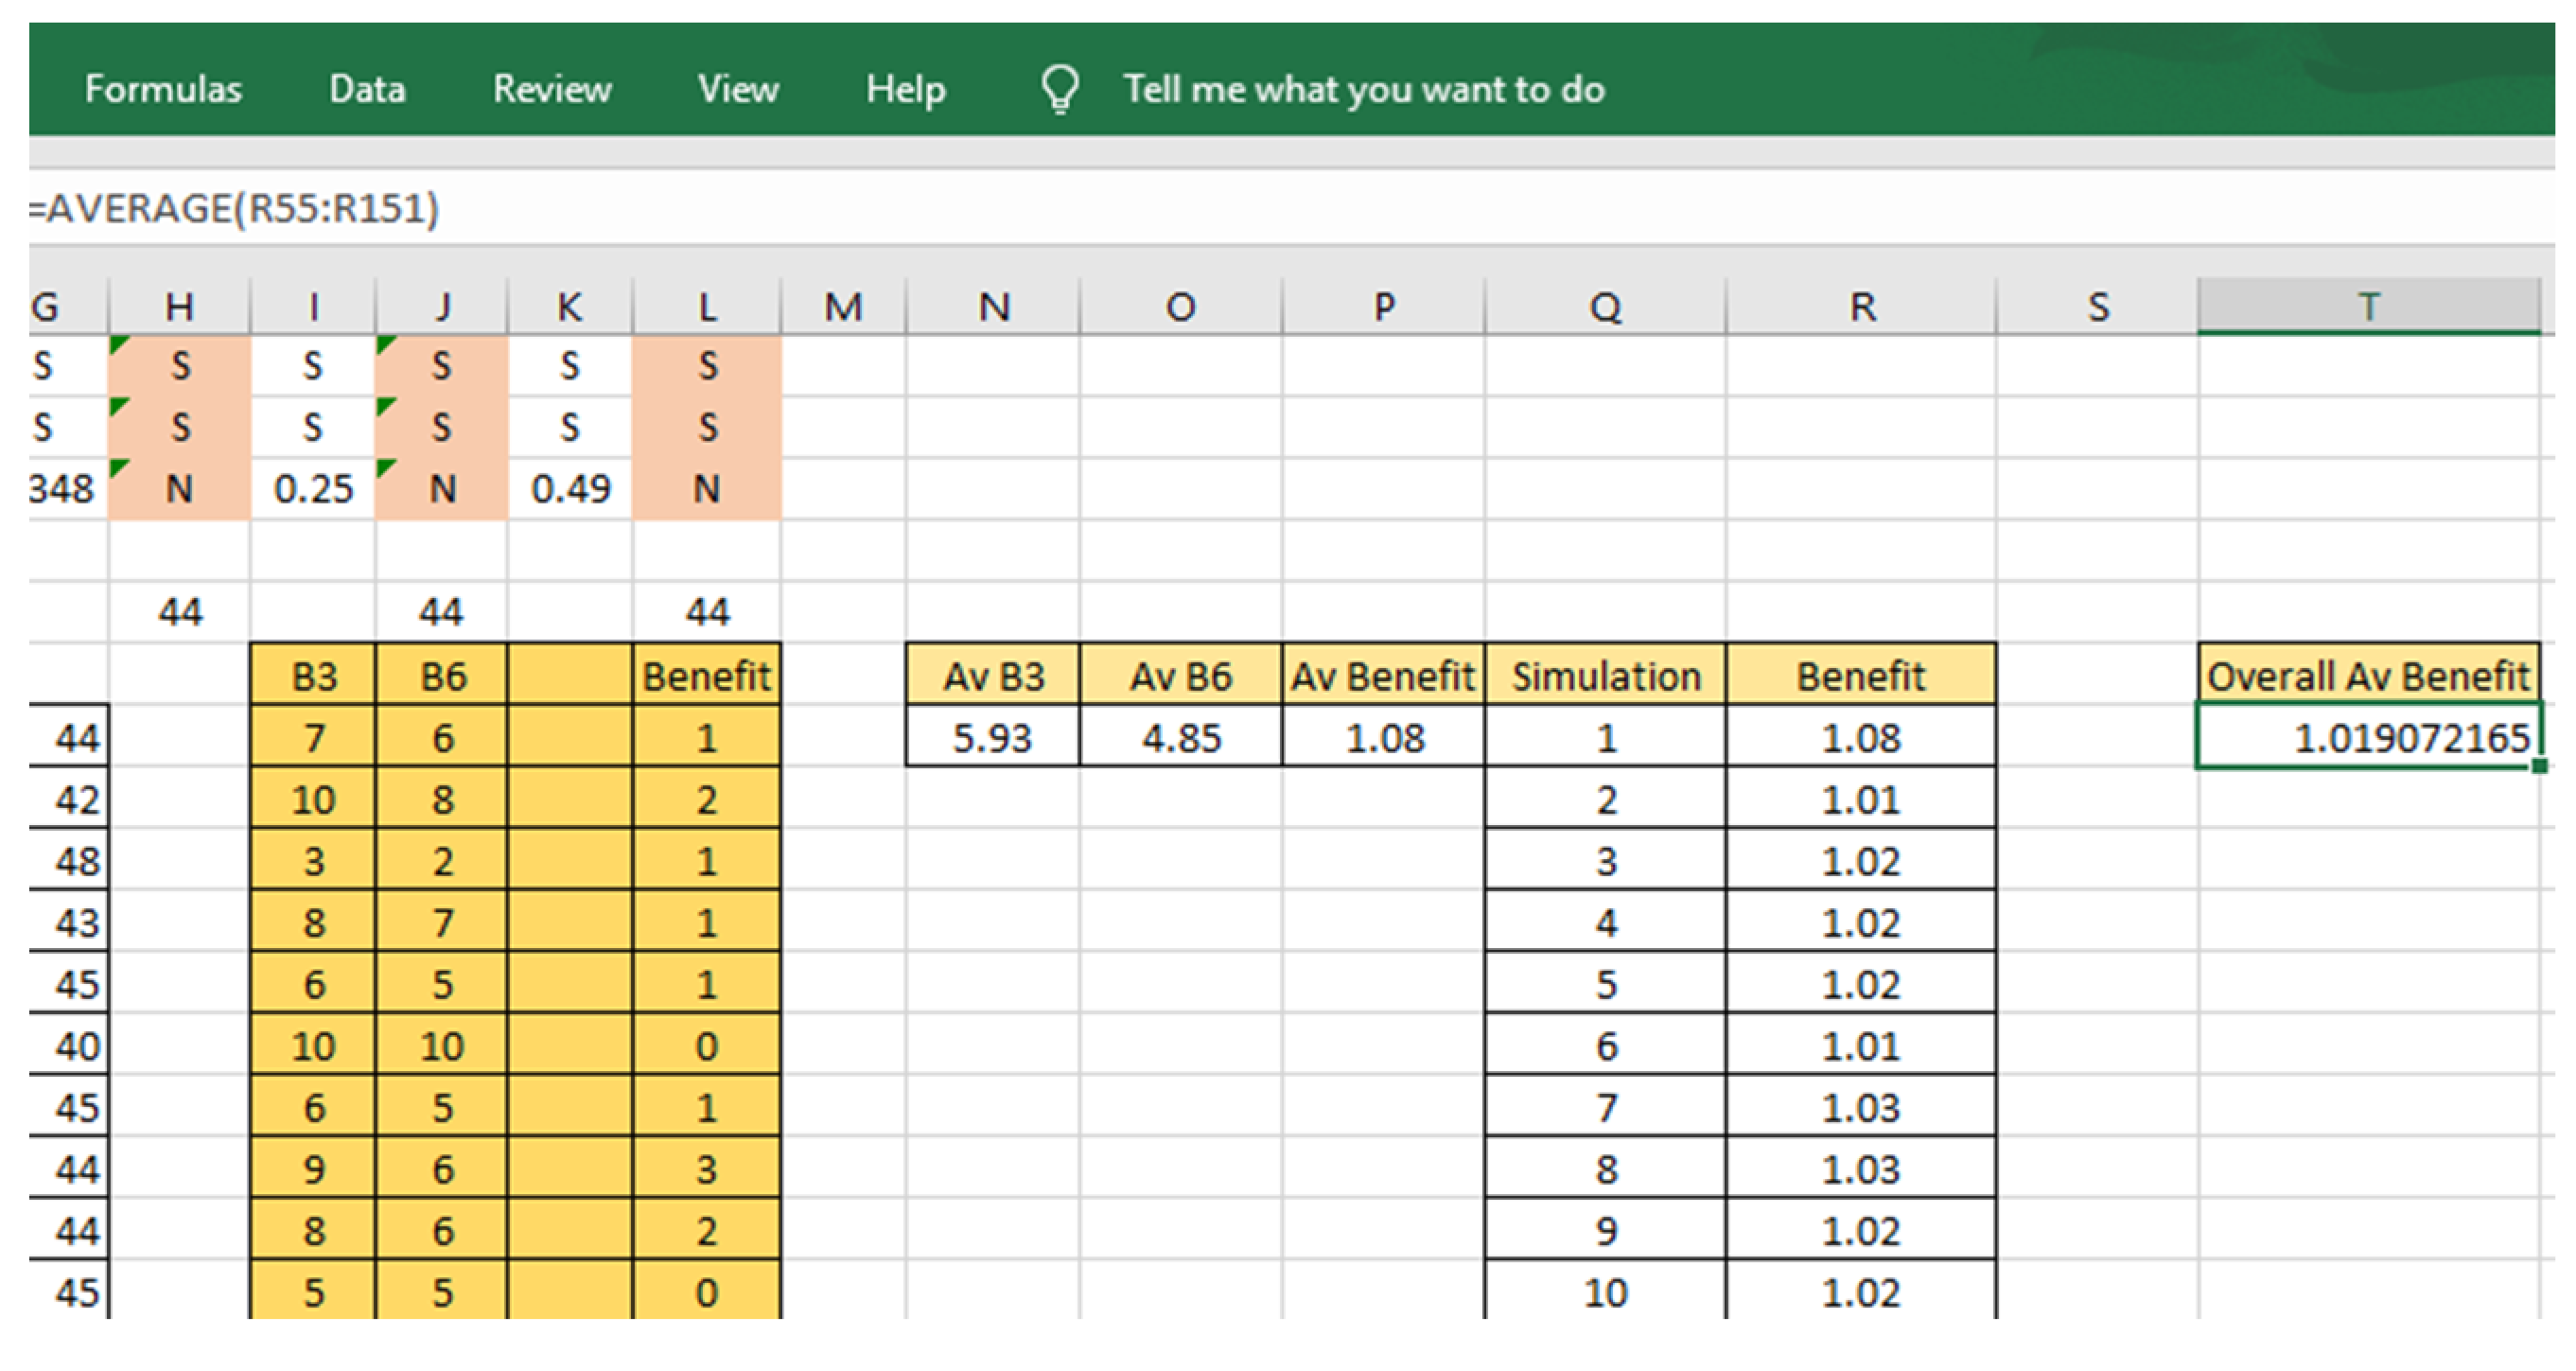
Data Collection and Simulation Procedure
- How much is the demand per day for a retailer?
- How many losses per day are from the retailer’s end?
- Which strategy do retailers follow to minimize waste?
- What is done with bread waste by the bakery?
- Which strategy does the bakery follow to minimize waste?
3. Result and Discussion
4. Conclusions
Author Contributions
Funding
Data Availability Statement
Acknowledgments
Conflicts of Interest
Appendix A

| CYCLE-1 | CYCLE-2 | CYCLE-3 | |||||||||||||||||
| DAY | D1 | D2 | D3 | D4 | D5 | D6 | D1 | D2 | D3 | D4 | D5 | D6 | D1 | D2 | D3 | D4 | D5 | D6 | |
| R1 | STOCK | 20 | 6 | 3 | 2 | 1 | 1 | 26 | 8 | 5 | 3 | 2 | 2 | 22 | 7 | 4 | 3 | 3 | 3 |
| SELL | 14 | 3 | 1 | 1 | 0 | 0 | 18 | 3 | 2 | 1 | 0 | 0 | 15 | 3 | 1 | 0 | 0 | 0 | |
| PROB | 0.7 | 0.5 | 0.333 | 0.5 | 0 | 0 | 0.69 | 0.38 | 0.4 | 0.33 | 0 | 0 | 0.68 | 0.43 | 0.3 | 0 | 0 | 0 | |
| CYCLE-1 | CYCLE-2 | CYCLE-3 | |||||||||||||||||
| DAY | D1 | D2 | D3 | D4 | D5 | D6 | D1 | D2 | D3 | D4 | D5 | D6 | D1 | D2 | D3 | D4 | D5 | D6 | |
| R2 | STOCK | 25 | 7 | 4 | 3 | 3 | 3 | 27 | 7 | 4 | 3 | 2 | 2 | 25 | 10 | 6 | 4 | 4 | 4 |
| SELL | 18 | 3 | 1 | 0 | 0 | 0 | 20 | 3 | 1 | 1 | 0 | 0 | 15 | 4 | 2 | 0 | 0 | 0 | |
| PROB | 0.72 | 0.43 | 0.25 | 0 | 0 | 0 | 0.74 | 0.43 | 0.25 | 0.33 | 0 | 0 | 0.6 | 0.4 | 0.3 | 0 | 0 | 0 | |
| CYCLE-1 | CYCLE-2 | CYCLE-3 | |||||||||||||||||
| DAY | D1 | D2 | D3 | D4 | D5 | D6 | D1 | D2 | D3 | D4 | D5 | D6 | D1 | D2 | D3 | D4 | D5 | D6 | |
| R3 | STOCK | 30 | 9 | 5 | 3 | 3 | 2 | 29 | 10 | 6 | 6 | 5 | 5 | 31 | 9 | 5 | 3 | 2 | 2 |
| SELL | 21 | 4 | 2 | 0 | 1 | 0 | 19 | 4 | 0 | 1 | 0 | 0 | 22 | 4 | 2 | 1 | 0 | 0 | |
| PROB | 0.7 | 0.44 | 0.4 | 0 | 0.33 | 0 | 0.66 | 0.4 | 0 | 0.17 | 0 | 0 | 0.71 | 0.44 | 0.4 | 0.333 | 0 | 0 | |
| CYCLE-1 | CYCLE-2 | CYCLE-3 | |||||||||||||||||
| DAY | D1 | D2 | D3 | D4 | D5 | D6 | D1 | D2 | D3 | D4 | D5 | D6 | D1 | D2 | D3 | D4 | D5 | D6 | |
| R4 | STOCK | 29 | 7 | 3 | 2 | 2 | 2 | 24 | 7 | 3 | 3 | 2 | 2 | 29 | 10 | 7 | 5 | 5 | 4 |
| SELL | 22 | 4 | 1 | 0 | 0 | 0 | 17 | 4 | 0 | 1 | 0 | 0 | 19 | 3 | 2 | 0 | 1 | 0 | |
| PROB | 0.7586 | 0.57 | 0.333 | 0 | 0 | 0 | 0.71 | 0.57 | 0 | 0.33 | 0 | 0 | 0.66 | 0.3 | 0.3 | 0 | 0.2 | 0 | |
| CYCLE-1 | CYCLE-2 | CYCLE-3 | |||||||||||||||||
| DAY | D1 | D2 | D3 | D4 | D5 | D6 | D1 | D2 | D3 | D4 | D5 | D6 | D1 | D2 | D3 | D4 | D5 | D6 | |
| R5 | STOCK | 22 | 5 | 3 | 2 | 2 | 2 | 18 | 1 | 0 | 0 | 0 | 0 | 18 | 6 | 2 | 1 | 1 | 1 |
| SELL | 17 | 2 | 1 | 0 | 0 | 0 | 17 | 1 | 0 | 0 | 0 | 0 | 12 | 4 | 1 | 0 | 0 | 0 | |
| PROB | 0.7727 | 0.4 | 0.333 | 0 | 0 | 0 | 0.94 | 1 | 0 | 0 | 0 | 0 | 0.67 | 0.67 | 0.5 | 0 | 0 | 0 | |
| CYCLE-1 | CYCLE-2 | CYCLE-3 | |||||||||||||||||
| DAY | D1 | D2 | D3 | D4 | D5 | D6 | D1 | D2 | D3 | D4 | D5 | D6 | D1 | D2 | D3 | D4 | D5 | D6 | |
| R6 | STOCK | 34 | 8 | 4 | 4 | 4 | 4 | 34 | 10 | 4 | 2 | 2 | 2 | 36 | 6 | 4 | 4 | 4 | 4 |
| SELL | 26 | 4 | 0 | 0 | 0 | 0 | 24 | 6 | 2 | 0 | 0 | 0 | 30 | 2 | 0 | 0 | 0 | 0 | |
| PROB | 0.7647 | 0.5 | 0 | 0 | 0 | 0 | 0.71 | 0.6 | 0.5 | 0 | 0 | 0 | 0.83 | 0.33 | 0 | 0 | 0 | 0 | |
| CYCLE-1 | CYCLE-2 | CYCLE-3 | |||||||||||||||||
| DAY | D1 | D2 | D3 | D4 | D5 | D6 | D1 | D2 | D3 | D4 | D5 | D6 | D1 | D2 | D3 | D4 | D5 | D6 | |
| R7 | STOCK | 28 | 6 | 3 | 2 | 1 | 1 | 31 | 7 | 3 | 2 | 2 | 2 | 29 | 8 | 4 | 3 | 3 | 3 |
| SELL | 22 | 3 | 1 | 1 | 0 | 0 | 24 | 4 | 1 | 0 | 0 | 0 | 21 | 4 | 1 | 0 | 0 | 0 | |
| PROB | 0.7857 | 0.5 | 0.333 | 0.5 | 0 | 0 | 0.77 | 0.57 | 0.33 | 0 | 0 | 0 | 0.72 | 0.5 | 0.3 | 0 | 0 | 0 | |
| CYCLE-1 | CYCLE-2 | CYCLE-3 | |||||||||||||||||
| DAY | D1 | D2 | D3 | D4 | D5 | D6 | D1 | D2 | D3 | D4 | D5 | D6 | D1 | D2 | D3 | D4 | D5 | D6 | |
| R8 | STOCK | 20 | 4 | 2 | 1 | 1 | 1 | 14 | 5 | 3 | 3 | 2 | 2 | 21 | 7 | 5 | 4 | 3 | 3 |
| SELL | 16 | 2 | 1 | 0 | 0 | 0 | 9 | 2 | 0 | 1 | 0 | 0 | 14 | 2 | 1 | 1 | 0 | 0 | |
| PROB | 0.8 | 0.5 | 0.5 | 0 | 0 | 0 | 0.64 | 0.4 | 0 | 0.33 | 0 | 0 | 0.67 | 0.29 | 0.2 | 0.25 | 0 | 0 | |
| CYCLE-1 | CYCLE-2 | CYCLE-3 | |||||||||||||||||
| DAY | D1 | D2 | D3 | D4 | D5 | D6 | D1 | D2 | D3 | D4 | D5 | D6 | D1 | D2 | D3 | D4 | D5 | D6 | |
| R9 | STOCK | 20 | 4 | 3 | 2 | 2 | 2 | 22 | 6 | 3 | 3 | 3 | 2 | 22 | 7 | 4 | 3 | 3 | 3 |
| SELL | 16 | 1 | 1 | 0 | 0 | 0 | 16 | 3 | 0 | 0 | 1 | 0 | 15 | 3 | 1 | 0 | 0 | 1 | |
| PROB | 0.8 | 0.25 | 0.333 | 0 | 0 | 0 | 0.73 | 0.5 | 0 | 0 | 0.33 | 0 | 0.68 | 0.43 | 0.3 | 0 | 0 | 0.3 | |
| CYCLE-1 | CYCLE-2 | CYCLE-3 | |||||||||||||||||
| DAY | D1 | D2 | D3 | D4 | D5 | D6 | D1 | D2 | D3 | D4 | D5 | D6 | D1 | D2 | D3 | D4 | D5 | D6 | |
| R10 | STOCK | 20 | 6 | 3 | 2 | 2 | 2 | 26 | 6 | 3 | 2 | 2 | 2 | 20 | 6 | 3 | 2 | 2 | 2 |
| SELL | 14 | 3 | 1 | 0 | 0 | 0 | 20 | 3 | 1 | 0 | 0 | 0 | 14 | 3 | 1 | 0 | 0 | 1 | |
| PROB | 0.7 | 0.5 | 0.333 | 0 | 0 | 0 | 0.77 | 0.5 | 0.33 | 0 | 0 | 0 | 0.7 | 0.5 | 0.3 | 0 | 0 | 0.5 | |
| CYCLE-4 | CYCLE-5 | CYCLE-6 | |||||||||||||||||
| D1 | D2 | D3 | D4 | D5 | D6 | D1 | D2 | D3 | D4 | D5 | D6 | D1 | D2 | D3 | D4 | D5 | D6 | ||
| R1 | 25 | 7 | 4 | 3 | 3 | 3 | 22 | 6 | 3 | 2 | 2 | 2 | 24 | 7 | 4 | 3 | 3 | 3 | |
| 18 | 3 | 1 | 0 | 0 | 0 | 16 | 3 | 1 | 0 | 0 | 0 | 17 | 3 | 1 | 0 | 0 | 0 | ||
| 0.72 | 0.43 | 0.25 | 0 | 0 | 0 | 0.73 | 0.5 | 0.333 | 0 | 0 | 0 | 0.71 | 0.43 | 0.3 | 0 | 0 | 0 | ||
| CYCLE-4 | CYCLE-5 | CYCLE-6 | |||||||||||||||||
| D1 | D2 | D3 | D4 | D5 | D6 | D1 | D2 | D3 | D4 | D5 | D6 | D1 | D2 | D3 | D4 | D5 | D6 | ||
| R2 | 30 | 8 | 4 | 3 | 2 | 2 | 23 | 6 | 3 | 2 | 2 | 2 | 28 | 9 | 5 | 4 | 4 | 4 | |
| 22 | 4 | 1 | 1 | 0 | 0 | 17 | 3 | 1 | 0 | 0 | 0 | 19 | 4 | 1 | 0 | 0 | 0 | ||
| 0.73 | 0.5 | 0.25 | 0.33 | 0 | 0 | 0.74 | 0.5 | 0.333 | 0 | 0 | 0 | 0.68 | 0.44 | 0.2 | 0 | 0 | 0 | ||
| CYCLE-4 | CYCLE-5 | CYCLE-6 | |||||||||||||||||
| D1 | D2 | D3 | D4 | D5 | D6 | D1 | D2 | D3 | D4 | D5 | D6 | D1 | D2 | D3 | D4 | D5 | D6 | ||
| R3 | 28 | 2 | 1 | 1 | 1 | 1 | 24 | 7 | 4 | 4 | 3 | 3 | 33 | 10 | 6 | 4 | 3 | 3 | |
| 26 | 1 | 0 | 0 | 0 | 0 | 17 | 3 | 0 | 1 | 0 | 0 | 23 | 4 | 2 | 1 | 0 | 1 | ||
| 0.93 | 0.5 | 0 | 0 | 0 | 0 | 0.71 | 0.429 | 0 | 0.25 | 0 | 0 | 0.7 | 0.4 | 0.3 | 0.25 | 0 | 0.333 | ||
| CYCLE-4 | CYCLE-5 | CYCLE-6 | |||||||||||||||||
| D1 | D2 | D3 | D4 | D5 | D6 | D1 | D2 | D3 | D4 | D5 | D6 | D1 | D2 | D3 | D4 | D5 | D6 | ||
| R4 | 27 | 7 | 4 | 3 | 3 | 3 | 26 | 9 | 5 | 4 | 4 | 4 | 29 | 7 | 3 | 3 | 3 | 2 | |
| 20 | 3 | 1 | 0 | 0 | 0 | 17 | 4 | 1 | 0 | 0 | 0 | 22 | 4 | 0 | 0 | 1 | 0 | ||
| 0.74 | 0.43 | 0.25 | 0 | 0 | 0 | 0.65 | 0.444 | 0.2 | 0 | 0 | 0 | 0.76 | 0.57 | 0 | 0 | 0.33 | 0 | ||
| CYCLE-4 | CYCLE-5 | CYCLE-6 | |||||||||||||||||
| D1 | D2 | D3 | D4 | D5 | D6 | D1 | D2 | D3 | D4 | D5 | D6 | D1 | D2 | D3 | D4 | D5 | D6 | ||
| R5 | 23 | 8 | 5 | 3 | 3 | 2 | 20 | 6 | 3 | 3 | 3 | 2 | 21 | 6 | 4 | 4 | 4 | 4 | |
| 15 | 3 | 2 | 0 | 1 | 0 | 14 | 3 | 0 | 0 | 1 | 0 | 15 | 2 | 0 | 0 | 0 | 0 | ||
| 0.65 | 0.38 | 0.4 | 0 | 0.33 | 0 | 0.7 | 0.5 | 0 | 0 | 0.33 | 0 | 0.71 | 0.33 | 0 | 0 | 0 | 0 | ||
| CYCLE-4 | CYCLE-5 | CYCLE-6 | |||||||||||||||||
| D1 | D2 | D3 | D4 | D5 | D6 | D1 | D2 | D3 | D4 | D5 | D6 | D1 | D2 | D3 | D4 | D5 | D6 | ||
| R6 | 30 | 8 | 3 | 2 | 2 | 2 | 38 | 10 | 5 | 3 | 3 | 2 | 32 | 7 | 6 | 6 | 6 | 6 | |
| 22 | 5 | 1 | 0 | 0 | 0 | 28 | 5 | 2 | 0 | 1 | 0 | 25 | 1 | 0 | 0 | 0 | 0 | ||
| 0.73 | 0.63 | 0.33 | 0 | 0 | 0 | 0.74 | 0.5 | 0.4 | 0 | 0.33 | 0 | 0.78 | 0.14 | 0 | 0 | 0 | 0 | ||
| CYCLE-4 | CYCLE-5 | CYCLE-6 | |||||||||||||||||
| D1 | D2 | D3 | D4 | D5 | D6 | D1 | D2 | D3 | D4 | D5 | D6 | D1 | D2 | D3 | D4 | D5 | D6 | ||
| R7 | 32 | 9 | 5 | 5 | 4 | 4 | 30 | 9 | 5 | 3 | 2 | 2 | 32 | 10 | 5 | 4 | 4 | 4 | |
| 23 | 4 | 0 | 1 | 0 | 0 | 21 | 4 | 2 | 1 | 0 | 0 | 22 | 5 | 1 | 0 | 0 | 0 | ||
| 0.72 | 0.44 | 0 | 0.2 | 0 | 0 | 0.7 | 0.444 | 0.4 | 0.333 | 0 | 0 | 0.69 | 0.5 | 0.2 | 0 | 0 | 0 | ||
| CYCLE-4 | CYCLE-5 | CYCLE-6 | |||||||||||||||||
| D1 | D2 | D3 | D4 | D5 | D6 | D1 | D2 | D3 | D4 | D5 | D6 | D1 | D2 | D3 | D4 | D5 | D6 | ||
| R8 | 16 | 6 | 2 | 1 | 1 | 1 | 20 | 1 | 1 | 1 | 1 | 1 | 11 | 2 | 2 | 2 | 2 | 1 | |
| 10 | 4 | 1 | 0 | 0 | 0 | 19 | 0 | 0 | 0 | 0 | 0 | 9 | 0 | 0 | 0 | 1 | 0 | ||
| 0.63 | 0.67 | 0.5 | 0 | 0 | 0 | 0.95 | 0 | 0 | 0 | 0 | 0 | 0.82 | 0 | 0 | 0 | 0.5 | 0 | ||
| CYCLE-4 | CYCLE-5 | CYCLE-6 | |||||||||||||||||
| D1 | D2 | D3 | D4 | D5 | D6 | D1 | D2 | D3 | D4 | D5 | D6 | D1 | D2 | D3 | D4 | D5 | D6 | ||
| R9 | 23 | 2 | 2 | 2 | 2 | 1 | 17 | 4 | 2 | 2 | 1 | 1 | 25 | 6 | 4 | 4 | 4 | 3 | |
| 21 | 0 | 0 | 0 | 1 | 0 | 13 | 2 | 0 | 1 | 0 | 0 | 19 | 2 | 0 | 0 | 1 | 0 | ||
| 0.91 | 0 | 0 | 0 | 0.5 | 0 | 0.76 | 0.5 | 0 | 0.5 | 0 | 0 | 0.76 | 0.33 | 0 | 0 | 0.25 | 0 | ||
| CYCLE-4 | CYCLE-5 | CYCLE-6 | |||||||||||||||||
| D1 | D2 | D3 | D4 | D5 | D6 | D1 | D2 | D3 | D4 | D5 | D6 | D1 | D2 | D3 | D4 | D5 | D6 | ||
| R10 | 26 | 7 | 3 | 2 | 2 | 2 | 21 | 6 | 3 | 2 | 2 | 2 | 25 | 8 | 4 | 3 | 3 | 3 | |
| 19 | 4 | 1 | 0 | 0 | 0 | 15 | 3 | 1 | 0 | 0 | 0 | 17 | 4 | 1 | 0 | 0 | 1 | ||
| 0.73 | 0.57 | 0.33 | 0 | 0 | 0 | 0.71 | 0.5 | 0.333 | 0 | 0 | 0 | 0.68 | 0.5 | 0.3 | 0 | 0 | 0.333 | ||
| CYCLE-1 | CYCLE-2 | CYCLE-3 | ||||||||||||||||
| D1 | D2 | D3 | D4 | D5 | D6 | D1 | D2 | D3 | D4 | D5 | D6 | D1 | D2 | D3 | D4 | D5 | D6 | |
| R1 | 0.7 | 0.5 | 0.33 | 0.5 | 0 | 0 | 0.692 | 0.375 | 0.4 | 0.333 | 0 | 0 | 0.682 | 0.429 | 0.25 | 0 | 0 | 0 |
| R2 | 0.72 | 0.43 | 0.25 | 0 | 0 | 0 | 0.741 | 0.429 | 0.25 | 0.333 | 0 | 0 | 0.6 | 0.4 | 0.33 | 0 | 0 | 0 |
| R3 | 0.7 | 0.44 | 0.4 | 0 | 0.333 | 0 | 0.655 | 0.4 | 0 | 0.167 | 0 | 0 | 0.71 | 0.444 | 0.4 | 0 | 0 | 0 |
| R4 | 0.759 | 0.57 | 0.33 | 0 | 0 | 0 | 0.708 | 0.571 | 0 | 0.333 | 0 | 0 | 0.655 | 0.3 | 0.29 | 0 | 0.2 | 0 |
| R5 | 0.773 | 0.4 | 0.33 | 0 | 0 | 0 | 0.944 | 1 | 0 | 0 | 0 | 0 | 0.667 | 0.667 | 0.5 | 0 | 0 | 0 |
| R6 | 0.765 | 0.5 | 0 | 0 | 0 | 0 | 0.706 | 0.6 | 0.5 | 0 | 0 | 0 | 0.833 | 0.333 | 0 | 0 | 0 | 0 |
| R7 | 0.786 | 0.5 | 0.33 | 0.5 | 0 | 0 | 0.774 | 0.571 | 0.333 | 0 | 0 | 0 | 0.724 | 0.5 | 0.25 | 0 | 0 | 0 |
| R8 | 0.8 | 0.5 | 0.5 | 0 | 0 | 0 | 0.643 | 0.4 | 0 | 0.333 | 0 | 0 | 0.667 | 0.286 | 0.2 | 0 | 0 | 0 |
| R9 | 0.8 | 0.25 | 0.33 | 0 | 0 | 0 | 0.727 | 0.5 | 0 | 0 | 0.33 | 0 | 0.682 | 0.429 | 0.25 | 0 | 0 | 0 |
| R10 | 0.7 | 0.5 | 0.33 | 0 | 0 | 0 | 0.769 | 0.5 | 0.333 | 0 | 0 | 0 | 0.7 | 0.5 | 0.33 | 0 | 0 | 1 |
| AVERAGE | 0.75 | 0.46 | 0.32 | 0.1 | 0.033 | 0 | 0.736 | 0.535 | 0.182 | 0.15 | 0.03 | 0 | 0.692 | 0.429 | 0.28 | 0 | 0.02 | 0 |
| CYCLE-4 | CYCLE-5 | CYCLE-6 | ||||||||||||||||
| D1 | D2 | D3 | D4 | D5 | D6 | D1 | D2 | D3 | D4 | D5 | D6 | D1 | D2 | D3 | D4 | D5 | D6 | |
| 0.72 | 0.43 | 0.25 | 0 | 0 | 0 | 0.73 | 0.5 | 0.33 | 0 | 0 | 0 | 0.708 | 0.429 | 0.25 | 0 | 0 | 0 | |
| 0.73 | 0.5 | 0.25 | 0.33 | 0 | 0 | 0.74 | 0.5 | 0.33 | 0 | 0 | 0 | 0.679 | 0.444 | 0.2 | 0 | 0 | 0 | |
| 0.93 | 0.5 | 0 | 0 | 0 | 0 | 0.71 | 0.429 | 0 | 0.25 | 0 | 0 | 0.697 | 0.4 | 0.33 | 0.25 | 0 | 0.33 | |
| 0.74 | 0.43 | 0.25 | 0 | 0 | 0 | 0.65 | 0.444 | 0.2 | 0 | 0 | 0 | 0.759 | 0.571 | 0 | 0 | 0.333 | 0 | |
| 0.65 | 0.38 | 0.4 | 0 | 0.333 | 0 | 0.7 | 0.5 | 0 | 0 | 0.333 | 0 | 0.714 | 0.333 | 0 | 0 | 0 | 0 | |
| 0.73 | 0.63 | 0.33 | 0 | 0 | 0 | 0.74 | 0.5 | 0.4 | 0 | 0.333 | 0 | 0.781 | 0.143 | 0 | 0 | 0 | 0 | |
| 0.72 | 0.44 | 0 | 0.2 | 0 | 0 | 0.7 | 0.444 | 0.4 | 0.33 | 0 | 0 | 0.688 | 0.5 | 0.2 | 0 | 0 | 0 | |
| 0.63 | 0.67 | 0.5 | 0 | 0 | 0 | 0.95 | 0 | 0 | 0 | 0 | 0 | 0.818 | 0 | 0 | 0 | 0.5 | 0 | |
| 0.91 | 0 | 0 | 0 | 0.5 | 0 | 0.76 | 0.5 | 0 | 0.5 | 0 | 0 | 0.76 | 0.333 | 0 | 0 | 0.25 | 0 | |
| 0.73 | 0.57 | 0.33 | 0 | 0 | 0 | 0.71 | 0.5 | 0.33 | 0 | 0 | 0 | 0.68 | 0.5 | 0.25 | 0 | 0 | 0.33 | |
| 0.75 | 0.45 | 0.23 | 0.05 | 0.083 | 0 | 0.74 | 0.432 | 0.2 | 0.11 | 0.067 | 0 | 0.728 | 0.365 | 0.12 | 0.03 | 0.108 | 0.07 | |
| CYCLE | DAYS | |||||
|---|---|---|---|---|---|---|
| D1 | D2 | D3 | D4 | D5 | D6 | |
| CYCLE-1 | 0.75 | 0.46 | 0.32 | 0.1 | 0.033 | 0 |
| CYCLE-2 | 0.736 | 0.535 | 0.182 | 0.15 | 0.03 | 0.736 |
| CYCLE-3 | 0.692 | 0.429 | 0.28 | 0 | 0.02 | 0 |
| CYCLE-4 | 0.75 | 0.45 | 0.23 | 0.05 | 0.083 | 0 |
| CYCLE-5 | 0.74 | 0.432 | 0.2 | 0.11 | 0.067 | 0 |
| CYCLE-6 | 0.728 | 0.365 | 0.12 | 0.03 | 0.108 | 0.07 |
| AVERAGE | 0.73 | 0.45 | 0.22 | 0.08 | 0.06 | 0.03 |
References
- Secondi, L.; Principato, L.; Laureti, T. Household food waste behaviour in EU-27 countries: A multilevel analysis. Food Policy 2015, 56, 25–40. [Google Scholar] [CrossRef]
- Colin, W. Trigeminal intraoral schwannomas. Compendium 1990, 11, 672, 674–677. [Google Scholar]
- FAO. Food Wastage Footprint. 2013. Available online: www.fao.org/publications (accessed on 9 July 2022).
- Goryńska-Goldmann, E.; Gazdecki, M.; Rejman, K.; Kobus-Cisowska, J.; Łaba, S.; Łaba, R. How to prevent bread losses in the baking and confectionery industry?—Measurement, causes, management and prevention. Agriculture 2021, 11, 19. [Google Scholar] [CrossRef]
- Brancoli, P.; Bolton, K.; Eriksson, M. Environmental impacts of waste management and valorisation pathways for surplus bread in Sweden. Waste Manag. 2020, 117, 136–145. [Google Scholar] [CrossRef] [PubMed]
- Blakeney, M. Food Loss and Food Waste: Causes and Solutions; Edward Elgar Publishing: Cheltenham, UK, 2019; ISBN 9781788975391. [Google Scholar]
- Zacharias, T. India Has a Food Wastage Problem. Here’s How Individuals Can Make a Difference. Available online: https://indianexpress.com/article/opinion/columns/food-waste-index-report-india-coronavirus-hunder-index-7261909/ (accessed on 9 July 2022).
- Samray, M.N.; Masatcioglu, T.M.; Koksel, H. Bread crumbs extrudates: A new approach for reducing bread waste. J. Cereal Sci. 2019, 85, 130–136. [Google Scholar] [CrossRef]
- AIBMA. All India Bread Manufacturers’ Association. Available online: http://www.aibma.com/industry.html (accessed on 9 July 2022).
- Eriksson, M.; Ghosh, R.; Mattsson, L.; Ismatov, A. Take-back agreements in the perspective of food waste generation at the supplier-retailer interface. Resour. Conserv. Recycl. 2017, 122, 83–93. [Google Scholar] [CrossRef]
- Soni, R.; Bhardwaj, A.; Singh, L.P. Bread Waste and Mitigation Strategies: A Review Bread Waste and Mitigation Strategies: A Review. IOP Conf. Ser. Mater. Sci. Engineering 2022, 1248, 012010. [Google Scholar] [CrossRef]
- Brancoli, P.; Lundin, M.; Bolton, K.; Eriksson, M. Bread loss rates at the supplier-retailer interface—Analysis of risk factors to support waste prevention measures. Resour. Conserv. Recycl. 2019, 147, 128–136. [Google Scholar] [CrossRef]
- Beretta, C.; Stoessel, F.; Baier, U.; Hellweg, S. Quantifying food losses and the potential for reduction in Switzerland. Waste Manag. 2013, 33, 764–773. [Google Scholar] [CrossRef] [Green Version]
- Brancoli, P.; Rousta, K.; Bolton, K. Life cycle assessment of supermarket food waste. Resour. Conserv. Recycl. 2017, 118, 39–46. [Google Scholar] [CrossRef]
- Lebersorger, S.; Schneider, F. Food loss rates at the food retail, influencing factors and reasons as a basis for waste prevention measures. Waste Manag. 2014, 34, 1911–1919. [Google Scholar] [CrossRef] [PubMed]
- Ghosh, R.; Eriksson, M. Food waste due to retail power in supply chains: Evidence from Sweden. Glob. Food Sec. 2019, 20, 1–8. [Google Scholar] [CrossRef]
- Holweg, C.; Teller, C.; Kotzab, H. Unsaleable grocery products, their residual value and instore logistics. Int. J. Phys. Distrib. Logist. Manag. 2016, 46, 634–658. [Google Scholar] [CrossRef]
- Cicatiello, C.; Franco, S.; Pancino, B.; Blasi, E.; Falasconi, L. The dark side of retail food waste: Evidences from in-store data. Resour. Conserv. Recycl. 2017, 125, 273–281. [Google Scholar] [CrossRef]
- Falasconi, L.; Vittuari, M.; Politano, A.; Segrè, A. Food waste in school catering: An Italian case study. Sustainability 2015, 7, 14745–14760. [Google Scholar] [CrossRef] [Green Version]
- Silvennoinen, K.; Heikkilä, L.; Katajajuuri, J.M.; Reinikainen, A. Food waste volume and origin: Case studies in the Finnish food service sector. Waste Manag. 2015, 46, 140–145. [Google Scholar] [CrossRef]
- Hanssen, O.J.; Syversen, F.; Stø, E. Edible food waste from Norwegian households—Detailed food waste composition analysis among households in two different regions in Norway. Resour. Conserv. Recycl. 2016, 109, 146–154. [Google Scholar] [CrossRef]
- Mohd, N.; Mazlina, S.; Kamal, M.; Sulaiman, A.; Saleena, F.; Omar, R. Consumers’ delayed consumption of bakery products: Effect on physical and chemical properties. J. Agric. Food Eng. 2020, 1, 1–6. [Google Scholar] [CrossRef]
- Nasir, S.; Allai, F.M.; Gani, M.; Ganaie, S.; Gul, K.; Jabeen, A.; Majeed, D. Physical, Textural, Rheological, and Sensory Characteristics of Amaranth-Based Wheat Flour Bread. Int. J. Food Sci. 2020, 2020, 8874872. [Google Scholar] [CrossRef]
- Yashavanthakumar, K.J.; Baviskar, V.S.; Navathe, S.; Patil, R.M.; Bagwan, J.H.; Bankar, D.N.; Gite, V.D.; Gopalareddy, K.; Mishra, C.N.; Mamrutha, H.M.; et al. Impact of heat and drought stress on phenological development and yield in bread wheat. Plant Physiol. Rep. 2021, 26, 357–367. [Google Scholar] [CrossRef]
- Garrone, P.; Melacini, M.; Perego, A. Opening the black box of food waste reduction. Food Policy 2014, 46, 129–139. [Google Scholar] [CrossRef]
- Wikström, F.; Verghese, K.; Auras, R.; Olsson, A.; Williams, H.; Wever, R.; Grönman, K.; Kvalvåg Pettersen, M.; Møller, H.; Soukka, R. Packaging Strategies That Save Food: A Research Agenda for 2030. J. Ind. Ecol. 2019, 23, 532–540. [Google Scholar] [CrossRef]
- Dora, M.; Biswas, S.; Choudhary, S.; Nayak, R.; Irani, Z. A system-wide interdisciplinary conceptual framework for food loss and waste mitigation strategies in the supply chain. Ind. Mark. Manag. 2021, 93, 492–508. [Google Scholar] [CrossRef]
- Zhang, H.; Duan, H.; Andric, J.M.; Song, M.; Yang, B. Characterization of household food waste and strategies for its reduction: A Shenzhen City case study. Waste Manag. 2018, 78, 426–433. [Google Scholar] [CrossRef] [PubMed]
- Goryńska-Goldmann, E.; Gazdecki, M.; Rejman, K.; Łaba, S.; Kobus-Cisowska, J.; Szczepański, K. Magnitude, causes and scope for reducing food losses in the baking and confectionery industry—A multi-method approach. Agriculture 2021, 11, 936. [Google Scholar] [CrossRef]
- Lombardi, M.; Costantino, M. A social innovation model for reducing food waste: The case study of an italian non-profit organization. Adm. Sci. 2020, 10, 45. [Google Scholar] [CrossRef]
- Albizzati, P.F.; Tonini, D.; Chammard, C.B.; Astrup, T.F. Valorisation of surplus food in the French retail sector: Environmental and economic impacts. Waste Manag. 2019, 90, 141–151. [Google Scholar] [CrossRef]
- Dadi, V.; Nikhil, S.R.; Mor, R.S.; Agarwal, T.; Arora, S. Agri-food 4.0 and innovations: Revamping the supply chain operations. Prod. Eng. Arch. 2021, 27, 75–89. [Google Scholar] [CrossRef]
- Mor, R.S.; Bhardwaj, A.; Singh, S. Integration of SWOT-AHP approach for measuring the critical factors of dairy supply chain. Logistics 2019, 3, 9. [Google Scholar] [CrossRef]


| S. No | Source | Bread Waste Type |
|---|---|---|
| 1 | Consumers |
|
| 2 | Retailers |
|
| 3 | Distributors |
|
| 4 | Agency Holders |
|
| 5 | Manufacturers |
|
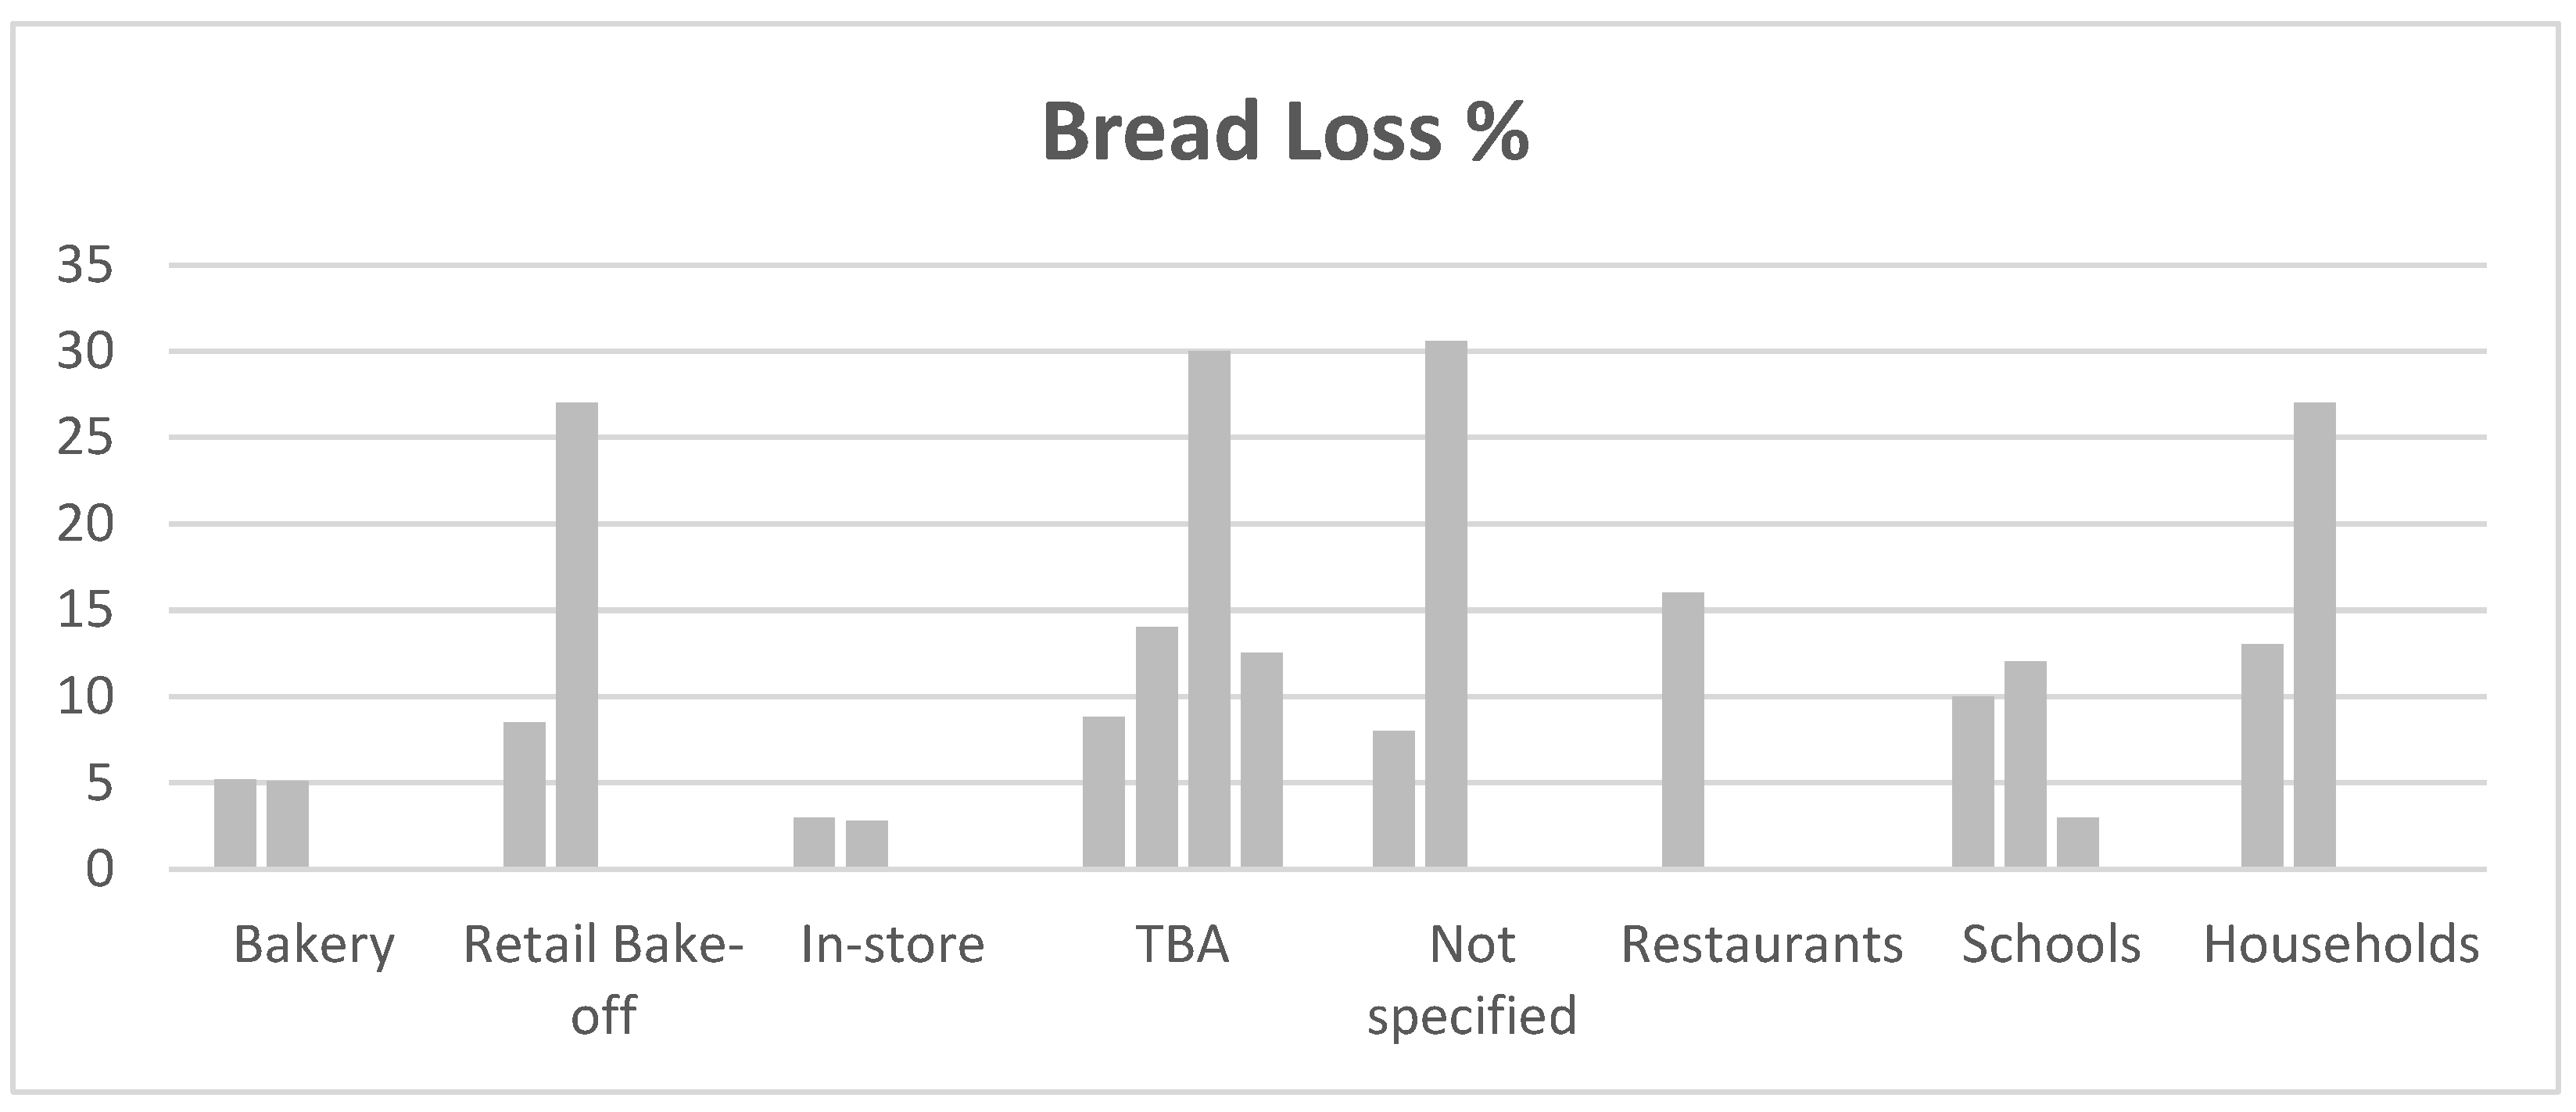
| Country | Source of Waste | Bread Waste % | Waste on the Account of | Reference |
|---|---|---|---|---|
| Sweden | Bakery | 5.2% | Total production | [12] |
| Switzerland | Bakery | 5.1% | Total production | [13] |
| Sweden | Retail Bake-off | 8.5% | Total mass delivered | [12] |
| Sweden | Retail Bake-off | 27% | Total waste mass | [14] |
| Sweden | In-store | 3% | Total waste mass | [14] |
| Austria | In-store | 2.8% | Sales in cost price | [15] |
| Sweden | TBA | 8.8% | Total mass delivered | [12] |
| Sweden | TBA | 5–14% | Mass supplied | [10] |
| Sweden | TBA | 30% | Supplied bread loaves | [16] |
| Austria | TBA | 12.5% | Sales in cost price | [15] |
| Unknown | Not specified | 0.5–8% | Sale value | [17] |
| Italy | Not specified | 30.6% | Total waste mass | [18] |
| Sweden | Restaurants | 16% | Avoidable waste | [12] |
| Sweden | Schools | 10% | Avoidable waste | [12] |
| Italy | Schools | 12% | Total waste mass | [19] |
| Finland | Schools | 3% | Plate leftovers | [20] |
| Sweden | Households | 13% | Avoidable waste mass | [12] |
| Norway | Households | 27% | Edible food waste mass | [21] |
| Company | Additional Strategies | Impact on Sell | Wastage |
|---|---|---|---|
| Company-A | Giving agency holder (AH) a task to carry very little return by offering an extra discount of 4–5% on the bill. Similarly, AH gives 2–3% to distributors and 1–2% to retailers on the bill. | Wastage percentage is minimized, and less space is required to return inventory to the manufacturer. | 4–6% |
| Company-B | Giving material to AH according to his demand, the company is ready to take back all returns (if produced). The company produces various types of bread. | Wastage percentage is higher, and more space is required to return inventory to the manufacturer. Due to various types, customers are more attracted to this company. | 10–12% |
| Company-C | The company is ready to take back all returns (if produced), and companies do not need AH, dealing directly with distributors. Producing small packets of bread at a low price for low-budget customers. | Wastage percentage is more, and there is no AH, so the company’s time for selling is increased. Due to small packs of bread, wastage is less, and sales are good. | 8–10% |
| Company-D | The company is targeting small towns and villages to sell bread because they assume that people there are not too quality-conscious. | This creates less wastage. | 4–5% |
| Company-E | The company is also targeting small towns and villages to sell bread because they assume that people there are not too quality-conscious. Producing small packs of bread at a low price for low-budget customers. | This creates less wastage, and sales are good due to small bread packets. | 3–4% |
Disclaimer/Publisher’s Note: The statements, opinions and data contained in all publications are solely those of the individual author(s) and contributor(s) and not of MDPI and/or the editor(s). MDPI and/or the editor(s) disclaim responsibility for any injury to people or property resulting from any ideas, methods, instructions or products referred to in the content. |
© 2023 by the authors. Licensee MDPI, Basel, Switzerland. This article is an open access article distributed under the terms and conditions of the Creative Commons Attribution (CC BY) license (https://creativecommons.org/licenses/by/4.0/).
Share and Cite
Bhardwaj, A.; Soni, R.; Singh, L.P.; Mor, R.S. A Simulation Approach for Waste Reduction in the Bread Supply Chain. Logistics 2023, 7, 2. https://doi.org/10.3390/logistics7010002
Bhardwaj A, Soni R, Singh LP, Mor RS. A Simulation Approach for Waste Reduction in the Bread Supply Chain. Logistics. 2023; 7(1):2. https://doi.org/10.3390/logistics7010002
Chicago/Turabian StyleBhardwaj, Arvind, Rachit Soni, Lakhwinder Pal Singh, and Rahul S Mor. 2023. "A Simulation Approach for Waste Reduction in the Bread Supply Chain" Logistics 7, no. 1: 2. https://doi.org/10.3390/logistics7010002