
The Fluorescence Response of Four Crystalline Starches According to Ultrasound-Assisted Starch-Salicylic Acid Inclusions

Abstract
:
1. Introduction
2. Materials and Methods
2.1. Materials
2.2. Preparation of V–Type Starch
2.3. Screening for Fluorescence Dyes
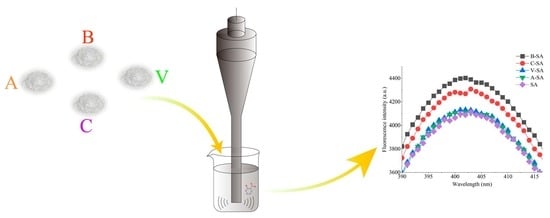
2.4. The Formation of Inclusions of Starch with SA
2.5. Inclusion Behavior Analysis
2.5.1. Inverted Fluorescence Microscope
2.5.2. FTIR
2.5.3. DSC
2.5.4. TGA
2.5.5. XRD
2.6. Fluorescence Spectroscopy
2.7. Reflection of Fluorescence Enhancement of Four Crystal Types of Starches
2.8. Statistical Analysis
3. Results and Discussion
3.1. Screening of Fluorescent Dyes
3.2. Inclusion Behavior Analysis
3.2.1. Inverted Fluorescence Microscope
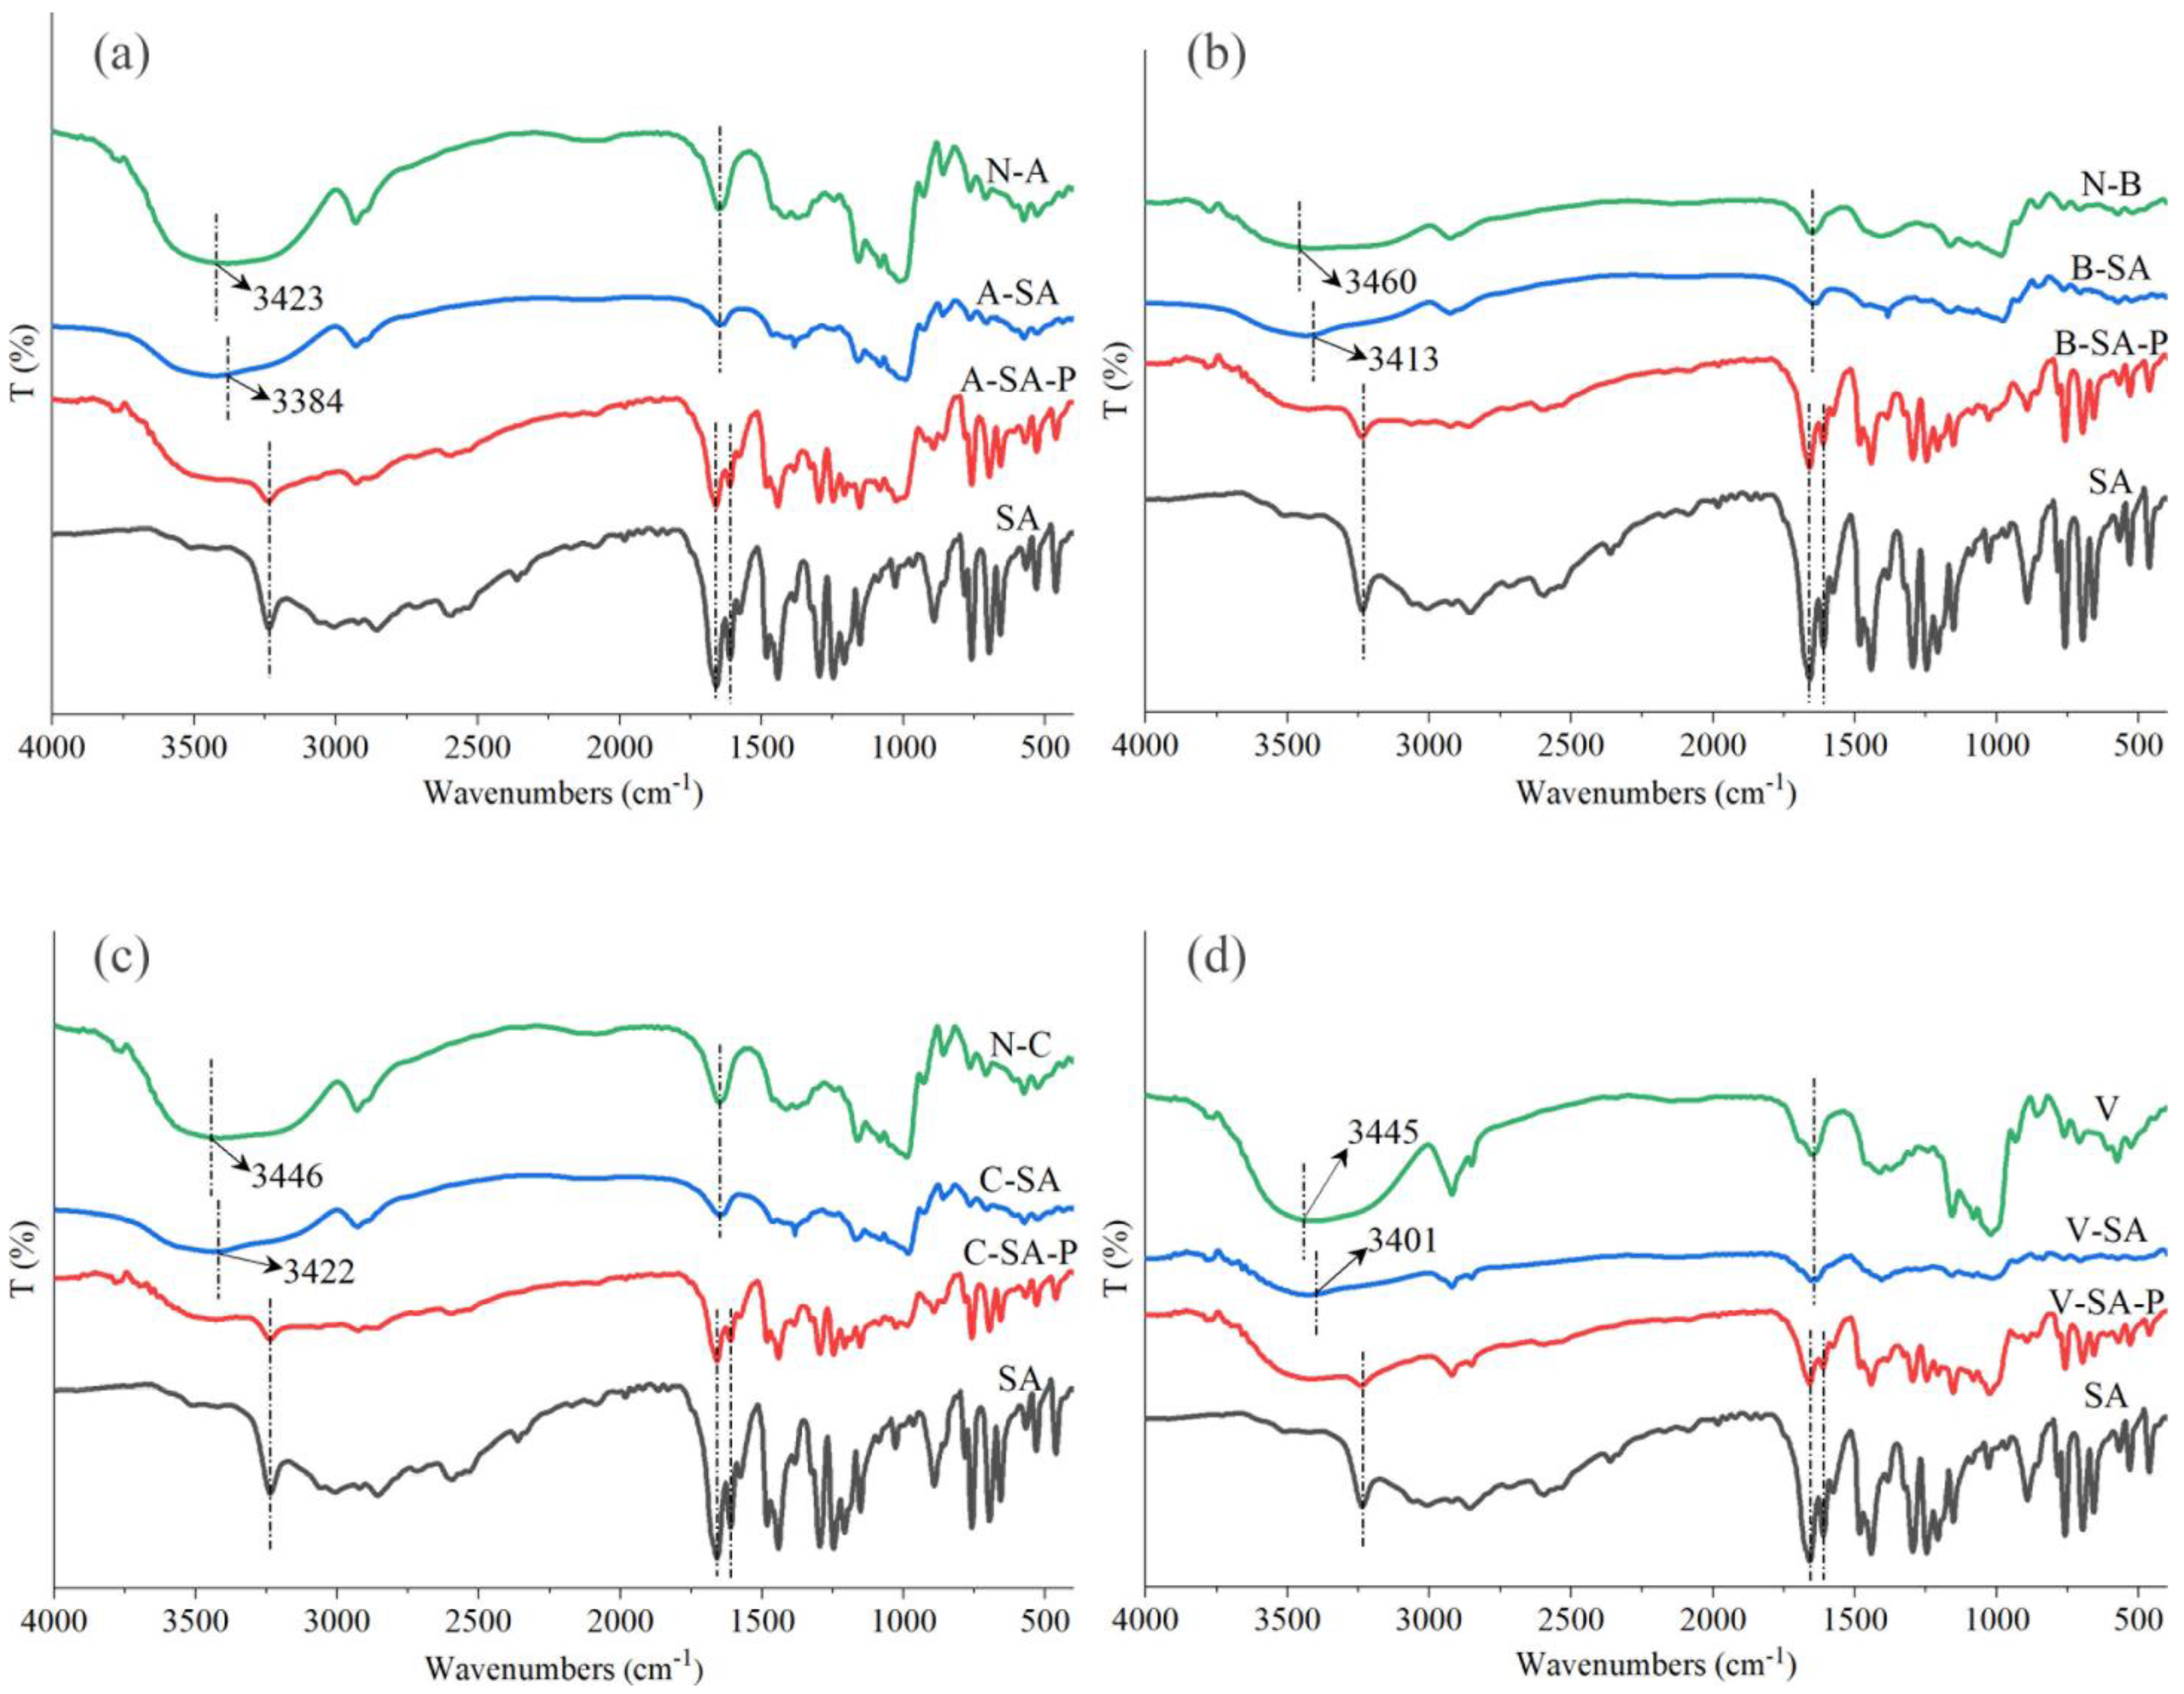
3.2.2. FTIR
3.2.3. DSC
3.2.4. TGA
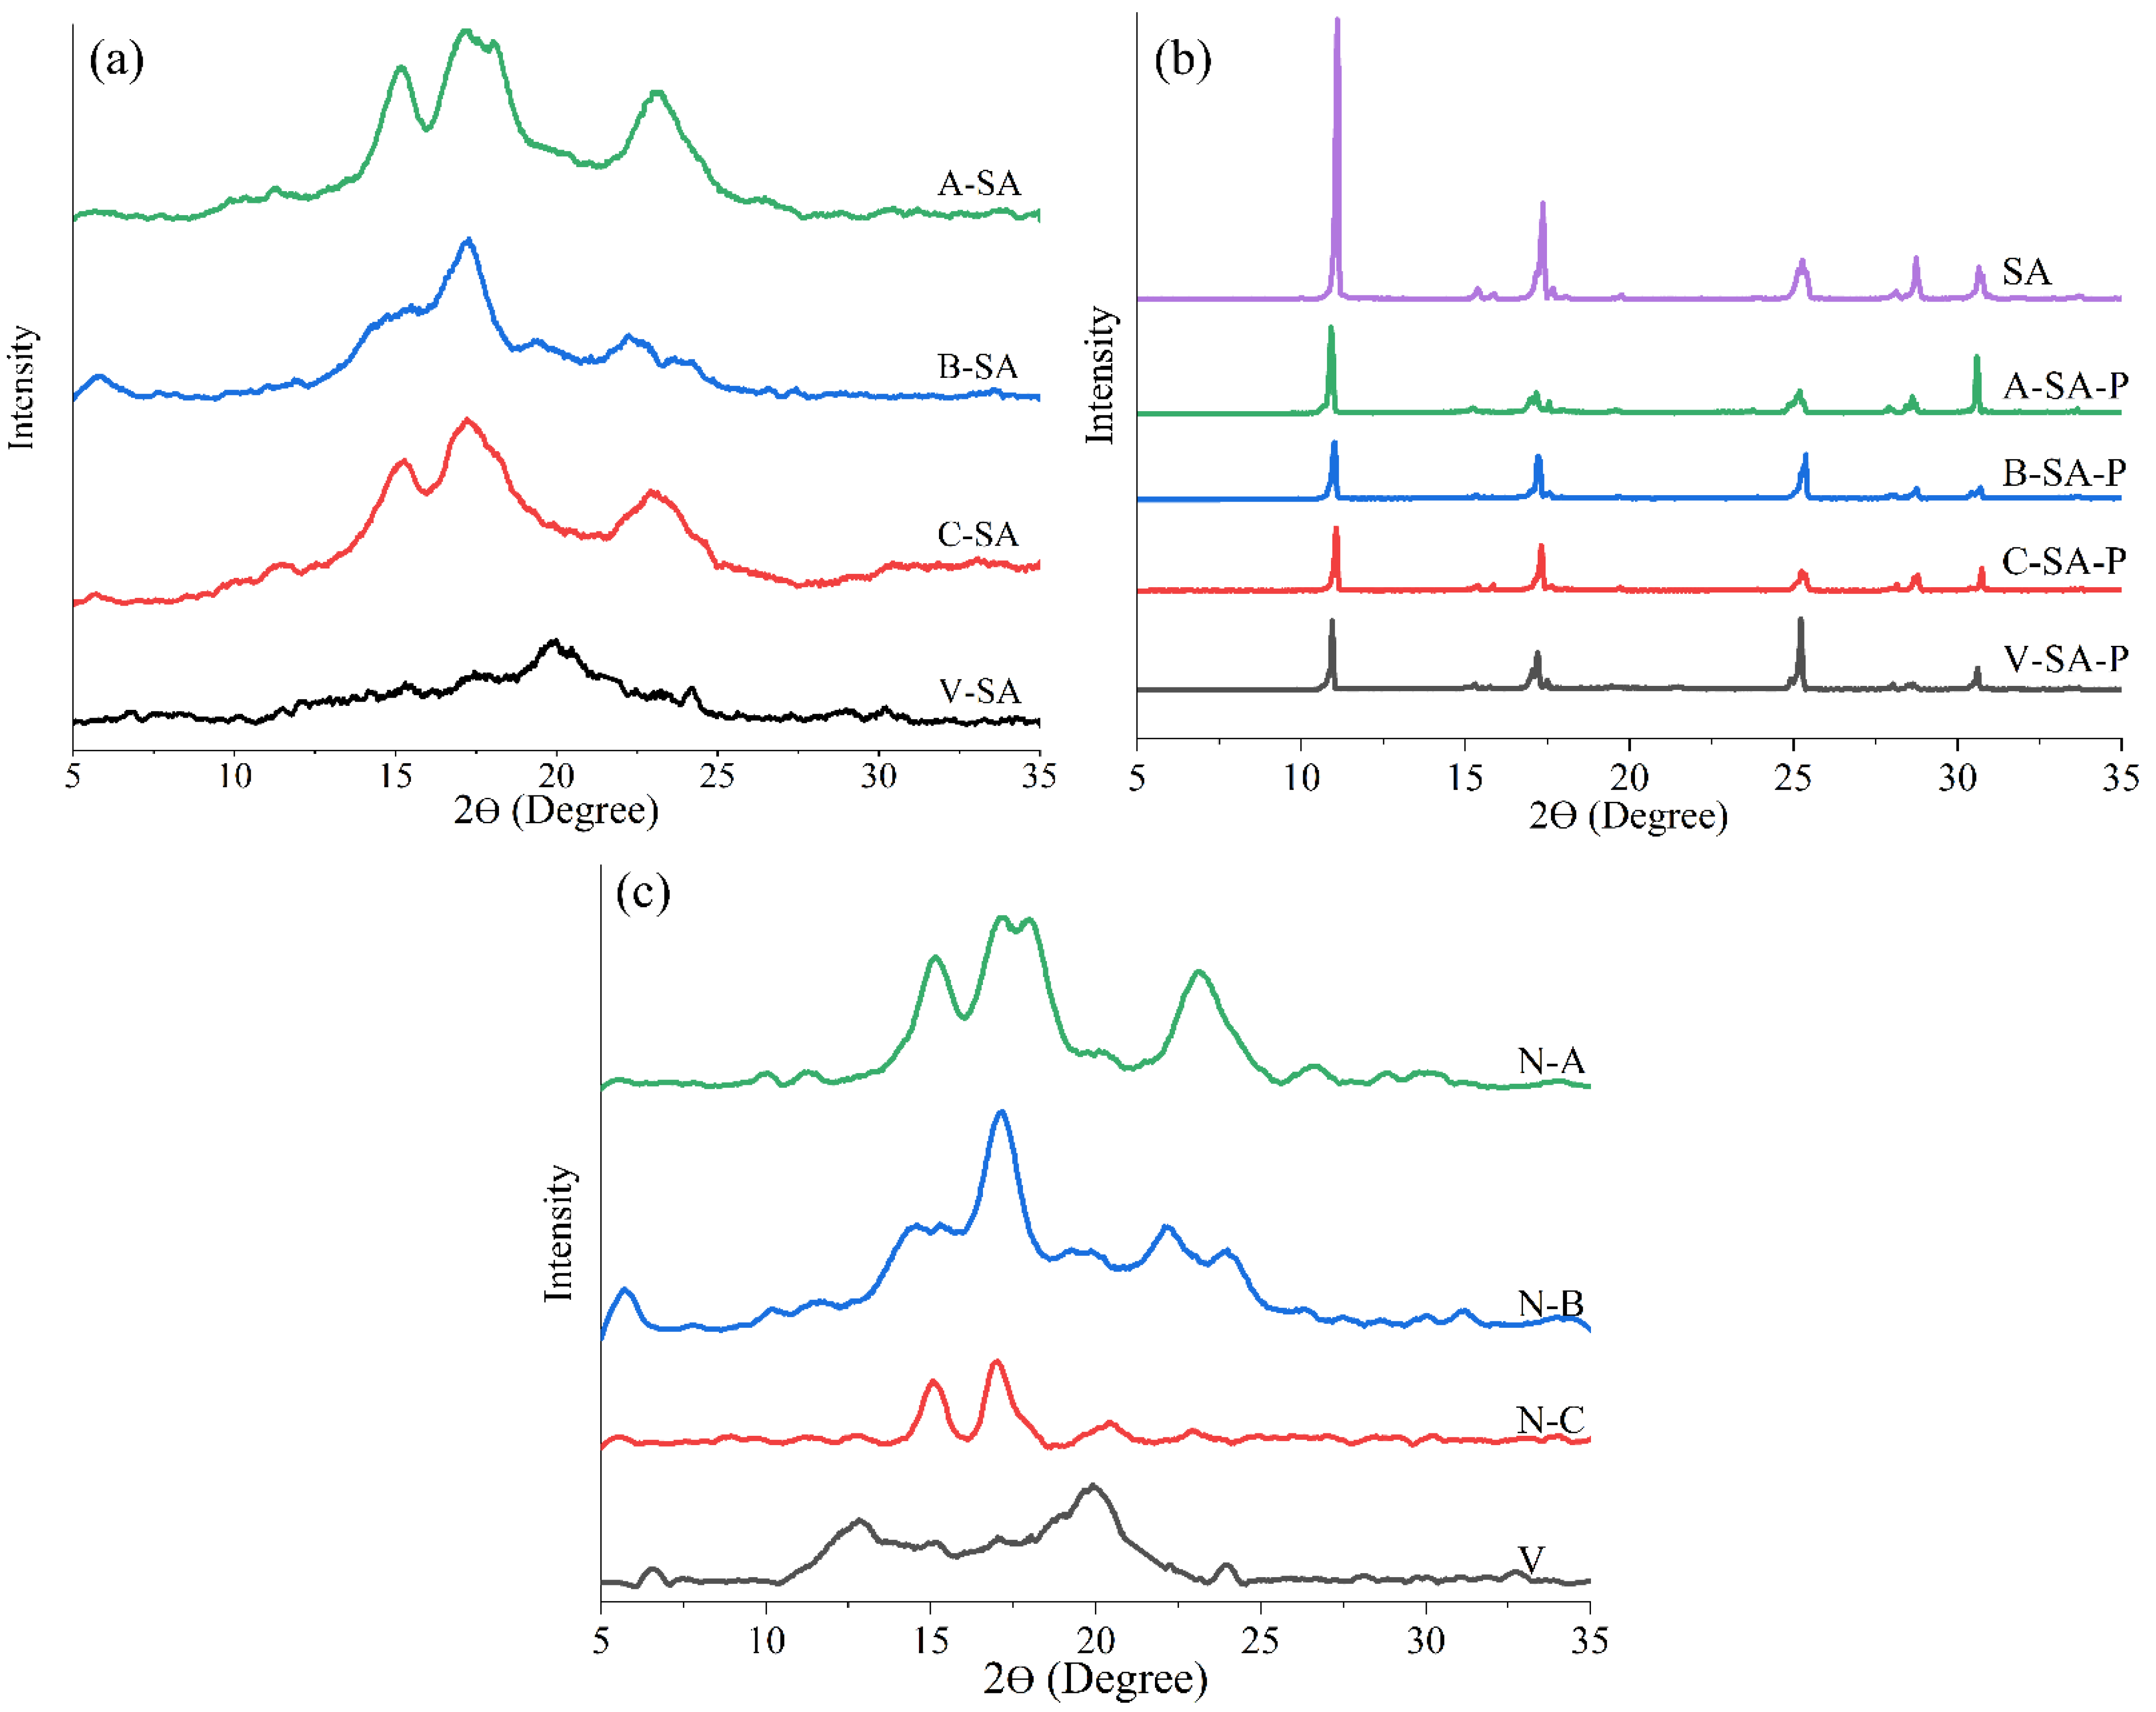
3.2.5. XRD
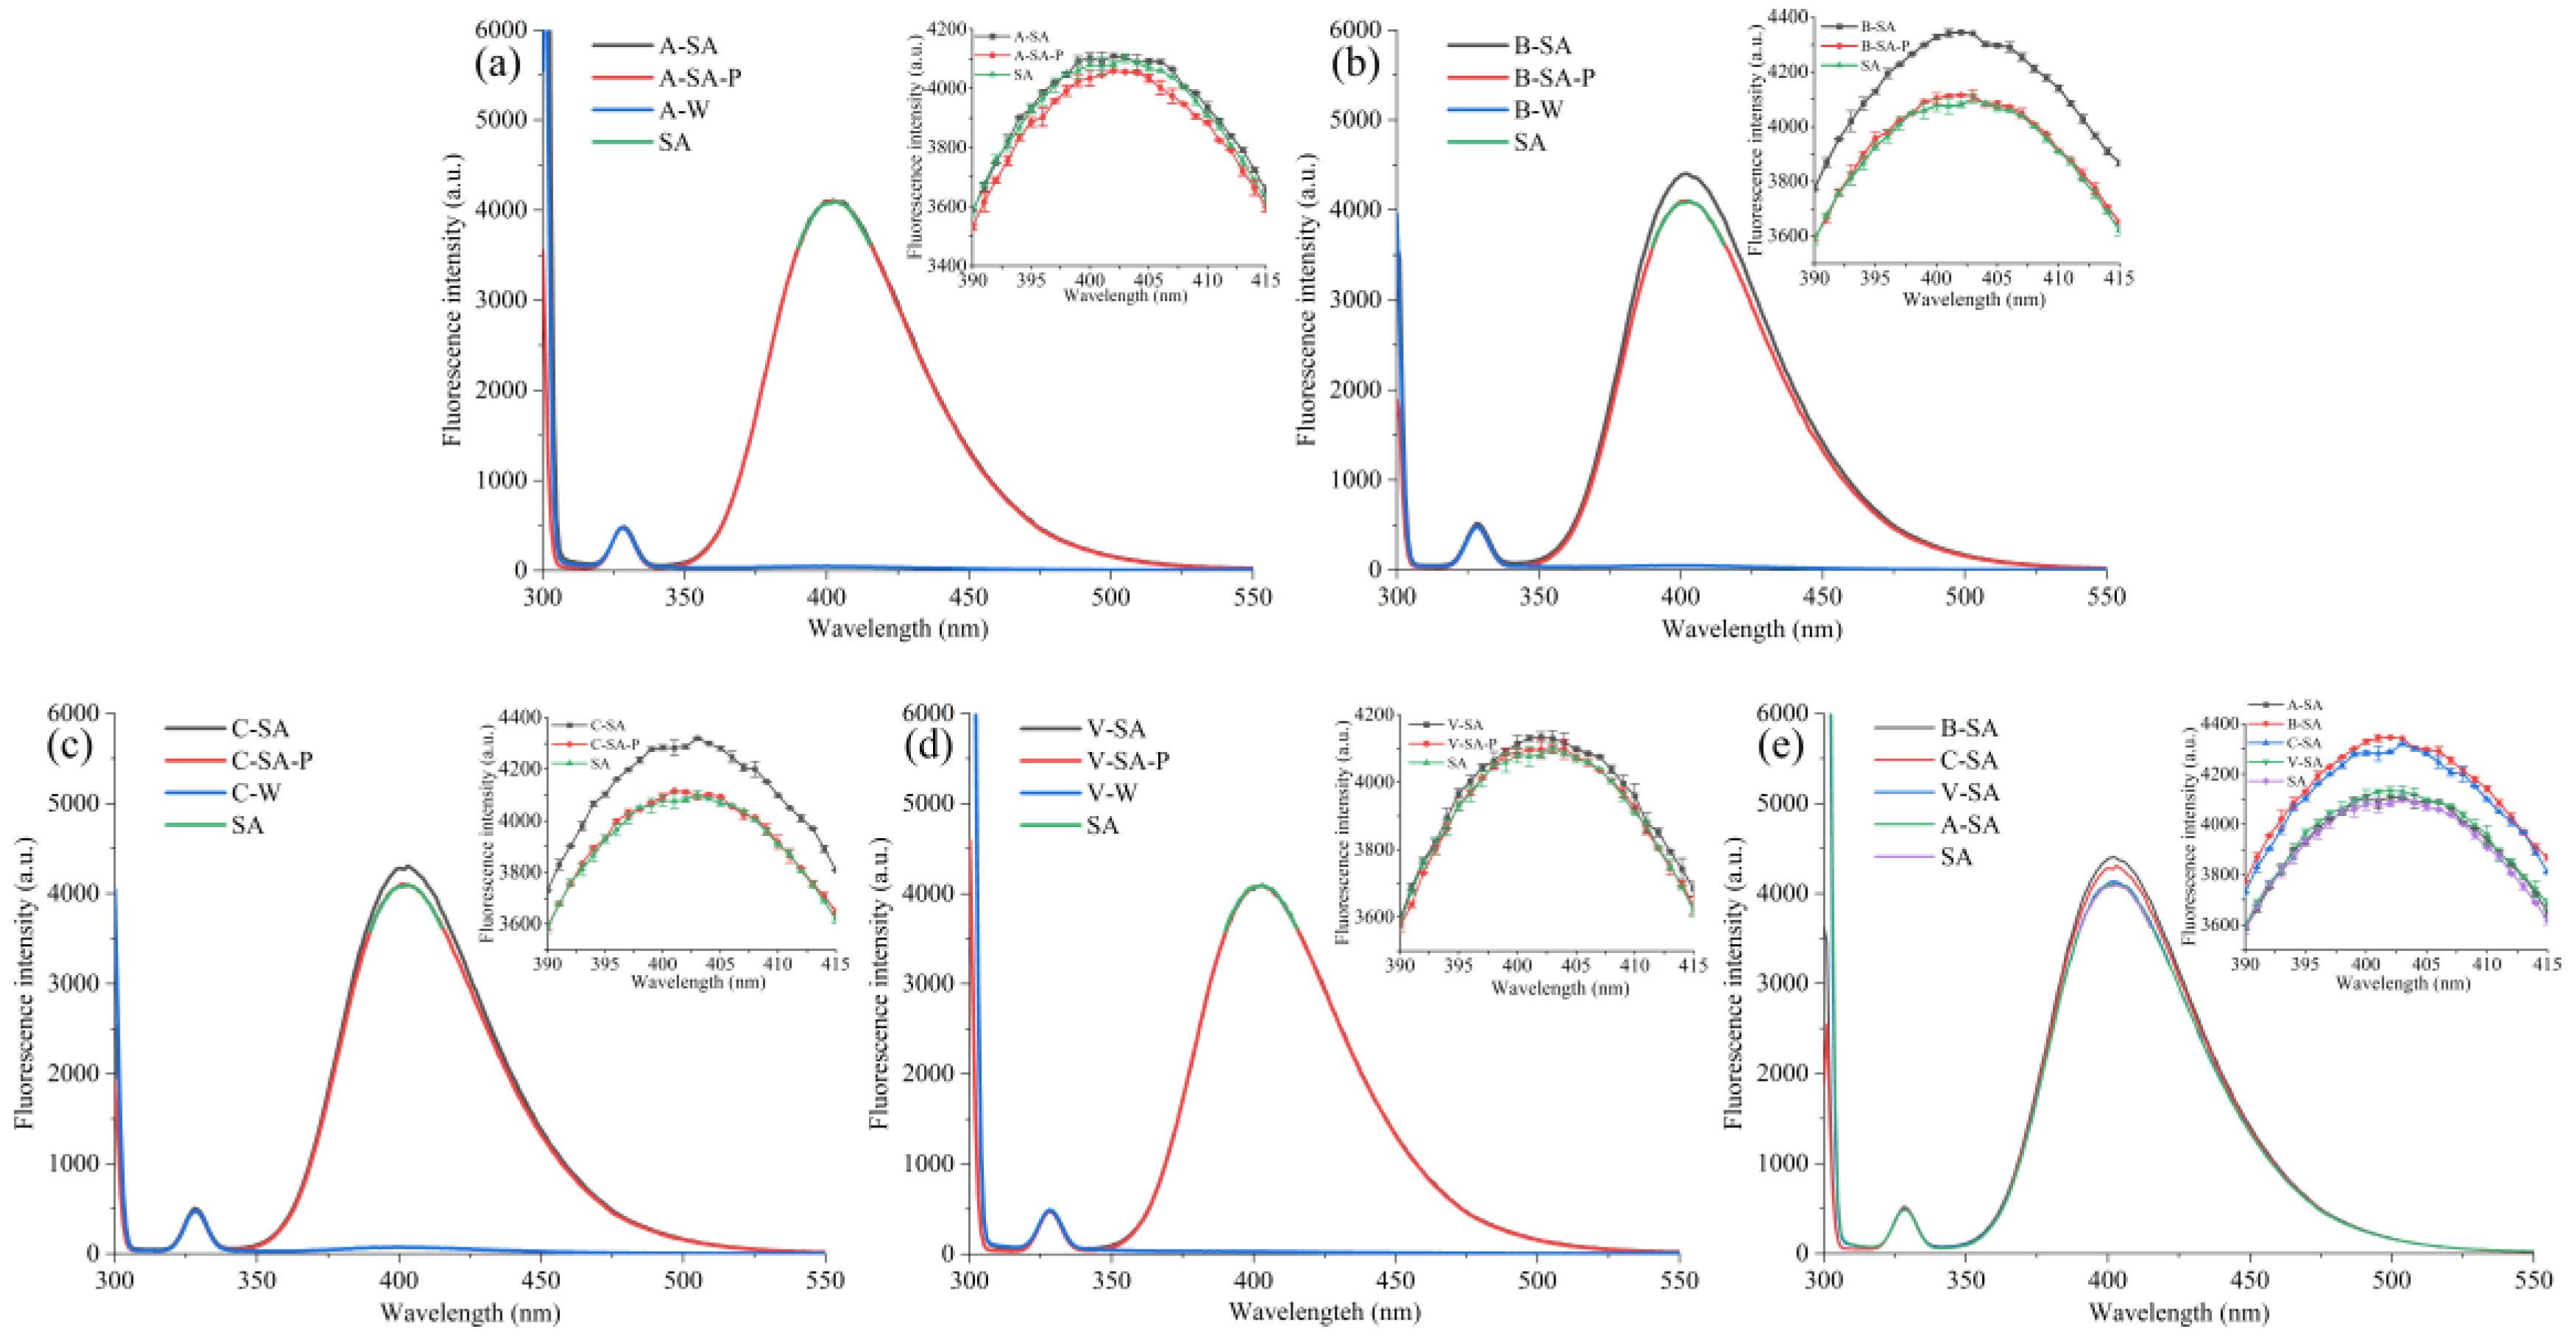
3.3. Fluorescence Spectra Analysis
4. Conclusions
Author Contributions
Funding
Data Availability Statement
Conflicts of Interest
References
- Perez, S.; Bertoft, E. The molecular structures of starch components and their contribution to the architecture of starch granules: A comprehensive review. Starch–Stärke 2010, 62, 389–420. [Google Scholar] [CrossRef]
- He, W.; Wei, C.X. Progress in C–type starches from different plant sources. Food Hydrocoll. 2017, 73, 162–175. [Google Scholar] [CrossRef]
- Li, Q.; Shi, S.H.; Dong, Y.Y.; Yu, X.Z. Characterisation of amylose and amylopectin with various moisture contents after frying process: Effect of starch–lipid complex formation. Int. J. Food Sci. Technol. 2020, 56, 639–647. [Google Scholar] [CrossRef]
- Guo, J.Y.; Ziegler, G.R.; Kong, L.Y. Polymorphic transitions of V–type amylose upon hydration and dehydration. Food Hydrocoll. 2022, 125, 107372. [Google Scholar] [CrossRef]
- Le, C.A.K.; Choisnard, L.; Wouessidjewe, D.; Putaux, J.L. Polymorphism of crystalline complexes of V–amylose with fatty acids. Int. J. Biol. Macromol. 2018, 119, 555–564. [Google Scholar] [CrossRef]
- Dong, X.Y.; Niu, X.Q.; Zhang, Z.Y.; Wei, J.S.; Xiong, H.M. Red fluorescent carbon dot powder for accurate latent fingerprint identification using an artificial intelligence program. ACS Appl. Mater. Interfaces 2020, 12, 29549–29555. [Google Scholar] [CrossRef]
- Singh, A.; Guleria, A.; Neogy, S.; Rath, M.C. UV induced synthesis of starch capped CdSe quantum dots: Functionalization with thiourea and application in sensing heavy metals ions in aqueous solution. Arab. J. Chem. 2020, 13, 3149–3158. [Google Scholar] [CrossRef]
- Li, H.C.; Zhang, B.; Lü, S.Y.; Ma, H.Y.; Liu, M.Z. Synthesis and characterization of a nano fluorescent starch. Int. J. Biol. Macromol. 2018, 120, 1225–1231. [Google Scholar] [CrossRef]
- Wei, Y.H.; Lin, X.Q.; Wei, C.; Zhang, W.; Yan, Y.L.; Zhao, Y.S. Starch–based biological microlasers. ACS Nano 2017, 11, 597–602. [Google Scholar] [CrossRef]
- Zhang, Z.W.; Zhao, F.; Meng, Y.L.; Lin, J.Z.; Xu, Y.P.; Feng, Y.; Ding, F.; Li, P.W. Microencapsulation of the Enzyme Breaker by Double–Layer Embedding Method. SPE J. 2022, 1–9. [Google Scholar] [CrossRef]
- Tian, S.Q.; Xue, X.A.; Wang, X.W.; Chen, Z.C. Preparation of starch–based functional food nano–microcapsule delivery system and its controlled release characteristics. Front. Nutr. 2022, 9, 982370. [Google Scholar] [CrossRef]
- Li, J.; Tian, L.; Fang, Y.; Chen, W.; Hunag, G. Ultrasonic-Assisted Preparation of Maize Starch–Caffeic Acid Complex: Physicochemical and Digestion Properties. Starch-Stärke 2021, 73, 2000084. [Google Scholar] [CrossRef]
- Mallakpour, S.; Nezamzadeh Ezhieh, A. Preparation and characterization of starch nanocomposite embedded with functionalized MWCNT: Investigation of optical, morphological, thermal, and copper ions adsorption properties. Adv. Polym. Technol. 2018, 37, 2195–2203. [Google Scholar] [CrossRef]
- Zhang, S.; Zhou, Y.B.; Jin, S.S.; Meng, X.; Yang, L.P.; Wang, H.S. Preparation and structural characterization of corn starch–aroma compound inclusion complexes. J. Sci. Food Agric. 2017, 97, 182–190. [Google Scholar] [CrossRef]
- Chemat, F.; Khan, M.K. Applications of ultrasound in food technology: Processing, preservation and extraction. Ultrason. Sonochem. 2011, 18, 813–835. [Google Scholar] [CrossRef]
- Sun, S.L.; Jin, Y.Z.; Hong, Y.; Gu, Z.B.; Cheng, L.; Li, Z.F.; Li, C.M. Effects of fatty acids with various chain lengths and degrees of unsaturation on the structure, physicochemical properties and digestibility of maize starch–fatty acid complexes. Food Hydrocoll. 2021, 110, 106224. [Google Scholar] [CrossRef]
- Hu, Y.T.; Liu, C.; Wang, X.P.; Zhao, D.D. Adaptive handling of Rayleigh and Raman scatter of fluorescence data based on evaluation of the degree of spectral overlap. Spectrochim. Acta Part A Mol. Biomol. Spectrosc. 2018, 199, 170–178. [Google Scholar] [CrossRef]
- Wang, C.; He, X.W.; Huang, Q.; Fu, X.; Luo, F.X.; Li, L. Distribution of octenylsuccinic substituents in modified A and B polymorph starch granules. J. Agric. Food Chem. 2013, 61, 12492–12498. [Google Scholar] [CrossRef]
- Sun, W.J.; Yang, X.W.; Zhang, H.G.; Zhu, L.; Gao, S.L. Spectra of rare earth complexes with salicylate. Acta Photonica Sin. 2006, 35, 1593–1596. [Google Scholar]
- Hu, A.J.; Li, Y.; Zheng, J. Dual–frequency ultrasonic effect on the structure and properties of starch with different size. LWT–Food Sci. Technol. 2019, 106, 254–262. [Google Scholar] [CrossRef]
- Chen, Z.; Cao, L.; Shan, F.; Fang, G.Y. Preparation and characteristics of microencapsulated stearic acid as composite thermal energy storage material in buildings. Energy Build. 2013, 62, 469–474. [Google Scholar] [CrossRef]
- Rahaman, A.; Kumari, A.; Zeng, X.A.; Adil Farooq, M.; Siddique, R.; Khalifa, I.; Siddeeg, A.; Ali, M.; Faisal Manzoor, M. Ultrasound based modification and structural–functional analysis of corn and cassava starch. Ultrason. Sonochem. 2021, 80, 105795. [Google Scholar] [CrossRef] [PubMed]
- Zhu, J.; Li, L.; Chen, L.; Li, X.X. Study on supramolecular structural changes of ultrasonic treated potato starch granules. Food Hydrocoll. 2012, 29, 116–122. [Google Scholar] [CrossRef]
- Raza, H.; Ameer, K.; Ren, X.F.; Liang, Q.F.; Chen, X.X.; Chen, H.X.; Ma, H.L. Physicochemical properties and digestion mechanism of starch–linoleic acid complex induced by multi–frequency power ultrasound. Food Chem. 2021, 364, 130392. [Google Scholar] [CrossRef] [PubMed]
- Li, K.; Yang, L.; He, H.C.; Liu, K. Aramid–film pH sensitive fluorescence enhancement based on benzimidazole intermolecular hydrogen bonds. Opt. Mater. 2022, 123, 111903. [Google Scholar] [CrossRef]
- Putaux, J.L.; Nishiyama, Y.; Mazeau, K.; Morin, M.; Cardoso, M.B.; Chanzy, H. Helical conformation in crystalline inclusion complexes of V–amylose: A historical perspective. Macromol. Symp. 2011, 303, 1–9. [Google Scholar] [CrossRef]


| To | Tp | Tc | ΔH | |
|---|---|---|---|---|
| N–A | 64.078 ± 0.55 cd* | 71.567 ± 0.96 a | 80.753 ± 0.18 a | 10.54 ± 0.24 ab |
| U–A | 62.66 ± 0.10 d | 69.102 ± 0.77 bc | 78.81 ± 1.30 ab | 9.42 ± 0.10 b |
| A–SA | 63.056 ± 0.08 d | 69.491 ± 0.76 b | 79.485 ± 0.18 ab | 10.06 ± 0.10 ab |
| N–B | 63.097 ± 0.057 d | 68.972 ± 0.36 bc | 74.990 ± 0.53 bc | 11.08 ± 0.12 a |
| U–B | 60.579 ± 0.23 e | 64.160 ± 0.01 d | 71.919 ± 0.97 c | 10.46 ± 0.44 ab |
| B–SA | 61.215 ± 0.05 e | 64.824 ± 0.07 d | 72.769 ± 1.56 c | 10.63 ± 0.49 ab |
| N–C | 64.773 ± 0.05 c | 71.465 ± 0.27 a | 77.162 ± 0.63 b | 6.99 ± 0.40 c |
| U–C | 63.341 ± 0.24 d | 70.017 ± 0.13 ab | 73.942 ± 0.55 bc | 5.44 ± 0.0007 d |
| C–SA | 63.975 ± 0.99 cd | 70.225 ± 0.24 ab | 76.594 ± 0.28 b | 6.24 ± 0.39 cd |
| V | 69.883 ± 0.03 a | 70.979 ± 0.01 ab | 74.225 ± 0.61 bc | 9.103 ± 0.43 b |
| U–V | 66.81 ± 0.06 b | 67.504 ± 0.30 c | 68.058 ± 0.02 c | 0.042 ± 0.0007 f |
| V–SA | 69.085 ± 0.29 ab | 70.34 ± 0.54 ab | 72.465 ± 1.62 c | 3.601 ± 0.41 e |
| Inclusions | F1 | F2 | Enhancement Fluorescence Intensity ΔF |
|---|---|---|---|
| B–SA | 4352.5 | 4088 | 264.5 ± 1.4 a* |
| C–SA | 4294 | 4088 | 206.0 ± 7.8 b |
| V–SA | 4139.2 | 4088 | 51.2 ± 16.3 c |
| A–SA | 4116 | 4088 | 28.0 ± 7.8 c |
Disclaimer/Publisher’s Note: The statements, opinions and data contained in all publications are solely those of the individual author(s) and contributor(s) and not of MDPI and/or the editor(s). MDPI and/or the editor(s) disclaim responsibility for any injury to people or property resulting from any ideas, methods, instructions or products referred to in the content. |
© 2023 by the authors. Licensee MDPI, Basel, Switzerland. This article is an open access article distributed under the terms and conditions of the Creative Commons Attribution (CC BY) license (https://creativecommons.org/licenses/by/4.0/).
Share and Cite
Pei, R.; Lu, H.; Wang, F.; Ma, R.; Tian, Y. The Fluorescence Response of Four Crystalline Starches According to Ultrasound-Assisted Starch-Salicylic Acid Inclusions. Foods 2023, 12, 1431. https://doi.org/10.3390/foods12071431
Pei R, Lu H, Wang F, Ma R, Tian Y. The Fluorescence Response of Four Crystalline Starches According to Ultrasound-Assisted Starch-Salicylic Acid Inclusions. Foods. 2023; 12(7):1431. https://doi.org/10.3390/foods12071431
Chicago/Turabian StylePei, Rui, Hao Lu, Fan Wang, Rongrong Ma, and Yaoqi Tian. 2023. "The Fluorescence Response of Four Crystalline Starches According to Ultrasound-Assisted Starch-Salicylic Acid Inclusions" Foods 12, no. 7: 1431. https://doi.org/10.3390/foods12071431