
Regulation of the Colour Change of 3D-Printed Mackerel Mince (Scomber scombrus) Based on Purple Potato Powder and Citric Acid

Abstract
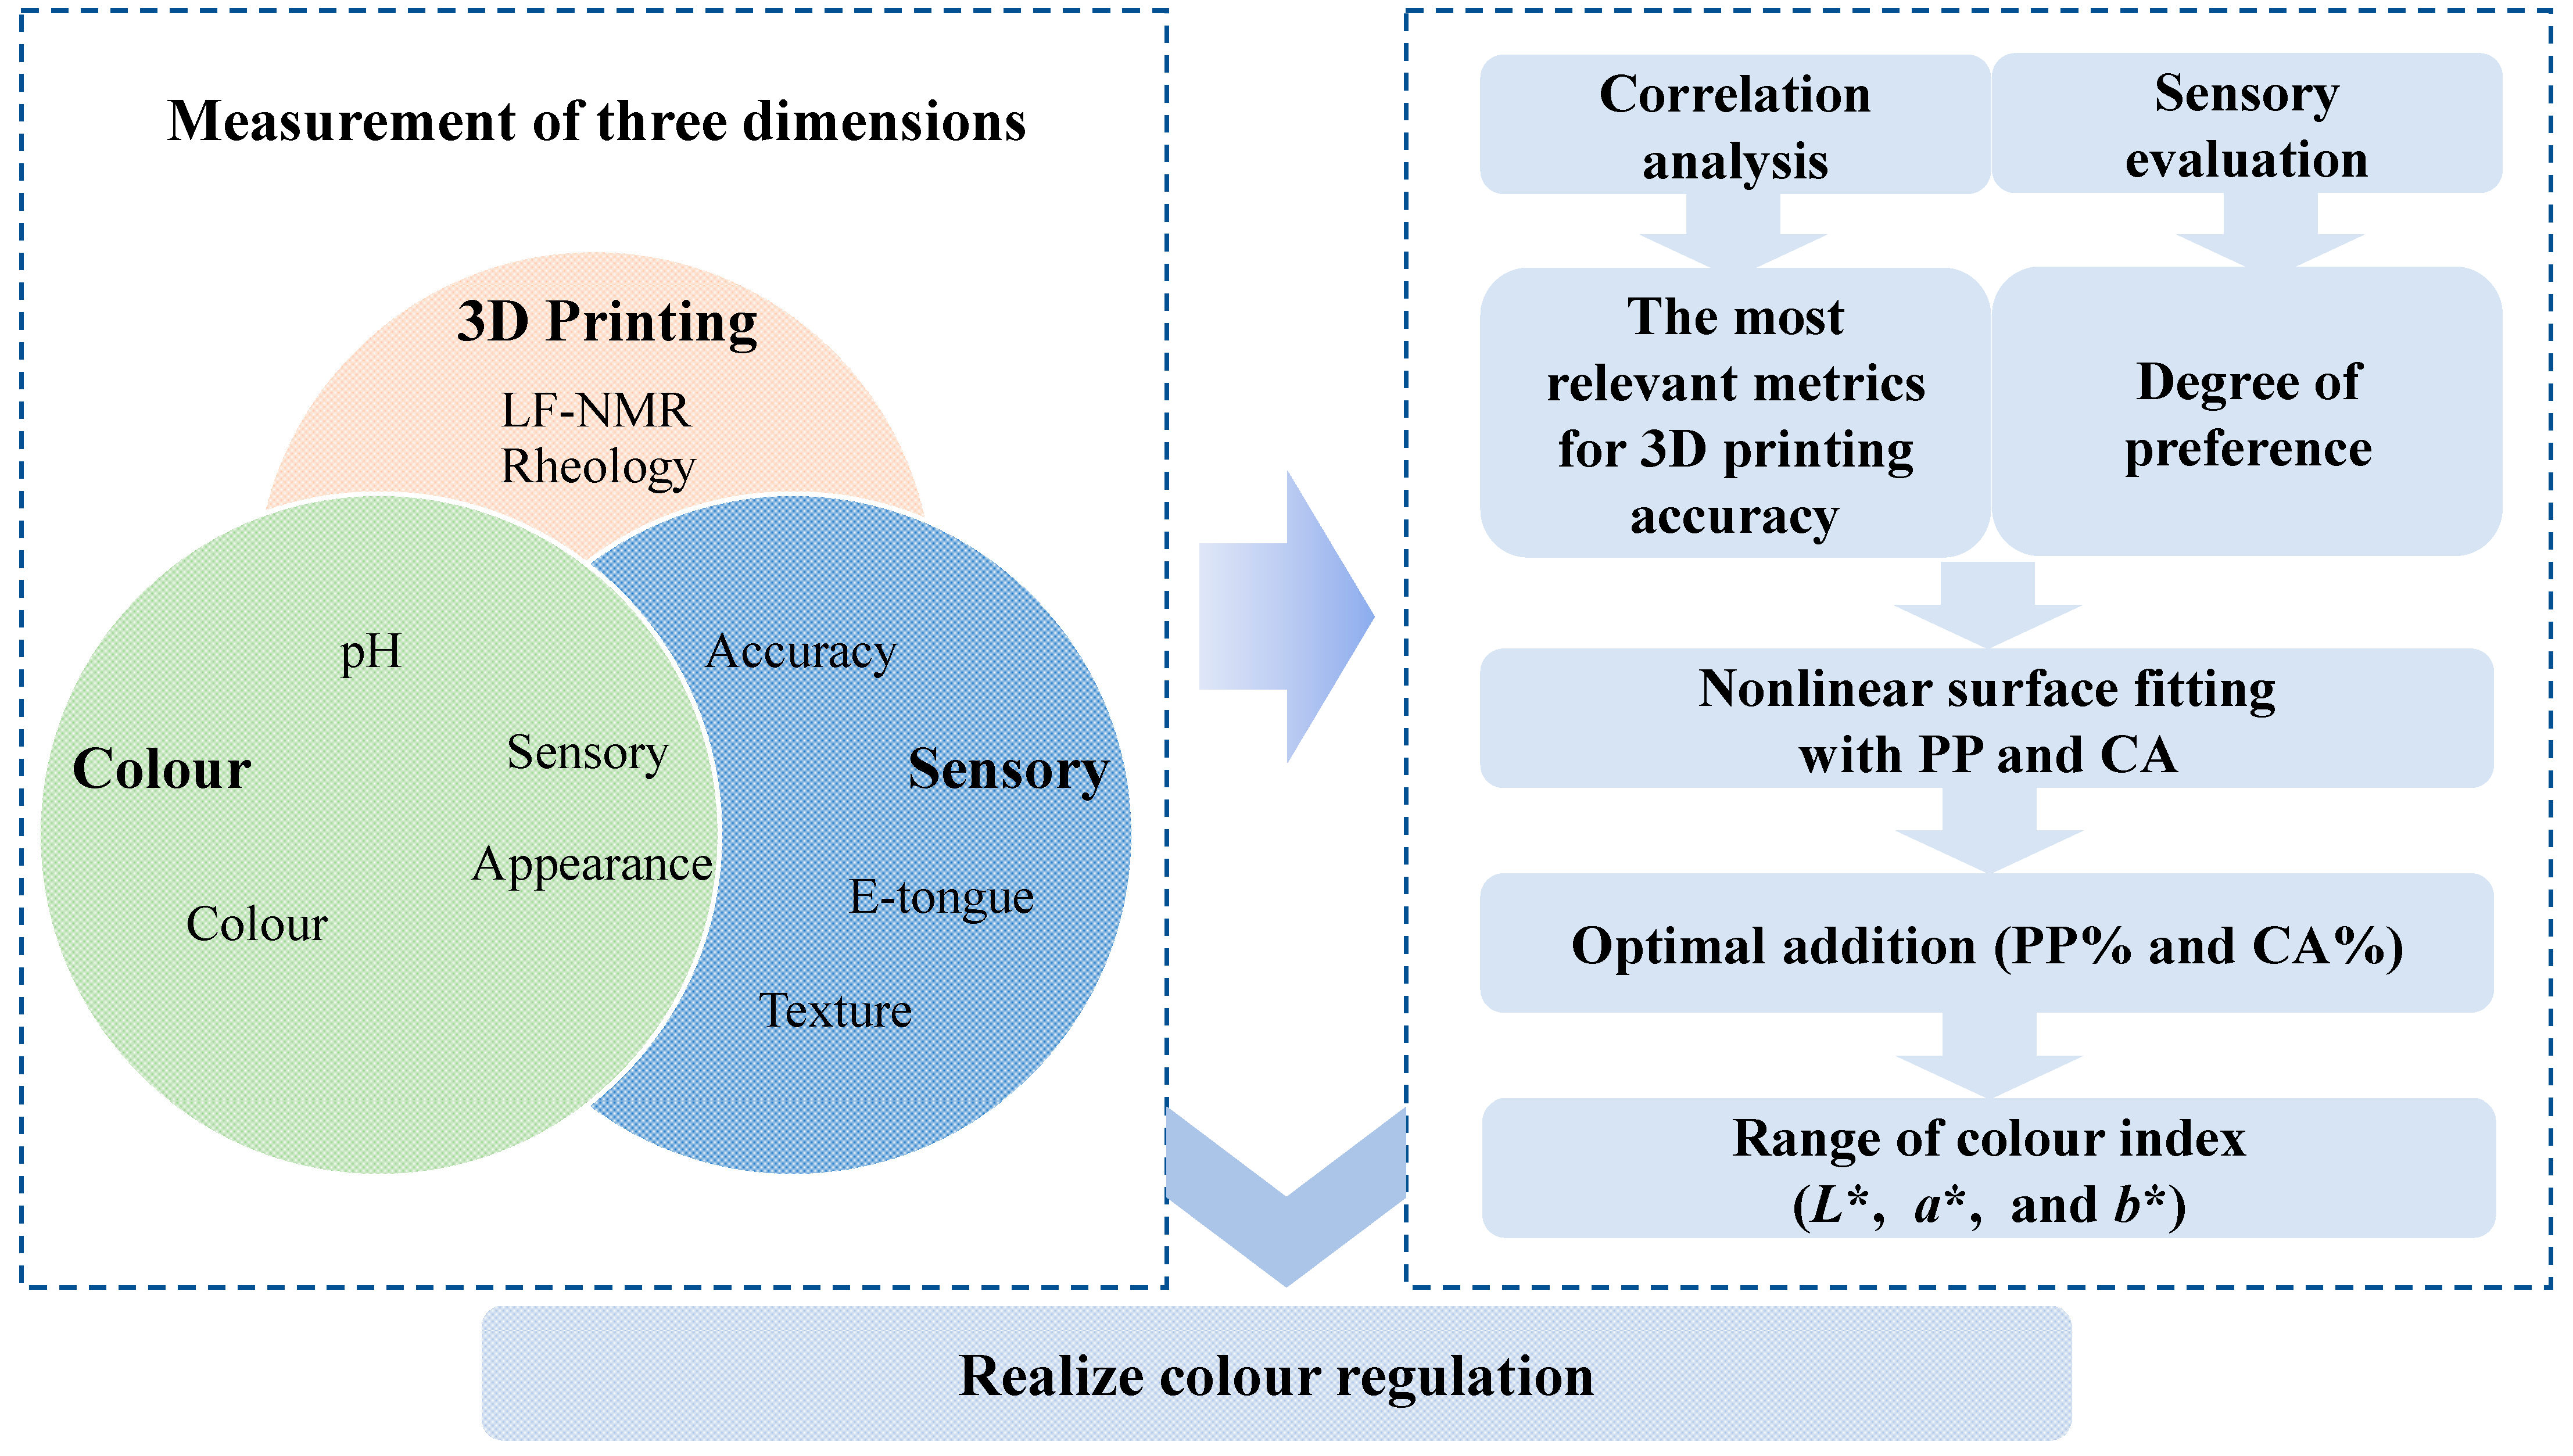
:1. Introduction
2. Materials and Methods
2.1. Materials
2.2. Experimental Design
2.3. Preparation of Minced Fish
2.4. Measurements of Colour
2.5. Measurements of Rheological Properties
2.6. 3D Printing
2.7. Analysis of Printing and Deformation
2.8. Measurements of pH
2.9. Measurements of Crispness and Hardness
2.10. LF-NMR Analysis
2.11. Electronic Tongue Analysis
2.12. Sensory Evaluation
2.13. Statistical Analysis
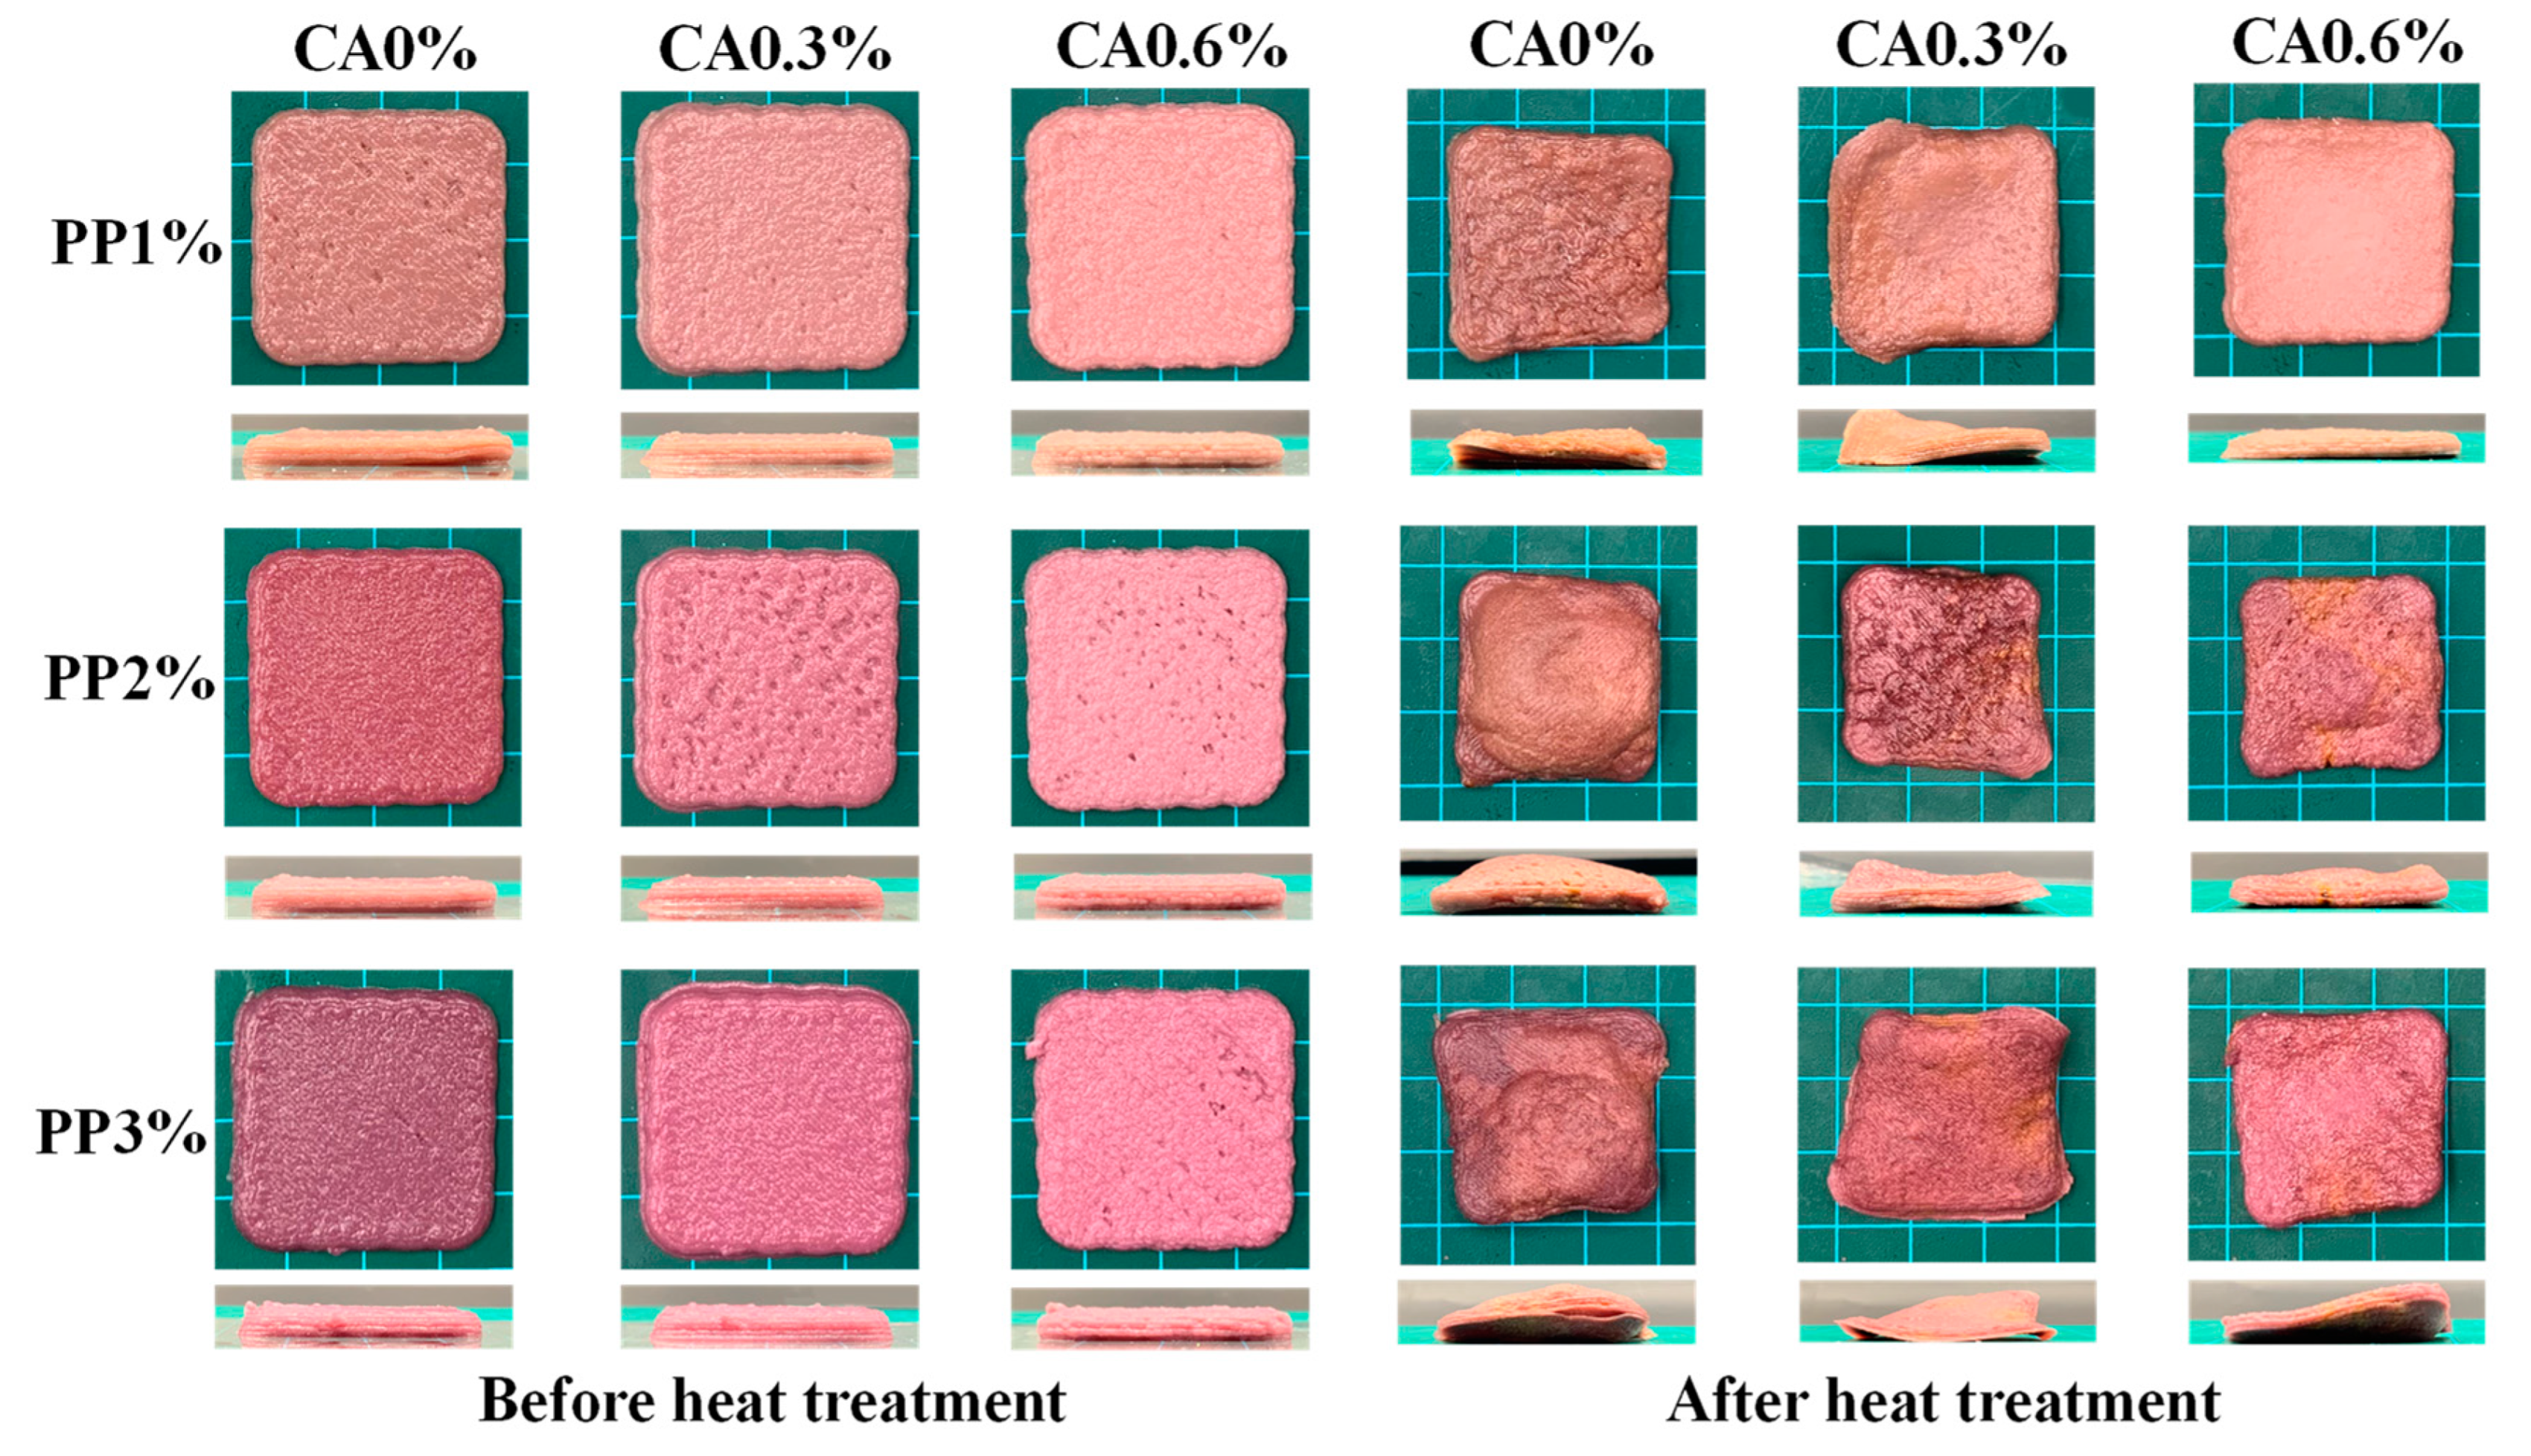
3. Results
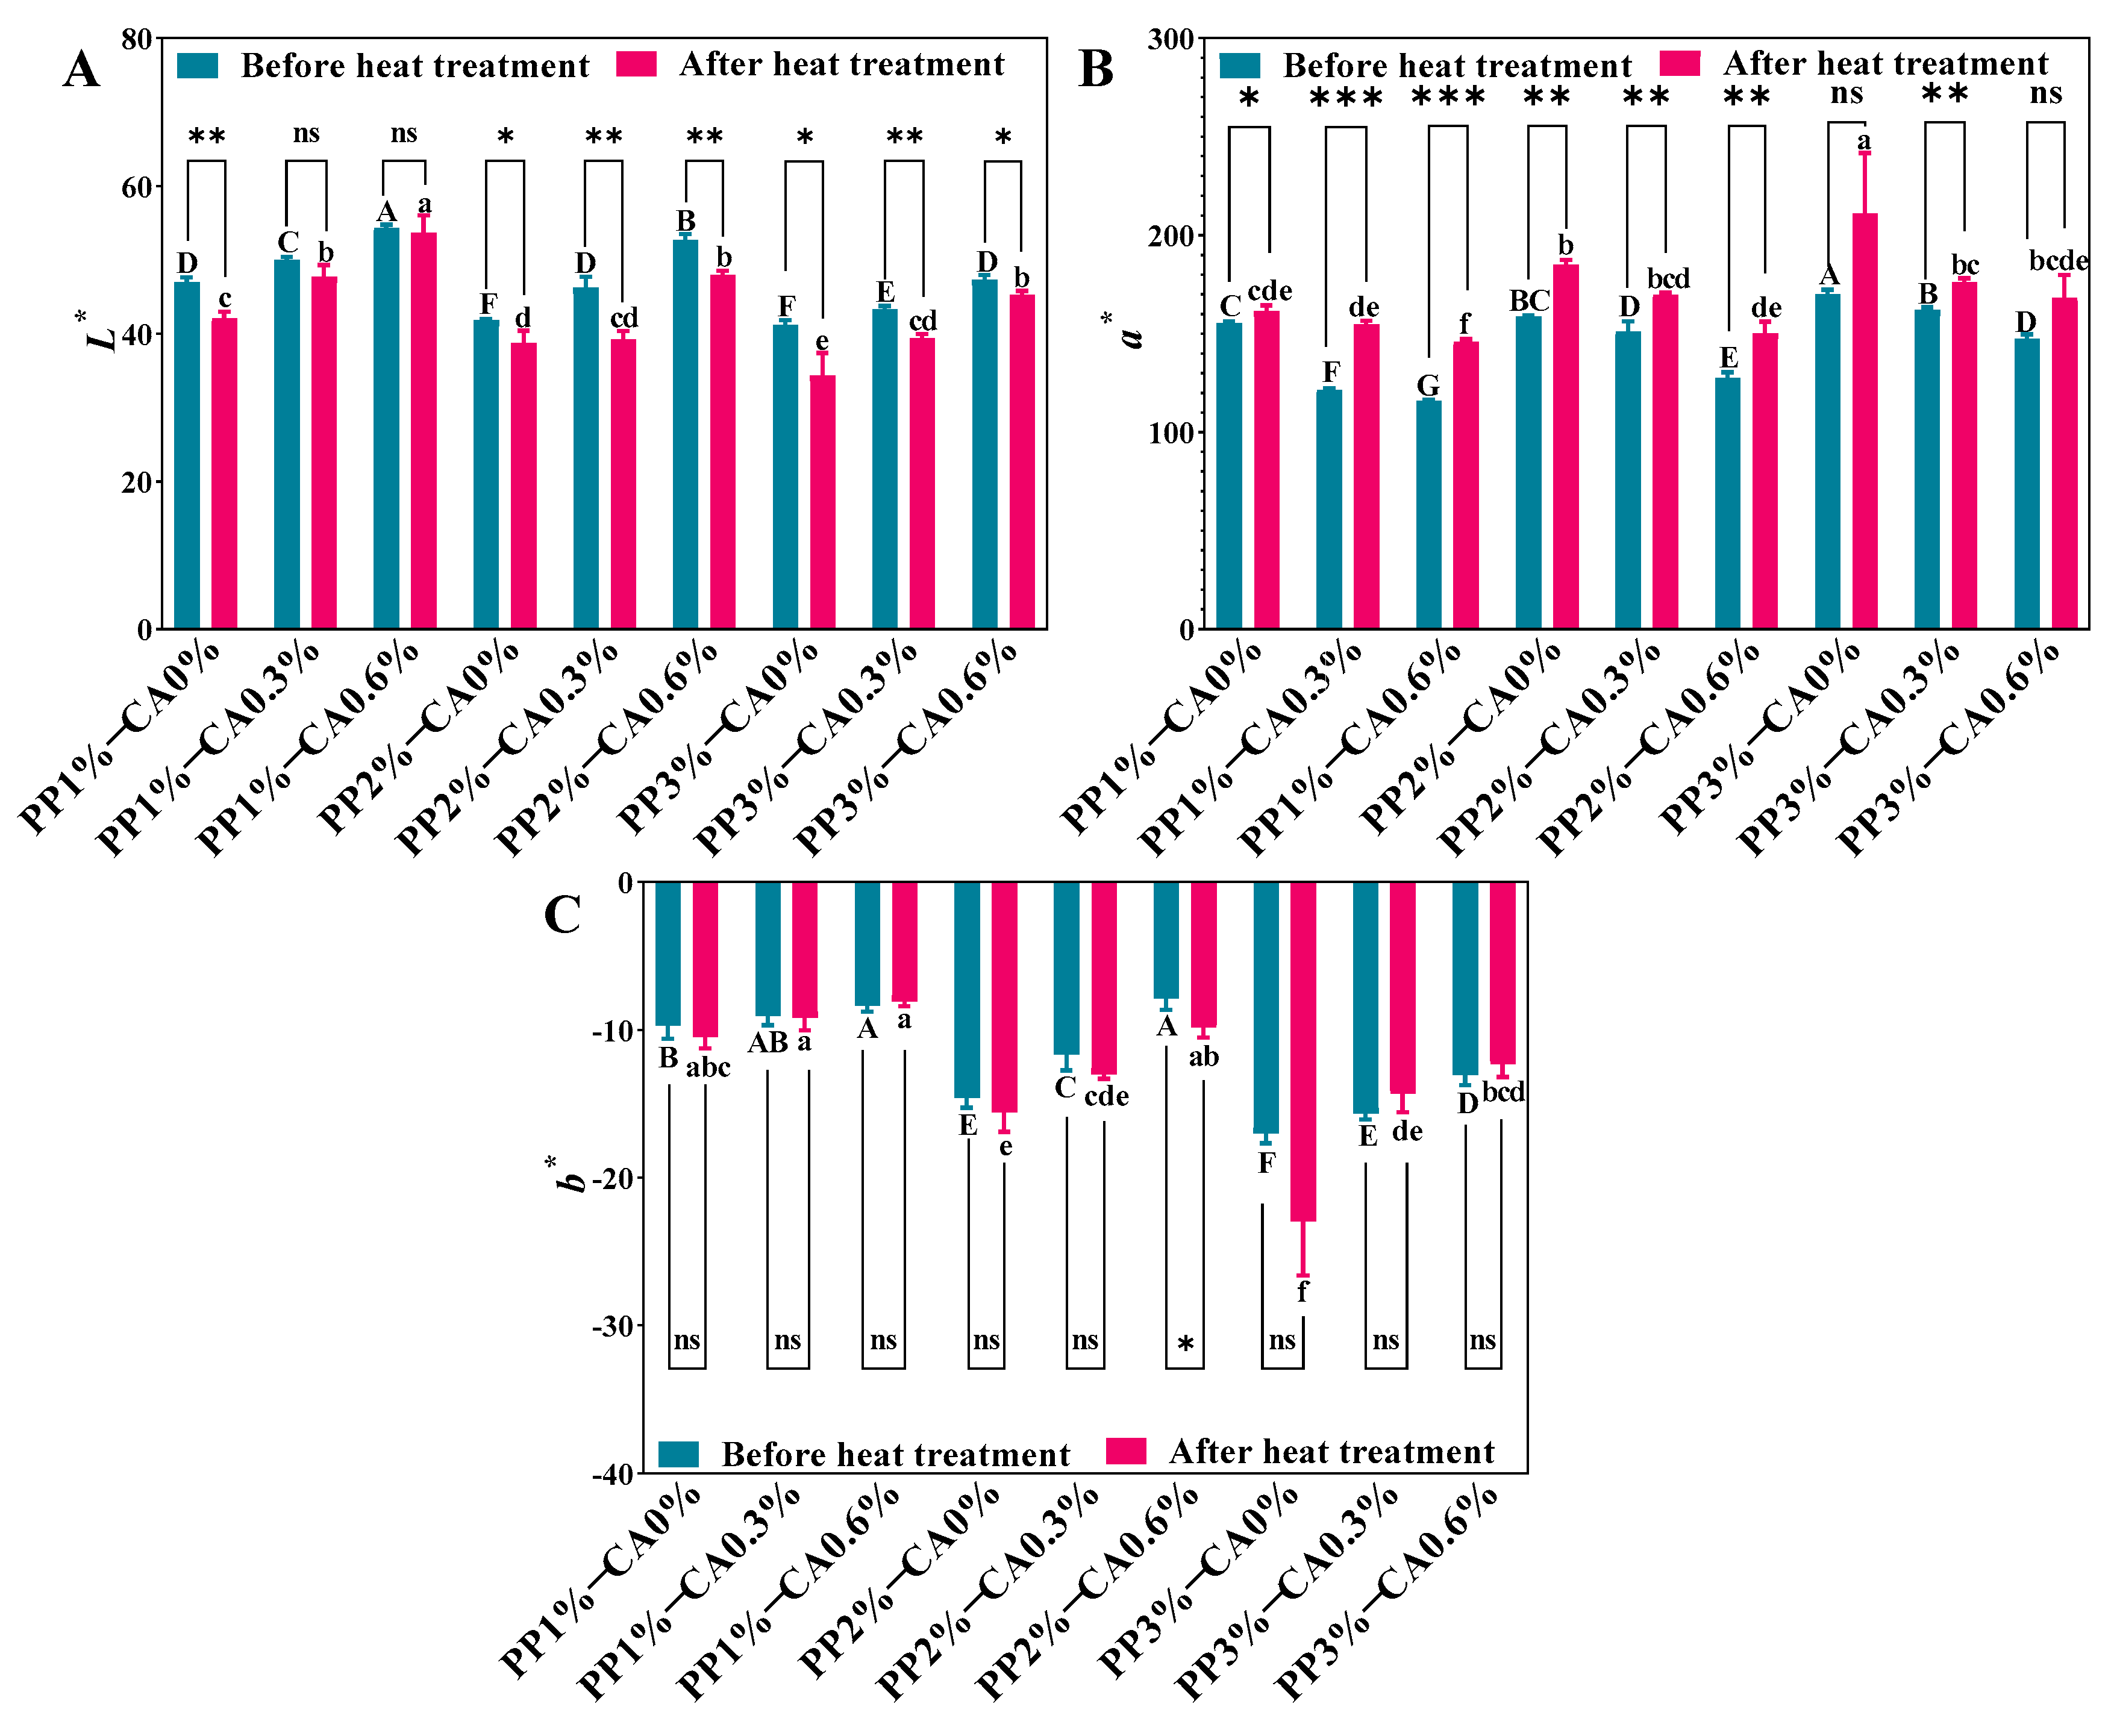
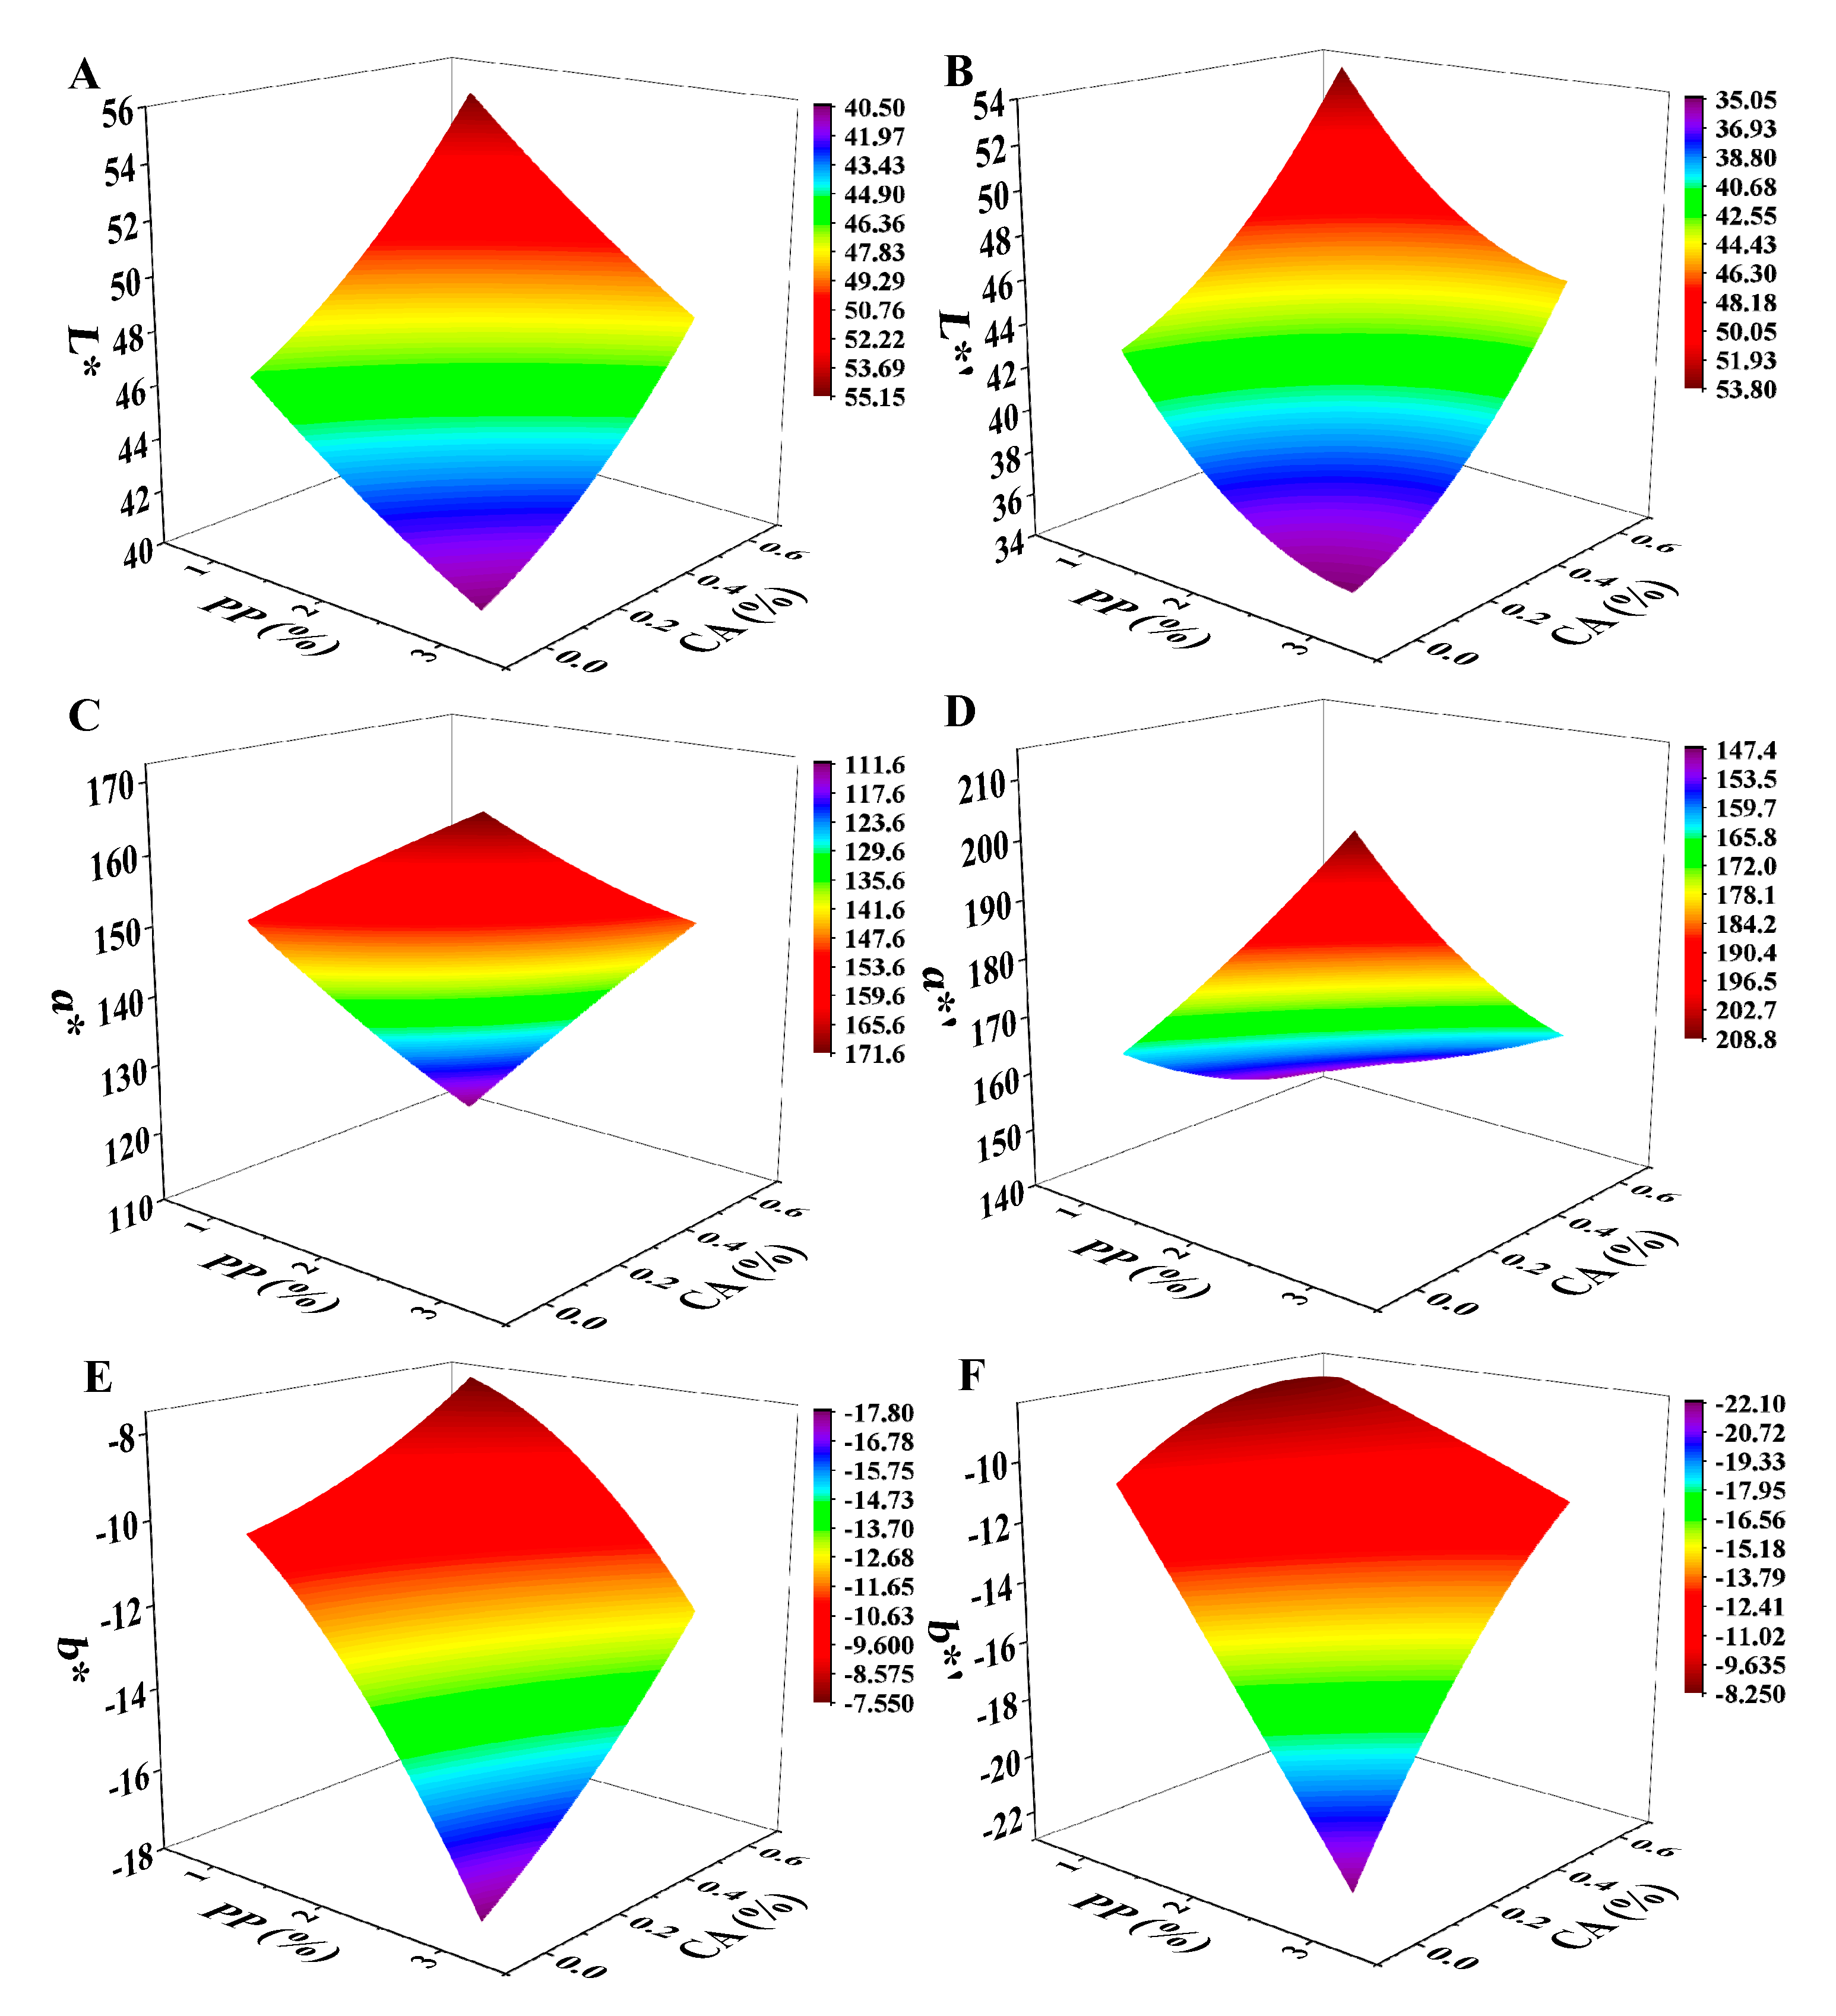
3.1. Measurements of Colour
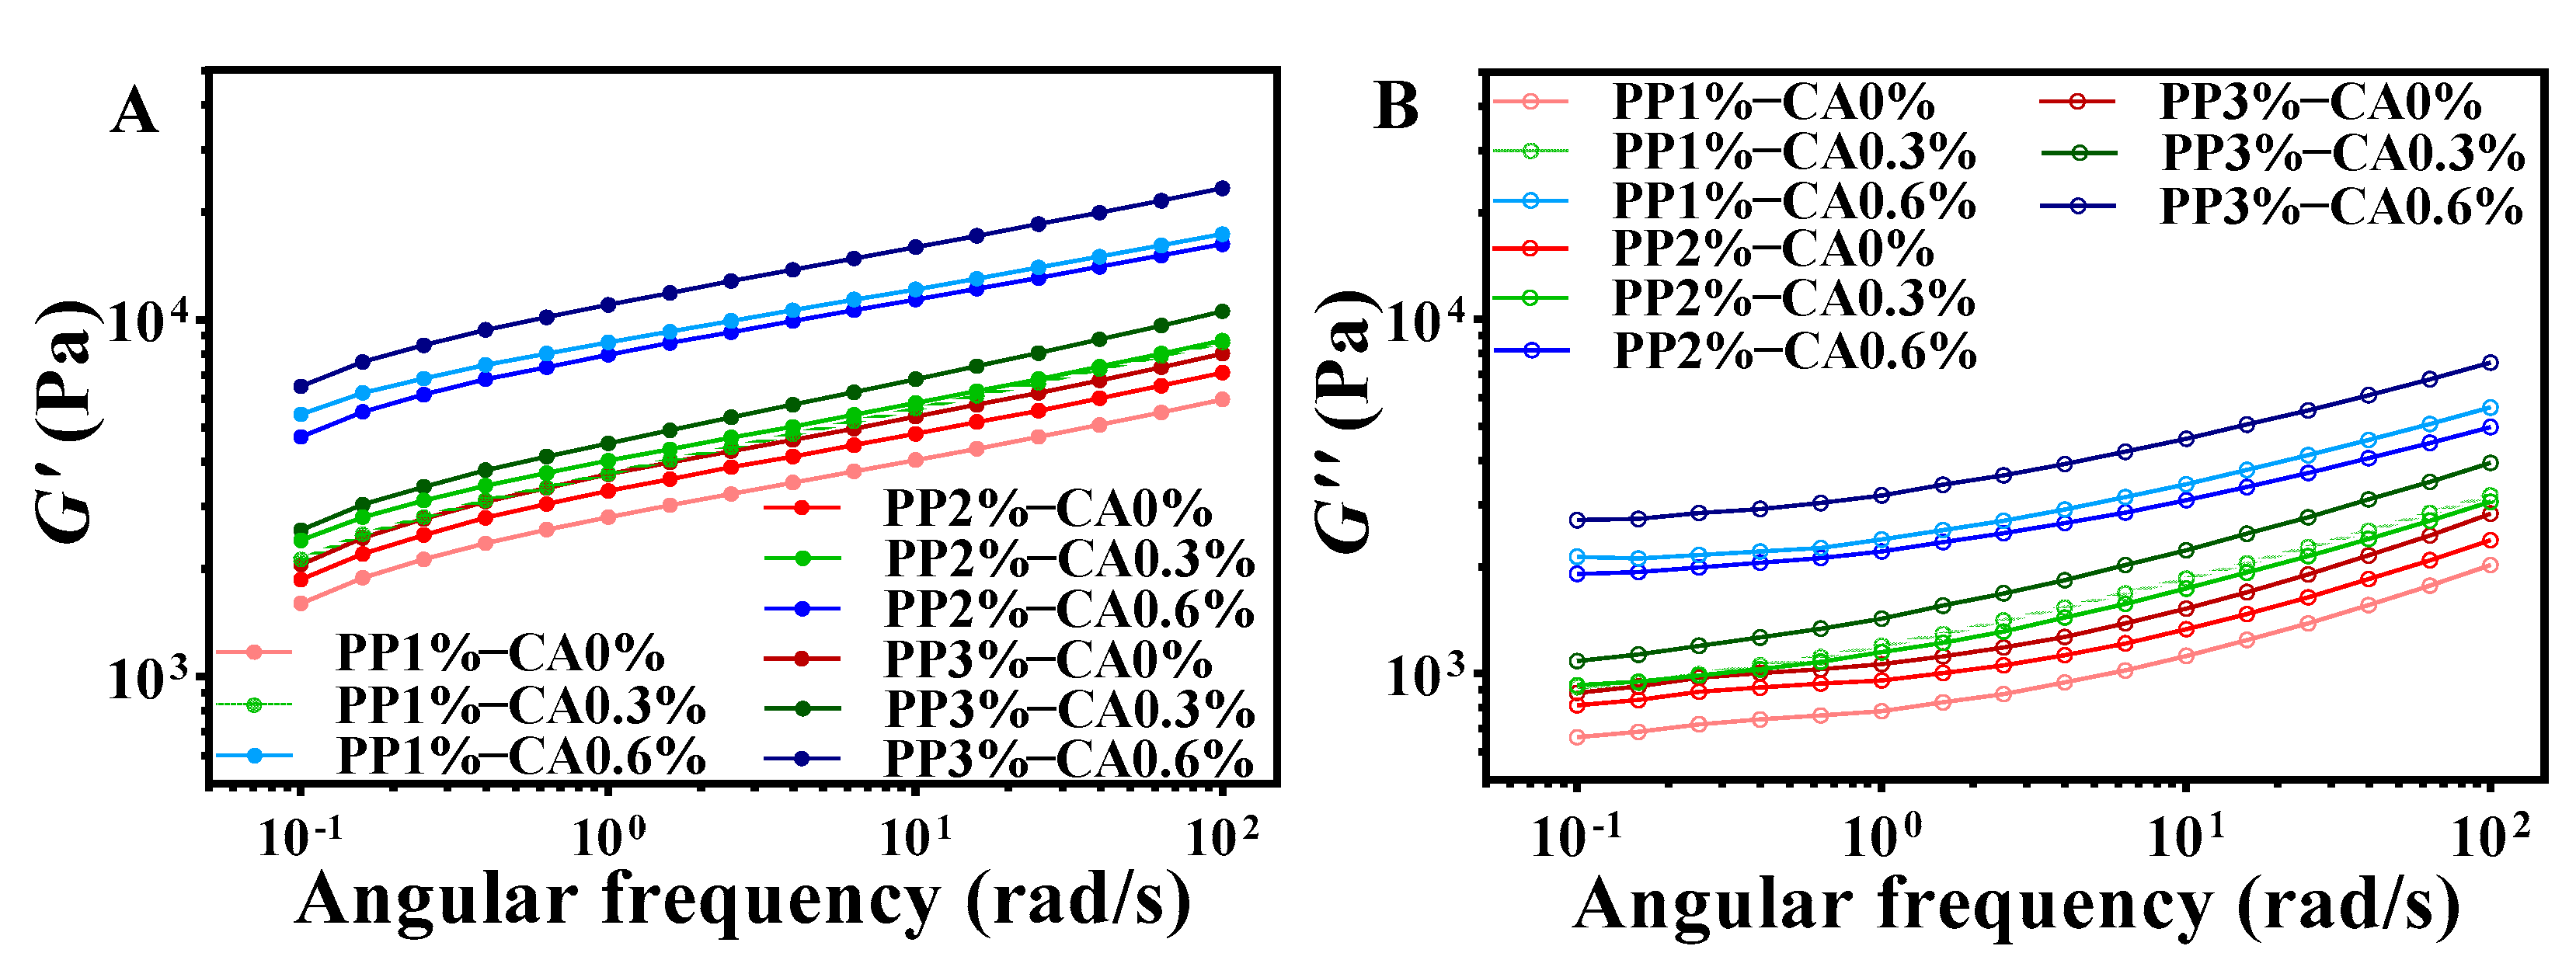
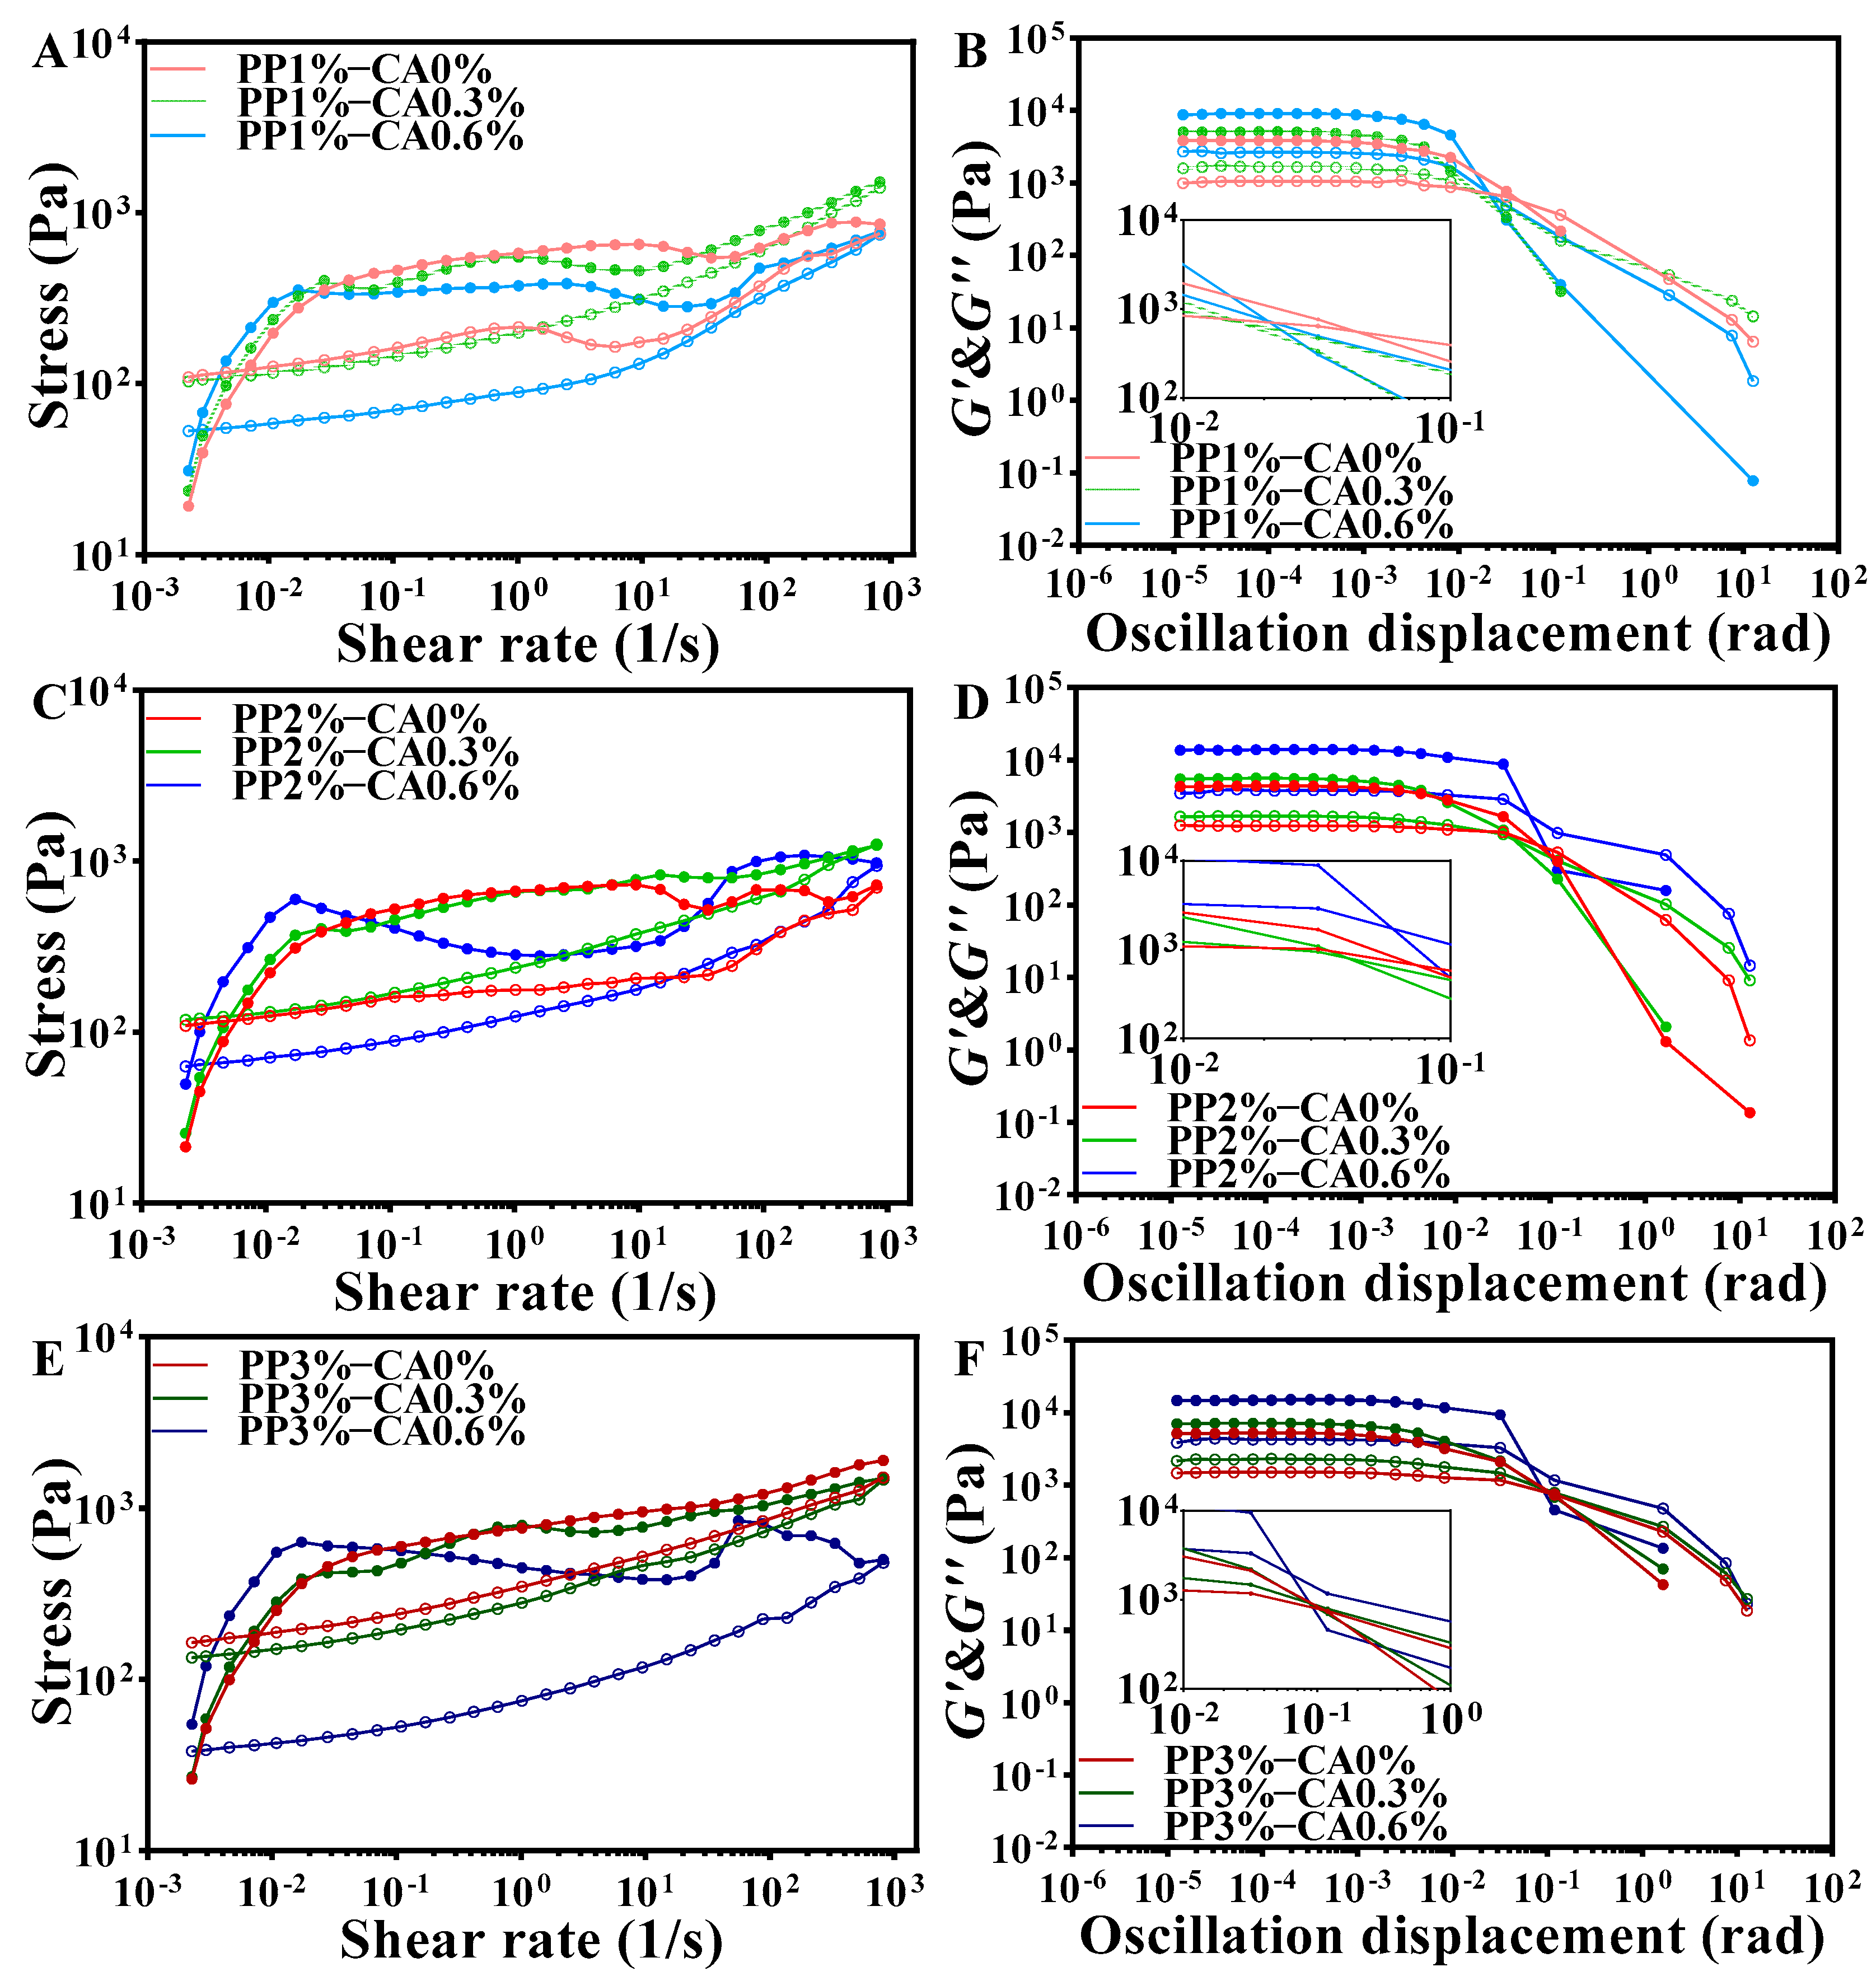
3.2. Rheological Properties of the Samples
3.3. 3D Printability
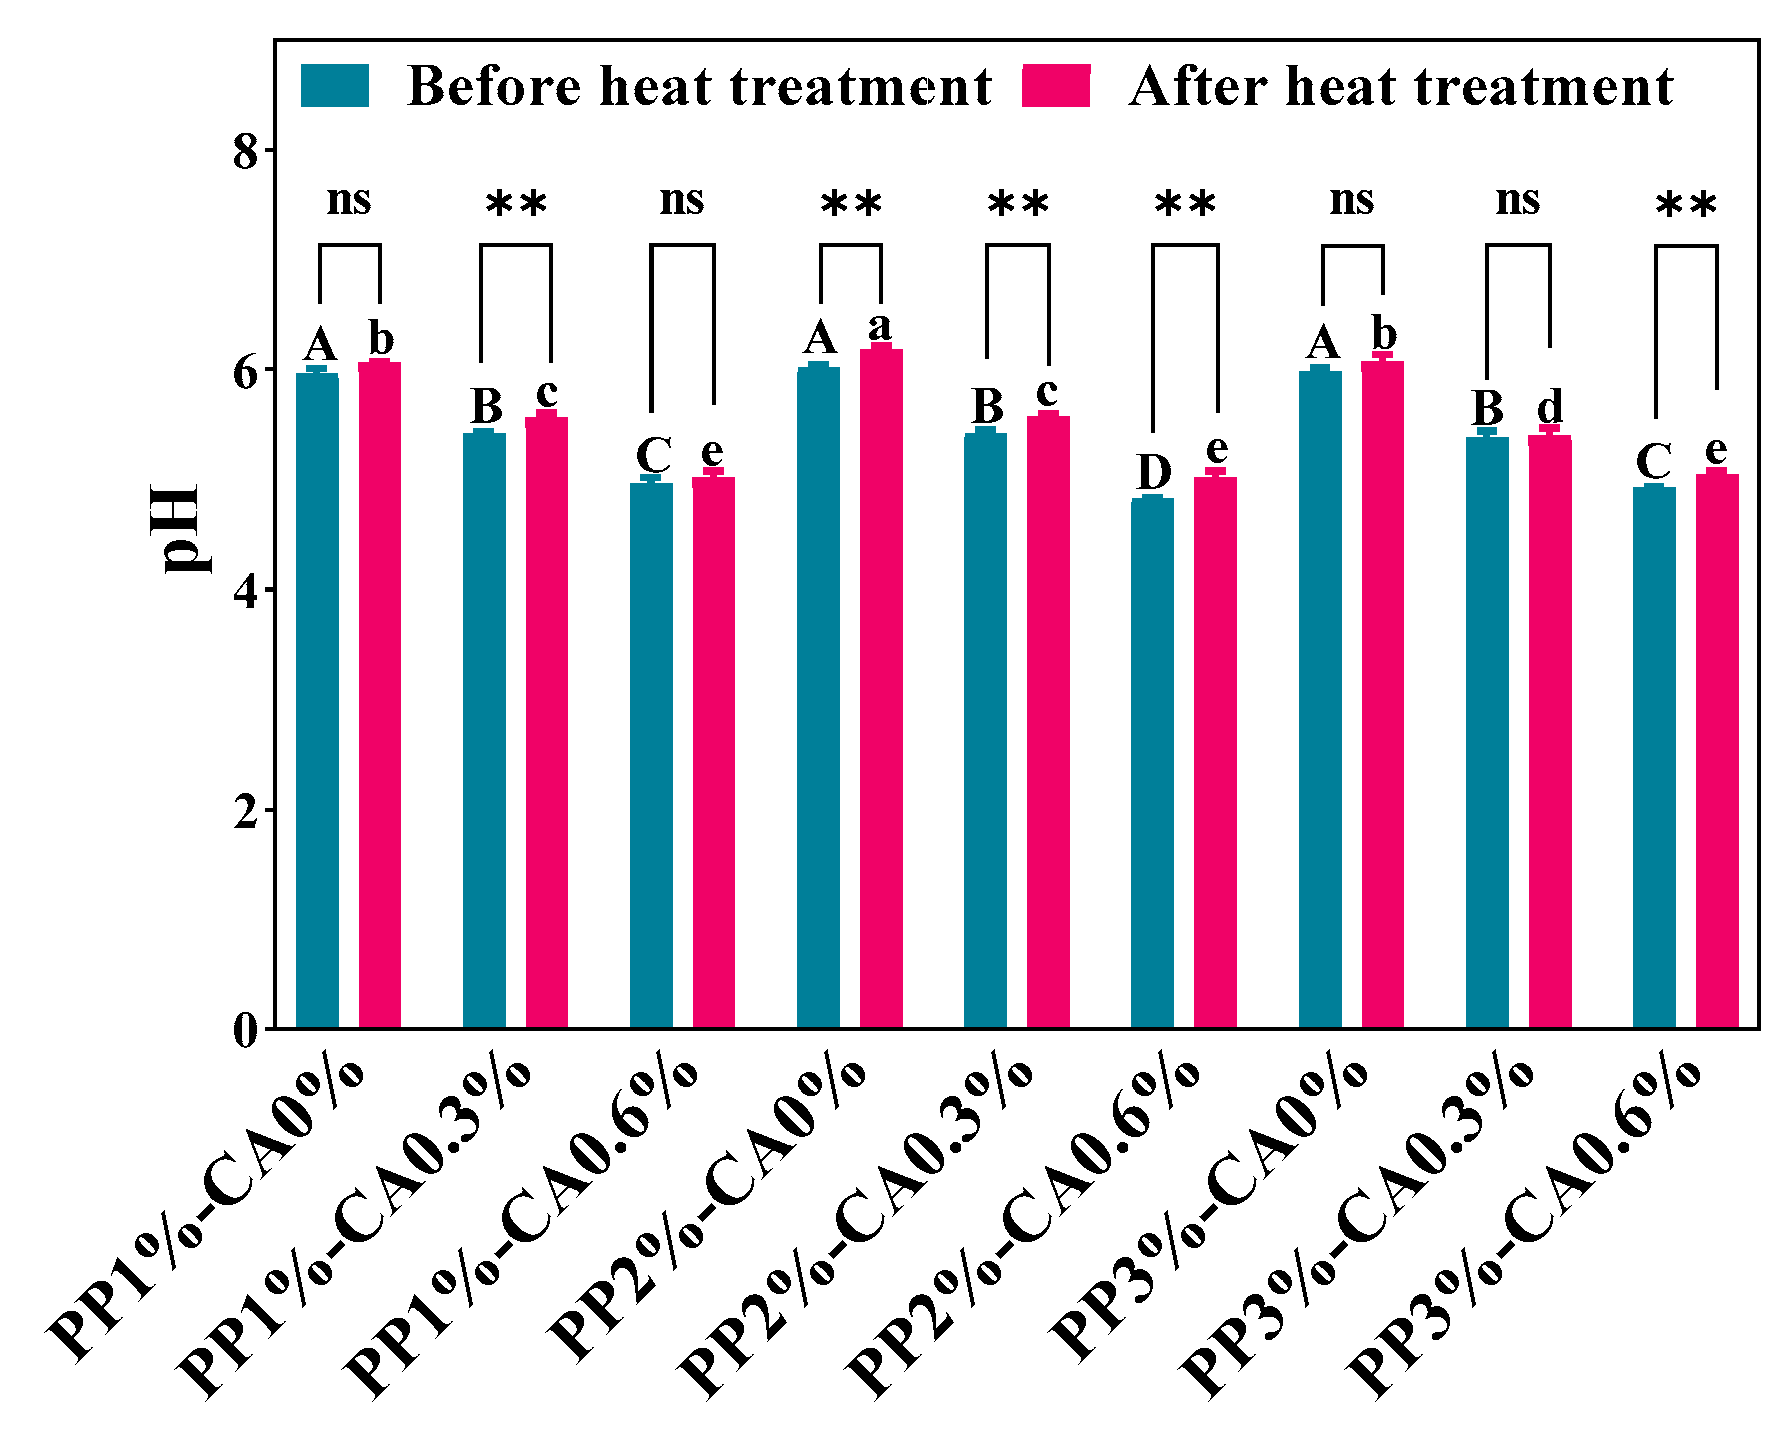
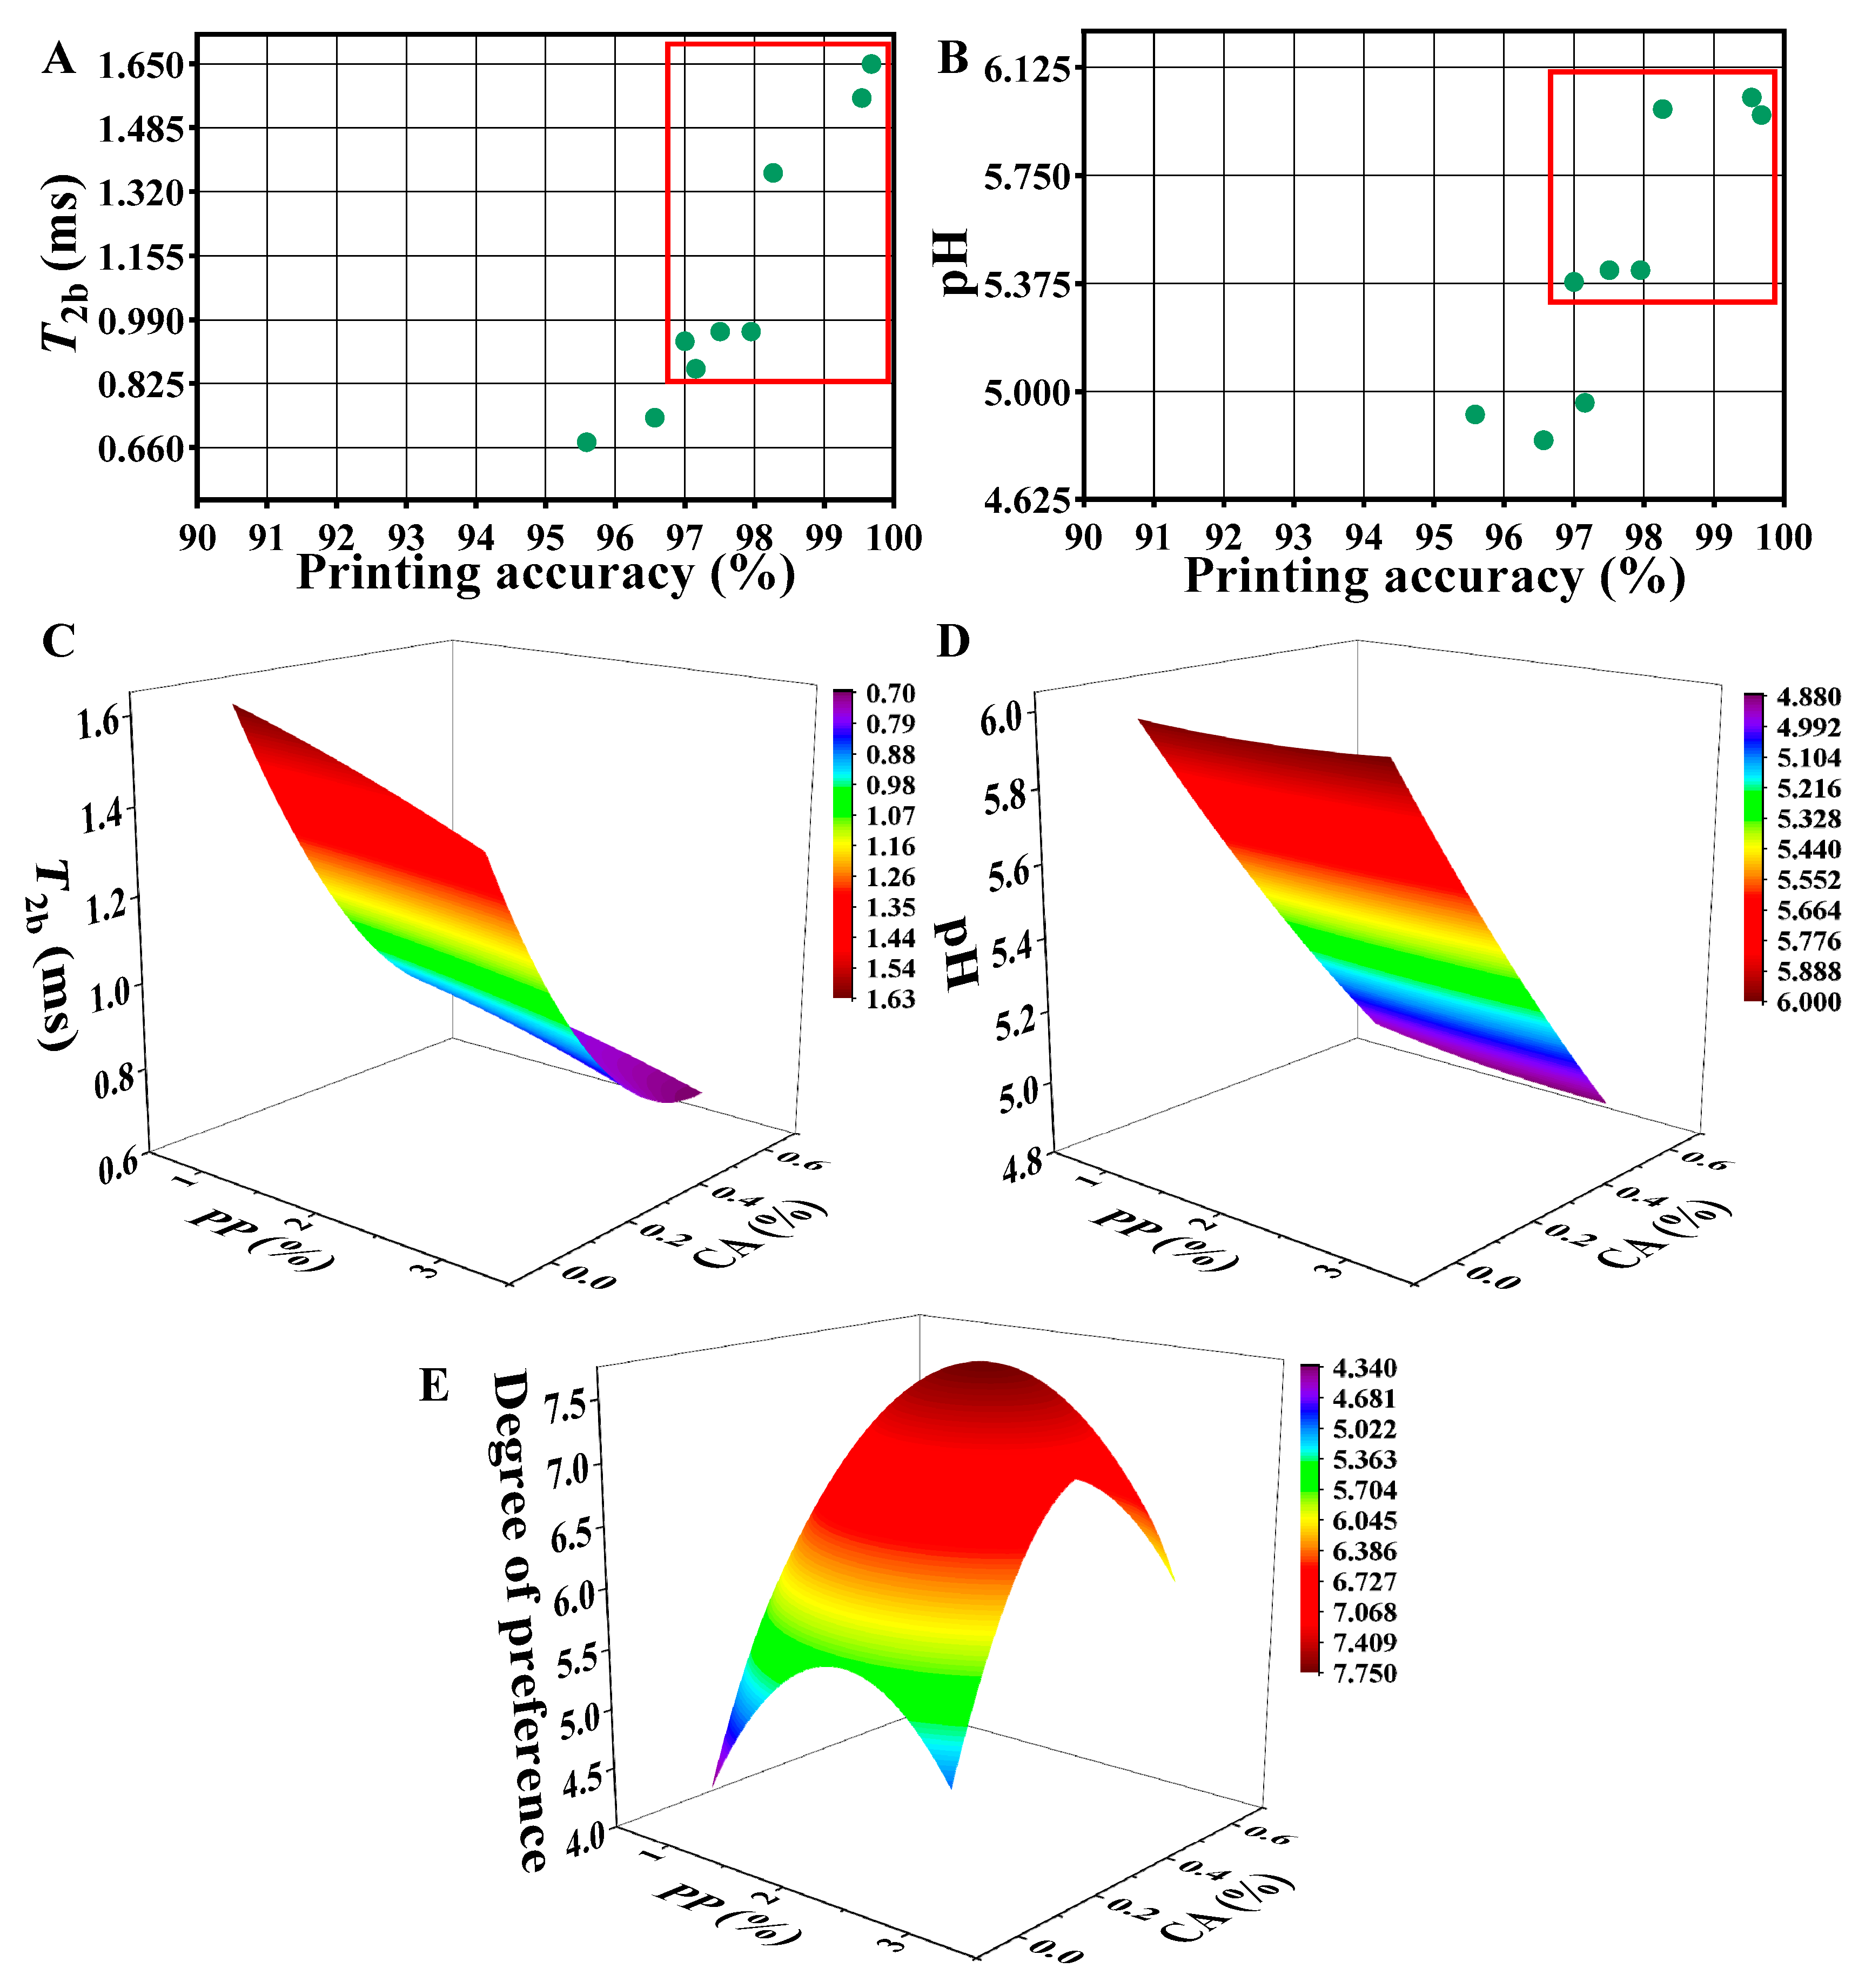
3.4. Measurements of pH
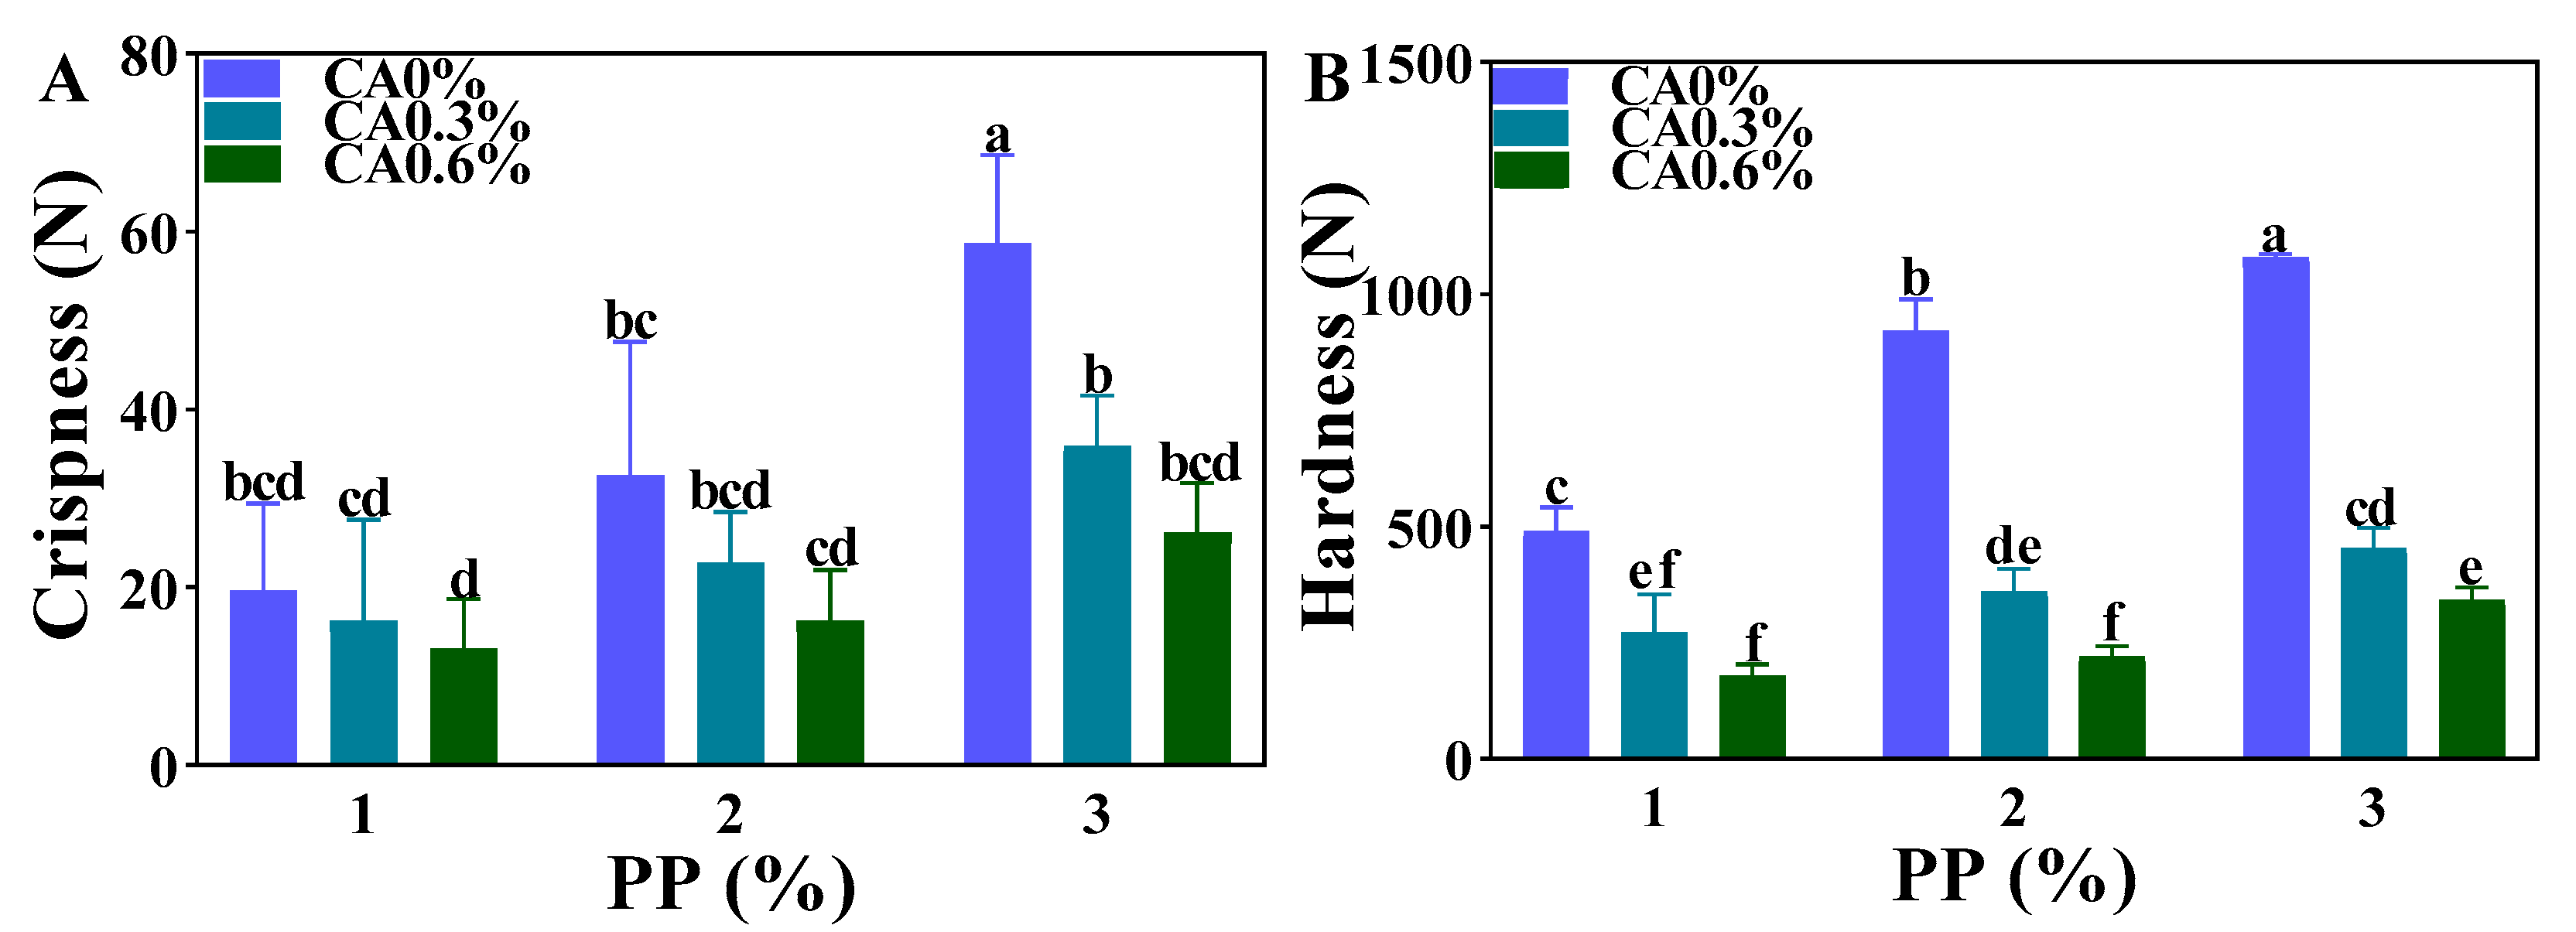
3.5. Texture Properties
3.6. Measurements of LF-NMR
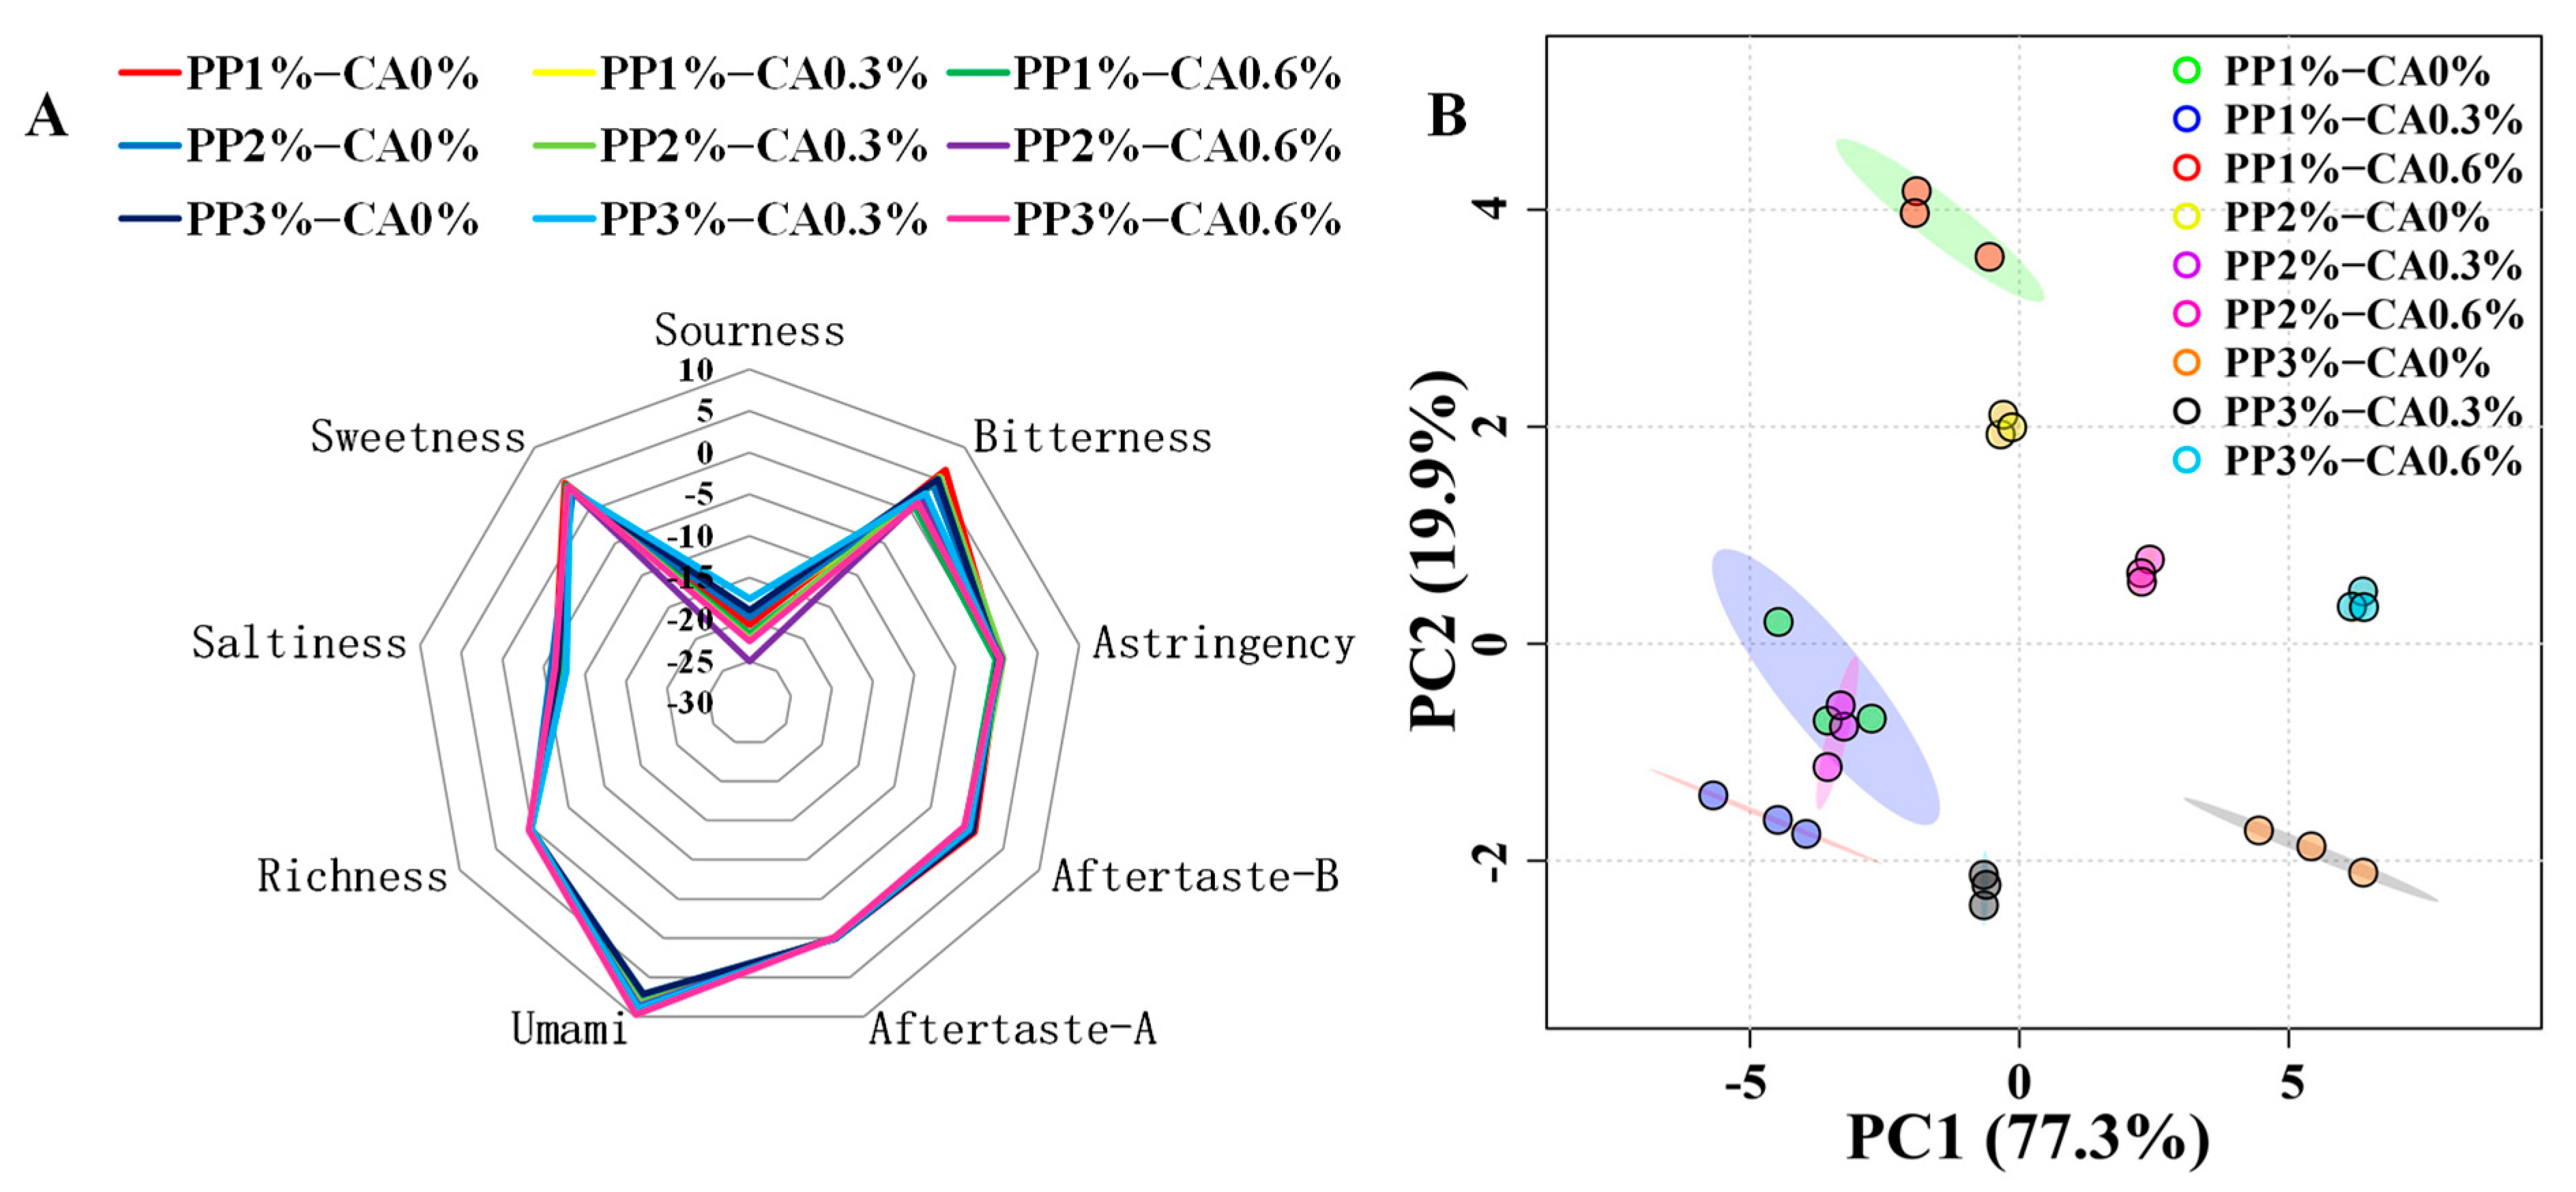
3.7. Measurements of E-Tongue
3.8. Sensory Analysis
3.9. Correlation Analysis
4. Conclusions
Author Contributions
Funding
Data Availability Statement
Conflicts of Interest
References
- Asamoah, E.K.; Nunoo, F.K.; Addo, S.; Nyarko, J.O.; Acquah, S.A.; Hyldig, G. Effect of smoking and gamma irradiation on the nutritional and sensory quality of Atlantic chub mackerel in Ghana. Radiat. Phys. Chem. 2022, 201, 110458. [Google Scholar] [CrossRef]
- Bellagha, S.; Amami, E.; Farhat, A.; Kechaou, N. Drying kinetics and characteristic drying curve of lightly salted sardine (Sardinella aurita). Dry. Technol. 2002, 20, 1527–1538. [Google Scholar] [CrossRef]
- Lin, C.S.; Lee, Y.C.; Ciou, J.W.; Hwang, C.C.; Kung, H.F.; Tsai, Y.H. Inhibitory effects of high pressure processing on microbial growth and histamine formation in spotted mackerel (Scomber australasicus) during refrigerated storage. CyTA-J. Food 2021, 19, 762–770. [Google Scholar] [CrossRef]
- Bala, B.K.; Mondol, M.R.A. Experimental investigation on solar drying of fish using solar tunnel dryer. Dry. Technol. 2001, 19, 427–436. [Google Scholar] [CrossRef]
- Godoi, F.C.; Prakash, S.; Bhandari, B.R. 3d printing technologies applied for food design: Status and prospects. J. Food Eng. 2016, 179, 44–54. [Google Scholar] [CrossRef] [Green Version]
- Liu, Y.; Sun, Q.; Wei, S.; Xia, Q.; Pan, Y.; Ji, H.; Chen, C.; Hao, J.; Liu, S. Insight into the correlations among rheological behaviour, protein molecular structure and 3D printability during the processing of surimi from golden pompano (Trachinotus ovatus). Food Chem. 2022, 371, 131046. [Google Scholar] [CrossRef] [PubMed]
- Kelleher, S.D.; Hultin, H.O.; Wilhelm, K.A. Stability of mackerel surimi prepared under lipid-stabilizing processing conditions. J. Food Sci. 1994, 59, 269–271. [Google Scholar] [CrossRef]
- He, C.; Zhang, M.; Devahastin, S. Investigation on spontaneous shape change of 4D printed starch-based purees from purple sweet potatoes as induced by microwave dehydration. ACS Appl. Mater. Interfaces 2020, 12, 37896–37905. [Google Scholar] [CrossRef]
- He, C.; Zhang, M.; Guo, C. 4D printing of mashed potato/purple sweet potato puree with spontaneous color change. Innov. Food Sci. Emerg. Technol. 2020, 59, 102250. [Google Scholar] [CrossRef]
- He, C.; Zhang, M.; Devahastin, S. Microwave-induced deformation behaviors of 4D printed starch-based food products as affected by edible salt and butter content. Innov. Food Sci. Emerg. Technol. 2021, 70, 102699. [Google Scholar] [CrossRef]
- Dong, X.; Huang, Y.; Pan, Y.; Wang, K.; Prakash, S.; Zhu, B. Investigation of sweet potato starch as a structural enhancer for three-dimensional printing of Scomberomorus niphonius surimi. J. Texture Stud. 2019, 50, 316–324. [Google Scholar] [CrossRef] [PubMed]
- Gu, Z.; Liu, S.; Duan, Z.; Kang, R.; Zhao, M.; Xia, G.; Shen, X. Effect of citric acid on physicochemical properties and protein structure of low-salt restructured tilapia (Oreochromis mossambicus) meat products. J. Sci. Food Agric. 2021, 101, 1636–1645. [Google Scholar] [CrossRef] [PubMed]
- Bou, R.; Claret, A.; Stamatakis, A.; Martínez, B.; Guerrero, L. Quality changes and shelf-life extension of ready-to-eat fish patties by adding encapsulated citric acid. J. Sci. Food Agric. 2017, 97, 5352–5360. [Google Scholar] [CrossRef]
- Xie, Y.; Yu, X.; Wang, Y.; Yu, C.; Prakash, S.; Zhu, B.; Dong, X. Role of dietary fiber and flaxseed oil in altering the physicochemical properties and 3D printability of cod protein composite gel. J. Food Eng. 2022, 327, 111053. [Google Scholar] [CrossRef]
- Mackley, M.R.; Tock, C.; Anthony, R.; Butler, S.A.; Chapman, G.; Vadillo, D.C. The rheology and processing behavior of starch and gum-based dysphagia thickeners. J. Rheol. 2013, 57, 1533–1553. [Google Scholar] [CrossRef] [Green Version]
- Nguyen, P.T.; Kravchuk, O.; Bhandari, B.; Prakash, S. Effect of different hydrocolloids on texture, rheology, tribology and sensory perception of texture and mouthfeel of low-fat pot-set yoghurt. Food Hydrocoll. 2017, 72, 90–104. [Google Scholar] [CrossRef] [Green Version]
- Pan, Y.; Sun, Q.; Liu, Y.; Wei, S.; Xia, Q.; Zheng, O.; Liu, S.; Ji, H.; Deng, C.; Hao, J. The relationship between rheological and textural properties of shrimp surimi adding starch and 3D printability based on principal component analysis. Food Sci. Nutr. 2021, 9, 2985–2999. [Google Scholar] [CrossRef]
- Abraha, B.; Mahmud, A.; Admassu, H.; Habte-Tsion, H.M.; Xia, W.; Yang, F. Production of biscuit from Chinese sturgeon fish fillet powder (Acipeneser sinensis): A snack food for children. J. Aquat. Food Prod. Technol. 2018, 27, 1048–1062. [Google Scholar] [CrossRef]
- Melis, R.; Vitangeli, I.; Anedda, R. Effect of fish diet and cooking mode on the composition and microstructure of ready-to-eat fish fillets of gilthead sea bream (Sparus aurata) juveniles. J. Food Compos. Anal. 2022, 114, 104847. [Google Scholar] [CrossRef]
- Zhou, B.; Ma, B.; Xu, C.; Wang, J.; Wang, Z.; Huang, Y.; Ma, C. Impact of enzymatic fermentation on taste, chemical compositions and in vitro antioxidant activities in Chinese teas using E-tongue, HPLC and amino acid analyzer. LWT-Food Sci. Technol. 2022, 163, 113549. [Google Scholar] [CrossRef]
- Okuda, H.; Tasaka, M.; Yui, A.; Kawasome, S. Correlation between the image of food colors and the taste sense: The case of Japanese Twenties. J. Cook. Sci. Jpn. 2002, 35, 2–9. [Google Scholar] [CrossRef]
- Ekaputra, T.; Pramitasari, R. Evaluation of physicochemical properties of anthocyanin extracts and powders from purple sweet potato (Ipomoea batatas L.). Food Res. 2020, 4, 2020–2029. [Google Scholar] [CrossRef] [PubMed]
- Lin, T.; Zhou, Z.; Xing, C.; Zhou, J.; Fan, G.; Xie, C. Effect of color protection treatment on the browning and enzyme activity of Lentinus edodes during processing. Food Sci. Nutr. 2022, 10, 2989–2998. [Google Scholar] [CrossRef] [PubMed]
- Wu, H.Y.; Yang, K.M.; Chiang, P.Y. Roselle anthocyanins: Antioxidant properties and stability to heat and pH. Molecules 2018, 23, 1357. [Google Scholar] [CrossRef] [Green Version]
- Wołoszyn, J.; Wereńska, M.; Goluch, Z.; Haraf, G.; Okruszek, A.; Teleszko, M.; Król, B. The selected goose meat quality traits in relation to various types of heat treatment. Poult. Sci. 2020, 99, 7214–7224. [Google Scholar] [CrossRef] [PubMed]
- Li, J.; Walker, C.E.; Faubion, J.M. Acidulant and oven type affect total anthocyanin content of blue corn cookies. J. Sci. Food Agric. 2011, 91, 38–43. [Google Scholar] [CrossRef] [PubMed]
- Liu, Z.; Zhang, M.; Bhandari, B.; Yang, C. Impact of rheological properties of mashed potatoes on 3D printing. J. Food Eng. 2018, 220, 76–82. [Google Scholar] [CrossRef] [Green Version]
- Jiang, H.; Zheng, L.; Zou, Y.; Tong, Z.; Han, S.; Wang, S. 3D food printing: Main components selection by considering rheological properties. Crit. Rev. Food Sci. Nutr. 2019, 59, 2335–2347. [Google Scholar] [CrossRef]
- Stone, A.K.; Lam, R.S.; Hopkins, E.J.; Hucl, P.; Scanlon, M.G.; Nickerson, M.T. Effect of organic acids and NaCl on the rheological properties of dough prepared using Pembina and Harvest CWRS wheat cultivars. Cereal Chem. 2018, 95, 478–485. [Google Scholar] [CrossRef]
- Zhuang, X.; Jiang, X.; Zhou, H.; Han, M.; Liu, Y.; Bai, Y.; Xu, X.; Zhou, G.H. The effect of insoluble dietary fiber on myofibrillar protein emulsion gels: Oil particle size and protein network microstructure. LWT-Food Sci. Technol. 2019, 101, 534–542. [Google Scholar] [CrossRef]
- Larson, R.G.; Wei, Y. A review of thixotropy and its rheological modeling. J. Rheol. 2019, 63, 477–501. [Google Scholar] [CrossRef]
- Liu, Y.; Yu, Y.; Liu, C.; Regenstein, J.M.; Liu, X.; Zhou, P. Rheological and mechanical behavior of milk protein composite gel for extrusion-based 3D food printing. LWT-Food Sci. Technol. 2019, 102, 338–346. [Google Scholar] [CrossRef]
- Tian, H.; Wang, K.; Qiu, R.; Wang, S.; Hu, Z.; Zhao, L. Effects of incubation temperature on the mechanical and structure performance of beeswax-carrageenan-xanthan hybrid gelator system in 3D printing. Food Hydrocoll. 2022, 127, 107541. [Google Scholar] [CrossRef]
- Xing, X.; Chitrakar, B.; Hati, S.; Xie, S.; Li, H.; Li, C.; Liu, Z.; Mo, H. Development of black fungus-based 3D printed foods as dysphagia diet: Effect of gums incorporation. Food Hydrocoll. 2022, 123, 107173. [Google Scholar] [CrossRef]
- Martins, P.C.; Gutkoski, L.C.; Martins, V.G. Impact of acid hydrolysis and esterification process in rice and potato starch properties. Int. J. Biol. Macromol. 2018, 120, 959–965. [Google Scholar] [CrossRef]
- Navaf, M.; Sunooj, K.V.; Aaliya, B.; Sudheesh, C.; Akhila, P.P.; Sabu, S.; Sasidharan, A.; George, J. Talipot palm (Corypha umbraculifera L.) a nonconventional source of starch: Effect of citric acid on structural, rheological, thermal properties and in vitro digestibility. Int. J. Biol. Macromol. 2021, 182, 554–563. [Google Scholar] [CrossRef]
- Golachowski, A.; Drożdż, W.; Golachowska, M.; Kapelko-Żeberska, M.; Raszewski, B. Production and properties of starch citrates-Current research. Foods 2020, 9, 1311. [Google Scholar] [CrossRef]
- Lambros, M.; Tran, T.; Fei, Q.; Nicolaou, M. Citric acid: A multifunctional pharmaceutical excipient. Pharmaceutics 2022, 14, 972. [Google Scholar] [CrossRef]
- Sumnu, G. A review on microwave baking of foods. Int. J. Food Sci. Technol. 2001, 36, 117–127. [Google Scholar] [CrossRef]
- Xie, Y.; Yan, M.; Yuan, S.; Sun, S.; Huo, Q. Effect of microwave treatment on the physicochemical properties of potato starch granules. Chem. Cent. J. 2013, 7, 113. [Google Scholar] [CrossRef] [Green Version]
- Wu, C.; Sun, R.; Zhang, Q.; Zhong, G. Synthesis and characterization of citric acid esterified canna starch (RS4) by semi-dry method using vacuum-microwave-infrared assistance. Carbohydr. Polym. 2020, 250, 116985. [Google Scholar] [CrossRef] [PubMed]
- Han, M.; Zhang, Y.; Fei, Y.; Xu, X.; Zhou, G. Effect of microbial transglutaminase on NMR relaxometry and microstructure of pork myofibrillar protein gel. Eur. Food Res. Technol. 2009, 228, 665–670. [Google Scholar] [CrossRef]
- Sun, Q.; Kong, B.; Liu, S.; Zheng, O.; Zhang, C. Ultrasound-assisted thawing accelerates the thawing of common carp (Cyprinus carpio) and improves its muscle quality. LWT-Food Sci. Technol. 2021, 16, 111080. [Google Scholar] [CrossRef]
- Hunt, A.; Getty, K.J.K.; Park, J.W. Roles of starch in surimi seafood: A review. Food Rev. Int. 2009, 25, 299–312. [Google Scholar] [CrossRef]
- Olayemi, B.; Isimi, C.Y.; Ekere, K.; Isaac, A.J.; Okoh, J.E.; Emeje, M. Green preparation of citric acid crosslinked starch for improvement of physicochemical properties of Cyperus starch. Turk. J. Pharm. Sci. 2021, 18, 34–43. [Google Scholar] [CrossRef] [PubMed]
- Jiang, H.; Zhang, M.; Bhandari, B.; Adhikari, B. Application of electronic tongue for fresh foods quality evaluation: A review. Food Rev. Int. 2018, 34, 746–769. [Google Scholar] [CrossRef]
- Qin, C.; Chen, C.; Yuan, Q.; Jiang, N.; Liu, M.; Duan, Y.; Wan, H.; Li, R.; Zhuang, L.; Wang, P. Biohybrid tongue for evaluation of taste interaction between sweetness and sourness. Anal. Chem. 2022, 94, 6976–6985. [Google Scholar] [CrossRef]
- Dong, W.; Hu, R.; Long, Y.; Li, H.; Zhang, Y.; Zhu, K.; Chu, Z. Comparative evaluation of the volatile profiles and taste properties of roasted coffee beans as affected by drying method and detected by electronic nose, electronic tongue, and HS-SPME-GC-MS. Food Chem. 2019, 272, 723–731. [Google Scholar] [CrossRef]
- Wu, J.; Chen, X.; Chen, B.; Pan, N.; Qiao, K.; Wu, G.; Liu, Z. Collaborative analysis combining headspace-gas chromatography-ion mobility spectrometry (HS-GC-IMS) and intelligent (electronic) sensory systems to evaluate differences in the flavour of cultured pufferfish. Flavour Fragr. J. 2021, 36, 182–189. [Google Scholar] [CrossRef]


| Sample | PP (%) | CA (%) |
|---|---|---|
| PP1%-CA0% | 1 | 0 |
| PP1%-CA0.3% | 1 | 0.3 |
| PP1%-CA0.6% | 1 | 0.6 |
| PP2%-CA0% | 2 | 0 |
| PP2%-CA0.3% | 2 | 0.3 |
| PP2%-CA0.6% | 2 | 0.6 |
| PP3%-CA0% | 3 | 0 |
| PP3%-CA0.3% | 3 | 0.3 |
| PP3%-CA0.6% | 3 | 0.6 |
| NAME | DATE |
|---|---|
| Samples Evaluated | Scoring Criteria |
| Heat treatment samples | Observe the heat-treated sample and the intensity of the colour, where the colour pink refers to too light and the colour purple refers to too dark (0 points for too light colour, 10 points for too dark colour). |
| Taste heat-treated samples and evaluate the strength of hardness, where too weak means no need to use too much force when chewing and too strong means chewing with more force (0 points for too-weak hardness, 10 points for too-strong hardness). | |
| Touch and taste the strength of the crispness of the heat-treated sample. Too weak means the sample is not easy to break (soft texture during chewing) and too strong means the sample is fragile (easy to break during chewing). Please note that if you need to break a sample for brittleness sensory evaluation, please break the tasting sample and do not break the thermal sample for observation (0 points for too weak crispness, 10 points for too strong crispness). | |
| Smell and taste the heat-treated sample. The fishy smell is too strong if you think it is too obvious and too weak if it is too low (0 points for too weak fishy smell, 10 points for too strong fishy smell). | |
| Smell and taste the heat-treated sample. The umami is too strong if you think it is too obvious and too weak if it is too low (Umami flavor is too weak for 0 points, Umami flavor is too strong for 10 points). | |
| Smell and taste the heat-treated sample. The sweetness is too strong if you think it is too obvious and too weak if it is too low (0 points for too weak sweetness, 10 points for too strong sweetness). | |
| Smell and taste the heat-treated sample. The saltiness is too strong if you think it is too obvious and too weak if it is too low (0 points for too weak saltiness, 10 points for too strong saltiness). | |
| Smell and taste the heat-treated sample. The sour taste is too strong if you think it is too obvious and too weak if it is too low (0 points for too weak sour taste, 10 points for too strong sour taste). | |
| Smell and taste the heat-treated sample. The aftertaste is too strong if you think it is too obvious and too weak if it is too low (0 points for too weak aftertaste, 10 points for too strong aftertaste). | |
| Observe, touch, smell, and taste the heat-treated samples to evaluate the degree of preference of the samples (0 points for least preferred, 10 points for most preferred). |
| Sample | 3D Printed Products/mm | Heat-Treated Products/mm | Degree of Deformation/% | ||||
|---|---|---|---|---|---|---|---|
| Side Length | Height | Printing Accuracy/% | Side Length | Height | Side Length | Height | |
| PP1%-CA0% | 41.87 ± 0.15 b | 4.04 ± 0.14 a | 99.68 ± 0.26 a | 38.59 ± 0.55 a | 3.81 ± 0.05 a | 7.82 ± 1.01 c | 5.73 ± 2.04 b |
| PP1%-CA0.3% | 41.14 ± 0.21 c | 3.93 ± 0.03 ab | 97.95 ± 0.50 b | 37.70 ± 0.67 ab | 3.27 ± 0.08 d | 8.36 ± 1.25 c | 16.94 ± 2.69 a |
| PP1%-CA0.6% | 43.19 ± 0.62 a | 3.64 ± 0.02 c | 97.16 ± 1.49 bc | 37.07 ± 0.14 bc | 3.00 ± 0.78 e | 14.17 ± 1.08 a | 17.58 ± 0.87 a |
| PP2%-CA0% | 41.91 ± 0.22 b | 4.03 ± 0.01 a | 99.54 ± 0.18 a | 37.65 ± 1.00 ab | 3.65 ± 0.06 b | 10.16 ± 2.38 bc | 9.44 ± 1.71 b |
| PP2%-CA0.3% | 40.95 ± 0.31 c | 3.93 ± 0.06 ab | 97.51 ± 0.74 bc | 35.55 ± 0.26 d | 3.23 ± 0.11 d | 13.18 ± 1.10 ab | 17.84 ± 1.77 a |
| PP2%-CA0.6% | 43.44 ± 0.30 a | 3.61 ± 0.08 c | 96.57 ± 0.72 cd | 36.93 ± 0.86 bc | 2.95 ± 0.12 e | 14.98 ± 1.94 a | 18.21 ± 4.24 a |
| PP3%-CA0% | 42.21 ± 0.86 b | 4.01 ± 0.06 a | 98.27 ± 0.18 b | 35.87 ± 0.61 cd | 3.42 ± 0.07 c | 14.97 ± 2.97 a | 14.63 ± 2.13 a |
| PP3%-CA0.3% | 43.26 ± 0.29 a | 3.86 ± 0.05 b | 97.00 ± 0.70 bc | 36.51 ± 0.29 bcd | 3.16 ± 0.05 d | 15.61 ± 0.16 a | 18.12 ± 2.15 a |
| PP3%-CA0.6% | 43.85 ± 0.25 a | 3.55 ± 0.06 c | 95.59 ± 0.59 d | 36.82 ± 1.27 bcd | 2.87 ± 0.06 e | 16.05 ± 2.41 a | 18.98 ± 1.49 a |
| Colour | Hardness | Crispness | Fishy Taste | Umami | Sweetness | Saltiness | Sour Taste | Aftertaste | Degree of Preference | |
|---|---|---|---|---|---|---|---|---|---|---|
| PP1%-CA0% | 6.56 ± 0.11 c | 5.72 ± 0.11 abc | 5.69 ± 0.11 a | 5.22 ± 0.02 a | 4.29 ± 0.11 e | 3.61 ± 0.51 cd | 4.44 ± 0.26 c | 4.00 ± 0.17 c | 4.51 ± 0.26 b | 4.56 ± 0.07 h |
| PP1%-CA0.3% | 4.39 ± 0.05 f | 5.48 ± 0.35 cd | 5.11 ± 0.10 c | 5.06 ± 0.04 abc | 4.61 ± 0.20 de | 3.56 ± 0.11 cde | 5.00 ± 0.15 ab | 4.39 ± 0.02 b | 4.53 ± 0.10 b | 6.33 ± 0.08 d |
| PP1%-CA0.6% | 3.56 ± 0.10 h | 4.67 ± 0.10 e | 4.72 ± 0.03 d | 4.87 ± 0.02 cd | 4.88 ± 0.02 cd | 3.22 ± 0.26 e | 5.06 ± 0.82 ab | 4.78 ± 0.17 a | 4.56 ± 0.10 b | 5.22 ± 0.04 f |
| PP2%-CA0% | 7.22 ± 0.18 b | 5.78 ± 0.01 ab | 5.78 ± 0.10 a | 5.17 ± 0.17 bc | 4.28 ± 0.11 e | 4.52 ± 0.05 ab | 4.89 ± 0.02 bc | 4.06 ± 0.03 c | 4.81 ± 0.75 ab | 5.33 ± 0.12 f |
| PP2%-CA0.3% | 5.11 ± 0.05 e | 5.61 ± 0.01 bcd | 5.17 ± 0.09 c | 4.99 ± 0.11 bcd | 5.00 ± 0.80 cd | 4.44 ± 0.28 b | 5.11 ± 0.01 ab | 4.11 ± 0.02 c | 4.82 ± 0.11 ab | 7.61 ± 0.05 a |
| PP2%-CA0.6% | 4.17 ± 0.05 g | 5.39 ± 0.01 d | 5.06 ± 0.26 c | 4.78 ± 0.17 d | 5.67 ± 0.02 ab | 3.44 ± 0.20 de | 5.39 ± 0.02 ab | 4.58 ± 0.03 b | 4.83 ± 0.02 ab | 7.00 ± 0.01 c |
| PP3%-CA0% | 8.22 ± 0.02 a | 6.00 ± 0.15 a | 5.87 ± 0.11 a | 5.17 ± 0.11 bc | 4.83 ± 0.26 cd | 4.94 ± 0.10 a | 5.11 ± 0.02 ab | 3.72 ± 0.05 d | 4.96 ± 0.02 ab | 5.06 ± 0.07 g |
| PP3%-CA0.3% | 6.22 ± 0.06 d | 5.72 ± 0.17 abc | 5.44 ± 0.11 b | 4.94 ± 0.17 cd | 5.17 ± 0.01 bc | 4.78 ± 0.17 ab | 5.17 ± 0.11 ab | 4.11 ± 0.07 c | 5.00 ± 0.01 ab | 7.17 ± 0.04 b |
| PP3%-CA0.6% | 5.00 ± 0.22 e | 5.44 ± 0.17 cd | 5.24 ± 0.04 bc | 4.28 ± 0.08 e | 5.71 ± 0.01 a | 3.89 ± 0.02 c | 5.56 ± 0.05 a | 4.46 ± 0.17 b | 5.33 ± 0.26 a | 5.67 ± 0.09 e |
| Indicator | Printing Accuracy | pH | G′ | G″ | τ0 | P2b | P21 | P22 | T2b | T21 | T22 |
|---|---|---|---|---|---|---|---|---|---|---|---|
| Printing accuracy | 1 | ||||||||||
| pH | 0.89 ** | 1 | |||||||||
| G′ | −0.86 ** | −0.86 ** | 1 | ||||||||
| G″ | −0.89 ** | −0.86 ** | 0.99 ** | 1 | |||||||
| τ0 | −0.81 ** | −0.72 * | 0.82 ** | 0.80 ** | 1 | ||||||
| P2b | −0.74 * | −0.40 | 0.64 | 0.69 * | 0.72 * | 1 | |||||
| P21 | 0.73 * | 0.39 | −0.64 | −0.68 * | −0.72 * | −1.00 ** | 1 | ||||
| P22 | 0.89 ** | 0.63 | −0.72 * | −0.76 * | −0.76 * | −0.88 ** | 0.87 ** | 1 | |||
| T2b | 0.95 ** | 0.94 ** | −0.79 * | −0.81 ** | −0.70 * | −0.53 | 0.52 | 0.74 * | 1 | ||
| T21 | 0.92 ** | 0.82 ** | −0.70 * | −0.73 * | −0.79 * | −0.67 * | 0.66 | 0.88 ** | 0.88 ** | 1 | |
| T22 | 0.70 * | 0.41 | −0.57 | −0.60 | −0.56 | −0.83 ** | 0.83 ** | 0.91 ** | 0.52 | 0.67 * | 1 |
Disclaimer/Publisher’s Note: The statements, opinions and data contained in all publications are solely those of the individual author(s) and contributor(s) and not of MDPI and/or the editor(s). MDPI and/or the editor(s) disclaim responsibility for any injury to people or property resulting from any ideas, methods, instructions or products referred to in the content. |
© 2023 by the authors. Licensee MDPI, Basel, Switzerland. This article is an open access article distributed under the terms and conditions of the Creative Commons Attribution (CC BY) license (https://creativecommons.org/licenses/by/4.0/).
Share and Cite
Jin, Z.; Xie, Y.; Wang, Z.; Wang, Y.; Sun, Q.; Dong, X. Regulation of the Colour Change of 3D-Printed Mackerel Mince (Scomber scombrus) Based on Purple Potato Powder and Citric Acid. Foods 2023, 12, 1342. https://doi.org/10.3390/foods12061342
Jin Z, Xie Y, Wang Z, Wang Y, Sun Q, Dong X. Regulation of the Colour Change of 3D-Printed Mackerel Mince (Scomber scombrus) Based on Purple Potato Powder and Citric Acid. Foods. 2023; 12(6):1342. https://doi.org/10.3390/foods12061342
Chicago/Turabian StyleJin, Zheng, Yisha Xie, Zheming Wang, Yue Wang, Qinxiu Sun, and Xiuping Dong. 2023. "Regulation of the Colour Change of 3D-Printed Mackerel Mince (Scomber scombrus) Based on Purple Potato Powder and Citric Acid" Foods 12, no. 6: 1342. https://doi.org/10.3390/foods12061342