
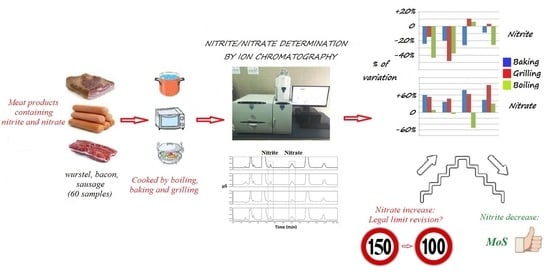
Effect of Different Cooking Treatments on the Residual Level of Nitrite and Nitrate in Processed Meat Products and Margin of Safety (MoS) Assessment


Abstract
:
1. Introduction
2. Materials and Methods
2.1. Sample Collection and Preparation Procedure for IC Analysis
2.2. Chemicals, Standards and Reagents
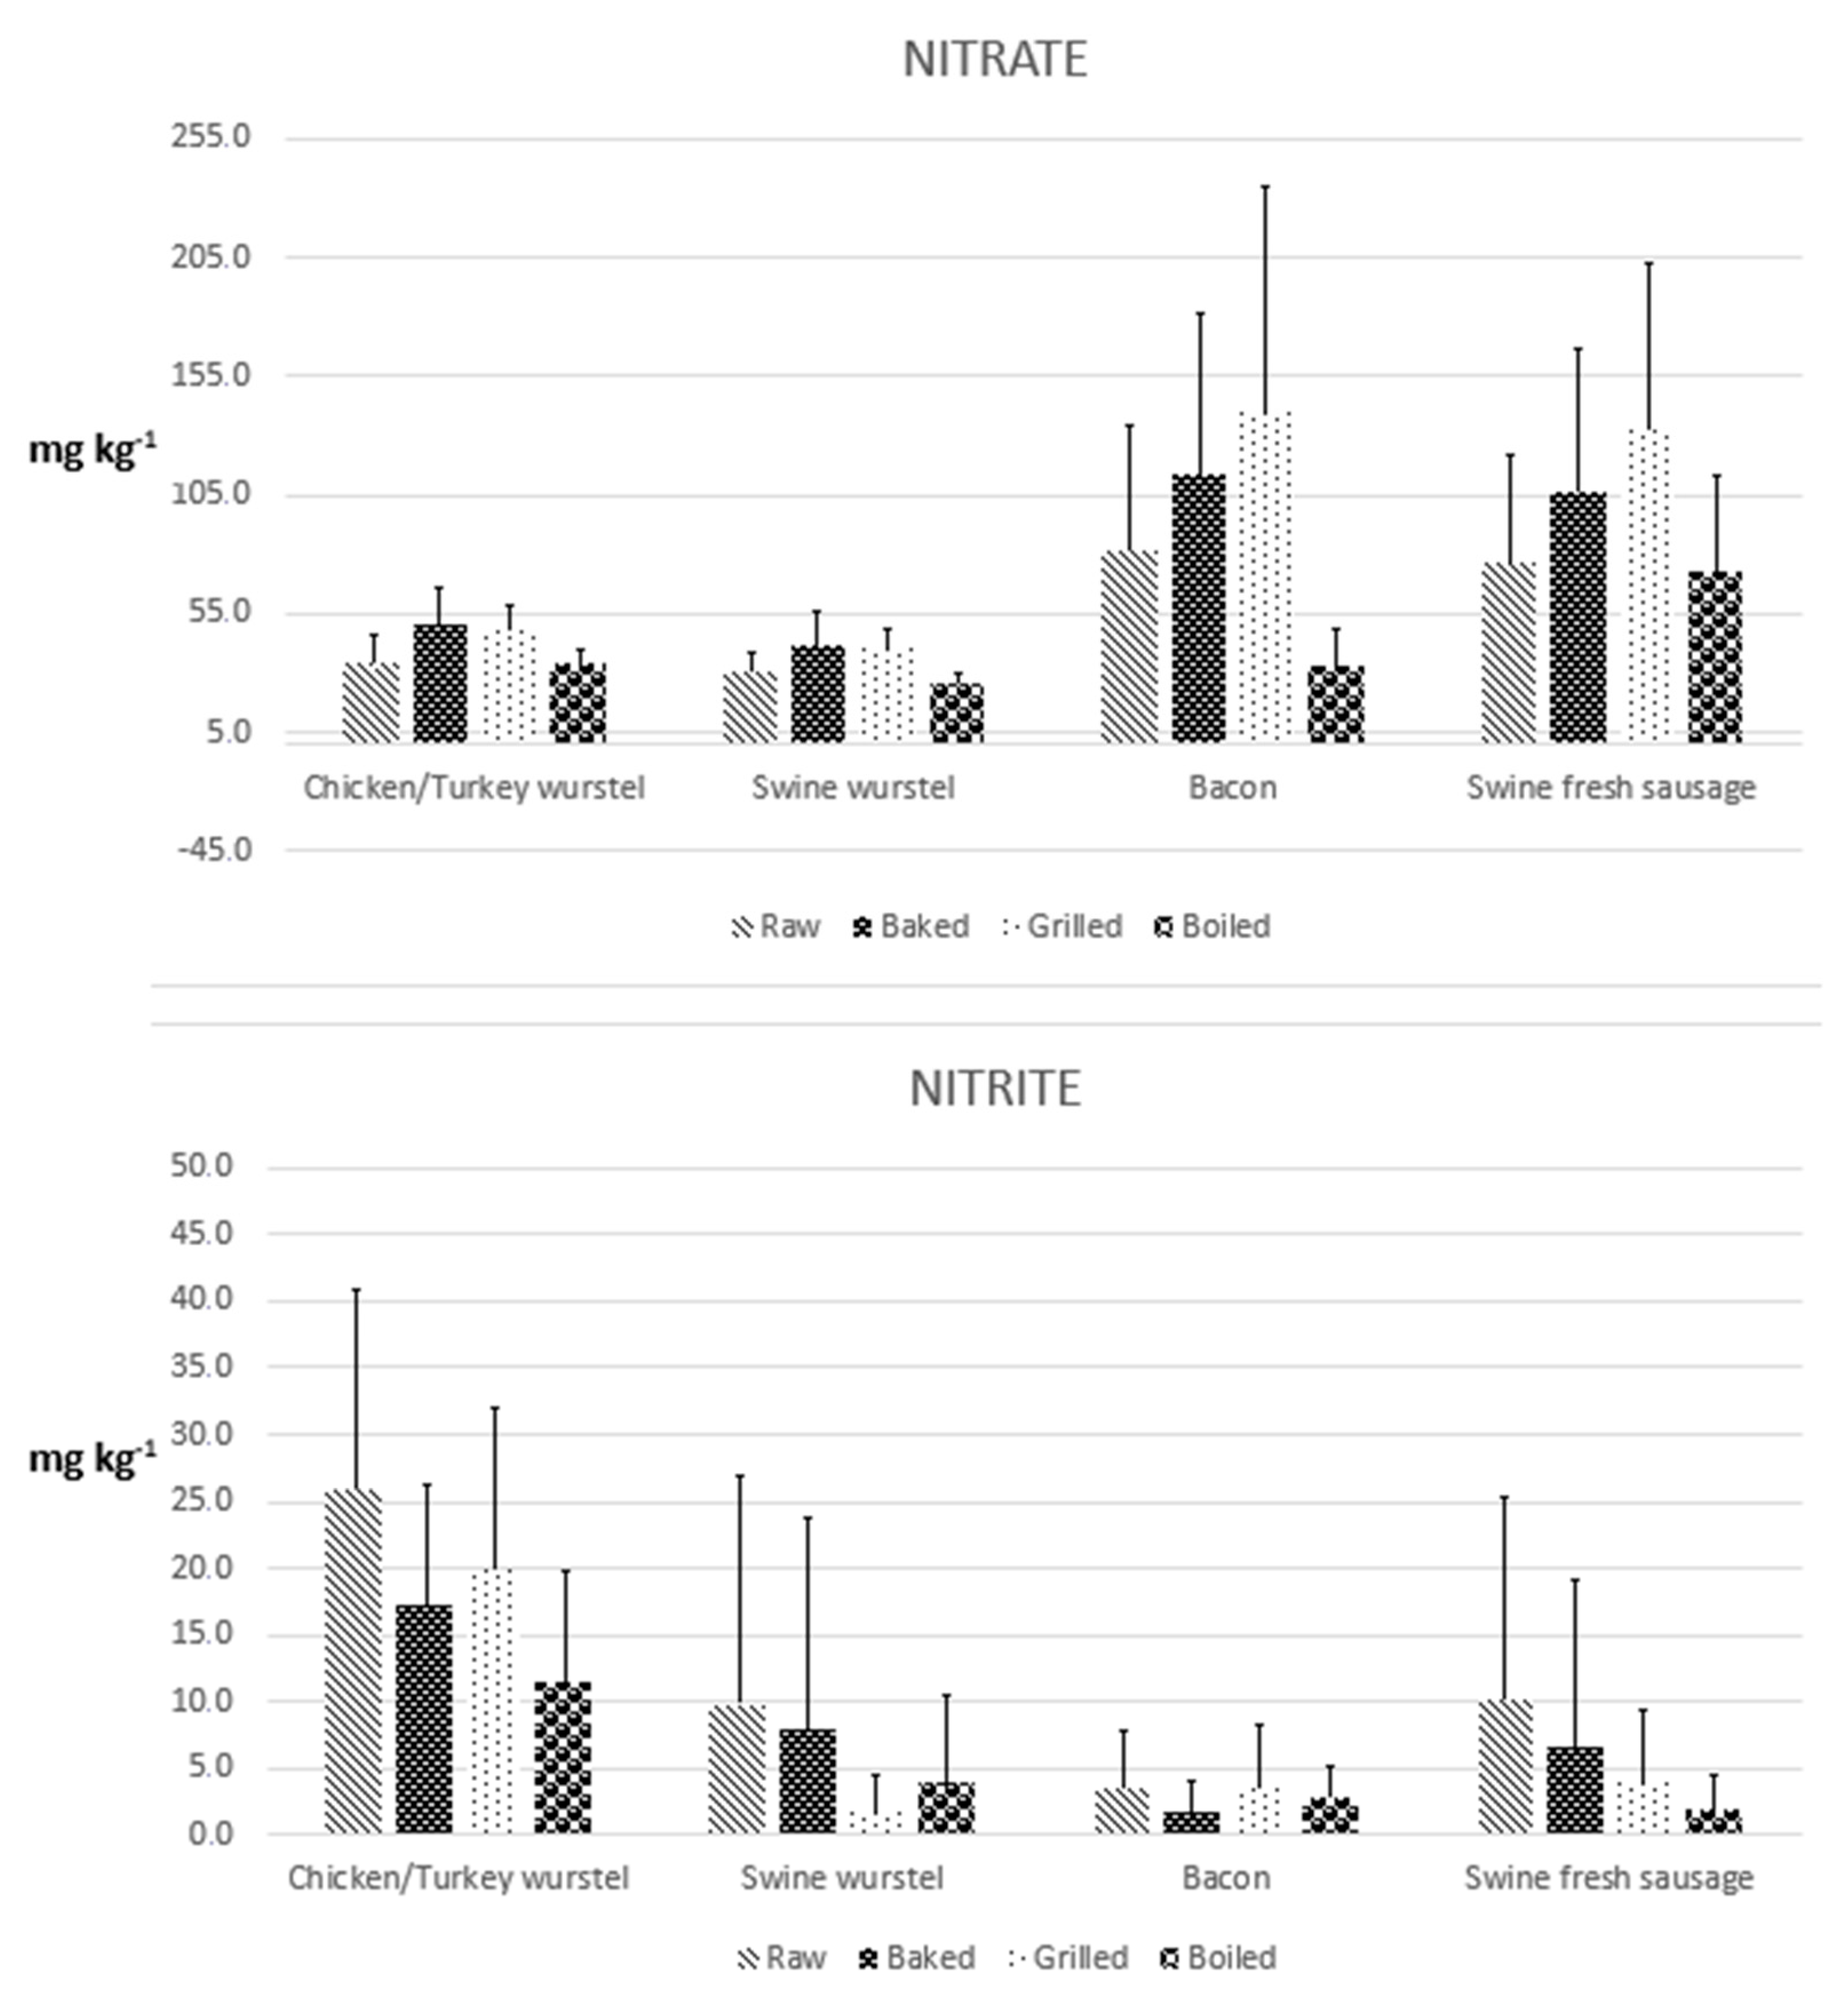
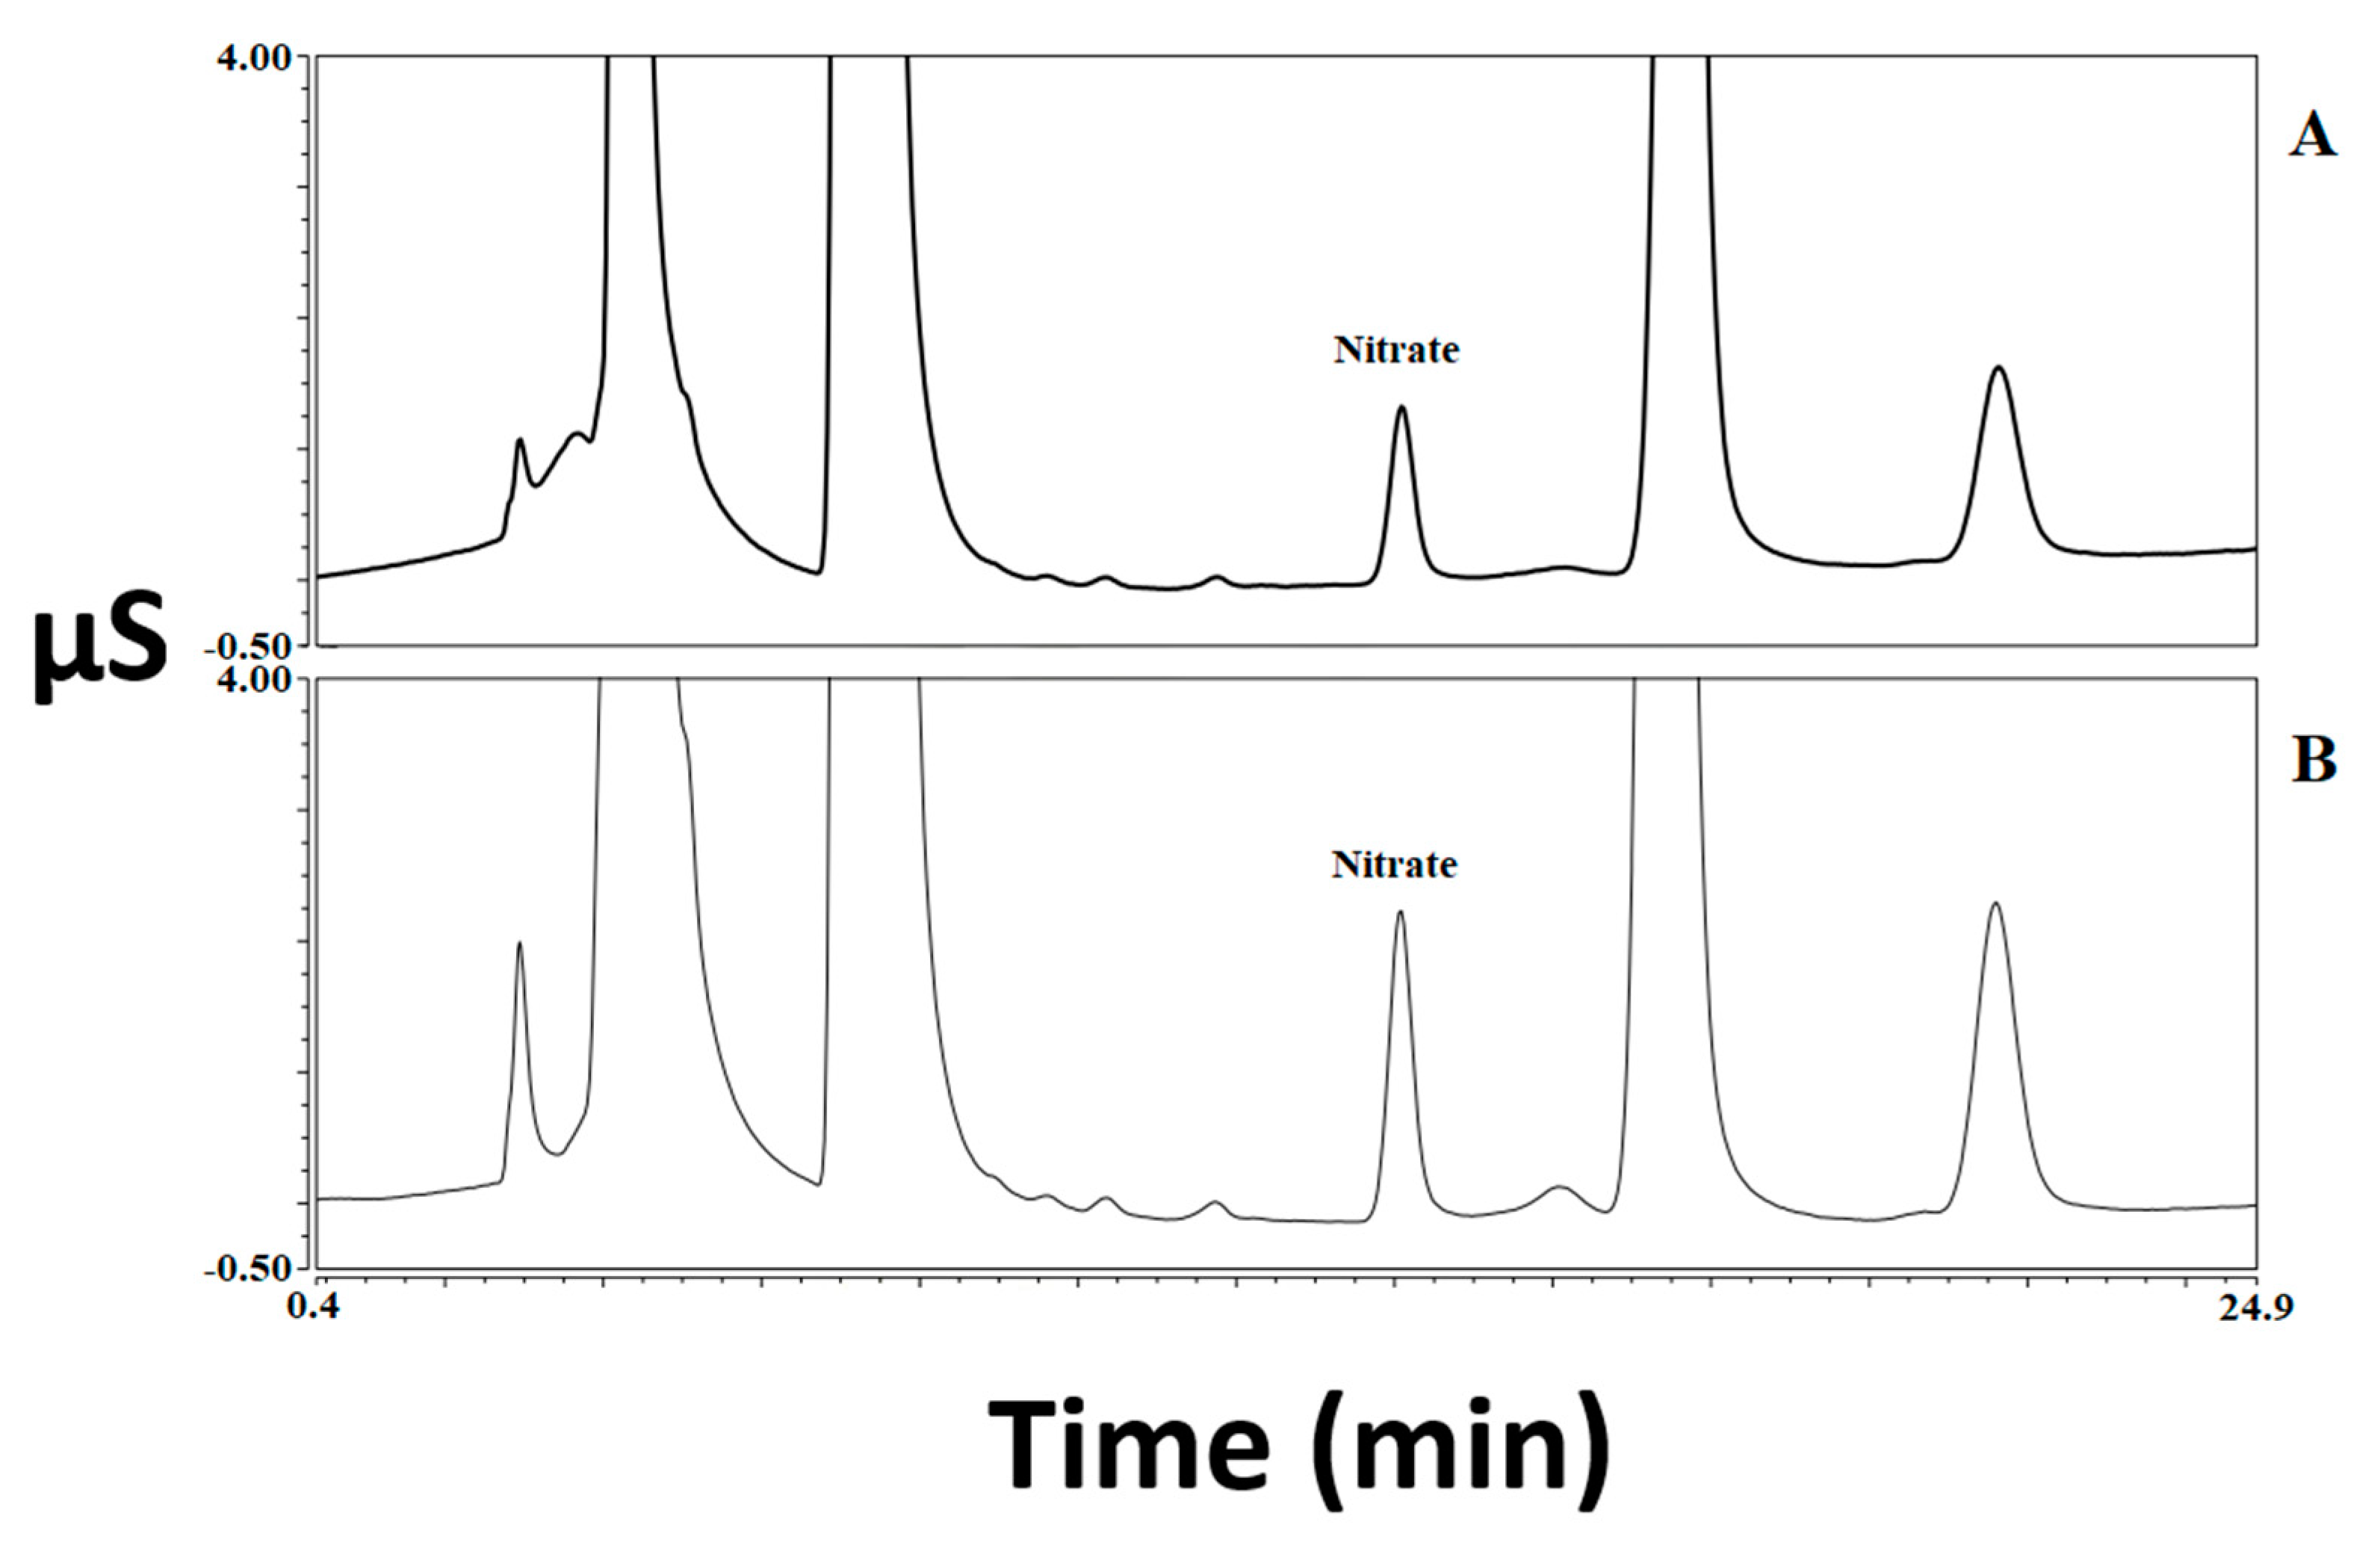
2.3. Apparatus and Ion Chromatography Method
2.4. Statistical Analysis
3. Results and Discussion
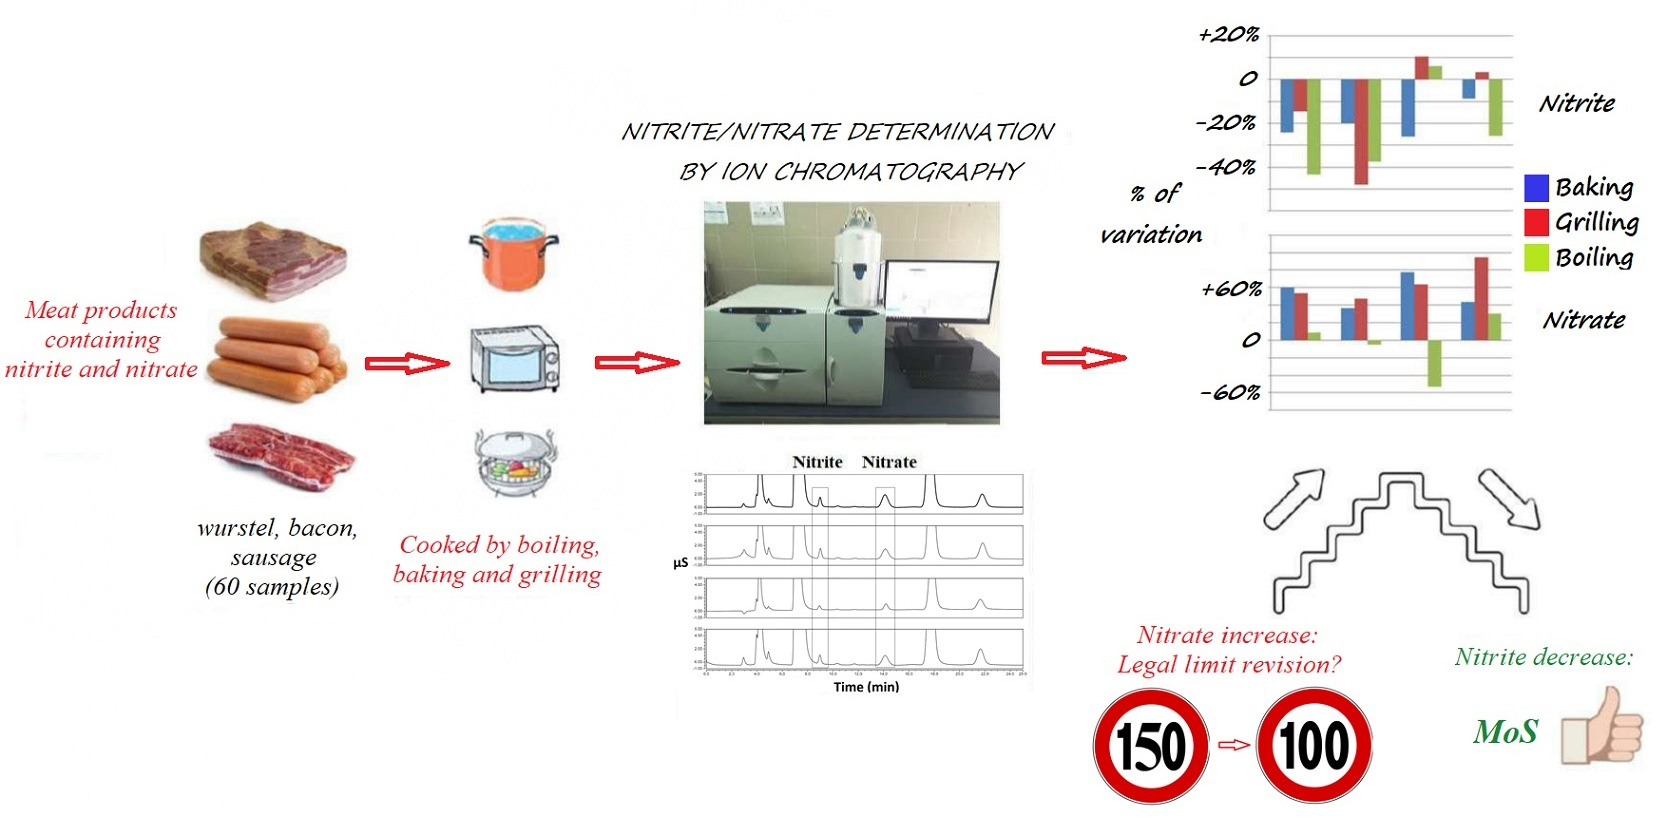
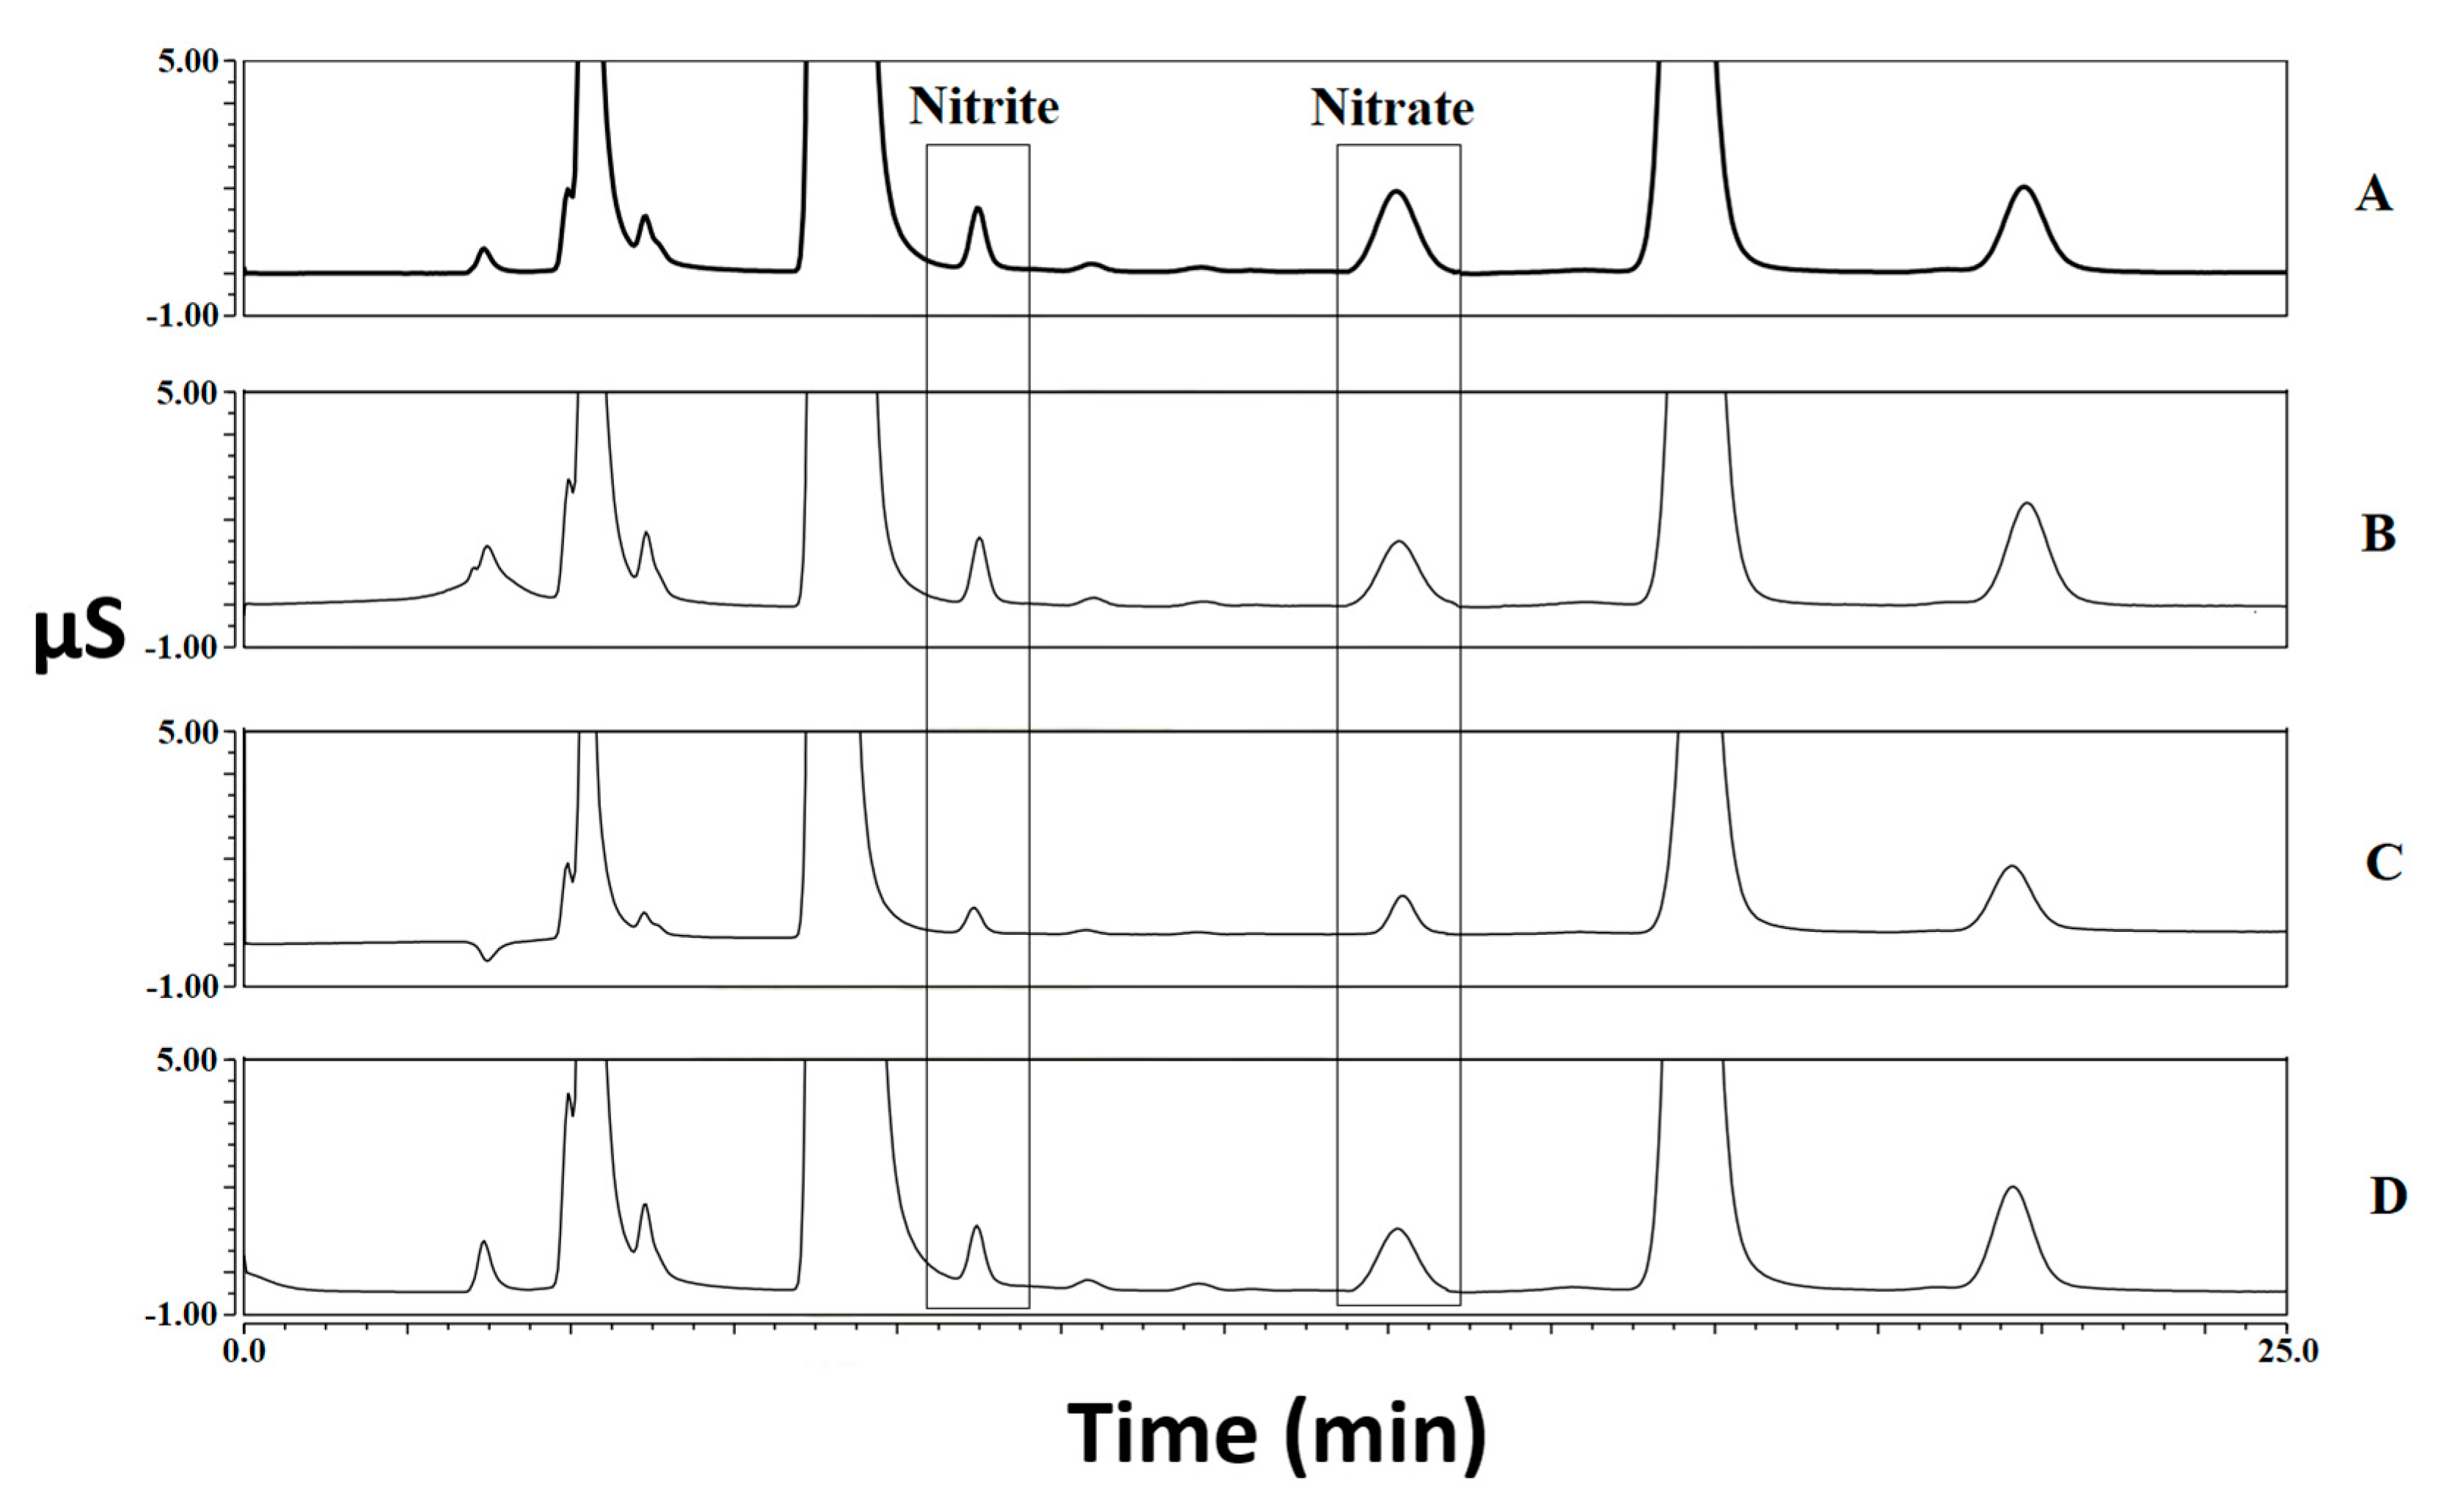
3.1. General Remarks
3.2. Margin of Safety (MoS) Assessment
3.3. Discussion and Regulatory Aspects
4. Conclusions
Author Contributions
Funding
Data Availability Statement
Acknowledgments
Conflicts of Interest
References
- Iammarino, M.; Di Taranto, A.; Cristino, M. Monitoring of nitrites and nitrates levels in leafy vegetables (spinach and lettuce): A contribution to risk assessment. J. Sci. Food Agric. 2014, 94, 773–778. [Google Scholar] [CrossRef] [PubMed]
- Iammarino, M.; Di Taranto, A.; Cristino, M. Endogenous levels of nitrites and nitrates in wide consumption foodstuffs: Results of five years of official controls and monitoring. Food Chem. 2013, 140, 763–771. [Google Scholar] [CrossRef] [PubMed]
- Iammarino, M.; Berardi, G.; Vita, V.; Elia, A.; Conversa, G.; Di Taranto, A. Determination of Nitrate and Nitrite in Swiss Chard (Beta vulgaris L. subsp. vulgaris) and Wild Rocket (Diplotaxis tenuifolia (L.) DC.) and Food Safety Evaluations. Foods 2022, 11, 2571. [Google Scholar] [CrossRef] [PubMed]
- European Commission. Regulation (EC) No 1333/2008 of the European Parliament and of the Council of 16 December 2008 on food additives. Off. J. Eur. Union 2008, L354, 16–33. [Google Scholar]
- Karwowska, M.; Kononiuk, A. Nitrates/nitrites in food—Risk for nitrosative stress and benefits. Antioxidants 2020, 9, 241. [Google Scholar] [CrossRef] [PubMed] [Green Version]
- Nummer, B.; Andress, E. Curing and Smoking Meats for Home Food Preservation Literature Review and Critical Preservation Points; The University of Georgia, Cooperative Extension Service: Athens, GA, USA, 2002. [Google Scholar]
- Food Standards Australia New Zealand. Survey of Nitrates and Nitrites in Food and Beverages in Australia; Food Standards Australia New Zealand: Canberra, Australia, 2011. Available online: https://www.foodstandards.gov.au/consumer/additives/nitrate/Documents/Survey%20of%20nitrates%20and%20nitrites.pdf (accessed on 28 December 2022).
- Iammarino, M.; Di Taranto, A. Nitrite and nitrate in fresh meats: A contribution to the estimation of admissible maximum limits to introduce in directive 95/2/EC. Int. J. Food Sci. Technol. 2012, 47, 1852–1858. [Google Scholar] [CrossRef]
- European Food Safety Authority. Re-evaluation of potassium nitrite (E 249) and sodium nitrite (E 250) as food additives. EFSA J. 2017, 15, 4786. [Google Scholar] [CrossRef]
- International Agency for Research on Cancer. IARC Monographs Evaluate Consumption of Red Meat and Processed Meat; IARC: Lyon, France, 2015; Available online: https://www.iarc.who.int/wp-content/uploads/2018/07/pr240_E.pdf (accessed on 28 December 2022).
- D’Amore, T.; Di Taranto, A.; Vita, V.; Berardi, G.; Iammarino, M. Development and validation of an analytical method for nitrite and nitrate determination in meat products by capillary ion chromatography (CIC). Food Anal. Method 2019, 12, 1813–1822. [Google Scholar] [CrossRef]
- National Research Council (US) Subcommittee on Nitrate and Nitrite in Drinking Water. Nitrate and Nitrite in Drinking Water; National Academies Press (US): Washington, DC, USA, 1995.
- National Health and Medical Research Council—HMRC, NRMMC. Australian Drinking Water Guidelines Paper 6 National Water Quality Management Strategy; National Health and Medical Research Council, National Resource Management Ministerial Council, Commonwealth of Australia: Canberra, Australia, 2011. Available online: https://www.nhmrc.gov.au/sites/default/files/documents/reports/aust-drinking-water-guidelines.pdf (accessed on 28 December 2022).
- Food and Agriculture Organization of the United Nations; World Health Organization. Discussion Paper on the Use of Nitrates (Ins 251, 252) and Nitrites (Ins 249, 250); FAO: Rome, Italy, 2016; Available online: https://www.fao.org/fao-who-codexalimentarius/sh-proxy/en/?lnk=1&url=https%253A%252F%252Fworkspace.fao.org%252Fsites%252Fcodex%252FMeetings%252FCX-711-49%252FWD%252Ffa49_11e.pdf (accessed on 28 December 2022).
- EFSA ANS Panel. Scientific Opinion on the re-evaluation of sodium nitrate (E 251) and potassium nitrate (E 252) as food additives. EFSA J. 2017, 15, 4787. [Google Scholar] [CrossRef]
- European Commission. Directive 2002/32/EC of the European Parliament and of the Council of 7 May 2002 on undesirable substances in animal feed. Off. J. Eur. Union 2002, L140, 10–21. [Google Scholar]
- European Commission. Commission Regulation (EU) No 1258/2011 of 2 December 2011 amending Regulation (EC) No 1881/2006 as regards maximum levels for nitrates in foodstuffs. Off. J. Eur. Union 2011, L320, 15–17. [Google Scholar]
- Norman, G.; Conley, M.N. Regulation of dietary nitrate and nitrite: Balancing essential physiological roles with potential health risks. In Nitrite and Nitrate in Human Health and Disease; Bryan, N.S., Loscalzo, J., Eds.; Humana Press: Totowa, NJ, USA, 2017; pp. 153–162. [Google Scholar]
- Pagliano, E.; Meija, J.; Campanella, B.; Onor, M.; Iammarino, M.; D’Amore, T.; Berardi, G.; D’Imperio, M.; Parente, A.; Mihai, O.; et al. Certification of nitrate in spinach powder reference material SPIN-1 by high-precision isotope dilution GC-MS. Anal. Bioanal. Chem. 2019, 411, 3435–3445. [Google Scholar] [CrossRef] [PubMed]
- Lundberg, J.O.; Weitzberg, E.; Gladwin, M.T. The nitrate-nitrite-nitric oxide pathway in physiology and therapeutics. Nat. Rev. Drug Discov. 2008, 7, 156–167. [Google Scholar] [CrossRef] [PubMed]
- Lundberg, J.O.; Weitzberg, E. NO-synthase independent NO generation in mammals. Biochem. Biophys. Res. Commun. 2010, 396, 39–45. [Google Scholar] [CrossRef]
- Koch, C.D.; Gladwin, M.T.; Freeman, B.A.; Lundberg, J.O.; Weitzberg, E.; Morris, A. Enterosalivary nitrate metabolism and the microbiome: Intersection of microbial metabolism, nitric oxide and diet in cardiac and pulmonary vascular health. Free Radic. Biol. Med. 2017, 105, 48–67. [Google Scholar] [CrossRef] [Green Version]
- EFSA Scientific Committee. Guidance on human health risk-benefit assessment of food. EFSA J. 2010, 8, 1673. [Google Scholar] [CrossRef]
- U.S. Food and Drug Administration. Total Diet Study Report; US FDA: Silver Spring, MD, USA, 2022. Available online: https://www.fda.gov/media/159745/download (accessed on 7 January 2023).
- Hong Kong Centre for Food Safety Food and Environmental Hygiene Department. The First Hong Kong Total Diet Study; Hong Kong Centre for Food Safety Food and Environmental Hygiene Department: Hong Kong, China, 2011. Available online: https://www.cfs.gov.hk/english/programme/programme_firm/files/1st_HKTDS_Report_e.pdf (accessed on 7 January 2023).
- European Food Safety Authority; Food and Agriculture Organization of the United Nations; World Health Organization. Towards a harmonised Total Diet Study approach: A guidance document. EFSA J. 2011, 9, 2450. [Google Scholar] [CrossRef]
- McMahon, N.F.; Brooker, P.G.; Pavey, T.G.; Leveritt, M.D. Nitrate, nitrite and nitrosamines in the global food supply. Crit. Rev. Food Sci. 2022, 1–22. [Google Scholar] [CrossRef]
- Berardi, G.; Di Taranto, A.; Vita, V.; Marseglia, C.; Iammarino, M. Effect of different cooking treatments on the residual level of sulphites in shrimps. Ital. J. Food Saf. 2022, 11, 10029. [Google Scholar] [CrossRef]
- Berardi, G.; Albenzio, M.; Marino, R.; D’Amore, T.; Di Taranto, A.; Vita, V.; Iammarino, M. Different use of nitrite and nitrate in meats: A survey on typical and commercial Italian products as a contribution to risk assessment. LWT 2021, 150, 112004. [Google Scholar] [CrossRef]
- ISO/CD 7158; Meat and Meat Products—Determination of Nitrite and Nitrate Content-Ion Chromatography Method. ISO: Geneva, Switzerland, 2022. Available online: https://www.iso.org/standard/82658.html (accessed on 7 January 2023).
- Iammarino, M. Simplified Guidelines for Chromatographic Methods Validation; LAP Lambert Academic Publishing: Riga, Latvia, 2019. [Google Scholar]
- Thompson, M.; Ellison, S.R.L.; Wood, R. Harmonized guidelines for single laboratory validation of methods of analysis. Pure Appl. Chem. 2002, 74, 835–855. [Google Scholar] [CrossRef]
- Miller, E.J.C.; Miller, J.N. Statistics for Analytical Chemistry, 3rd ed.; Ellis Horwood PTR Prentice Hall: New York, NY, USA, 1993. [Google Scholar]
- Youden, W.J.; Steiner, E.H. Statistical Manual of the AOAC; Association of the Official Analytical Chemists: Washington, DC, USA, 1975. [Google Scholar]
- Hund, E.; Massart, D.L.; Smeyers-Verbeke, J. Operational definitions of uncertainty. TrAC Trend. Anal. Chem. 2001, 20, 394–406. [Google Scholar] [CrossRef]
- European Parliament/Council of the European Union. Regulation (EU) 2017/625 of the European Parliament and of the Council of 15 March 2017. Off. J. Eur. Union 2017, L95, 1–142. [Google Scholar]
- European Commission. Commission Decision of 12 August 2002 implementing Council Directive 96/23/EC concerning the performance of analytical methods and the interpretation of results. Off. J. Eur. Union 2002, L221, 8–36. [Google Scholar]
- Menichini, E.; Viviano, G.; The Working Group Istituto Superiore di Sanità. Treatment of Data below the Detection Limit in the Calculation of Analytical Results—Rapporti ISTISAN 04/15; Istituto Superiore di Sanità: Rome, Italy, 2004. Available online: https://www.iss.it/documents/20126/955767/0415.1106219644.pdf/51c15924-7b63-07ca-cce4-9a37d772190d?t=1575578775857 (accessed on 7 January 2023).
- ChemSafetyPro. What Are Margin of Exposure (MOE) and Margin of Safety (MOS) and How to Calculate. 2019. Available online: https://www.chemsafetypro.com/Topics/CRA/margin_of_safety_MOS_margin_of_exposure_MOE_difference_chemical_risk_assessment.html (accessed on 7 January 2023).
- European Food Safety Authority. Guidance on selected default values to be used by the EFSA Scientific Committee, Scientific Panels and Units in the absence of actual measured data. EFSA J. 2012, 10, 2579. [Google Scholar] [CrossRef]
- European Food Safety Authority. Guidance of EFSA. Use of the EFSA Comprehensive European Food Consumption Database in Exposure Assessment. EFSA J. 2011, 9, 2097. [Google Scholar] [CrossRef]
- Leclercq, C.; Arcella, D.; Piccinelli, R.; Sette, S.; Le Donne, C.; Turrini, A. The Italian national food consumption survey INRAN-SCAI 2005-06: Main results in terms of food consumption. Public Health Nutr. 2009, 12, 2504–2532. [Google Scholar] [CrossRef] [Green Version]
- Merino, L.; Darnerud, P.O.; Toldrá, T.; Ilbäck, N.-G. Time-dependent depletion of nitrite in pork/beef and chicken meat products and its effect on nitrite intake estimation. Food Addit. Contam. Part A 2016, 33, 186–192. [Google Scholar] [CrossRef] [Green Version]
- Lee, J.G.; Kim, S.Y.; Moon, J.S.; Kim, S.H.; Kang, D.H.; Yoon, H.J. Effects of grilling procedures on levels of polycyclic aromatic hydrocarbons in grilled meats. Food Chem. 2016, 199, 632–638. [Google Scholar] [CrossRef]
- Smith, J.S.; Ameri, F.; Gadgil, P. Effect of marinades on the formation of heterocyclic amines in grilled beef steaks. J. Food Sci. 2008, 73, T100–T105. [Google Scholar] [CrossRef]
- Kocak, D.; Ozel, M.Z.; Gogus, F.; Hamilton, J.F.; Lewis, A.C. Determination of volatile nitrosamines in grilled lamb and vegetables using comprehensive gas chromatography—Nitrogen chemiluminescence detection. Food Chem. 2012, 135, 2215–2220. [Google Scholar] [CrossRef] [PubMed]
- Ferysiuk, K.; Wójciak, K.M. Reduction of nitrite in meat products through the application of various plant-based ingredients. Antioxidants 2020, 9, 711. [Google Scholar] [CrossRef] [PubMed]
- Herrmann, S.S.; Duedahl-Olesen, L.; Granby, K. Occurrence of volatile and non-volatile N-nitrosamines in processed meat products and the role of heat treatment. Food Control 2015, 48, 163–169. [Google Scholar] [CrossRef] [Green Version]


| Meat Product | Food Additives Declared on the Label | Nitrite (mg kg−1) | Nitrate (mg kg−1) | ||||||
|---|---|---|---|---|---|---|---|---|---|
| Raw | Baked | Grilled | Boiled | Raw | Baked | Grilled | Boiled | ||
| Chicken Wurstel | E407, E412, E450, E301, E250 | 34.5 | 36.6 | 38.0 | 36.6 | 40.2 | 45.8 | 47.6 | 43.6 |
| Chicken/Turkey Wurstel | E301, E250 | 65.7 | 21.8 | 22.0 | 13.2 | 20.2 | 32.1 | 39.5 | 31.1 |
| Chicken Wurstel | E301, E250 | 38.3 | 25.1 | 25.8 | 14.3 | 28.0 | 45.6 | 49.8 | 32.9 |
| Chicken/Turkey Wurstel | E301, E250 | 33.6 | 16.8 | 17.0 | 4.9 | 20.7 | 30.9 | 39.7 | 29.3 |
| Chicken Wurstel | E301, E250 | 25.4 | 17.2 | 20.0 | 11.0 | 35.0 | 51.1 | 48.1 | 33.7 |
| Chicken/Turkey Wurstel | E450, E452, E301, E250 | N.D. | N.D. | N.D. | N.D. | 32.1 | 45.1 | 35.0 | 33.5 |
| Chicken/Turkey Wurstel | E450, E451, E316, E250 | 11.0 | 12.8 | 15.2 | 12.8 | 28.1 | 47.3 | 57.3 | 47.6 |
| Chicken Wurstel | E301, E250 | 28.7 | 19.6 | 29.8 | 10.4 | 28.7 | 107.3 | 81.5 | 23.7 |
| Chicken Wurstel | E301, E250 | 39.5 | 31.7 | 46.2 | 21.8 | 89.1 | 75.5 | 78.5 | 43.0 |
| Chicken/Turkey Wurstel | E450, E452, E301, E250 | 13.7 | 8.9 | 11.2 | 6.0 | 33.6 | 39.3 | 34.6 | 28.2 |
| Chicken/Turkey Wurstel | E301, E250 | 29.1 | 23.6 | 27.7 | 11.7 | 31.5 | 33.7 | 42.2 | 23.7 |
| Chicken Wurstel | E301, E250 | 1.0 | 1.23 | 1.3 | 1.3 | 22.6 | 55.4 | 48.2 | 33.6 |
| Chicken Wurstel | E301, E250 | 25.9 | 17.5 | 20.5 | 11.6 | 34.9 | 51.0 | 48.0 | 34.1 |
| Chicken/Turkey Wurstel | E301, E250 | 16.1 | 7.6 | 2.2 | 2.1 | 36.0 | 51.9 | 25.0 | 38.7 |
| Chicken Wurstel | E301, E250 | 26.3 | 17.7 | 21.0 | 12.2 | 35.1 | 50.9 | 47.9 | 34.2 |
| Swine Wurstel | E316, E250 | 18.1 | 13.3 | 6.8 | 2.4 | 17.6 | 24.7 | 40.1 | 33.3 |
| Swine Wurstel | E301, E250 | 1.3 | 1.0 | N.D. | N.D. | 20.2 | 30.6 | 41.6 | 37.1 |
| Swine Wurstel | E301, E250 | 9.8 | 7.9 | 1.9 | 3.8 | 30.7 | 41.7 | 41.5 | 26.0 |
| Swine/Chicken Wurstel | E407, E412, E450, E301, E250 | 74.4 | 66.3 | N.D. | 30.6 | 56.5 | 93.6 | 66.3 | 33.7 |
| Swine Wurstel | E301, E250 | 1.7 | 2.1 | N.D. | 2.5 | 26.6 | 39.5 | 24.2 | 18.9 |
| Swine Wurstel | E301, E250 | 10.0 | 7.5 | 1.7 | 4.2 | 30.6 | 41.6 | 41.8 | 26.5 |
| Swine Wurstel | E301, E250 | 1.0 | N.D. | 1.3 | 1.1 | 30.4 | 81.3 | 42.9 | 12.1 |
| Swine Wurstel | E301, E250 | N.D. | 0.6 | N.D. | N.D. | 29.2 | 32.3 | 47.2 | 22.6 |
| Swine Wurstel | E301, E621, E450, E452, E250 | N.D. | N.D. | N.D. | N.D. | 38.1 | 52.5 | 40.8 | 33.7 |
| Swine Wurstel | E301, E250 | 1.8 | N.D. | 0.7 | 1.1 | 27.9 | 36.4 | 35.7 | 27.5 |
| Swine Wurstel | E331, E262, E301, E250 | 7.0 | 6.3 | 6.3 | 3.8 | 36.1 | 35.8 | 37.3 | 29.4 |
| Swine Wurstel | E301, E250 | 8.6 | 1.0 | 0.7 | 1.0 | 25.6 | 26.1 | 32.2 | 21.4 |
| Swine Wurstel | E301, E250 | 1.6 | 2.2 | 2.3 | 2.0 | 44.8 | 28.9 | 49.0 | 19.2 |
| Swine Wurstel | E301, E250 | 9.7 | 8.2 | 2.1 | 3.4 | 30.8 | 41.8 | 42.2 | 25.5 |
| Swine Wurstel | E301, E250, E252 | 0.9 | 0.7 | N.D. | N.D. | 15.7 | 19.1 | 45.4 | 24.7 |
| Bacon | E301, E250, E252 | N.D. | 0.6 | N.D. | N.D. | 33.5 | 68.3 | 62.9 | 21.2 |
| Bacon | E301, E250, E252 | 1.2 | N.D. | 3.0 | 1.9 | 107.2 | 190.6 | 185.5 | 42.1 |
| Bacon | E301, E250 | 12.4 | 6.7 | 4.5 | 6.6 | 46.0 | 31.4 | 28.7 | 9.0 |
| Bacon | E301, E250, E252 | 1.4 | N.D. | 2.0 | 1.9 | 145.5 | 205.3 | 204.8 | 47.7 |
| Bacon | E301, E252, E250 | N.D. | N.D. | N.D. | N.D. | 128.7 | 132.5 | 244.3 | 28.1 |
| Bacon | E301, E252, E250 | N.D. | N.D. | N.D. | 0.6 | 150.8 | 147.3 | 293.8 | 52.4 |
| Bacon | E301, E250, E252 | 3.3 | 2.2 | 3.5 | 3.1 | 80.9 | 114.5 | 140.0 | 31.0 |
| Bacon | E250 | N.D. | N.D. | N.D. | 0.6 | 116.9 | 253.4 | 263.3 | 58.5 |
| Bacon | E301, E252, E250 | N.D. | N.D. | N.D. | N.D. | 135.8 | 150.2 | 185.4 | 51.2 |
| Bacon | E250 | 9.4 | 8.7 | 10.0 | 12.1 | 21.9 | 15.7 | 22.9 | 12.1 |
| Bacon | E301, E250, E252 | 3.7 | 1.8 | 3.9 | 2.7 | 81.6 | 113.7 | 150.0 | 60.2 |
| Bacon | E301, E250, E252 | 3.8 | N.D. | 2.1 | 0.9 | 13.7 | 113.4 | 13.4 | 14.4 |
| Bacon | E301, E250, E252 | 3.5 | 2.0 | 3.7 | 2.9 | 81.3 | 114.1 | 140.5 | 30.6 |
| Bacon | E301, E250, E252 | 12.9 | N.D. | 19.1 | 5.9 | 24.1 | 46.1 | 28.9 | 16.2 |
| Bacon | E301, E250, E252 | N.D. | 0.6 | N.D. | 0.6 | 52.0 | 16.0 | 151.7 | 14.6 |
| Swine Sausage | E301, E250, E252 | 8.0 | N.D. | 15.0 | 9.3 | 30.7 | 19.8 | 67.6 | 35.8 |
| Swine Sausage | E301, E250, E252 | 7.6 | 12.2 | 13.7 | 2.1 | 45.7 | 53.3 | 104.1 | 33.7 |
| Swine Sausage | E301, E250, E252 | 6.8 | 9.3 | 12.9 | 6.5 | 44.5 | 46.9 | 73.3 | 34.2 |
| Swine Sausage | E301, E250, E252 | 1.8 | 2.5 | 2.5 | 2.7 | 63.8 | 105.9 | 137.1 | 56.8 |
| Swine Sausage | E301, E250, E252 | N.D. | N.D. | 0.6 | 0.6 | 135.9 | 206.8 | 230.6 | 105.2 |
| Swine Sausage | E301, E250, E252 | N.D. | N.D. | 0.6 | N.D. | 134.6 | 194.7 | 233.6 | 95.2 |
| Swine Sausage | E300, E301, E250, E252 | 48.6 | N.D. | N.D. | N.D. | 5.8 | 11.1 | 18.1 | 22.2 |
| Swine Sausage | E300, E301, E250, E252 | 46.7 | 49.4 | N.D. | N.D. | 5.3 | 13.2 | 13.7 | 18.9 |
| Swine Sausage | E300, E301, E250, E252 | 9.6 | 7.6 | 3.9 | 2.0 | 75.2 | 106.6 | 134.5 | 73.9 |
| Swine Sausage | E300, E301, E250, E252 | N.D. | N.D. | N.D. | N.D. | 108.4 | 150.2 | 157.3 | 92.4 |
| Swine Sausage | E300, E301, E250, E252 | 10.5 | 7.2 | 4.0 | 1.7 | 76.0 | 105.5 | 135.5 | 73.0 |
| Swine Sausage | E301, E331, E250, E252 | N.D. | N.D. | N.D. | N.D. | 121.2 | 162.0 | 195.6 | 138.7 |
| Swine Sausage | E301, E331, E250, E252 | 10.1 | 7.4 | 4.1 | 1.9 | 76.6 | 106.1 | 134.0 | 73.4 |
| Swine Sausage | E301, E331, E250, E252 | N.D. | N.D. | N.D. | N.D. | 120.5 | 159.0 | 200.1 | 146.1 |
| Swine Sausage | E301, E331, E250, E252 | N.D. | N.D. | N.D. | N.D. | 103.4 | 150.7 | 176.2 | 102.3 |
| Sample Type | N° of Samples Analyzed | N° of Brands Analyzed | Food Preservatives Declared on the Label | N° of Samples with [NO2−] < LoQ a | [NaNO2] (mg kg−1) [Range] (Mean) (Raw Sample) | [NaNO3] (mg kg−1) [Range] (Mean) (Raw Sample) | Mean Variation % [NaNO2] after Baking | Mean Variation % [NaNO2] after Grilling | Mean Variation % [NaNO2] after Boiling | Mean Variation % [NaNO3] after Baking | Mean Variation % [NaNO3] after Grilling | Mean Variation % [NaNO3] after Boiling |
|---|---|---|---|---|---|---|---|---|---|---|---|---|
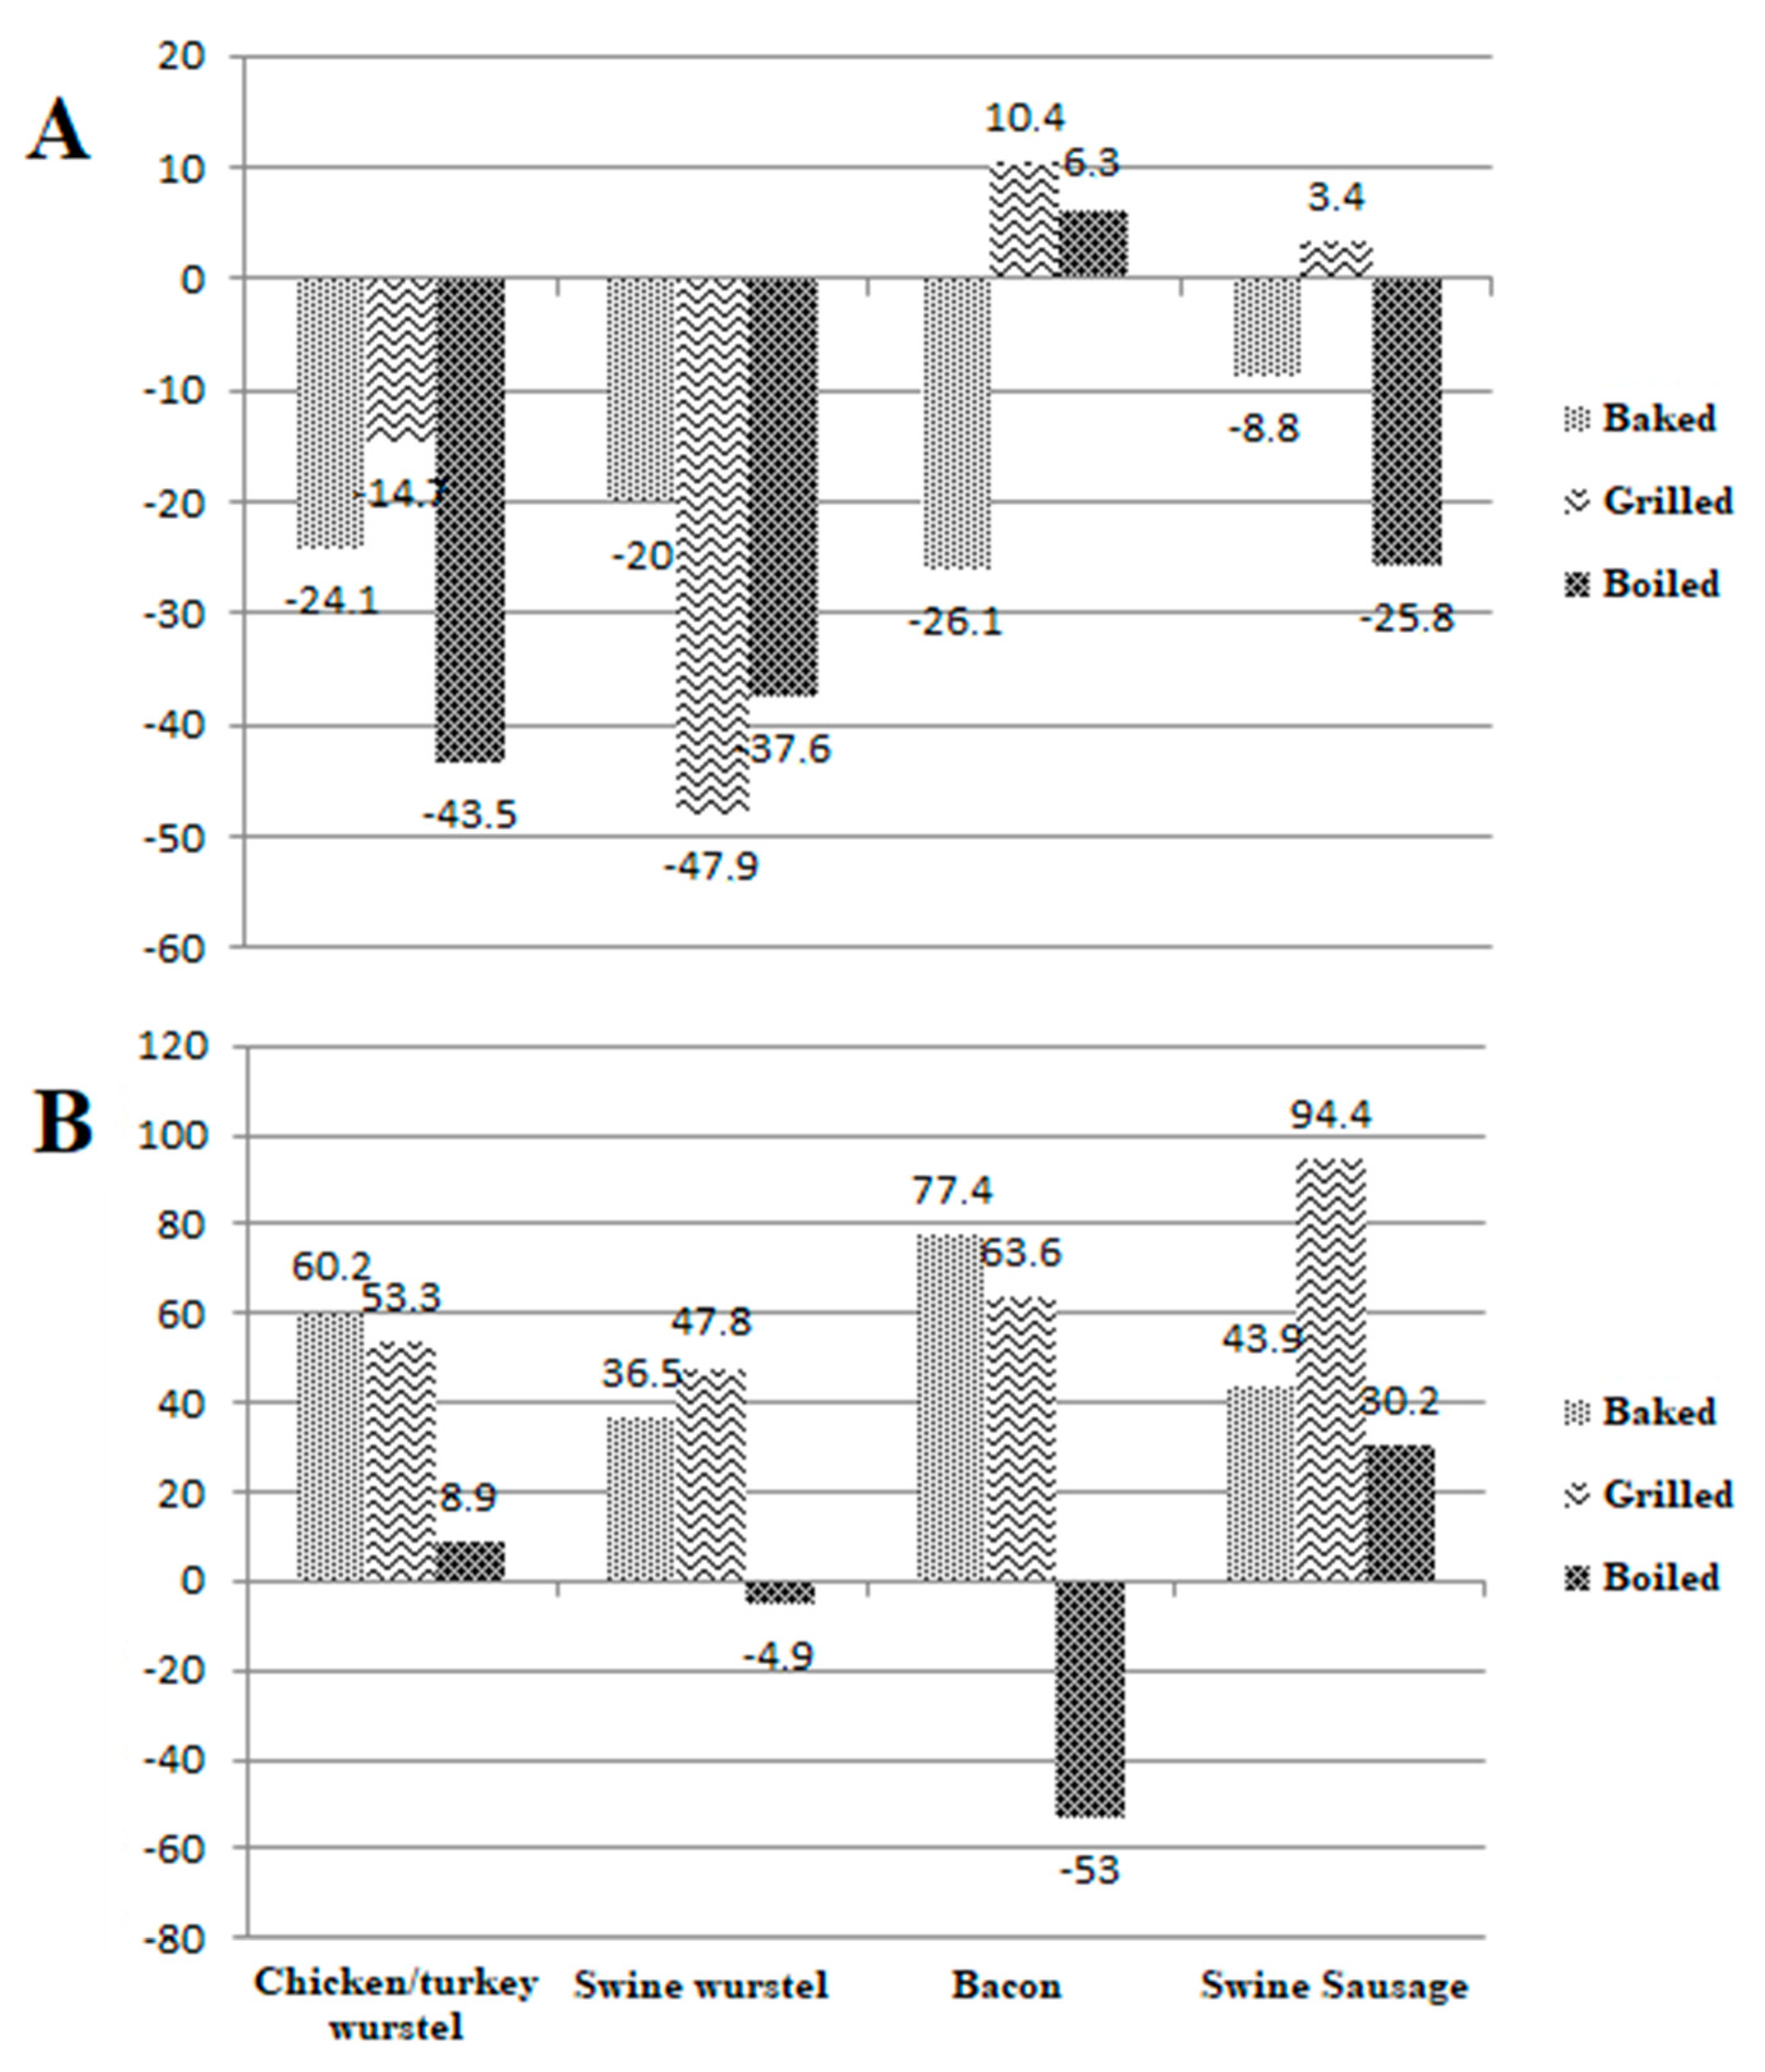
| Chicken/Turkey Wurstel | 15 | 10 | E250 | 1 | [1.0–65.7] (25.9) | [20.2–89.1] (34.4) | −24.1 | −14.7 | −43.5* | +60.2 ** | +53.3 ** | +8.9 |
| Swine Wurstel | 15 | 10 | E250 | 2 | [0.9–74.4] (9.8) | [15.7–56.5] (30.7) | −20.0 | −47.9 | −37.6 | +36.5 | +47.8 | −4.9 |
| Bacon | 15 | 10 | E250 + E252 (10) E250 (5) | 6 | [1.2–12.9] (3.6) | [13.7–150.8] (81.3) | −26.1 | +10.4 | +6.3 | +77.4 | +63.6 ** | −53.0 *** |
| Swine Fresh Sausage | 15 | 3 | E250 | 6 | [1.8–48.6] (10.1) | [5.3–135.9] (76.5) | −8.8 | +3.4 | −25.8 * | +43.9 * | +94.4 ** | +30.2 |
| Raw | Baked | Grilled | Boiled | ||
|---|---|---|---|---|---|
| Nitrite | Chicken wurstel | 545 (0.18) | 986 (0.10) | 774 (0.13) | 986 |
| Swine wurstel | 503 (0.20) | 567 (0.18) | 5538 (0.02) | 1229 | |
| Bacon | 2927 (0.03) | 4337 (0.02) | 1962 (0.05) | 3117 | |
| Swine fresh sausage | 771 (0.13) | 760 (0.13) | 2509 (0.04) | 4045 | |
| Mean MoS | 1186 (0.14) | 1662 (0.11) | 2696 (0.06) | 2344 | |
| Nitrate | Chicken wurstel | 24,944 (0.004) | 20,690 (0.005) | 27,239 (0.004) | 46,737 |
| Swine wurstel | 44,400 (0.002) | 24,804 (0.004) | 34,961 (0.003) | 62,535 | |
| Bacon | 15,417 (0.006) | 11,327 (0.009) | 7914 (0.013) | 38,676 | |
| Swine fresh sausage | 17,103 (0.006) | 11,235 (0.009) | 9951 (0.010) | 15,868 | |
| Mean MoS | 25,466 (0.005) | 17,014 (0.007) | 20,016 (0.008) | 40,954 | |
Disclaimer/Publisher’s Note: The statements, opinions and data contained in all publications are solely those of the individual author(s) and contributor(s) and not of MDPI and/or the editor(s). MDPI and/or the editor(s) disclaim responsibility for any injury to people or property resulting from any ideas, methods, instructions or products referred to in the content. |
© 2023 by the authors. Licensee MDPI, Basel, Switzerland. This article is an open access article distributed under the terms and conditions of the Creative Commons Attribution (CC BY) license (https://creativecommons.org/licenses/by/4.0/).
Share and Cite
Iammarino, M.; Berardi, G.; Tomasevic, I.; Nardelli, V. Effect of Different Cooking Treatments on the Residual Level of Nitrite and Nitrate in Processed Meat Products and Margin of Safety (MoS) Assessment. Foods 2023, 12, 869. https://doi.org/10.3390/foods12040869
Iammarino M, Berardi G, Tomasevic I, Nardelli V. Effect of Different Cooking Treatments on the Residual Level of Nitrite and Nitrate in Processed Meat Products and Margin of Safety (MoS) Assessment. Foods. 2023; 12(4):869. https://doi.org/10.3390/foods12040869
Chicago/Turabian StyleIammarino, Marco, Giovanna Berardi, Igor Tomasevic, and Valeria Nardelli. 2023. "Effect of Different Cooking Treatments on the Residual Level of Nitrite and Nitrate in Processed Meat Products and Margin of Safety (MoS) Assessment" Foods 12, no. 4: 869. https://doi.org/10.3390/foods12040869