
Effect of Variety and Maturity Index on the Physicochemical Parameters Related to Virgin Olive Oil from Wudu (China)
Abstract
:1. Introduction
2. Materials and Methods
2.1. Chemical Reagents
2.2. Area of Study
2.3. Olive Collection and Analysis
2.4. Abencor Yield and Extractability Index of VOO Extraction
2.5. VOO Sample Analyses
2.5.1. FAs Composition
2.5.2. Phenolic Compositions
2.5.3. Oxidative Stability
2.6. Statistical Analysis
3. Results and Discussion
3.1. Maturity Index
3.2. Physicochemical Parameters Analysis
3.2.1. VOO Physical Characteristics Analysis
3.2.2. VOO Quality Characteristics Analysis
FAs Composition
Phenolic Composition
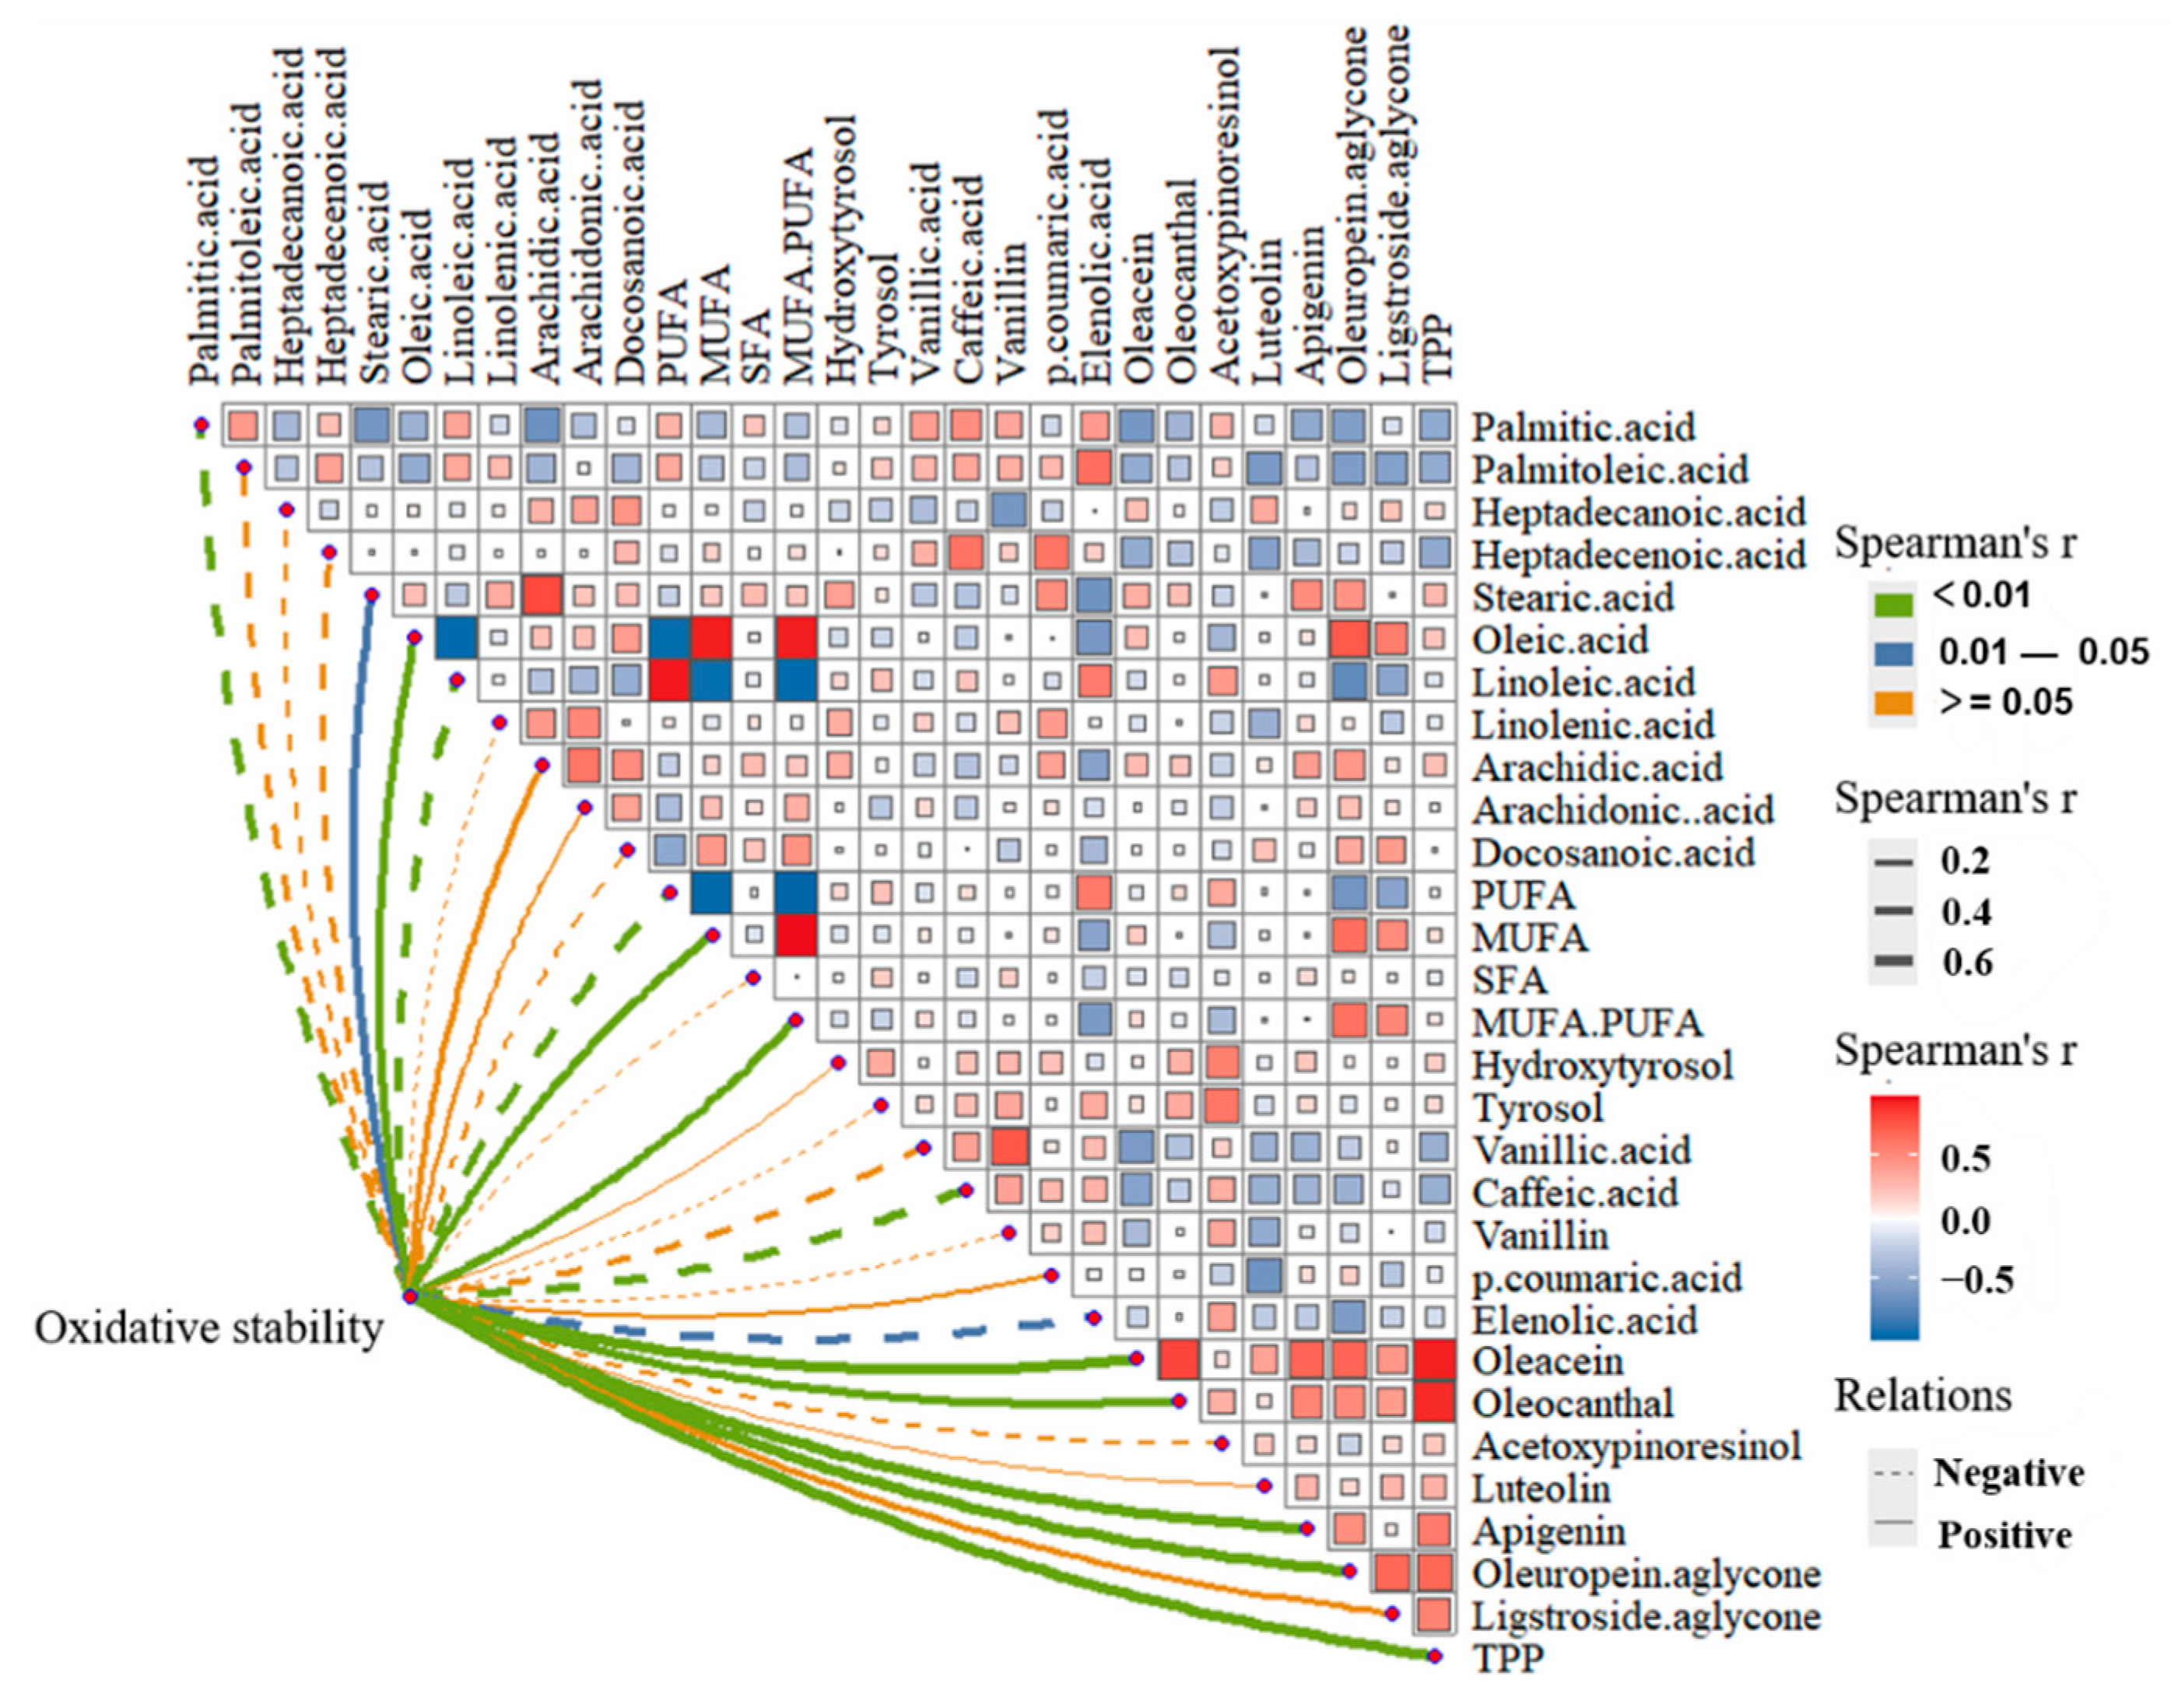
Oxidative Stability
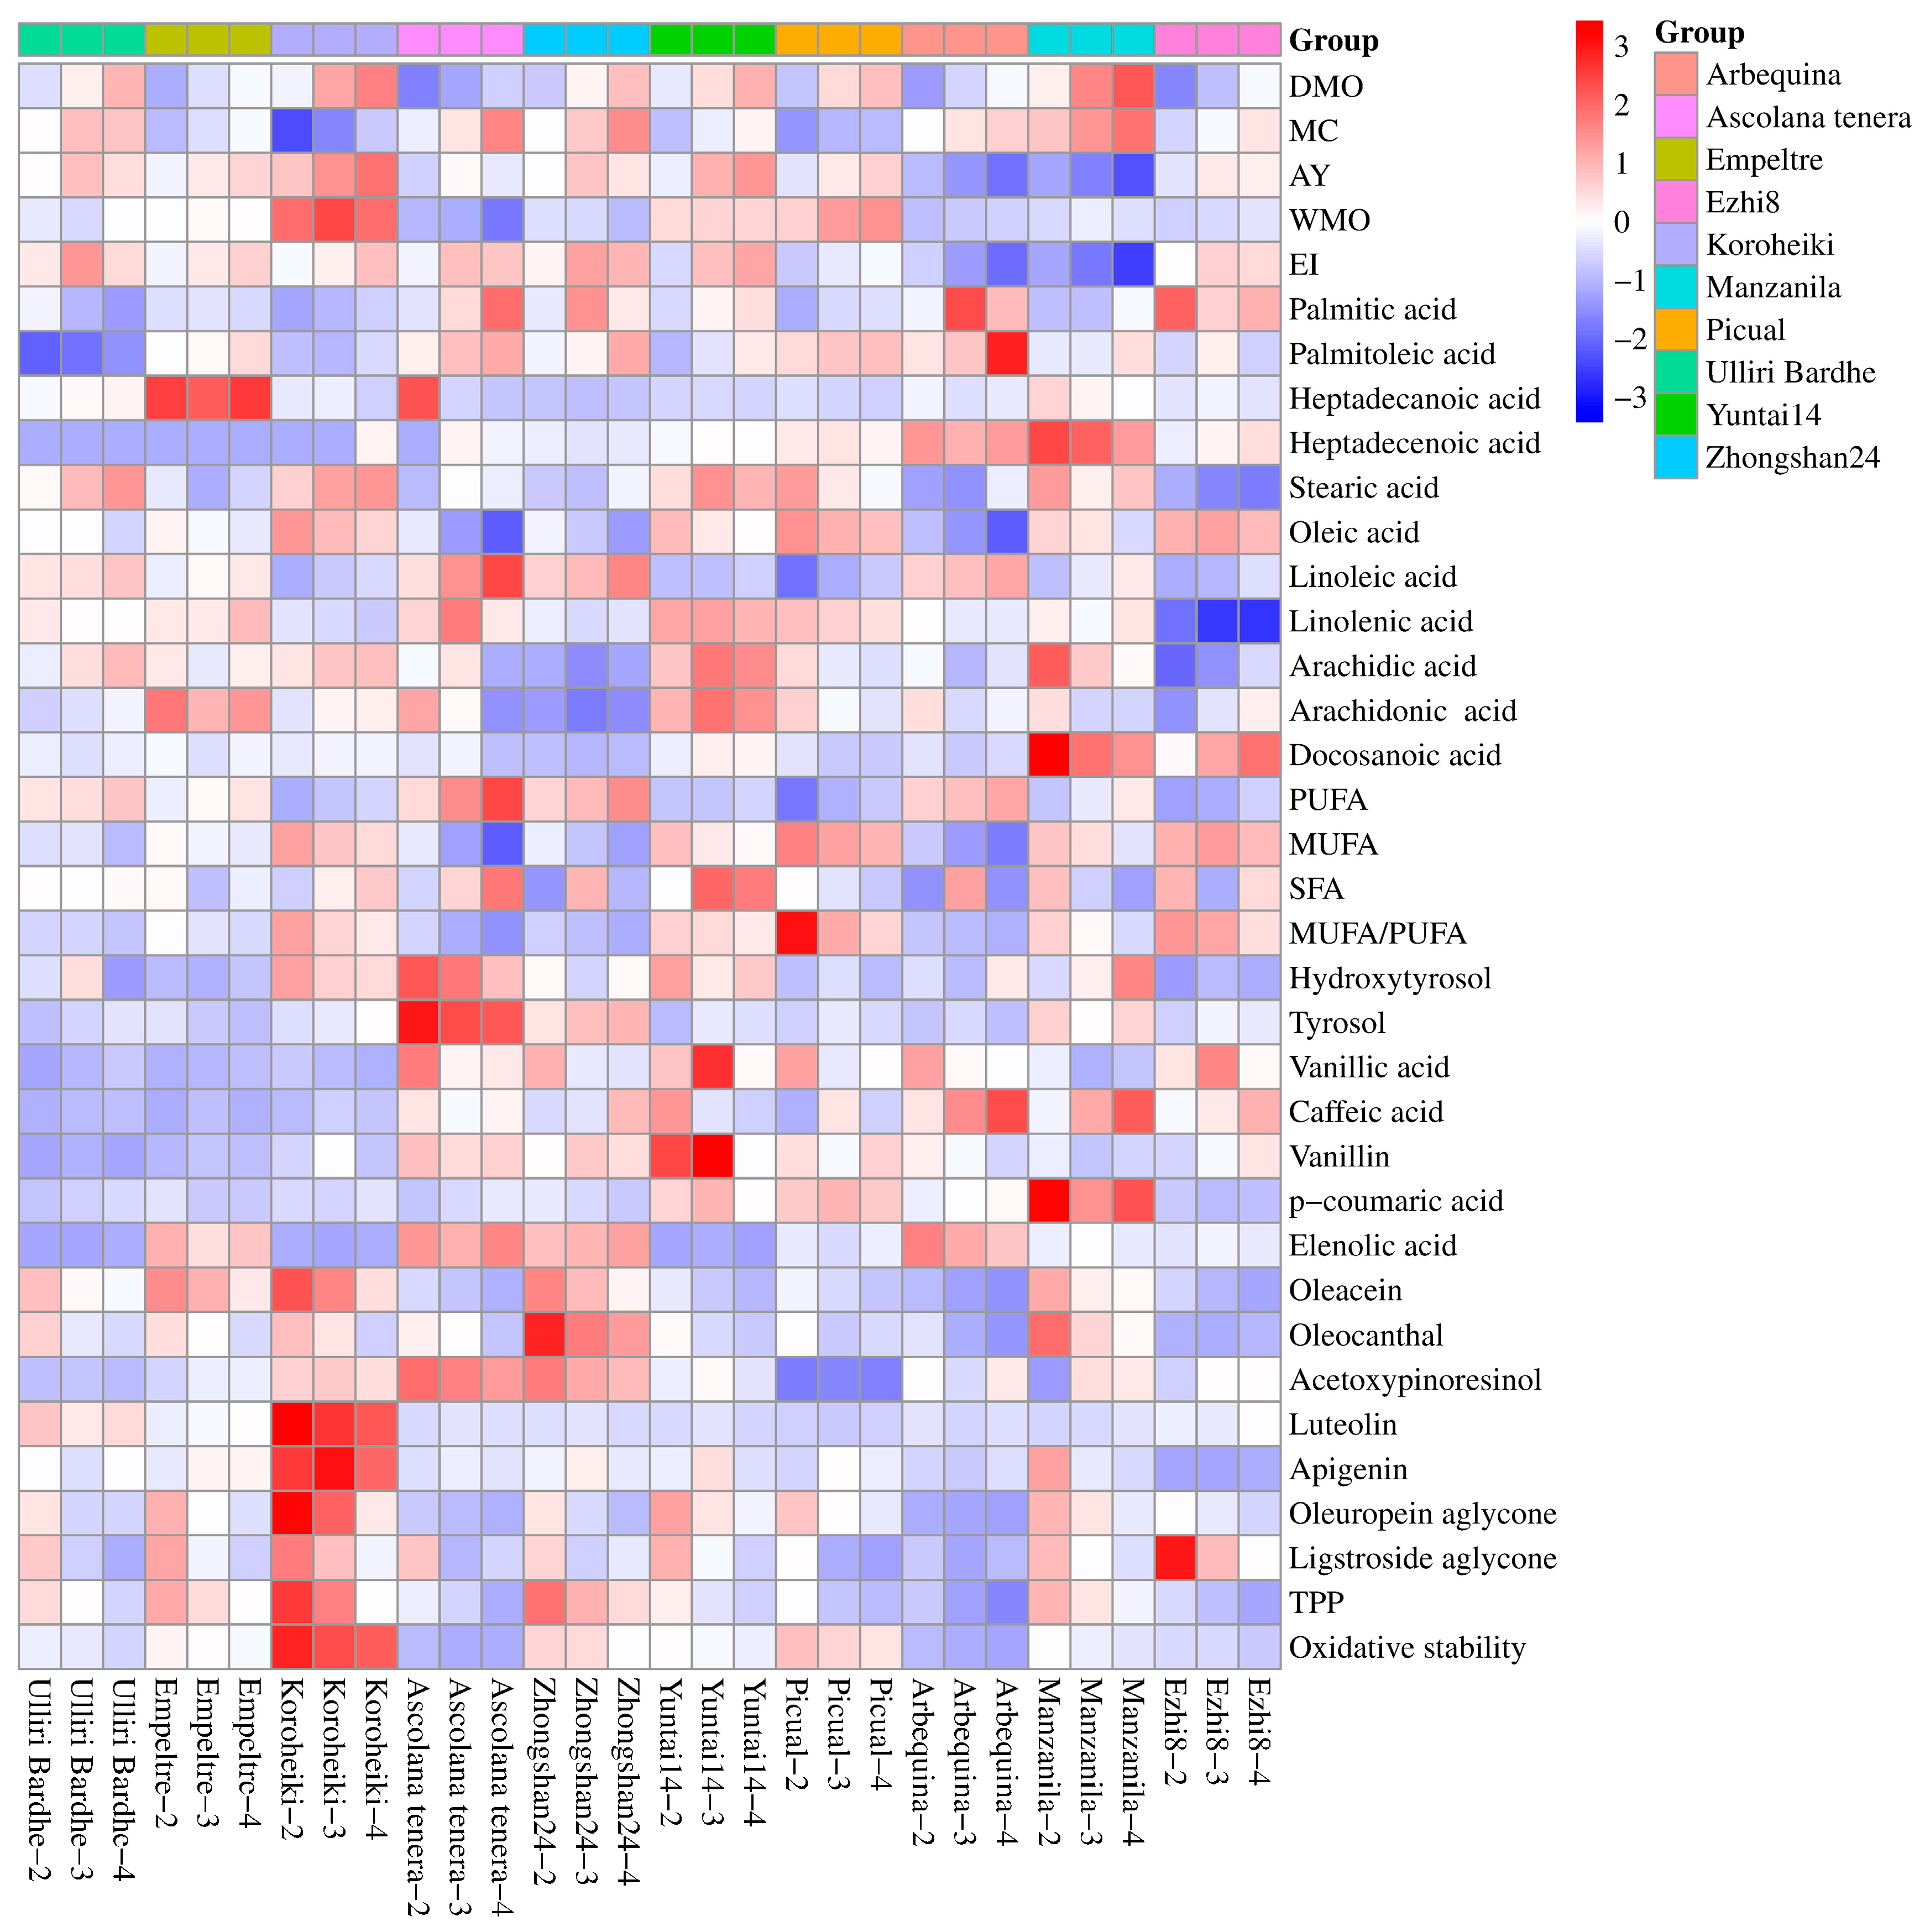
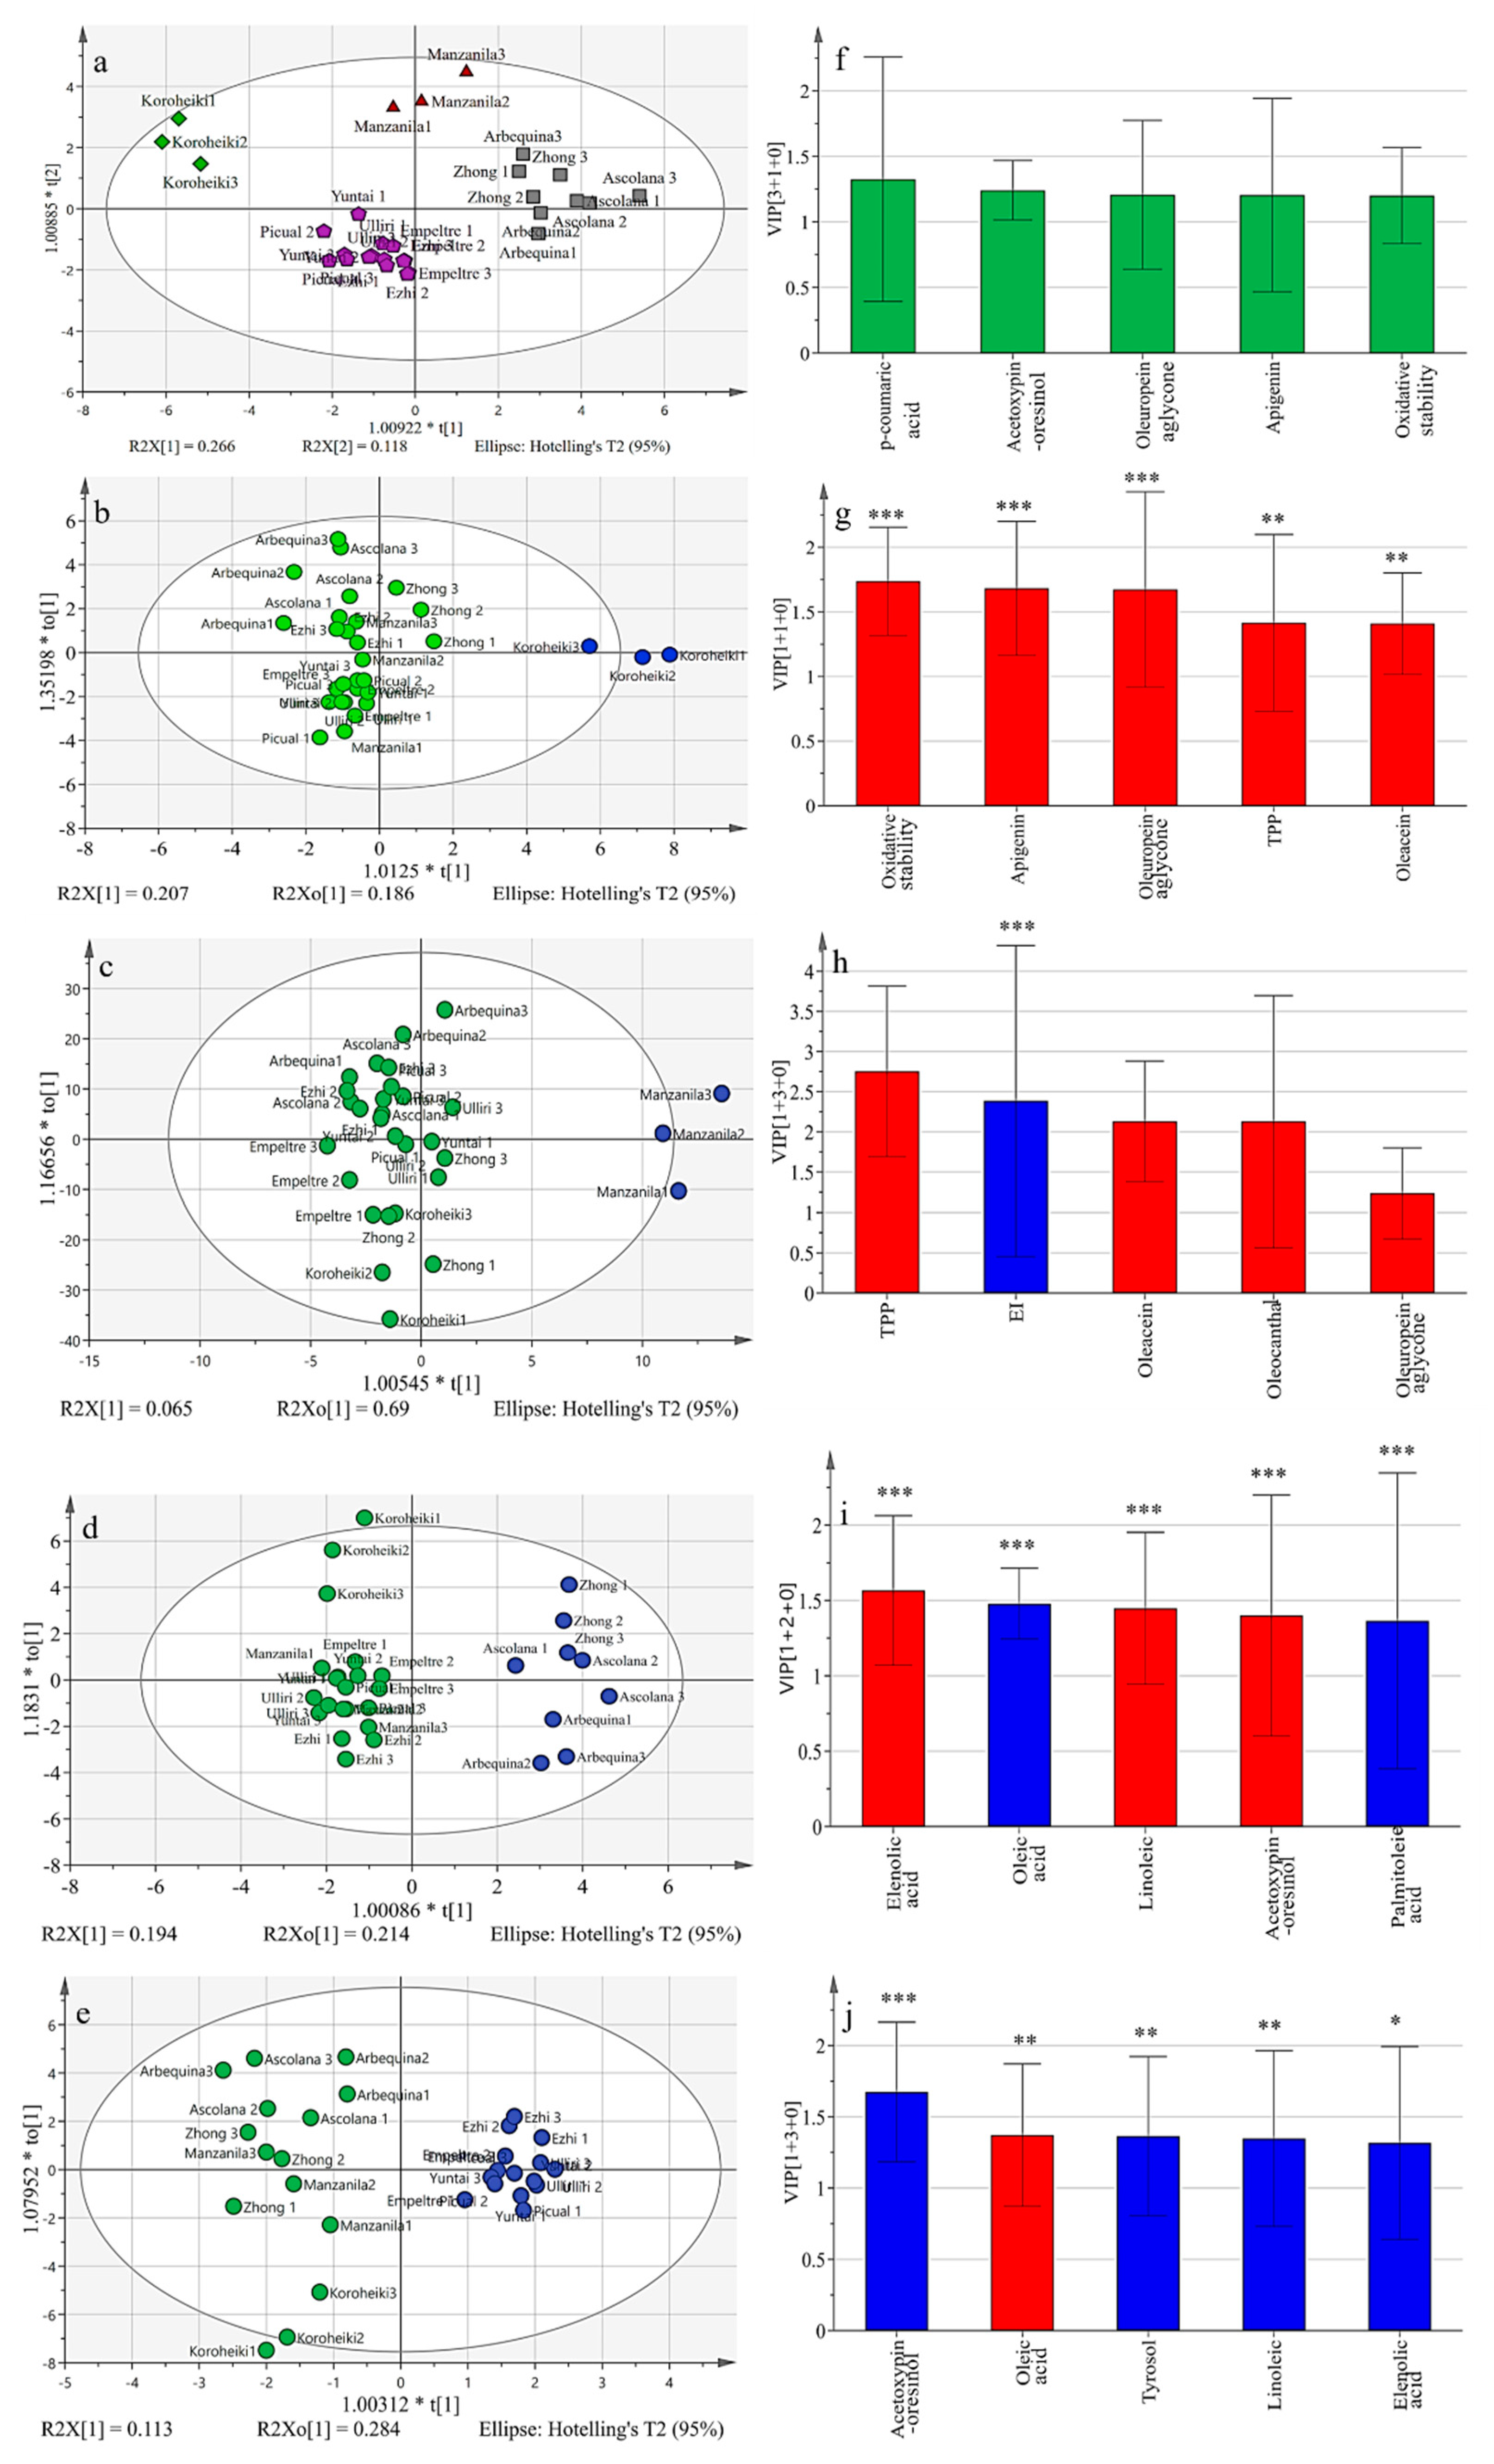
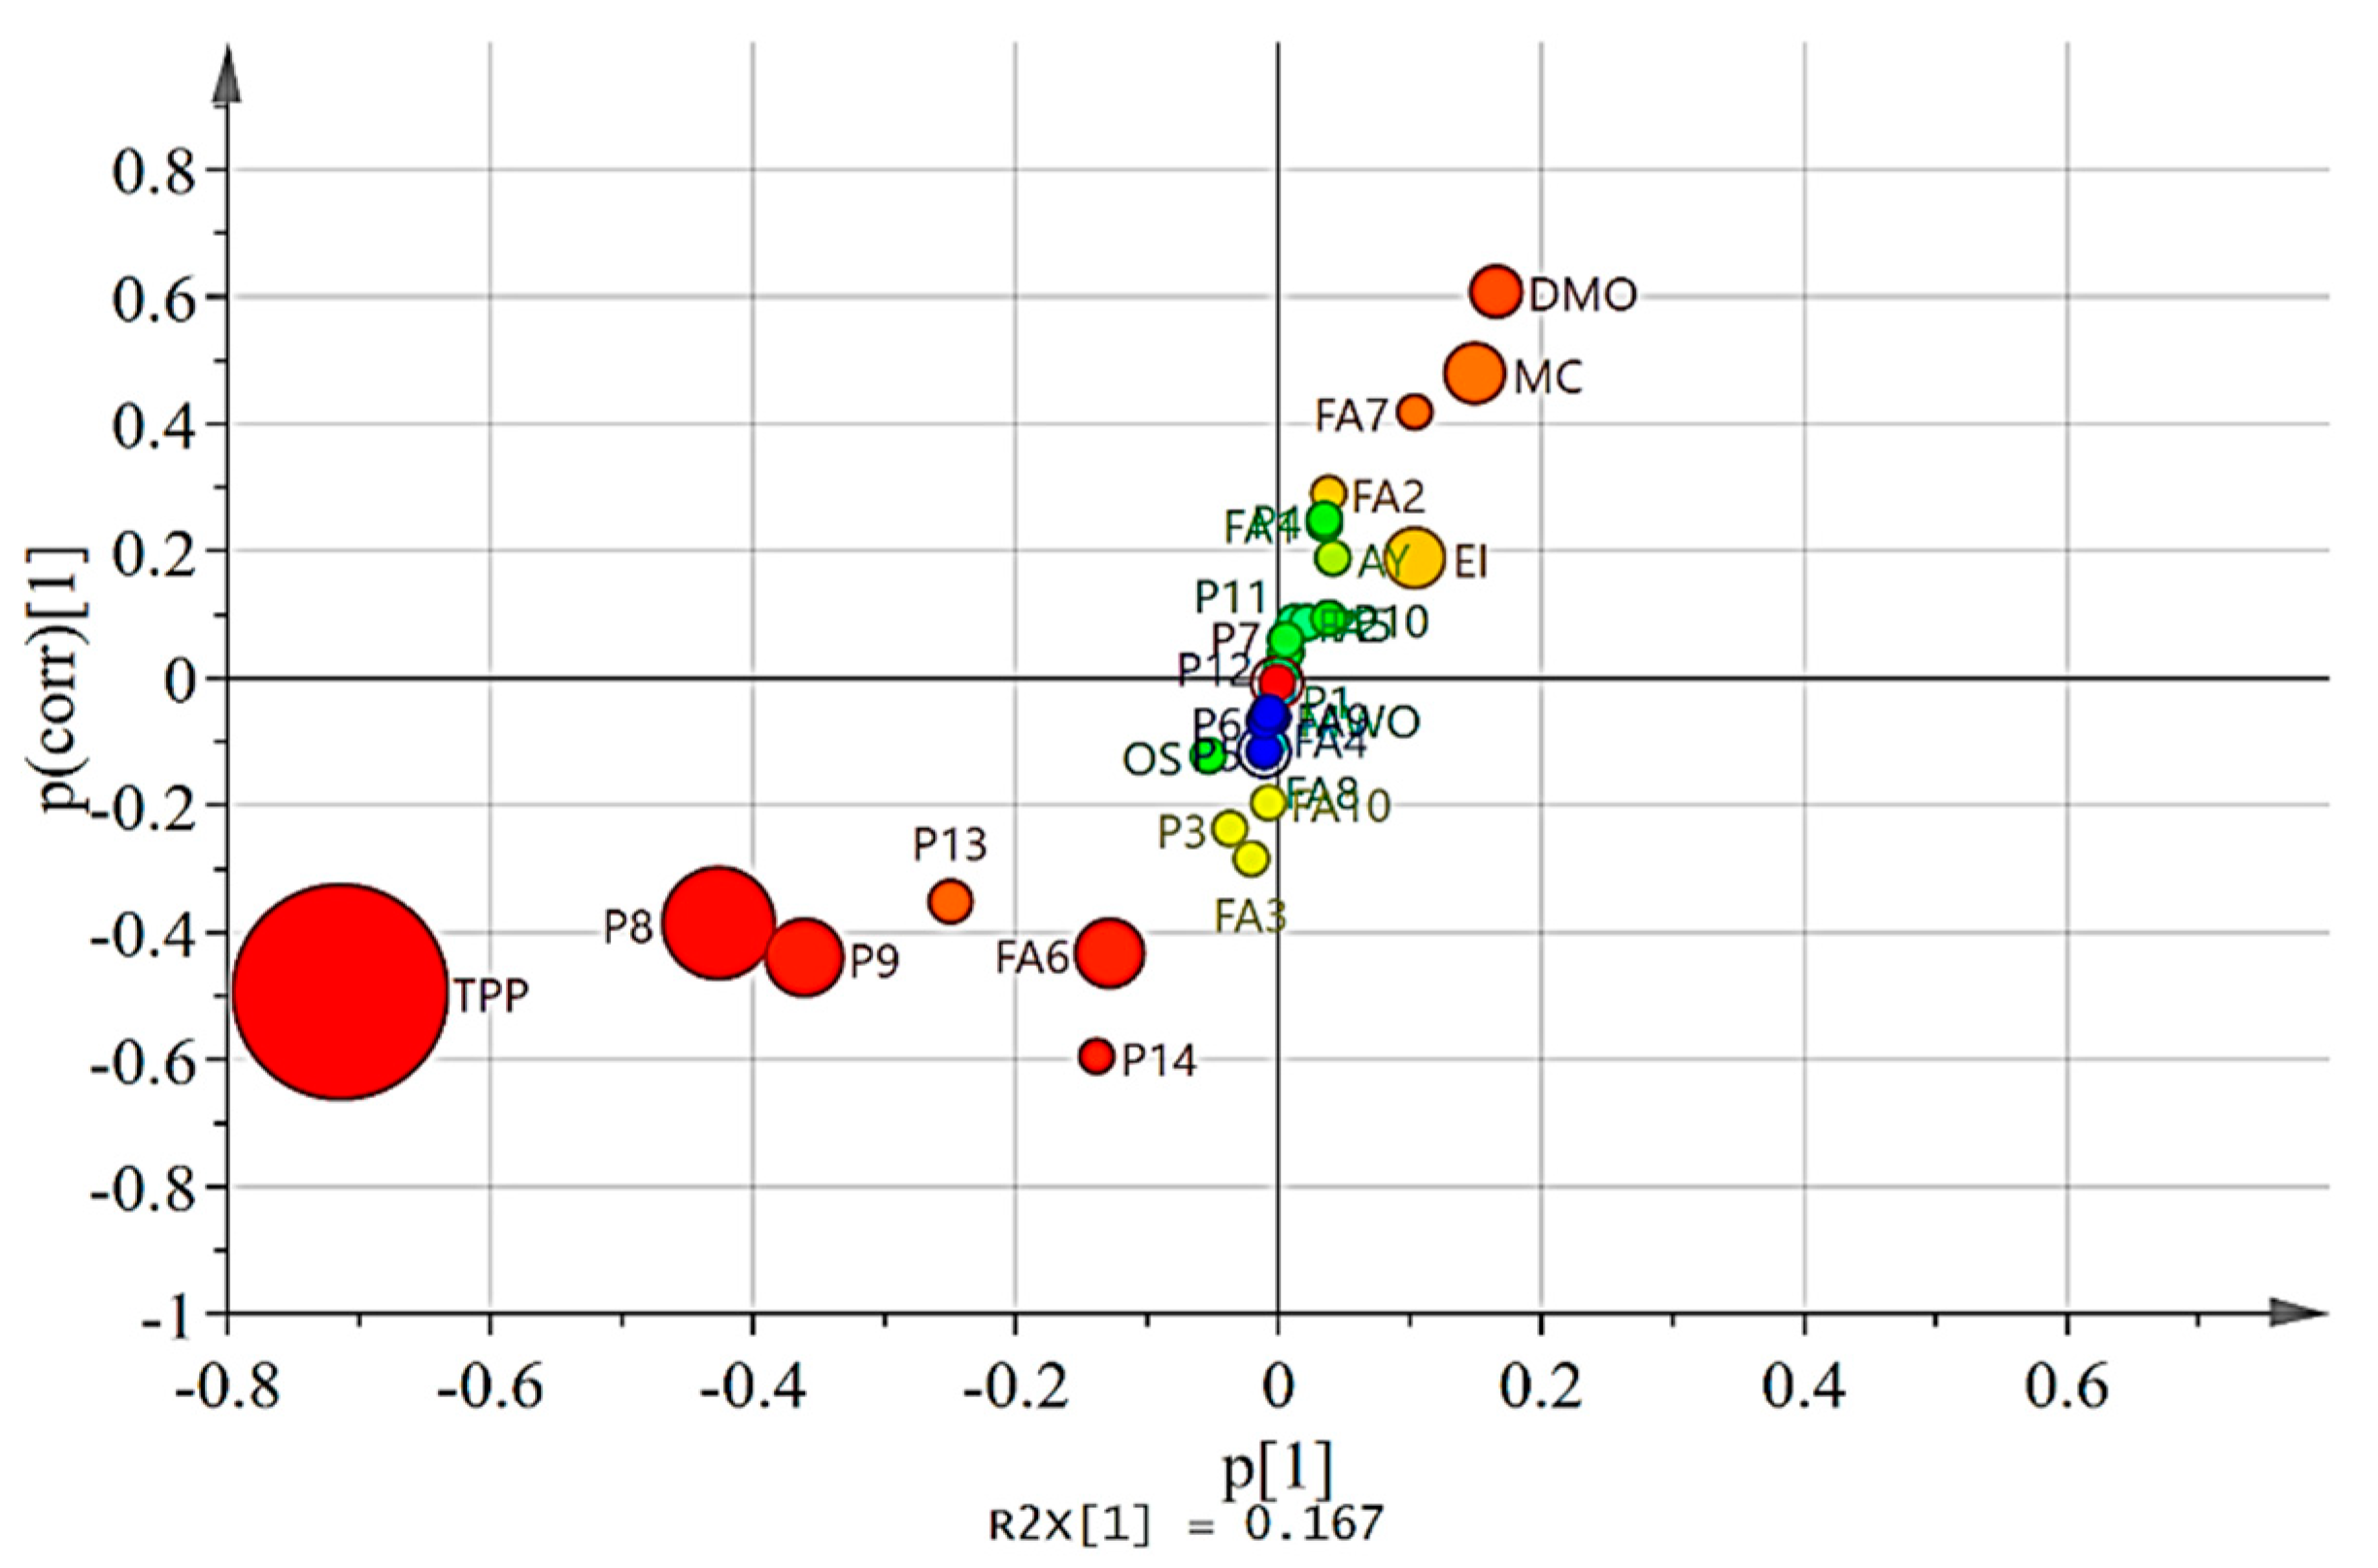
3.3. Multivariate Analyses
4. Conclusions
Supplementary Materials
Author Contributions
Funding
Institutional Review Board Statement
Informed Consent Statement
Data Availability Statement
Acknowledgments
Conflicts of Interest
References
- Jimenez-Lopez, C.; Carpena, M.; Lourenco-Lopes, C.; Gallardo-Gomez, M.; Lorenzo, J.M.; Barba, F.J.; Prieto, M.A.; Simal-Gandara, J. Bioactive Compounds and Quality of Extra Virgin Olive Oil. Foods 2020, 9, 1014. [Google Scholar] [CrossRef] [PubMed]
- Wang, J.; Zhang, D.; Farooqi, T.J.A.; Ma, L.; Deng, Y.; Jia, Z. The olive (Olea europaea L.) industry in China: Its status, opportunities and challenges. Agroforest Sys. 2019, 9, 395–417. [Google Scholar] [CrossRef]
- Kong, W.; Han, R.; Liu, N.; Bai, W.; Ma, J.; Bai, X.; Liang, J.; Wang, J.; Zhang, J. Dynamic assessment of the fruit quality of olives cultivated in Longnan (China) during ripening. Sci. Hortic. Amst. 2019, 253, 8–16. [Google Scholar] [CrossRef]
- Niu, E.; Hu, W.; Ding, J.; Wang, W.; Romero, A.; Shen, G.; Zhu, S. GC-MS/LC-MS and transcriptome analyses revealed the metabolisms of fatty acid and flavonoid in olive fruits (Olea europaea L.). Sci. Hortic. Amst. 2022, 299, 111017. [Google Scholar] [CrossRef]
- Wang, J.-w.; Ma, L.-y.; Gómez-del-Campo, M.; Zhang, D.-s.; Deng, Y.; Jia, Z.-k. Youth tree behavior of olive (Olea europaea L.) cultivars in Wudu, China: Cold and drought resistance, growth, fruit production, and oil quality. Sci. Hortic. Amst. 2018, 236, 106–122. [Google Scholar] [CrossRef]
- Yu, L.; Wang, Y.; Wu, G.; Jin, J.; Jin, Q.; Wang, X. Chemical and volatile characteristics of olive oils extracted from four varieties grown in southwest of China. Food Res. Int. 2021, 140, 109987. [Google Scholar] [CrossRef]
- Beltrán, G.; Uceda, M.; Jiménez, A.; Aguilera, M.P. Olive oil extractability index as a parameter for olive cultivar characterisation. J. Sci. Food Agric. 2003, 83, 503–506. [Google Scholar] [CrossRef]
- Mikołajczak, N.; Tańska, M.; Ogrodowska, D. Phenolic compounds in plant oils: A review of composition, analytical methods, and effect on oxidative stability. Trends Food Sci. Tech. 2021, 113, 110–138. [Google Scholar] [CrossRef]
- Romana-Souza, B.; Saguie, B.O.; Pereira de Almeida Nogueira, N.; Paes, M.; Dos Santos Valenca, S.; Atella, G.C.; Monte-Alto-Costa, A. Oleic acid and hydroxytyrosol present in olive oil promote ROS and inflammatory response in normal cultures of murine dermal fibroblasts through the NF-kappaB and NRF2 pathways. Food Res. Int. 2020, 131, 108984. [Google Scholar] [CrossRef]
- De Ceglie, C.; Abbattista, R.; Losito, I.; Castellaneta, A.; Calvano, C.D.; Bianco, G.; Palmisano, F.; Cataldi, T.R.I. Influence of Horizontal Centrifugation Processes on the Content of Phenolic Secoiridoids and Their Oxidized Derivatives in Commercial Olive Oils: An Insight by Liquid Chromatography-High-Resolution Mass Spectrometry and Chemometrics. J. Agric. Food Chem. 2020, 68, 3171–3183. Available online: https://pubs.acs.org/doi/10.1021/acs.jafc.0c00455 (accessed on 5 December 2022). [CrossRef]
- El Riachy, M.; Hamade, A.; Ayoub, R.; Dandachi, F.; Chalak, L. Oil Content, Fatty Acid and Phenolic Profiles of Some Olive Varieties Growing in Lebanon. Front. Nutr. 2019, 6, 94. [Google Scholar] [CrossRef] [PubMed]
- Cheng, Z.; Zhan, M.; Yang, Z.; Zumstein, K.; Chen, H.; Huang, Q. The Major Qualitative Characteristics of Olive (Olea europaea L.) Cultivated in Southwest China. Front. Plant Sci. 2017, 8, 559. [Google Scholar] [CrossRef] [PubMed] [Green Version]
- Zhang, Y.; Zhang, C.; Xu, C.; Deng, Y.; Wen, B.; Xie, P.; Huang, L. Effect of geographical location and soil fertility on main phenolic compounds and fatty acids compositions of virgin olive oil from Leccino cultivar in China. Food Res. Int. 2021, 157, 111207. [Google Scholar] [CrossRef]
- Beltrán, G.; del Río, C.; Sánchez, S.; Martínez, L. Seasonal changes in olive fruit characteristics and oil accumulation during ripening process. J. Sci. Food Agric. 2004, 84, 1783–1790. [Google Scholar] [CrossRef]
- Hernández, M.L.; Padilla, M.N.; Sicardo, M.D.; Mancha, M.; Martinez-Rivas, J.M. Effect of different environmental stresses on the expression of oleate desaturase genes and fatty acid composition in olive fruit. Phytochemistry 2011, 72, 178–187. [Google Scholar] [CrossRef] [PubMed]
- Xiang, C.; Xu, Z.; Liu, J.; Li, T.; Yang, Z.; Ding, C. Quality, composition, and antioxidant activity of virgin olive oil from introduced varieties at Liangshan. LWT-Food Sci. Technol. 2017, 78, 226–234. [Google Scholar] [CrossRef]
- Servili, M.; Selvaggini, R.; Esposto, S.; Taticchi, A.; Montedoro, G.; Morozzi, G. Health and sensory properties of virgin olive oil hydrophilic phenols: Agronomic and technological aspects of production that affect their occurrence in the oil. J. Chromatogr. A 2004, 1054, 113–127. [Google Scholar] [CrossRef]
- Karkoula, E.; Skantzari, A.; Melliou, E.; Magiatis, P. Direct measurement of oleocanthal and oleacein levels in olive oil by quantitative 1H NMR. Establishment of a new index for the characterization of extra virgin olive oils. J. Agric. Food Chem. 2012, 60, 11696–11703. [Google Scholar] [CrossRef]
- Deiana, P.; Santona, M.; Dettori, S.; Culeddu, N.; Dore, A.; Molinu, M.G. Multivariate approach to assess the chemical composition of Italian virgin olive oils as a function of variety and harvest period. Food Chem. 2019, 300, 125243. [Google Scholar] [CrossRef]
- Polari, J.J.; Wang, S.C. Comparative Effect of Hammer Mill Screen Size and Cell Wall-Degrading Enzymes During Olive Oil Extraction. ACS Omega 2020, 5, 6074–6081. [Google Scholar] [CrossRef]
- Dag, A.; Kerem, Z.; Yogev, N.; Zipori, I.; Lavee, S.; Ben-David, E. Influence of time of harvest and maturity index on olive oil yield and quality. Sci. Hortic. Amst. 2011, 127, 358–366. [Google Scholar] [CrossRef]
- Chartzoulakis, K.S. Salinity and olive: Growth, salt tolerance, photosynthesis and yield. Agric. Water Manag. 2005, 78, 108–121. [Google Scholar] [CrossRef]
- Bengana, M.; Bakhouche, A.; Lozano-Sánchez, J.; Amir, Y.; Youyou, A.; Segura-Carretero, A.; Fernández-Gutiérrez, A. Influence of olive ripeness on chemical properties and phenolic composition of Chemlal extra-virgin olive oil. Food Res. Int. 2013, 54, 1868–1875. [Google Scholar] [CrossRef]
- Peres, F.; Martins, L.L.; Ferreira-Dias, S. Laboratory-scale optimization of olive oil extraction: Simultaneous addition of enzymes and microtalc improves the yield. Eur. J. Lipid Sci. Technol. 2014, 116, 1054–1062. [Google Scholar] [CrossRef]
- Yan, H.; Hou, C.; Ma, J.; Deng, Y.; Wang, Q.; Jin, F. Phenotypic character and fatty acid composition and content of olive fruit in different varieties and maturity. China Oils Fats 2019, 44, 105–111. (In Chinese) [Google Scholar]
- Ricciutelli, M.; Marconi, S.; Boarelli, M.C.; Caprioli, G.; Sagratini, G.; Ballini, R.; Fiorini, D. Olive oil polyphenols: A quantitative method by high-performance liquid-chromatography-diode-array detection for their determination and the assessment of the related health claim. J. Chromatogr. A 2017, 1481, 53–63. [Google Scholar] [CrossRef] [PubMed]
- Wang, Z.; Wang, C.; Zhang, C.; Li, W. Ultrasound-assisted enzyme catalyzed hydrolysis of olive waste and recovery of antioxidant phenolic compounds. Innov. Food Sci. Emerg. 2017, 44, 224–234. [Google Scholar] [CrossRef]
- Miho, H.; Moral, J.; Lopez-Gonzalez, M.A.; Diez, C.M.; Priego-Capote, F. The phenolic profile of virgin olive oil is influenced by malaxation conditions and determines the oxidative stability. Food Chem. 2020, 314, 126183. [Google Scholar] [CrossRef]
- Jiang, Y.; Sun, B.; Jin, C.; Wang, F. Soil aggregate stratification of nematodes and microbial communities affects the metabolic quotient in an acid soil. Soil Biol Biochem. 2013, 60, 1–9. [Google Scholar] [CrossRef]
- Morelló, J.-R.; Motilva, M.-J.; Ramo, T.; Romero, M.-P. Effect of freeze injuries in olive fruit on virgin olive oil composition. Food Chem. 2003, 81, 547–553. [Google Scholar] [CrossRef]
- Camposeo, S.; Vivaldi, G.A.; Gattullo, C.E. Ripening indices and harvesting times of different olive cultivars for continuous harvest. Sci. Hortic-Amst. 2013, 151, 1–10. [Google Scholar] [CrossRef]
- Proietti, P.; Antognozzi, E. Effect of irrigation on fruit quality of table olives (Olea europaea), cultivar ′Ascolana tenera′. New Zeal J. Crop. Hort. 1996, 2, 175–181. [Google Scholar] [CrossRef]
- IOC. Trade standard applying to olive oils and olive pomace oils, COI T.15 NC. no.3-REV.7-2013.
- Montaño, A.; Hernandez, M.; Garrido, I.; Llerena, J.L.; Espinosa, F. Fatty Acid and Phenolic Compound Concentrations in Eight Different Monovarietal Virgin Olive Oils from Extremadura and the Relationship with Oxidative Stability. Int. Mol. Sci. 2016, 17, 1960. [Google Scholar] [CrossRef] [Green Version]
- Fuentes, E.; Paucar, F.; Tapia, F.; Ortiz, J.; Jimenez, P.; Romero, N. Effect of the composition of extra virgin olive oils on the differentiation and antioxidant capacities of twelve monovarietals. Food Chem. 2018, 243, 285–294. [Google Scholar] [CrossRef] [PubMed]
- Gao, P.; Hu, C.; He, D. Evaluation of Chemical Properties of Commercial Extra Virgin Olive Oil in China. J. Oleo Sci. 2020, 69, 1541–1549. [Google Scholar] [CrossRef]
- Kamal-Eldin, A. Effect of fatty acids and tocopherols on the oxidative stability of vegetable oils. Eur. J. Lipid Sci. Tech. 2006, 108, 1051–1061. [Google Scholar] [CrossRef]
- Beauchamp, G.K.; Keast, R.S.; Morel, D.; Lin, J.; Pika, J.; Han, Q.; Lee, C.H.; Smith, A.B.; Breslin, P.A. Phytochemistry: Ibuprofen-like activity in extra-virgin olive oil. Nature 2005, 437, 45–46. [Google Scholar] [CrossRef]
- Pino, C.; Sepulveda, B.; Tapia, F.; Saavedra, J.; Garcia-Gonzalez, D.L.; Romero, N. The Impact of Mild Frost Occurring at Different Harvesting Times on the Volatile and Phenolic Composition of Virgin Olive Oil. Antioxidants 2022, 11, 852. [Google Scholar] [CrossRef]
- Gutierrez-Rosales, F.; Romero, M.P.; Casanovas, M.; Motilva, M.J.; Minguez-Mosquera, M.I. β-Glucosidase involvement in the formation and transformation of oleuropein during the growth and development of olive fruits (Olea europaea L. cv. Arbequina) grown under different farming practices. J. Agric. Food Chem. 2012, 60, 4348–4358. [Google Scholar] [CrossRef]
- Ramirez, E.; Medina, E.; Brenes, M.; Romero, C. Endogenous enzymes involved in the transformation of oleuropein in Spanish table olive varieties. J. Agric. Food Chem. 2014, 62, 9569–9575. [Google Scholar] [CrossRef] [Green Version]
- Kołton, A.; Długosz-Grochowska, O.; Wojciechowska, R.; Czaja, M. Biosynthesis Regulation of Folates and Phenols in Plants. Sci. Hortic. Amst. 2022, 291, 110561. [Google Scholar] [CrossRef]


| Variety | Origin | Type | Variety | Origin | Type |
|---|---|---|---|---|---|
| Yuntai14 | China | mid-ripening | Ulliri Bardhe | Albania | precocious-ripening |
| Ezhi8 | China | slow-ripening | Empeltre | Spain | mid-ripening |
| Zhongshan24 | China | precocious-ripening | Ascolana tenera | Italy | precocious-ripening |
| Picual | Spain | mid-ripening | Manzanilla | Spain | mid-ripening |
| Arbequina | Spain | mid-ripening | Koroneiki | Greece | slow-ripening |
Disclaimer/Publisher’s Note: The statements, opinions and data contained in all publications are solely those of the individual author(s) and contributor(s) and not of MDPI and/or the editor(s). MDPI and/or the editor(s) disclaim responsibility for any injury to people or property resulting from any ideas, methods, instructions or products referred to in the content. |
© 2022 by the authors. Licensee MDPI, Basel, Switzerland. This article is an open access article distributed under the terms and conditions of the Creative Commons Attribution (CC BY) license (https://creativecommons.org/licenses/by/4.0/).
Share and Cite
Tang, F.; Li, C.; Yang, X.; Lei, J.; Chen, H.; Zhang, C.; Wang, C. Effect of Variety and Maturity Index on the Physicochemical Parameters Related to Virgin Olive Oil from Wudu (China). Foods 2023, 12, 7. https://doi.org/10.3390/foods12010007
Tang F, Li C, Yang X, Lei J, Chen H, Zhang C, Wang C. Effect of Variety and Maturity Index on the Physicochemical Parameters Related to Virgin Olive Oil from Wudu (China). Foods. 2023; 12(1):7. https://doi.org/10.3390/foods12010007
Chicago/Turabian StyleTang, Fengxia, Chuan Li, Xiaoran Yang, Jiandu Lei, Hongxia Chen, Changwei Zhang, and Chengzhang Wang. 2023. "Effect of Variety and Maturity Index on the Physicochemical Parameters Related to Virgin Olive Oil from Wudu (China)" Foods 12, no. 1: 7. https://doi.org/10.3390/foods12010007