
Identification of Fish Species and Targeted Genetic Modifications Based on DNA Analysis: State of the Art

 , , , ,
Abstract
:1. Introduction
2. Identification of Fish Species
3. DNA-Based Methods
3.1. Nucleic Acid Databases
3.2. Mitochondrial and Nuclear Identification Markers
3.3. Overview of DNA-Based Methods
3.3.1. Polymerase Chain Reaction (PCR)
3.3.2. Sequencing Methods
3.3.3. DNA Hybridization
3.3.4. Methods Using Restriction Enzyme Cleavage
Restriction Fragment Length Polymorphism (RFLP)
Amplified Fragment Length Polymorphism (AFLP)
3.3.5. Polymerase Chain Reaction–Single-Strand Conformation Polymorphism (PCR-SSCP)
3.3.6. Random Amplification of Polymorphic DNA (RAPD)
3.3.7. Loop-Mediated Isothermal Amplification (LAMP)
3.3.8. Multi-Analyte Profiling (xMAP)
3.4. Data Analysis
3.4.1. DNA Barcoding
3.4.2. Forensically Informative Nucleotide Sequencing (FINS)
3.5. Advantages and Limitations
3.6. Evidence of Adulteration in Fish by DNA Analysis
3.7. Detection of Genetic Modifications in Fish


| GM Fish | Purpose of Modification | Detection Method | DNA Marker (Used Gene) | Transgen/Modification | References |
|---|---|---|---|---|---|
| Atlantic salmon (Salmo salar) | To be more efficient for aquaculture compared with conventional non-GM Atlantic salmon | qPCR | Growth hormone gene 1 (GH1) | AquAdvantage®; inserting the opAFP-GHc2 transgene construct (EO-1α) into the nuclear DNA of S. salar, which includes a single copy transgene cassette coding a Chinook salmon (O. tshawytscha)-derived GH gene driven by an antifreeze protein promoter from the ocean pout (Z. americanus) | Soga et al. [254] |
| Encourages growth rates | qPCR | Growth hormone gene 1 (GH1) | Aquadvantage®; GH transgenic S. salar contain a gene construct (opAFP-GHc2; EO-1α) consisting of GH cDNA from O. tshawytscha that is regulated with antifreeze protein gene sequences from an Z. americanus | Hafsa, Nabi, Zellama, Said and Chaouachi [243] | |
| Growth enhancement | PCR | Growth hormone gene (GH) | Microinjection of “all fish” chimeric GH gene construct in eggs: an antifreeze protein gene (AFP) promoter from ocean pout (Zoarces americanus) linked to a chinook salmon (O. tshawytscha) GH cDNA clone; AFP promoter is active and suitable for gene transfer in salmonids; in the future called as ”AquAdvantage Salmon®“ | Du et al. [255] | |
| Resistance to very cold water | PCR, immunoblotting | Antifreeze protein gene (AFP) | Fertilized Atlantic salmon eggs were injected through the micropyle with winter flounder antifreeze protein gene under the control of its natural promoter | Shears et al. [256] | |
| Atlantic and Coho salmon (Salmo salar, Oncorhynchus kisutch) | AquAdvantage® Atlantic salmon: commercial purposes (encourages growth rates to generate fast-growing strains for potential use in aquaculture); coho salmon for research purposes (to study the physiology and behavior of transgenic salmon) | qPCR | Growth hormone (GH) | AquAdvantage® Atlantic salmon: Antifreeze Promoter and Terminator (M. americanus), GH gene from O. tshawytscha Transgenic Coho salmon: Promoter (Metallonein), Growth hormone gene and Terminator are from O. nerka | Debode, Janssen, Marien, Devlin, Lieske, Mankertz and Berben [241] |
| Coho salmon (Oncorhynchus kisutch) | To generate fast-growing strains for potential use in aquaculture (modification allow expression of GH from all tissues in the salmon; elevate circulating levels of the growth hormone in the blood of the GM fish) | PCR | Growth hormone gene 2 (GH2) | GH coding regions in these transgenes have been fused to the sockey salmon (O. nerka) metallothionein-B gene promoter; DNA construct allow expression of GH from all tissues in the salmon | Masri, Rast, Ripley, James, Green, Jia and Devlin [242] |
| Common carp (Cyprinus carpio) | For research purposes (for studying integration, expression and inheritance of foreign genes in this species); Improve fish breed | Survived embryos (after 60 days) were screened by PCR | Mouse metallothionein-I promoter (mMT-I)/human growth hormone gene (hGH) | Microinjection of the human growth hormone gene (hGH) into the germinal disc of common carp one-cell embryos | Hernández et al. [257] |
| For research purposes; Improve fish breed | Dot blot and Southern blot hybridization, using the RSV-LTR and/or the GH cDNA sequences as probes; Expression of the trout GH polypeptide was detected by immunobinding assay | Growth hormone gene (GH) | Microinjection of the recombinant plasmid containing the Rous sarcoma virus-long terminal repeat (RSV-LTR) promoter linked to rainbow trout (Salmo gairdneri) growth hormone (GH) cDNA; “All-fish” constructs | Zhang et al. [258] | |
| Goldfish (Carassiusauratus) | Rapid growth | Growth hormone (GH) | Pronuclear microinjection of recombinant plasmid pBPVMG-6; the mouse metallothionein-1 (MT-1) promoter was fused with the human growth hormone (hGH) gene inserted into a bovine papillomavirus vector (pBR-BPV) | Zhu et al. [259] | |
| Northern pike (Esox lucius) | Improve fish breed; for research purposes | Southern hybridizations of tissues from a microinjected individuals | Growth hormone (GH) | Microinjection of bovine (bGH) or chinook salmon (csGH) growth hormone cDNA genes | Gross et al. [260] |
| Red sea bream (Pagrus major) | Increase of skeletal muscle mass and reduced body length | Verification of genome editing: sequencing of target region in fish muscle, brain, liver or gonad; morphological changes | Myostatin (Pm-mstn) | genome editing: CRISPR/Cas9 (microinjection of the Cas9 RNA and sgRNA was used to introduce the CRISPR/Cas9 system); deletions in the first exon of the Pm-mstn, which cause disruption of the C-terminal active domain of MSTN | Kishimoto, Washio, Yoshiura, Toyoda, Ueno, Fukuyama, Kato and Kinoshita [244] |
| Optimization of microinjection parameters as important step for successful genome editing; tested on myostatin because it is known that its deficiency does not affect the viability of fish | Verifying the success of the microinjection and the effects of the three tested factors were estimated by the survival rate (38–40 h post fertilization) | Myostatin | In vitro fertilization and microinjection of the Cas9 RNA (100 ng/µL) and sgRNA (50 ng/µL) mixture | Kishimoto et al. [261] | |
| Increase of skeletal muscle mass; research purpose | Myostatin (Pm-mstn) | myostatin complete knockout (CRISPR/Cas9) | Ohama et al. [262] | ||
| Tiger pufferfish (Takifugu rubripes) | Optimization of microinjection parameters as important step for successful genome editing; tested on myostatin because it is known that its deficiency does not affect the viability of fish | Verifying the success of the microinjection and the effects of the three tested factors were estimated by the survival rate (6–7 days post fertilization) | Myostatin | In vitro fertilization and microinjection of the Cas9 RNA (100 ng/µL) and sgRNA (50 ng/µL) mixture | Kishimoto, Washio, Murakami, Katayama, Kuroyanagi, Kato, Yoshiura and Kinoshita [261] |
| Rainbow trout (Oncorhynchus mykiss) | To improve desirable genetic traits such as growth | Growth hormone (GH) | Pronuclear microinjection into newly fertilized rainbow trout; Mouse metallothionein gene within E. coli plasmid pBR 322 | Maclean and Talwar [235] | |
| To enhance disease resistance | PCR; (RT)-PCR analysis was used for detection of expression of cecropin P1 and CF-17 transgenes | Cecropin P1 or synthetic cecropin B analog (CF-17) gene | Electroporation; expressing cecropin P1 or a synthetic cecropin B analog, CF-17, transgene by sperm-mediated gene transfer method | Chiou et al. [263] | |
| Rainbow trout and Super mud loach (Oncorhynchus mykiss, Misgurnus mizolepis) | To be more efficient for aquaculture compared with conventional non-GM fish | PCR, qPCR | Growth hormon (GH) | Modified target genes:metallothionein (MT) and mud loach chloramphenicol acetyltransferase (MLcat); | Chae et al. [264] |
| Tilapia (Oreochromis niloticus) | Improve fish breed (commercial applications) | CAT (chloramphcnicol acetyl transferase) assay was used to test for gene expression in the transgenic fish | Mouse metallothionein-I promoter (mMT-I)/rat growth hormone gene (rGH) | Microinjection of transgenes; injected DNA constructs comprising a carp beta-actin promoter sequence spliced to the bacterial reporter CAT gene | Rahman and Maclean [265] |
| For research purposes (studying integration and expression of foreign genes in fish) | Southern blot and dot blot analysis | Growth hormone gene 1 (GH-1) | Microinjection: EcoRI-DNA fragment containing the mouse metallothionein-I promoter (mMT-I) fused to a structural gene coding for the human growth hormone (hGH) was injected into the germinal disc | Brem et al. [266] | |
| Zebrafish (Danio rerio) | For research purpose (fluorescent protein used as a reporter) | Epifluorescence microscopy, PCR | Green, fluorescent protein gene (GFP) | Microinjection of GFP cDNA (KpnI-SacI fragment from TU65) insterted into a pXex vector (composed of the enhancer sequence, promoter and 5′ untranslated sequence from the Xenopus ef1α gene) | Amsterdam et al. [252] |
| For research purposes (fluorescent protein used as a reporter); Two-color transgenic Zebrafish | fluorescence microscope | Green, red fluorescent protein gene (GFP, RFP) | Microinjection of more different DNA constructs (CK-EGFP, pCK -RFP, pMLC-EGFP, and pMLC-RFP) into each embryo; promoters: keratin8 gene (krt8) for skin specificity, myosin light chain 2 gene (mylz2) for muscle specificity; gfp and rfp reporter gene constructs, pEGFP-1 and pDsRed-1 | Ju et al. [267], Wan et al. [268] | |
| Ornamental (fluorescent colors), bioreactor (system for production of recombinant proteins) | Fluorescence (visible to unaided eyes under daylight and ultraviolet light in dark); level of protein expression was estimated by SDS–polyacrylamide gel electrophoresis; Northern blot hybridization. Was used for analysis of transgenic and endogenous RNA expression | Green, yellow or red fluorescent protein gene (GFP, YFP, RFP) | Microinjection of a construct pMYLZ2-EGFP, pMYLZ2-RFP, and pMYLZ2-YFP into embryos (at 1- or 2-cell stage); gene coding for a green fluorescent protein (GFP) and yellow-orange fluorescent protein (YFP) originally comes from a bioluminescent jellyfish (Aequorea Victoria), red fluorescent protein (RFP) comes from anemone (Discosoma sp.); the gene is expressed under the transcriptional control of the strong muscle-specific promoter of the myosin light peptide 2 gene (mylz2); plasmid contein 2kb mylz2 promoter | Gong, Ju and Wan [237], Gong et al. [253] | |
| Site-directed recombination in transgenic fish | PCR (To confirm the excision of transgene) | gfp gene | Cre/loxP system; a floxed (loxP flanked) gfp (green fluorescent protein) gene construct under the muscle-specific mylz2 promoter; in vitro synthesized Cre RNA was injected into transgenic zebrafish embryos | Pan, Wan, Chia, Tong and Gong [247] | |
| Zebrafish, Tetra (Danio rerio, Gymnocorymbus ternetzi) | Ornamental (fluorescent colors under UV light) | qPCR, fluorescent microscopy (both methods allow to distinguish artificially colored fish from a GM fluorescent fish) | Green, yellow or red fluorescent protein gene (GFP, YFP, RFP), cytochrome-c-oxidase subunit III (COIII), tRNA-Gly and ND3 | Glofish: Microinjection of a gene coding for a fluorescent protein | Debode, Marien, Ledoux, Janssen, Ancion and Berben [236] |
3.8. Current Trends and Future Challenges
4. Conclusions
Supplementary Materials
Author Contributions
Funding
Data Availability Statement
Conflicts of Interest
Abbreviations
| AFLP | Amplified Fragment Length Polymorphism |
| COI | Cytochrome-c-oxidase subunit I |
| cytb | Cytochrome b gene |
| DNA | Deoxyribonucleotide Acid |
| dPCR | Digital PCR |
| ELISA | Enzyme-Linked Immuno Sorbent Assay |
| EMBL | European Molecular Biology Laboratory |
| EU | European Union |
| FAO | Food and Agriculture Organization of the United Nations |
| FINS | Forensically Informative Nucleotide Sequencing |
| FISH-BOL | The Fish Barcode of Life Initiative |
| GM | Genetically Modified |
| GMO | Genetically Modified Organism |
| HRM | High-Resolution Melting |
| LAMP | Loop-Mediated Isothermal Amplification |
| mtDNA | Mitochondrial DNA |
| NCBI | National Center for Biotechnology Information |
| NGS | Next Generation Sequencing |
| NMR | Nuclear Magnetic Resonance |
| nDNA | Nuclear DNA |
| PCR | Polymerase Chain Reaction |
| qPCR | PCR with fluorescence detection in real-time |
| RAPD | Random Amplified Polymorphic DNA |
| RFLP | Restriction Fragment Length Polymorphism |
| SSCP | Single Strand Conformation Polymorphism |
| xMAP | Multi-Analyte Profiling |
| WGS | Whole-Genome Sequencing |
References
- Goyal, K.; Kumar, P.; Verma, K. Food adulteration detection using artificial intelligence: A systematic review. Arch. Comput. Methods Eng. 2021, 29, 397–426. [Google Scholar] [CrossRef]
- Kotsanopoulos, K.V.; Exadactylos, A.; Gkafas, G.A.; Martsikalis, P.V.; Parlapani, F.F.; Boziaris, I.S.; Arvanitoyannis, I.S. The use of molecular markers in the verification of fish and seafood authenticity and the detection of adulteration. Compr. Rev. Food Sci. Food Saf. 2021, 20, 1584–1654. [Google Scholar] [CrossRef] [PubMed]
- Rasmussen, R.S.; Morrissey, M.T. DNA-based methods for the identification of commercial fish and seafood species. Compr. Rev. Food Sci. Food Saf. 2008, 7, 280–295. [Google Scholar] [CrossRef] [PubMed]
- Civera, T. Species identification and safety of fish products. Vet. Res. Commun. 2003, 27, 481. [Google Scholar] [CrossRef] [PubMed]
- Pauly, D.; Christensen, V.; Dalsgaard, J.; Froese, R.; Torres, F., Jr. Fishing down marine food webs. Science 1998, 279, 860–863. [Google Scholar] [CrossRef]
- Food and Agriculture Organization of the United Nations. Report of the Fourteenth Session of the Sub-Committee on Fish Trade; COFI:FT/XIV/2014/5; FAO: Rome, Italy, 2014; 86p. [Google Scholar]
- Buyuktiryaki, B.; Masini, M.; Mori, F.; Barni, S.; Liccioli, G.; Sarti, L.; Lodi, L.; Giovannini, M.; du Toit, G.; Lopata, A.L. IgE-mediated fish allergy in children. Medicina 2021, 57, 76. [Google Scholar] [CrossRef]
- Moonesinghe, H.; Mackenzie, H.; Venter, C.; Kilburn, S.; Turner, P.; Weir, K.; Dean, T. Prevalence of fish and shellfish allergy: A systematic review. Ann. Allergy Asthma Immunol. 2016, 117, 264–272.e264. [Google Scholar] [CrossRef]
- Kuehn, A.; Swoboda, I.; Arumugam, K.; Hilger, C.; Hentges, F. Fish allergens at a glance: Variable allergenicity of parvalbumins, the major fish allergens. Front. Immunol. 2014, 5, 179. [Google Scholar] [CrossRef] [Green Version]
- Griesmeier, U.; Vázquez-Cortés, S.; Bublin, M.; Radauer, C.; Ma, Y.; Briza, P.; Fernández-Rivas, M.; Breiteneder, H. Expression levels of parvalbumins determine allergenicity of fish species. Allergy 2010, 65, 191–198. [Google Scholar] [CrossRef]
- Lee, P.-W.; Nordlee, J.A.; Koppelman, S.J.; Baumert, J.L.; Taylor, S.L. Measuring parvalbumin levels in fish muscle tissue: Relevance of muscle locations and storage conditions. Food Chem. 2012, 135, 502–507. [Google Scholar] [CrossRef]
- Taylor, S.; Kabourek, J.; Hefle, S. Fish allergy: Fish and products thereof. J. Food Sci. 2004, 69, R175–R180. [Google Scholar] [CrossRef]
- Sharp, M.F.; Lopata, A.L. Fish allergy: In review. Clin. Rev. Allergy Immunol. 2014, 46, 258–271. [Google Scholar] [CrossRef]
- Mukherjee, S.; Bartoš, O.; Zdeňková, K.; Hanák, P.; Horká, P.; Musilova, Z. Evolution of the Parvalbumin Genes in Teleost Fishes after the Whole-Genome Duplication. Fishes 2021, 6, 70. [Google Scholar] [CrossRef]
- Saptarshi, S.R.; Sharp, M.F.; Kamath, S.D.; Lopata, A.L. Antibody reactivity to the major fish allergen parvalbumin is determined by isoforms and impact of thermal processing. Food Chem. 2014, 148, 321–328. [Google Scholar] [CrossRef]
- Sletten, G.; Van Do, T.; Lindvik, H.; Egaas, E.; Florvaag, E. Effects of industrial processing on the immunogenicity of commonly ingested fish species. Int. Arch. Allergy Immunol. 2010, 151, 223–236. [Google Scholar] [CrossRef]
- Aiello, D.; Materazzi, S.; Risoluti, R.; Thangavel, H.; Di Donna, L.; Mazzotti, F.; Casadonte, F.; Siciliano, C.; Sindona, G.; Napoli, A. A major allergen in rainbow trout (Oncorhynchus mykiss): Complete sequences of parvalbumin by MALDI tandem mass spectrometry. Mol. Biosyst. 2015, 11, 2373–2382. [Google Scholar] [CrossRef]
- Hubalkova, Z.; Kralik, P.; Tremlova, B.; Rencova, E. Methods of gadoid fish species identification in food and their economic impact in the Czech Republic: A review. Vet. Med. 2007, 52, 273. [Google Scholar] [CrossRef] [Green Version]
- Leduc, F.; Krzewinski, F.; Le Fur, B.; N’Guessan, A.; Malle, P.; Kol, O.; Duflos, G. Differentiation of fresh and frozen/thawed fish, European sea bass (Dicentrarchus labrax), gilthead seabream (Sparus aurata), cod (Gadus morhua) and salmon (Salmo salar), using volatile compounds by SPME/GC/MS. J. Sci. Food Agric. 2012, 92, 2560–2568. [Google Scholar] [CrossRef]
- Edirisinghe, R.K.; Graffham, A.J.; Taylor, S.J. Characterisation of the volatiles of yellowfin tuna (Thunnus albacares) during storage by solid phase microextraction and GC–MS and their relationship to fish quality parameters. Int. J. Food Sci. Technol. 2007, 42, 1139–1147. [Google Scholar] [CrossRef]
- Carrera, M.; Cañas, B.; Gallardo, J.M. Rapid direct detection of the major fish allergen, parvalbumin, by selected MS/MS ion monitoring mass spectrometry. J. Proteom. 2012, 75, 3211–3220. [Google Scholar] [CrossRef]
- Carrera, M.; Canas, B.; López-Ferrer, D.; Pineiro, C.; Vázquez, J.; Gallardo, J.M. Fast monitoring of species-specific peptide biomarkers using high-intensity-focused-ultrasound-assisted tryptic digestion and selected MS/MS ion monitoring. Anal. Chem. 2011, 83, 5688–5695. [Google Scholar] [CrossRef] [PubMed] [Green Version]
- Alamprese, C.; Casiraghi, E. Application of FT-NIR and FT-IR spectroscopy to fish fillet authentication. LWT-Food Sci. Technol. 2015, 63, 720–725. [Google Scholar] [CrossRef]
- Aursand, M.; Standal, I.B.; Praël, A.; McEvoy, L.; Irvine, J.; Axelson, D.E. 13C NMR pattern recognition techniques for the classification of Atlantic salmon (Salmo salar L.) according to their wild, farmed, and geographical origin. J. Agric. Food Chem. 2009, 57, 3444–3451. [Google Scholar] [CrossRef] [PubMed]
- Standal, I.B.; Axelson, D.E.; Aursand, M. 13C NMR as a tool for authentication of different gadoid fish species with emphasis on phospholipid profiles. Food Chem. 2010, 121, 608–615. [Google Scholar] [CrossRef]
- Asensio, L.; González, I.; García, T.; Martín, R. Determination of food authenticity by enzyme-linked immunosorbent assay (ELISA). Food Control 2008, 19, 1–8. [Google Scholar] [CrossRef]
- Martinez, I.; Jakobsen Friis, T. Application of proteome analysis to seafood authentication. Proteomics 2004, 4, 347–354. [Google Scholar] [CrossRef]
- Hoffman, J. Tracing the origins, migrations, and other movements of fishes using stable isotopes. In An Introduction to Fish Migration; CRC Press: Boca Raton, FL, USA, 2016; pp. 169–196. [Google Scholar]
- Molkentin, J.; Lehmann, I.; Ostermeyer, U.; Rehbein, H. Traceability of organic fish—Authenticating the production origin of salmonids by chemical and isotopic analyses. Food Control 2015, 53, 55–66. [Google Scholar] [CrossRef]
- Akasaki, T.; Yanagimoto, T.; Yamakami, K.; Tomonaga, H.; Sato, S. Species identification and PCR-RFLP analysis of cytochrome b gene in cod fish (order Gadiformes) products. J. Food Sci. 2006, 71, C190–C195. [Google Scholar] [CrossRef]
- Moretti, V.; Turchini, G.; Bellagamba, F.; Caprino, F. Traceability issues in fishery and aquaculture products. Vet. Res. Commun. 2003, 27, 497–505. [Google Scholar] [CrossRef]
- Mazzeo, M.F.; Siciliano, R.A. Proteomics for the authentication of fish species. J. Proteom. 2016, 147, 119–124. [Google Scholar] [CrossRef]
- Hubalkova, Z.; Kralik, P.; Kasalova, J.; Rencova, E. Identification of gadoid species in fish meat by polymerase chain reaction (PCR) on genomic DNA. J. Agric. Food Chem. 2008, 56, 3454–3459. [Google Scholar] [CrossRef]
- Hanák, P.; Laknerová, I.; Švátora, M. Second intron in the protein-coding region of the fish parvalbumin gene—A promising platform for polymerase chain reaction-based discrimination of fish meat of various species. J. Food Nutr. Res. 2012, 51, 81–88. [Google Scholar]
- Griffiths, A.M.; Sotelo, C.G.; Mendes, R.; Pérez-Martín, R.I.; Schröder, U.; Shorten, M.; Silva, H.A.; Verrez-Bagnis, V.; Mariani, S. Current methods for seafood authenticity testing in Europe: Is there a need for harmonisation? Food Control 2014, 45, 95–100. [Google Scholar] [CrossRef] [Green Version]
- Gil, L.A. PCR-based methods for fish and fishery products authentication. Trends Food Sci. Technol. 2007, 18, 558–566. [Google Scholar]
- Clark, L.F. The current status of DNA barcoding technology for species identification in fish value chains. Food Policy 2015, 54, 85–94. [Google Scholar] [CrossRef]
- Fernandes, T.J.; Costa, J.; Carrapatoso, I.; Oliveira, M.B.P.; Mafra, I. Advances on the molecular characterization, clinical relevance, and detection methods of Gadiform parvalbumin allergens. Crit. Rev. Food Sci. Nutr. 2017, 57, 3281–3296. [Google Scholar] [CrossRef]
- Tomás, C.; Ferreira, I.; Faria, M. Codfish authentication by a fast short amplicon high resolution melting analysis (SA-HRMA) method. Food Control 2017, 71, 255–263. [Google Scholar] [CrossRef]
- Cai, X.; Xu, M.; Wang, Y.; Qiu, D.; Liu, G.; Lin, A.; Tang, J.; Zhang, R.; Zhu, X. Sensitive and rapid detection of Clonorchis sinensis infection in fish by loop-mediated isothermal amplification (LAMP). Parasitol. Res. 2010, 106, 1379–1383. [Google Scholar] [CrossRef] [PubMed]
- Caipang, C.M.A.; Haraguchi, I.; Ohira, T.; Hirono, I.; Aoki, T. Rapid detection of a fish iridovirus using loop-mediated isothermal amplification (LAMP). J. Virol. Methods 2004, 121, 155–161. [Google Scholar] [CrossRef]
- Lin, T.C.; Hsiao, W.V.; Han, S.J.; Joung, S.J.; Shiao, J.C. A direct multiplex loop-mediated isothermal amplification method to detect three CITES-listed shark species. Aquat. Conserv. Mar. Freshw. Ecosyst. 2021, 31, 2193–2203. [Google Scholar] [CrossRef]
- But, G.W.-C.; Wu, H.-Y.; Shao, K.-T.; Shaw, P.-C. Rapid detection of CITES-listed shark fin species by loop-mediated isothermal amplification assay with potential for field use. Sci. Rep. 2020, 10, 4455. [Google Scholar] [CrossRef] [PubMed] [Green Version]
- Wang, Y.; Feng, J.; Tian, X. Application of loop-mediated isothermal amplification (LAMP) for rapid detection of Atlantic cod (Gadus morhua), Pacific cod (Gadus macrocephalus) and haddock (Melanogrammus aeglefinus). Mol. Cell. Probes 2019, 47, 101420. [Google Scholar] [CrossRef] [PubMed]
- Li, Q.; Cheng, Y.; Xu, W.; Cui, X.; Cao, M.; Xiong, X.; Wang, L.; Xiong, X. Rapid identification of Atlantic salmon (Salmo salar) based on loop-mediated isothermal amplification (LAMP) using self-quenching fluorogenic approach. J. Food Compos. Anal. 2022, 105, 104224. [Google Scholar] [CrossRef]
- Hanner, R.; Desalle, R.; Ward, R.D.; Kolokotronis, S.-O. The fish Barcode of Life (FISH-BOL) special issue. Mitochondrial DNA 2011, 22, 1–2. [Google Scholar] [CrossRef] [PubMed]
- Böhme, K.; Calo-Mata, P.; Barros-Velázquez, J.; Ortea, I. Review of Recent DNA-Based Methods for Main Food-Authentication Topics. J. Agric. Food Chem. 2019, 67, 3854–3864. [Google Scholar] [CrossRef]
- Zanzi, A.; Martinsohn, J.T. FishTrace: A genetic catalogue of European fishes. Database 2017, 2017, bax075. [Google Scholar] [CrossRef] [Green Version]
- Aparicio, S.; Chapman, J.; Stupka, E.; Putnam, N.; Chia, J.-m.; Dehal, P.; Christoffels, A.; Rash, S.; Hoon, S.; Smit, A. Whole-genome shotgun assembly and analysis of the genome of Fugu rubripes. Science 2002, 297, 1301–1310. [Google Scholar] [CrossRef] [Green Version]
- Randhawa, S.S.; Pawar, R. Fish genomes: Sequencing trends, taxonomy and influence of taxonomy on genome attributes. J. Appl. Ichthyol. 2021, 37, 553–562. [Google Scholar] [CrossRef]
- Nelson, J.S.; Grande, T.C.; Wilson, M.V. Fishes of the World; John Wiley & Sons: Hoboken, NJ, USA, 2016. [Google Scholar]
- Food and Agriculture Organization of the United Nations. European Price Report—January 2022; Food and Agriculture Organization of the United Nations: Rome, Italy, 2022. [Google Scholar]
- European Market Observatory for Fisheries and Aquaculture Products. The EU Fish Market; Publications Office of the European Union: Luxembourg, 2021. [Google Scholar]
- Fan, G.; Song, Y.; Yang, L.; Huang, X.; Zhang, S.; Zhang, M.; Yang, X.; Chang, Y.; Zhang, H.; Li, Y. Initial data release and announcement of the 10,000 Fish Genomes Project (Fish10K). GigaScience 2020, 9, giaa080. [Google Scholar] [CrossRef]
- Rehbein, H. Differentiation of fish species by PCR-based DNA analysis of nuclear genes. Eur. Food Res. Technol. 2013, 236, 979–990. [Google Scholar] [CrossRef]
- Paracchini, V.; Petrillo, M.; Lievens, A.; Kagkli, D.-M.; Angers-Loustau, A. Nuclear DNA barcodes for cod identification in mildly-treated and processed food products. Food Addit. Contam. Part A 2019, 36, 1–14. [Google Scholar] [CrossRef] [Green Version]
- Cline, S.D. Mitochondrial DNA damage and its consequences for mitochondrial gene expression. Biochim. Biophys. Acta (BBA)-Gene Regul. Mech. 2012, 1819, 979–991. [Google Scholar] [CrossRef] [PubMed]
- Pamilo, P.; Nei, M. Relationships between gene trees and species trees. Mol. Biol. Evol. 1988, 5, 568–583. [Google Scholar] [PubMed]
- Bermingham, E.; Forbes, S.H.; Friedland, K.; Pla, C. Discrimination between Atlantic salmon (Salmo salar) of North American and European origin using restriction analyses of mitochondrial DNA. Can. J. Fish. Aquat. Sci. 1991, 48, 884–893. [Google Scholar] [CrossRef]
- Lencová, S.; Zdeňková, K.; Akhatova, D.; Demnerová, K. Aktuální trendy druhové identifikace rybího masa pomocí molekulárně-biologických metod. Chem. Listy 2019, 113, 292–300. [Google Scholar]
- Hebert, P.D.; Cywinska, A.; Ball, S.L.; DeWaard, J.R. Biological identifications through DNA barcodes. Proc. R. Soc. Lond. B Biol. Sci. 2003, 270, 313–321. [Google Scholar] [CrossRef] [Green Version]
- Ward, R.D.; Zemlak, T.S.; Innes, B.H.; Last, P.R.; Hebert, P.D. DNA barcoding Australia’s fish species. Philos. Trans. R. Soc. B Biol. Sci. 2005, 360, 1847–1857. [Google Scholar] [CrossRef]
- Hisar, O.; Erdogan, O.; Aksakal, E.; Hisar, S.A. Authentication of fish species using a simple PCR-RFLP method. Isr. J. Aquac.-Bamigdeh 2006, 58, 62–65. [Google Scholar] [CrossRef]
- Calo-Mata, P.; Sotelo, C.G.; Pérez-Martín, R.I.; Rehbein, H.; Hold, G.L.; Russell, V.J.; Pryde, S.; Quinteiro, J.; Rey-Méndez, M.; Rosa, C. Identification of gadoid fish species using DNA-based techniques. Eur. Food Res. Technol. 2003, 217, 259–264. [Google Scholar] [CrossRef]
- Sevilla, R.G.; Diez, A.; Norén, M.; Mouchel, O.; Jérôme, M.; Verrez-Bagnis, V.; Van Pelt, H.; Favre-Krey, L.; Krey, G.; The Fishtrace Consortium. Primers and polymerase chain reaction conditions for DNA barcoding teleost fish based on the mitochondrial cytochrome b and nuclear rhodopsin genes. Mol. Ecol. Notes 2007, 7, 730–734. [Google Scholar] [CrossRef] [Green Version]
- Teletchea, F. Molecular identification methods of fish species: Reassessment and possible applications. Rev. Fish Biol. Fish. 2009, 19, 265–293. [Google Scholar] [CrossRef]
- Bossier, P. Authentication of Seafood Products by DNA Patterns. J. Food Sci. 1999, 64, 189–193. [Google Scholar] [CrossRef]
- Song, H.; Buhay, J.E.; Whiting, M.F.; Crandall, K.A. Many species in one: DNA barcoding overestimates the number of species when nuclear mitochondrial pseudogenes are coamplified. Proc. Natl. Acad. Sci. USA 2008, 105, 13486–13491. [Google Scholar] [CrossRef]
- Buhay, J.E. “COI-like” sequences are becoming problematic in molecular systematic and DNA barcoding studies. J. Crustac. Biol. 2009, 29, 96–110. [Google Scholar] [CrossRef]
- Williams, S.T.; Knowlton, N. Mitochondrial pseudogenes are pervasive and often insidious in the snapping shrimp genus Alpheus. Mol. Biol. Evol. 2001, 18, 1484–1493. [Google Scholar] [CrossRef] [Green Version]
- Spielmann, G.; Diedrich, J.; Haszprunar, G.; Busch, U.; Huber, I. Comparison of three DNA marker regions for identification of food relevant crustaceans of the order Decapoda. Eur. Food Res. Technol. 2019, 245, 987–995. [Google Scholar] [CrossRef]
- Bensasson, D.; Zhang, D.-X.; Hartl, D.L.; Hewitt, G.M. Mitochondrial pseudogenes: Evolution’s misplaced witnesses. Trends Ecol. Evol. 2001, 16, 314–321. [Google Scholar] [CrossRef]
- Ballin, N.Z.; Vogensen, F.K.; Karlsson, A.H. Species determination—Can we detect and quantify meat adulteration? Meat Sci. 2009, 83, 165–174. [Google Scholar] [CrossRef]
- Mariani, S.; Bekkevold, D. The nuclear genome: Neutral and adaptive markers in fisheries science. In Stock Identification Methods; Elsevier: Amsterdam, The Netherlands, 2014; pp. 297–327. [Google Scholar]
- Akhatova, D.; Laknerova, I.; Zdenkova, K.; Ólafsdo Ttir, G.; Magnúsdó, S.; Piknova, Ľ.; Kyrova, V.; Lerch, Z.; Hanak, P. International interlaboratory study on TaqMan real-time polymerase chain reaction authentication of black seabream (Spondyliosoma cantharus). J. Food Nutr. Res. 2018, 57, 27–37. [Google Scholar]
- Lee, J.-S. The internally self-fertilizing hermaphroditic teleost Rivulus marmoratus (Cyprinodontiformes, Rivulidae) β-actin gene: Amplification and sequence analysis with conserved primers. Mar. Biotechnol. 2000, 2, 161–166. [Google Scholar] [CrossRef]
- Sohn, Y.C.; Kobayashi, M.; Aida, K. Regulation of gonadotropin β subunit gene expression by testosterone and gonadotropin-releasing hormones in the goldfish, Carassius auratus. Comp. Biochem. Physiol. Part B Biochem. Mol. Biol. 2001, 129, 419–426. [Google Scholar] [CrossRef] [PubMed]
- Wang, Y.; Ge, W. Gonadotropin regulation of follistatin expression in the cultured ovarian follicle cells of zebrafish, Danio rerio. Gen. Comp. Endocrinol. 2003, 134, 308–315. [Google Scholar] [CrossRef] [PubMed]
- Prado, M.; Ortea, I.; Vial, S.; Rivas, J.; Calo-Mata, P.; Barros-Velázquez, J. Advanced DNA-and protein-based methods for the detection and investigation of food allergens. Crit. Rev. Food Sci. Nutr. 2016, 56, 2511–2542. [Google Scholar] [CrossRef] [PubMed]
- Paracchini, V.; Petrillo, M.; Lievens, A.; Gallardo, A.P.; Martinsohn, J.T.; Hofherr, J.; Maquet, A.; Silva, A.P.B.; Kagkli, D.M.; Querci, M. Novel nuclear barcode regions for the identification of flatfish species. Food Control 2017, 79, 297–308. [Google Scholar] [CrossRef] [PubMed]
- Edwards, A.; Civitello, A.; Hammond, H.A.; Caskey, C.T. DNA typing and genetic mapping with trimeric and tetrameric tandem repeats. Am. J. Hum. Genet. 1991, 49, 746. [Google Scholar]
- Tautz, D. Hypervariability of simple sequences as a general source for polymorphic DNA markers. Nucleic Acids Res. 1989, 17, 6463–6471. [Google Scholar] [CrossRef]
- Tóth, G.; Gáspári, Z.; Jurka, J. Microsatellites in different eukaryotic genomes: Survey and analysis. Genome Res. 2000, 10, 967–981. [Google Scholar] [CrossRef] [Green Version]
- Stallings, R.L. Distribution of trinucleotide microsatellites in different categories of mammalian genomic sequence: Implications for human genetic diseases. Genomics 1994, 21, 116–121. [Google Scholar] [CrossRef]
- Jarne, P.; Lagoda, P.J. Microsatellites, from molecules to populations and back. Trends Ecol. Evol. 1996, 11, 424–429. [Google Scholar] [CrossRef]
- Litt, M.; Luty, J.A. A hypervariable microsatellite revealed by in vitro amplification of a dinucleotide repeat within the cardiac muscle actin gene. Am. J. Hum. Genet. 1989, 44, 397. [Google Scholar]
- Rehbein, H.; Sotelo, C.G.; Perez-Martin, R.I.; Chapela-Garrido, M.; Hold, G.L.; Russell, V.J.; Pryde, S.E.; Santos, A.T.; Rosa, C.; Quinteiro, J. Differentiation of raw or processed eel by PCR-based techniques: Restriction fragment length polymorphism analysis (RFLP) and single strand conformation polymorphism analysis (SSCP). Eur. Food Res. Technol. 2002, 214, 171–177. [Google Scholar] [CrossRef]
- Maldini, M.; Marzano, F.N.; Fortes, G.G.; Papa, R.; Gandolfi, G. Fish and seafood traceability based on AFLP markers: Elaboration of a species database. Aquaculture 2006, 261, 487–494. [Google Scholar] [CrossRef]
- Lago, F.C.; Herrero, B.; Vieites, J.M.; Espineira, M. Genetic identification of horse mackerel and related species in seafood products by means of forensically informative nucleotide sequencing methodology. J. Agric. Food Chem. 2011, 59, 2223–2228. [Google Scholar] [CrossRef]
- Prado, M.; Boix, A.; von Holst, C. Development of a real-time PCR method for the simultaneous detection of mackerel and horse mackerel. Food Control 2013, 34, 19–23. [Google Scholar] [CrossRef]
- Leonardo, R.; Nunes, R.S.C.; Monteiro, M.L.G.; Conte-Junior, C.A.; Del Aguila, E.M.; Paschoalin, V.M. Molecular testing on sardines and rulings on the authenticity and nutritional value of marketed fishes: An experience report in the state of Rio de Janeiro, Brazil. Food Control 2016, 60, 394–400. [Google Scholar] [CrossRef] [Green Version]
- Armani, A.; Tinacci, L.; Xiong, X.; Castigliego, L.; Gianfaldoni, D.; Guidi, A. Fish species identification in canned pet food by BLAST and Forensically Informative Nucleotide Sequencing (FINS) analysis of short fragments of the mitochondrial 16s ribosomal RNA gene (16S rRNA). Food Control 2015, 50, 821–830. [Google Scholar] [CrossRef]
- Xiong, X.; Yuan, F.; Huang, M.; Xiong, X. Exploring the possible reasons for fish fraud in China based on results from monitoring sardine products sold on Chinese markets using DNA barcoding and real time PCR. Food Addit. Contam. Part A 2020, 37, 193–204. [Google Scholar] [CrossRef]
- Bajzik, P.; Golian, J.; Židek, R.; Krall, M.; Walczycka, M.; Tkaczewska, J. Identification of the Common Carp (Cyprinus carpio) Species Using Real-Time PCR Methods. Żywność Nauka-Technol.-Jakość 2012, 5, 166–176. [Google Scholar]
- Chen, C.-H.; Hsieh, C.-H.; Hwang, D.-F. Species identification of Cyprinidae fish in Taiwan by FINS and PCR–RFLP analysis. Food Control 2012, 28, 240–245. [Google Scholar] [CrossRef]
- Chen, C.-H.; Hsieh, C.-H.; Hwang, D.-F. PCR-RFLP analysis using capillary electrophoresis for species identification of Cyprinidae-related products. Food Control 2013, 33, 477–483. [Google Scholar] [CrossRef]
- Barman, H.K.; Barat, A.; Yadav, B.M.; Banerjee, S.; Meher, P.K.; Reddy, P.V.G.K.; Jana, R.K. Genetic variation between four species of Indian major carps as revealed by random amplified polymorphic DNA assay. Aquaculture 2003, 217, 115–123. [Google Scholar] [CrossRef]
- Lucentini, L.; Palomba, A.; Lancioni, H.; Gigliarelli, L.; Natali, M.; Panara, F. Microsatellite polymorphism in Italian populations of northern pike (Esox lucius L.). Fish. Res. 2006, 80, 251–262. [Google Scholar] [CrossRef]
- Lucentini, L.; Puletti, M.E.; Ricciolini, C.; Gigliarelli, L.; Fontaneto, D.; Lanfaloni, L.; Bilò, F.; Natali, M.; Panara, F. Molecular and phenotypic evidence of a new species of genus Esox (Esocidae, Esociformes, Actinopterygii): The southern pike, Esox flaviae. PLoS ONE 2011, 6, e25218. [Google Scholar] [CrossRef] [PubMed]
- Denys, G.P.J.; Dettai, A.; Persat, H.; Hautecœur, M.; Keith, P. Morphological and molecular evidence of three species of pikes Esox spp.(Actinopterygii, Esocidae) in France, including the description of a new species. C. R. Biol. 2014, 337, 521–534. [Google Scholar] [CrossRef] [PubMed]
- Saull, J.; Duggan, C.; Hobbs, G.; Edwards, T. The detection of Atlantic cod (Gadus morhua) using loop mediated isothermal amplification in conjunction with a simplified DNA extraction process. Food Control 2016, 59, 306–313. [Google Scholar] [CrossRef]
- Herrero, B.; Madrinan, M.; Vieites, J.M.; Espineira, M. Authentication of Atlantic cod (Gadus morhua) using real time PCR. J. Agric. Food Chem. 2010, 58, 4794–4799. [Google Scholar] [CrossRef]
- Mueller, S.; Handy, S.M.; Deeds, J.R.; George, G.O.; Broadhead, W.J.; Pugh, S.E.; Garrett, S.D. Development of a COX1 based PCR-RFLP method for fish species identification. Food Control 2015, 55, 39–42. [Google Scholar] [CrossRef]
- Poćwierz-Kotus, A.; Kijewska, A.; Petereit, C.; Bernaś, R.; Więcaszek, B.; Arnyasi, M.; Lien, S.; Kent, M.P.; Wenne, R. Genetic differentiation of brackish water populations of cod Gadus morhua in the southern Baltic, inferred from genotyping using SNP-arrays. Mar. Genom. 2015, 19, 17–22. [Google Scholar] [CrossRef] [Green Version]
- Wolf, C.; Burgener, M.; Hübner, P.; Lüthy, J. PCR-RFLP analysis of mitochondrial DNA: Differentiation of fish species. LWT-Food Sci. Technol. 2000, 33, 144–150. [Google Scholar] [CrossRef]
- Li, H.; Xie, R.; Yu, W.; Wang, N.; Chen, A. Rapid identification of cod and oil fish components based on loop-mediated isothermal amplification. Aquaculture 2021, 545, 737209. [Google Scholar] [CrossRef]
- Shi, R.; Xiong, X.; Huang, M.; Xu, W.; Li, Y.; Cao, M.; Xiong, X. High resolution melting (HRM) analysis of a 12S rRNA mini barcode as a novel approach for codfish species authentication in processed fish products. Eur. Food Res. Technol. 2020, 246, 891–899. [Google Scholar] [CrossRef]
- Hwang, C.-C.; Lin, C.-M.; Huang, C.-Y.; Huang, Y.-L.; Kang, F.-C.; Hwang, D.-F.; Tsai, Y.-H. Chemical characterisation, biogenic amines contents, and identification of fish species in cod and escolar steaks, and salted escolar roe products. Food Control 2012, 25, 415–420. [Google Scholar] [CrossRef]
- Hird, H.; Hold, G.L.; Chisholm, J.; Reece, P.; Russell, V.; Brown, J.; Goodier, R.; MacArthur, R. Development of a method for the quantification of haddock (Melanogrammus aeglefinus) in commercial products using real-time PCR. Eur. Food Res. Technol. 2005, 220, 633–637. [Google Scholar] [CrossRef]
- Espineira, M.; Gonzalez-Lavin, N.; Vieites, J.M.; Santaclara, F.J. Authentication of anglerfish species (Lophius spp) by means of polymerase chain reaction–restriction fragment length polymorphism (PCR–RFLP) and forensically informative nucleotide sequencing (FINS) methodologies. J. Agric. Food Chem. 2008, 56, 10594–10599. [Google Scholar] [CrossRef]
- Ramella, M.S.; Kroth, M.A.; Tagliari, C.; Arisi, A.C.M. Optimization of random amplified polymorphic DNA protocol for molecular identification of Lophius gastrophysus. Food Sci. Technol. 2005, 25, 733–735. [Google Scholar] [CrossRef]
- Mukherjee, S.; Hanak, P.; Jilkova, D.; Musilova, Z.; Horka, P.; Lerch, Z.; Zdenkova, K.; Cermakova, E. Simultaneous detection and quantification of two European anglerfishes by novel genomic primer. J. Food Compos. Anal. 2023, 115, 104992. [Google Scholar] [CrossRef]
- Pepe, T.; Trotta, M.; di Marco, I.; Cennamo, P.; Anastasio, A.; Cortesi, M.L. Mitochondrial cytochrome b DNA sequence variations: An approach to fish species identification in processed fish products. J. Food Prot. 2005, 68, 421–425. [Google Scholar] [CrossRef]
- Pappalardo, A.M.; Ferrito, V. A COIBar-RFLP strategy for the rapid detection of Engraulis encrasicolus in processed anchovy products. Food Control 2015, 57, 385–392. [Google Scholar] [CrossRef]
- Sánchez, A.; Quinteiro, J.; Rey-Mendez, M.; Perez-Martín, R.I.; Sotelo, C. Identification of European hake species (Merluccius merluccius) using real-time PCR. J. Agric. Food Chem. 2009, 57, 3397–3403. [Google Scholar] [CrossRef]
- Espineira, M.; González-Lavín, N.; Vieites, J.M.; Santaclara, F.J. Development of a method for the genetic identification of flatfish species on the basis of mitochondrial DNA sequences. J. Agric. Food Chem. 2008, 56, 8954–8961. [Google Scholar] [CrossRef]
- Xiong, X.; Huang, M.; Xu, W.; Cao, M.; Li, Y.; Xiong, X. Tracing Atlantic Salmon (Salmo salar) in processed fish products using the novel loop-mediated isothermal amplification (LAMP) and PCR assays. Food Anal. Methods 2020, 13, 1235–1245. [Google Scholar] [CrossRef]
- Xiong, X.; Huang, M.; Xu, W.; Li, Y.; Cao, M.; Xiong, X. Using real time fluorescence loop-mediated isothermal amplification for rapid species authentication of Atlantic salmon (Salmo salar). J. Food Compos. Anal. 2021, 95, 103659. [Google Scholar] [CrossRef]
- Soga, K.; Nakamura, K.; Ishigaki, T.; Kimata, S.; Ohmori, K.; Kishine, M.; Mano, J.; Takabatake, R.; Kitta, K.; Nagoya, H. Data representing applicability of developed growth hormone 1 (GH1) gene detection method for detecting Atlantic salmon (Salmo salar) at high specificity to processed salmon commodities. Data Brief 2019, 27, 104695. [Google Scholar] [CrossRef] [PubMed]
- Holman, L.E.; Onoufriou, A.; Hillestad, B.; Johnston, I.A. A workflow used to design low density SNP panels for parentage assignment and traceability in aquaculture species and its validation in Atlantic salmon. Aquaculture 2017, 476, 59–64. [Google Scholar] [CrossRef] [Green Version]
- Drywa, A.; Poćwierz-Kotus, A.; Wąs, A.; Dobosz, S.; Kent, M.P.; Lien, S.; Bernaś, R.; Wenne, R. Genotyping of two populations of Southern Baltic Sea trout Salmo trutta m. trutta using an Atlantic salmon derived SNP-array. Mar. Genom. 2013, 9, 25–32. [Google Scholar] [CrossRef]
- Hildebrandt, S.; Garber, E.A. Effects of processing on detection and quantification of the parvalbumin gene in Atlantic salmon (Salmo salar). Food Chem. 2010, 119, 75–80. [Google Scholar] [CrossRef]
- Herrero, B.; Vieites, J.M.; Espiñeira, M. Authentication of Atlantic salmon (Salmo salar) using real-time PCR. Food Chem. 2011, 127, 1268–1272. [Google Scholar] [CrossRef]
- Zhang, J.; Cai, Z. The application of DGGE and AFLP-derived SCAR for discrimination between Atlantic salmon (Salmo salar) and rainbow trout (Oncorhynchus mykiss). Food Control 2007, 18, 672–676. [Google Scholar] [CrossRef]
- Elo, K.; Ivanoff, S.; Vuorinen, J.A.; Piironen, J. Inheritance of RAPD markers and detection of interspecific hybridization with brown trout and Atlantic salmon. Aquaculture 1997, 152, 55–65. [Google Scholar] [CrossRef]
- Carrera, E.; García, T.; Céspedes, A.; González, I.; Fernández, A.; Hernández, P.E.; Martín, R. PCR-RFLP of the mitochondrial cytochrome oxidase gene: A simple method for discrimination between Atlantic salmon (Salmo salar) and rainbow trout (Oncorhynchus mykiss). J. Sci. Food Agric. 1999, 79, 1654–1658. [Google Scholar] [CrossRef]
- Carrera, E.; García, T.; Céspedes, A.; González, I.; Fernández, A.; Asensio, L.M.; Hernández, P.E.; Martín, R. Identification of smoked Atlantic salmon (Salmo salar) and rainbow trout (Oncorhynchus mykiss) using PCR-restriction fragment length polymorphism of the p53 gene. J. AOAC Int. 2000, 83, 341–346. [Google Scholar] [CrossRef] [Green Version]
- Carrera, E.; Garcia, T.; Céspedes, A.; González, I.; Fernandez, A.; Hernandez, P.; Martin, R. Salmon and trout analysis by PCR-RFLP for identity authentication. J. Food Sci. 1999, 64, 410–413. [Google Scholar] [CrossRef]
- Carrera, E.; Garcia, T.; Cespedes, A.; Gonzalez, I.; Sanz, B.; Hernandez, P.E.; Martin, R. Identification of Atlantic salmon (Salmo salar) and rainbow trout (Oncorhynchus mykiss) by using polymerase chain reaction amplification and restriction analysis of the mitochondrial cytochrome b gene. J. Food Prot. 1998, 61, 482–486. [Google Scholar] [CrossRef]
- Drywa, A.; Poćwierz-Kotus, A.; Dobosz, S.; Kent, M.P.; Lien, S.; Wenne, R. Identification of multiple diagnostic SNP loci for differentiation of three salmonid species using SNP-arrays. Mar. Genom. 2014, 15, 5–6. [Google Scholar] [CrossRef]
- Li, Q.; Xue, H.; Fei, Y.; Cao, M.; Xiong, X.; Xiong, X.; Yang, Y.; Wang, L. Visual detection of rainbow trout (Oncorhynchus mykiss) and Atlantic salmon (Salmo salar) simultaneously by duplex loop-mediated isothermal amplification. Food Chem. Mol. Sci. 2022, 4, 100107. [Google Scholar] [CrossRef]
- Xu, W.; Fu, M.; Huang, M.; Cui, X.; Li, Y.; Cao, M.; Wang, L.; Xiong, X.; Xiong, X. Duplex real-time PCR combined with melting curve analysis for rapid detection of Atlantic salmon (Salmo salar) and rainbow trout (Oncorhynchus mykiss). J. Food Compos. Anal. 2021, 97, 103765. [Google Scholar] [CrossRef]
- Espiñeira, M.; Vieites, J.M.; Santaclara, F.J. Development of a genetic method for the identification of salmon, trout, and bream in seafood products by means of PCR–RFLP and FINS methodologies. Eur. Food Res. Technol. 2009, 229, 785–793. [Google Scholar] [CrossRef]
- Rehbein, H. Identification of the fish species of raw or cold-smoked salmon and salmon caviar by single-strand conformation polymorphism (SSCP) analysis. Eur. Food Res. Technol. 2005, 220, 625–632. [Google Scholar] [CrossRef]
- Li, X.; Li, J.; Zhang, S.; He, Y.; Pan, L. Novel real-time PCR method based on growth hormone gene for identification of Salmonidae ingredient in food. J. Agric. Food Chem. 2013, 61, 5170–5177. [Google Scholar] [CrossRef]
- Xiong, X.; Huang, M.; Xu, W.; Li, Y.; Cao, M.; Xiong, X. Rainbow trout (Oncorhynchus mykiss) identification in processed fish products using loop-mediated isothermal amplification and polymerase chain reaction assays. J. Sci. Food Agric. 2020, 100, 4696–4704. [Google Scholar] [CrossRef]
- Liu, S.; Palti, Y.; Gao, G.; Rexroad III, C.E. Development and validation of a SNP panel for parentage assignment in rainbow trout. Aquaculture 2016, 452, 178–182. [Google Scholar] [CrossRef]
- Liu, S.; Palti, Y.; Martin, K.E.; Parsons, J.E.; Rexroad III, C.E. Assessment of genetic differentiation and genetic assignment of commercial rainbow trout strains using a SNP panel. Aquaculture 2017, 468, 120–125. [Google Scholar] [CrossRef] [Green Version]
- Velasco, A.; Sánchez, A.; Martínez, I.; Santaclara, F.J.; Pérez-Martín, R.I.; Sotelo, C.G. Development of a Real-Time PCR method for the identification of Atlantic mackerel (Scomber scombrus). Food Chem. 2013, 141, 2006–2010. [Google Scholar] [CrossRef] [PubMed] [Green Version]
- Aranishi, F. Rapid PCR-RFLP method for discrimination of imported and domestic mackerel. Mar. Biotechnol. 2005, 7, 571–575. [Google Scholar] [CrossRef]
- Aranishi, F. PCR-RFLP analysis of nuclear nontranscribed spacer for mackerel species identification. J. Agric. Food Chem. 2005, 53, 508–511. [Google Scholar] [CrossRef]
- Turan, C. Microsatellite DNA reveals genetically different populations of Atlantic bonito Sarda sarda in the Mediterranean Basin. Biochem. Syst. Ecol. 2015, 63, 174–182. [Google Scholar] [CrossRef]
- Xiong, X.; Xu, W.; Guo, L.; An, J.; Huang, L.; Qian, H.; Cui, X.; Li, Y.; Cao, M.; Xiong, X. Development of loop-mediated isothermal amplification (LAMP) assay for rapid screening of skipjack tuna (Katsuwonus pelamis) in processed fish products. J. Food Compos. Anal. 2021, 102, 104038. [Google Scholar] [CrossRef]
- Rehbein, H.; Mackie, I.M.; Pryde, S.; Gonzales-Sotelo, C.; Medina, I.; Perez-Martin, R.; Quinteiro, J.; Rey-Mendez, M. Fish species identification in canned tuna by PCR-SSCP: Validation by a collaborative study and investigation of intra-species variability of the DNA-patterns. Food Chem. 1999, 64, 263–268. [Google Scholar] [CrossRef]
- Lockley, A.K.; Bardsley, R.G. Novel Method for the Discrimination of Tuna (Thunnus hynnus) and Bonito (Sarda sarda) DNA. J. Agric. Food Chem. 2000, 48, 4463–4468. [Google Scholar] [CrossRef]
- Weder, J.K.; Rehbein, H.; Kaiser, K.-P. On the specificity of tuna-directed primers in PCR-SSCP analysis of fish and meat. Eur. Food Res. Technol. 2001, 213, 139–144. [Google Scholar] [CrossRef]
- Fernandes, T.J.; Costa, J.; Oliveira, M.B.P.; Mafra, I. Exploiting 16S rRNA gene for the detection and quantification of fish as a potential allergenic food: A comparison of two real-time PCR approaches. Food Chem. 2018, 245, 1034–1041. [Google Scholar] [CrossRef]
- Lauerman, L.H. Advances in PCR technology. Anim. Health Res. Rev. 2004, 5, 247–248. [Google Scholar] [CrossRef] [Green Version]
- Rahman, M.T.; Uddin, M.S.; Sultana, R.; Moue, A.; Setu, M. Polymerase chain reaction (PCR): A short review. Anwer Khan Mod. Med. Coll. J. 2013, 4, 30–36. [Google Scholar] [CrossRef]
- Kubista, M.; Andrade, J.M.; Bengtsson, M.; Forootan, A.; Jonák, J.; Lind, K.; Sindelka, R.; Sjöback, R.; Sjögreen, B.; Strömbom, L. The real-time polymerase chain reaction. Mol. Asp. Med. 2006, 27, 95–125. [Google Scholar] [CrossRef]
- Dingle, T.C.; Sedlak, R.H.; Cook, L.; Jerome, K.R. Tolerance of Droplet-Digital PCR vs Real-Time Quantitative PCR to Inhibitory Substances. Clin. Chem. 2013, 59, 1670–1672. [Google Scholar] [CrossRef] [Green Version]
- Fernandes, T.J.; Costa, J.; Oliveira, M.B.P.; Mafra, I. COI barcode-HRM as a novel approach for the discrimination of hake species. Fish. Res. 2018, 197, 50–59. [Google Scholar] [CrossRef]
- Fernandes, T.J.; Costa, J.; Oliveira, M.B.P.; Mafra, I. DNA barcoding coupled to HRM analysis as a new and simple tool for the authentication of Gadidae fish species. Food Chem. 2017, 230, 49–57. [Google Scholar] [CrossRef]
- Silva, A.J.; Hellberg, R.S. DNA-based techniques for seafood species authentication. In Advances in Food and Nutrition Research; Elsevier: Amsterdam, The Netherlands, 2021; Volume 95, pp. 207–255. [Google Scholar]
- Fernandes, T.J.; Amaral, J.S.; Mafra, I. DNA barcode markers applied to seafood authentication: An updated review. Crit. Rev. Food Sci. Nutr. 2021, 61, 3904–3935. [Google Scholar] [CrossRef]
- Druml, B.; Cichna-Markl, M. High resolution melting (HRM) analysis of DNA—Its role and potential in food analysis. Food Chem. 2014, 158, 245–254. [Google Scholar] [CrossRef]
- Fernandes, T.J.; Silva, C.R.; Costa, J.; Oliveira, M.B.P.; Mafra, I. High resolution melting analysis of a COI mini-barcode as a new approach for Penaeidae shrimp species discrimination. Food Control 2017, 82, 8–17. [Google Scholar] [CrossRef]
- Verrez-Bagnis, V.; Sotelo, C.G.; Mendes, R.; Silva, H.; Kappel, K.; Schröder, U. Methods for seafood authenticity testing in Europe. In Bioactive Molecules in Food; Springer: Berlin/Heidelberg, Germany, 2019; pp. 2063–2117. [Google Scholar]
- Cao, L.; Cui, X.; Hu, J.; Li, Z.; Choi, J.R.; Yang, Q.; Lin, M.; Hui, L.Y.; Xu, F. Advances in digital polymerase chain reaction (dPCR) and its emerging biomedical applications. Biosens. Bioelectron. 2017, 90, 459–474. [Google Scholar] [CrossRef] [PubMed]
- Hindson, B.J.; Ness, K.D.; Masquelier, D.A.; Belgrader, P.; Heredia, N.J.; Makarewicz, A.J.; Bright, I.J.; Lucero, M.Y.; Hiddessen, A.L.; Legler, T.C. High-throughput droplet digital PCR system for absolute quantitation of DNA copy number. Anal. Chem. 2011, 83, 8604–8610. [Google Scholar] [CrossRef] [PubMed]
- Garafutdinov, R.R.; Galimova, A.A.; Sakhabutdinova, A.R. The influence of quality of primers on the formation of primer dimers in PCR. Nucl. Nucl. Nucleic Acids 2020, 39, 1251–1269. [Google Scholar] [CrossRef] [PubMed]
- Vallone, P.M.; Butler, J.M. AutoDimer: A screening tool for primer-dimer and hairpin structures. Biotechniques 2004, 37, 226–231. [Google Scholar] [CrossRef] [PubMed] [Green Version]
- Whitford, W.; Hawkins, V.; Moodley, K.S.; Grant, M.J.; Lehnert, K.; Snell, R.G.; Jacobsen, J.C. Proof of concept for multiplex amplicon sequencing for mutation identification using the MinION nanopore sequencer. Sci. Rep. 2022, 12, 8572. [Google Scholar] [CrossRef]
- Slatko, B.E.; Gardner, A.F.; Ausubel, F.M. Overview of Next-Generation Sequencing Technologies. Curr. Protoc. Mol. Biol. 2018, 122, e59. [Google Scholar] [CrossRef]
- Fakruddin, M.; Chowdhury, A. Pyrosequencing an alternative to traditional Sanger sequencing. Am. J. Biochem. Biotechnol. 2012, 8, 14–20. [Google Scholar] [CrossRef]
- Liu, L.; Li, Y.; Li, S.; Hu, N.; He, Y.; Pong, R.; Lin, D.; Lu, L.; Law, M. Comparison of next-generation sequencing systems. J. Biomed. Biotechnol. 2012, 2012, 251364. [Google Scholar] [CrossRef]
- Illumina. Sequencing and Array-Based Solutions for Genetic Research. Available online: https://www.illumina.com (accessed on 21 May 2022).
- Canadian Agency for Drugs Technologies in Health. Next Generation DNA Sequencing: A Review of the Cost Effectiveness and Guidelines; Canadian Agency for Drugs and Technologies in Health: Ottawa, ON, Canada, 2014; 19p. [Google Scholar]
- Young, A.D.; Gillung, J.P. Phylogenomics—Principles, opportunities and pitfalls of big-data phylogenetics. Syst. Entomol. 2020, 45, 225–247. [Google Scholar] [CrossRef] [Green Version]
- Xie, Z.; Yu, C.; Guo, L.; Li, M.; Yong, Z.; Liu, X.; Meng, Z.; Lin, H. Ion Torrent next-generation sequencing reveals the complete mitochondrial genome of black and reddish morphs of the Coral Trout Plectropomus leopardus. Mitochondrial DNA Part A 2016, 27, 609–612. [Google Scholar] [CrossRef]
- Adelyna, M.N.; Jung, H.; Chand, V.; Mather, P.; Azizah, M.S. A genome survey sequence (GSS) analysis and microsatellite marker development for Indian mackerel, Rastrelliger kanagurta, using Ion Torrent technology. Meta Gene 2016, 10, 67–72. [Google Scholar] [CrossRef]
- De Battisti, C.; Marciano, S.; Magnabosco, C.; Busato, S.; Arcangeli, G.; Cattoli, G. Pyrosequencing as a tool for rapid fish species identification and commercial fraud detection. J. Agric. Food Chem. 2014, 62, 198–205. [Google Scholar] [CrossRef]
- Keller, I.; Taverna, A.; Seehausen, O. A pyrosequencing assay for the rapid discrimination of mitochondrial lineages in the Salmo trutta species complex. Mol. Ecol. Resour. 2011, 11, 196–199. [Google Scholar] [CrossRef]
- Ronaghi, M. Pyrosequencing sheds light on DNA sequencing. Genome Res. 2001, 11, 3–11. [Google Scholar] [CrossRef]
- Morello, L.; Braglia, L.; Gavazzi, F.; Gianì, S.; Breviario, D. Tubulin-based DNA barcode: Principle and applications to complex food matrices. Genes 2019, 10, 229. [Google Scholar] [CrossRef] [Green Version]
- Miya, M.; Gotoh, R.O.; Sado, T. MiFish metabarcoding: A high-throughput approach for simultaneous detection of multiple fish species from environmental DNA and other samples. Fish. Sci. 2020, 86, 939–970. [Google Scholar] [CrossRef]
- Shaw, J.L.; Clarke, L.J.; Wedderburn, S.D.; Barnes, T.C.; Weyrich, L.S.; Cooper, A. Comparison of environmental DNA metabarcoding and conventional fish survey methods in a river system. Biol. Conserv. 2016, 197, 131–138. [Google Scholar] [CrossRef]
- Bessey, C.; Jarman, S.N.; Berry, O.; Olsen, Y.S.; Bunce, M.; Simpson, T.; Power, M.; McLaughlin, J.; Edgar, G.J.; Keesing, J. Maximizing fish detection with eDNA metabarcoding. Environ. DNA 2020, 2, 493–504. [Google Scholar] [CrossRef]
- Euclide, P.T.; Lor, Y.; Spear, M.J.; Tajjioui, T.; Vander Zanden, J.; Larson, W.A.; Amberg, J.J. Environmental DNA metabarcoding as a tool for biodiversity assessment and monitoring: Reconstructing established fish communities of north-temperate lakes and rivers. Divers. Distrib. 2021, 27, 1966–1980. [Google Scholar] [CrossRef]
- Levsky, J.M.; Singer, R.H. Fluorescence in situ hybridization: Past, present and future. J. Cell Sci. 2003, 116, 2833–2838. [Google Scholar] [CrossRef] [Green Version]
- Bayani, J.; Squire, J.A. Fluorescence in situ Hybridization (FISH). Curr. Protoc. Cell Biol. 2004, 23, 22.4.1–22.4.52. [Google Scholar] [CrossRef] [PubMed]
- Lipov, J.; Knejzlík, Z.; Jablonská, E. Laboratoř Analýzy Biologických Materiálů, 1st ed.; Vysoká Škola Chemicko-Technologická v Praze: Prague, Czech Republic, 2017. [Google Scholar]
- Jarcho, J. Restriction Fragment Length Polymorphism Analysis. Curr. Protoc. Hum. Genet. 2000, 1, 2.7.1–2.7.15. [Google Scholar] [CrossRef] [PubMed]
- Zhang, J.; Huang, H.; Cai, Z.; Huang, L. Species identification in salted products of red snappers by semi-nested PCR-RFLP based on the mitochondrial 12S rRNA gene sequence. Food Control 2006, 17, 557–563. [Google Scholar] [CrossRef]
- Pardo, M.A.; Pérez-Villareal, B. Identification of commercial canned tuna species by restriction site analysis of mitochondrial DNA products obtained by nested primer PCR. Food Chem. 2004, 86, 143–150. [Google Scholar] [CrossRef]
- Rasmussen, H.B. Restriction fragment length polymorphism analysis of PCR-amplified fragments (PCR-RFLP) and gel electrophoresis-valuable tool for genotyping and genetic fingerprinting. In Gel Electrophoresis—Principles and Basics; InTechOpen: London, UK, 2012. [Google Scholar]
- Vos, P.; Hogers, R.; Bleeker, M.; Reijans, M.; Lee, T.V.D.; Hornes, M.; Friters, A.; Pot, J.; Paleman, J.; Kuiper, M. AFLP: A new technique for DNA fingerprinting. Nucleic Acids Res. 1995, 23, 4407–4414. [Google Scholar] [CrossRef] [Green Version]
- Paun, O.; Schönswetter, P. Amplified fragment length polymorphism: An invaluable fingerprinting technique for genomic, transcriptomic, and epigenetic studies. In Plant DNA Fingerprinting and Barcoding; Springer: Berlin/Heidelberg, Germany, 2012; pp. 75–87. [Google Scholar]
- Blears, M.; De Grandis, S.; Lee, H.; Trevors, J. Amplified fragment length polymorphism (AFLP): A review of the procedure and its applications. J. Ind. Microbiol. Biotechnol. 1998, 21, 99–114. [Google Scholar] [CrossRef]
- Masiga, D.K.; Turner, C.M.R. Amplified (restriction) fragment length polymorphism (AFLP) analysis. In Parasite Genomics Protocols; Springer: Berlin/Heidelberg, Germany, 2004; pp. 173–185. [Google Scholar]
- Hayashi, K. PCR-SSCP: A method for detection of mutations. Genet. Anal. Biomol. Eng. 1992, 9, 73–79. [Google Scholar] [CrossRef]
- Rehbein, H.; Kress, G.; Schmidt, T. Application of PCR-SSCP to species identification of fishery products. J. Sci. Food Agric. 1997, 74, 35–41. [Google Scholar] [CrossRef]
- Lockley, A.; Bardsley, R. DNA-based methods for food authentication. Trends Food Sci. Technol. 2000, 11, 67–77. [Google Scholar] [CrossRef]
- Rego, I.; Martínez, A.; González-Tizón, A.; Vieites, J.; Leira, F.; Méndez, J. PCR technique for identification of mussel species. J. Agric. Food Chem. 2002, 50, 1780–1784. [Google Scholar] [CrossRef]
- Ali, B.A.; Huang, T.-H.; Qin, D.-N.; Wang, X.-M. A review of random amplified polymorphic DNA (RAPD) markers in fish research. Rev. Fish Biol. Fish. 2004, 14, 443–453. [Google Scholar] [CrossRef]
- Notomi, T.; Okayama, H.; Masubuchi, H.; Yonekawa, T.; Watanabe, K.; Amino, N.; Hase, T. Loop-mediated isothermal amplification of DNA. Nucleic Acids Res. 2000, 28, e63. [Google Scholar] [CrossRef] [Green Version]
- Li, Y.; Fan, P.; Zhou, S.; Zhang, L. Loop-mediated isothermal amplification (LAMP): A novel rapid detection platform for pathogens. Microb. Pathog. 2017, 107, 54–61. [Google Scholar] [CrossRef]
- Angers, A.; Ballin, N.; Hofherr, J.; Kagkli, D.; Lievens, A.; Maquet, A.; Martinsohn, J.; Paracchini, V.; Petrillo, M.; Puertas-Gallardo, A. Enhancing Fish Species Identification Using Novel Markers and Emerging Technologies; Technical Report; European Commission: Brussels, Belgium, 2017; Volume 2. [Google Scholar]
- Earley, M.C.; Vogt, R.F., Jr.; Shapiro, H.M.; Mandy, F.F.; Kellar, K.L.; Bellisario, R.; Pass, K.A.; Marti, G.E.; Stewart, C.C.; Hannon, W.H. Report from a workshop on multianalyte microsphere assays. Cytom. (Clin. Cytom.) 2002, 50, 239–242. [Google Scholar] [CrossRef]
- Chen, R.; Gao, X.-B.; Mei, M.-Z.; Duan, Y.-Y.; Liu, Z.-L.; Weng, W.-C.; Yang, J. A novel multiplex xMAP assay for generic detection of avian, fish, and ruminant DNA in feed and feedstuffs. Appl. Microbiol. Biotechnol. 2019, 103, 4575–4584. [Google Scholar] [CrossRef]
- Luminex. xMAP® Technology. Available online: https://www.luminexcorp.com/xmap-technology/#overview (accessed on 21 May 2022).
- Michná, V.; Reslová, N.; Mikel, P.; Slaný, M. Představení xMAP technologie a Možností Jejího Využití; Přírodovědecká Fakulta: Olomouc, Czech Republic, 2016. [Google Scholar]
- Reslova, N.; Michna, V.; Kasny, M.; Mikel, P.; Kralik, P. xMAP technology: Applications in detection of pathogens. Front. Microbiol. 2017, 8, 55. [Google Scholar] [CrossRef] [Green Version]
- Hildebrandt, S. Multiplexed identification of different fish species by detection of parvalbumin, a common fish allergen gene: A DNA application of multi-analyte profiling (xMAP™) technology. Anal. Bioanal. Chem. 2010, 397, 1787–1796. [Google Scholar] [CrossRef]
- Gleason, L.U.; Burton, R.S. High-throughput molecular identification of fish eggs using multiplex suspension bead arrays. Mol. Ecol. Resour. 2012, 12, 57–66. [Google Scholar] [CrossRef]
- Bartlett, S.; Davidson, W. FINS (forensically informative nucleotide sequencing): A procedure for identifying the animal origin of biological specimens. Biotechniques 1992, 12, 408–411. [Google Scholar]
- Jérôme, M.; Martinsohn, J.T.; Ortega, D.; Carreau, P.; Verrez-Bagnis, V.R.; Mouchel, O. Toward fish and seafood traceability: Anchovy species determination in fish products by molecular markers and support through a public domain database. J. Agric. Food Chem. 2008, 56, 3460–3469. [Google Scholar] [CrossRef]
- Hebert, P.D.; Ratnasingham, S.; De Waard, J.R. Barcoding animal life: Cytochrome c oxidase subunit 1 divergences among closely related species. Proc. R. Soc. Lond. Ser. B Biol. Sci. 2003, 270, S96–S99. [Google Scholar] [CrossRef] [PubMed] [Green Version]
- Hellberg, R.S.; Kawalek, M.D.; Van, K.T.; Shen, Y.; Williams-Hill, D.M. Comparison of DNA extraction and PCR setup methods for use in high-throughput DNA barcoding of fish species. Food Anal. Methods 2014, 7, 1950–1959. [Google Scholar] [CrossRef]
- Ward, R.D.; Hanner, R.; Hebert, P.D. The campaign to DNA barcode all fishes, FISH-BOL. J. Fish Biol. 2009, 74, 329–356. [Google Scholar] [CrossRef] [PubMed]
- Delrieu-Trottin, E.; Williams, J.T.; Pitassy, D.; Driskell, A.; Hubert, N.; Viviani, J.; Cribb, T.H.; Espiau, B.; Galzin, R.; Kulbicki, M. A DNA barcode reference library of French Polynesian shore fishes. Sci. Data 2019, 6, 114. [Google Scholar] [CrossRef] [PubMed] [Green Version]
- Sarmiento-Camacho, S.; Valdez-Moreno, M. DNA barcode identification of commercial fish sold in Mexican markets. Genome 2018, 61, 457–466. [Google Scholar] [CrossRef] [Green Version]
- Jin, L.; Yu, J.; Yuan, X.; Du, X. Fish classification using DNA barcode sequences through deep learning method. Symmetry 2021, 13, 1599. [Google Scholar] [CrossRef]
- Steinke, D.; Hanner, R. The FISH-BOL collaborators’ protocol. Mitochondrial DNA 2011, 22, 10–14. [Google Scholar] [CrossRef] [Green Version]
- Ivanova, N.V.; Zemlak, T.S.; Hanner, R.H.; Hebert, P.D. Universal primer cocktails for fish DNA barcoding. Mol. Ecol. Notes 2007, 7, 544–548. [Google Scholar] [CrossRef]
- Li, M.; Zhang, K.Y.-B.; But, P.P.-H.; Shaw, P.-C. Forensically informative nucleotide sequencing (FINS) for the authentication of Chinese medicinal materials. Chin. Med. 2011, 6, 42. [Google Scholar] [CrossRef] [Green Version]
- Santaclara, F.J.; Espiñeira, M.; Vieites, J.M. Genetic identification of squids (families Ommastrephidae and Loliginidae) by PCR–RFLP and FINS methodologies. J. Agric. Food Chem. 2007, 55, 9913–9920. [Google Scholar] [CrossRef]
- Hellberg, R.S.R.; Morrissey, M.T. Advances in DNA-based techniques for the detection of seafood species substitution on the commercial market. JALA J. Assoc. Lab. Autom. 2011, 16, 308–321. [Google Scholar] [CrossRef]
- Sotelo, C.G.; Calo-Mata, P.; Chapela, M.J.; Pérez-Martín, R.I.; Rehbein, H.; Hold, G.L.; Russell, V.J.; Pryde, S.; Quinteiro, J.; Izquierdo, M. Identification of flatfish (Pleuronectiforme) species using DNA-based techniques. J. Agric. Food Chem. 2001, 49, 4562–4569. [Google Scholar] [CrossRef]
- Notomi, T.; Mori, Y.; Tomita, N.; Kanda, H. Loop-mediated isothermal amplification (LAMP): Principle, features, and future prospects. J. Microbiol. 2015, 53, 1–5. [Google Scholar] [CrossRef]
- Liu, Z.J.; Cordes, J. DNA marker technologies and their applications in aquaculture genetics. Aquaculture 2004, 238, 1–37. [Google Scholar] [CrossRef]
- Mackie, I.; Pryde, S.E.; Gonzales-Sotelo, C.; Medina, I.; Pérez-Martın, R.; Quinteiro, J.; Rey-Mendez, M.; Rehbein, H. Challenges in the identification of species of canned fish. Trends Food Sci. Technol. 1999, 10, 9–14. [Google Scholar] [CrossRef]
- Čížková, H. Falšování Potravin; Verlag Dashöfer: Hamburg, Germany, 2019. [Google Scholar]
- Chiesa, L.M.; Pavlovic, R.; Nobile, M.; Di Cesare, F.; Malandra, R.; Pessina, D.; Panseri, S. Discrimination between Fresh and Frozen-Thawed Fish Involved in Food Safety and Fraud Protection. Foods 2020, 9, 1896. [Google Scholar] [CrossRef]
- Monteiro, C.S.; Deconinck, D.; Eljasik, P.; Sobczak, M.; Derycke, S.; Panicz, R.; Kane, N.; Mazloomrezaei, M.; Devlin, R.; Faria, M.A. A fast HRMA tool to authenticate eight salmonid species in commercial food products. Food Chem. Toxicol. 2021, 156, 112440. [Google Scholar] [CrossRef]
- Keskin, E.; Atar, H. Molecular identification of fish species from surimi-based products labeled as A laskan pollock. J. Appl. Ichthyol. 2012, 28, 811–814. [Google Scholar] [CrossRef]
- Panprommin, D.; Manosri, R. DNA barcoding as an approach for species traceability and labeling accuracy of fish fillet products in Thailand. Food Control 2022, 136, 108895. [Google Scholar] [CrossRef]
- Pahl, S. Authenticity for the Australian Seafood Sector: A Review of Available Tools to Identify Substitution and Mislabelling; Government of South Australia: Adelaide, Australia, 2018; 57p. [Google Scholar]
- Reilly, A. Overview of Food Fraud in the Fisheries Sector. FAO Fisheries and Aquaculture Circular. 2018. I-21. Available online: https://www.proquest.com/openview/42f30fa94753cb46bfc7cb8305bb2eb0/1?pq-origsite=gscholar&cbl=237324 (accessed on 20 October 2022).
- Kroetz, K.; Luque, G.M.; Gephart, J.A.; Jardine, S.L.; Lee, P.; Chicojay Moore, K.; Cole, C.; Steinkruger, A.; Donlan, C.J. Consequences of seafood mislabeling for marine populations and fisheries management. Proc. Natl. Acad. Sci. USA 2020, 117, 30318–30323. [Google Scholar] [CrossRef]
- US Food Drug Administration. Seafood Species Substitution and Economic Fraud; United States Department of Health and Human Services: Washington, DC, USA, 2014. [Google Scholar]
- Ballin, N.; Lametsch, R. Analytical methods for authentication of fresh vs. thawed meat—A review. Meat Sci. 2008, 80, 151–158. [Google Scholar] [CrossRef] [PubMed]
- Rutkayová, J.; Voříšková, J.; Beneš, K.; Kašparů, M.; Škrleta, J.; Klečacký, D. Dielektrické vlastnosti rozmrazeného rybího masa a využití freshmetru pro detegování zmrazení. Chem. Listy 2019, 113, 515–517. [Google Scholar]
- Wang, Y.; Hamid, N.; Jia, P.P.; Pei, D.S. A comprehensive review on genetically modified fish: Key techniques, applications and future prospects. Rev. Aquac. 2021, 13, 1635–1660. [Google Scholar] [CrossRef]
- Maclean, N.; Talwar, S. Injection of cloned genes into rainbow trout eggs. J. Embryol. Exp. Morphol. 1984, 82, 187–200. [Google Scholar]
- Debode, F.; Marien, A.; Ledoux, Q.; Janssen, E.; Ancion, C.; Berben, G. Detection of ornamental transgenic fish by real-time PCR and fluorescence microscopy. Transgenic Res. 2020, 29, 283–294. [Google Scholar] [CrossRef]
- Gong, Z.; Ju, B.; Wan, H. Green fluorescent protein (GFP) transgenic fish and their applications. Genetica 2001, 111, 213–225. [Google Scholar] [CrossRef]
- Rehbein, H.; Bogerd, J. Identification of genetically modified zebrafish (Danio rerio) by protein-and DNA-analysis. J. Für Verbrauch. Lebensm. 2007, 2, 122–125. [Google Scholar] [CrossRef]
- Tonelli, F.M.; Lacerda, S.M.; Tonelli, F.C.; Costa, G.M.; de Franca, L.R.; Resende, R.R. Progress and biotechnological prospects in fish transgenesis. Biotechnol. Adv. 2017, 35, 832–844. [Google Scholar] [CrossRef]
- Green, D.P. Genetically Engineered Salmon Approved for Food by US FDA. J. Aquat. Food Prod. Technol. 2016, 25, 145–146. [Google Scholar] [CrossRef] [Green Version]
- Debode, F.; Janssen, E.; Marien, A.; Devlin, R.H.; Lieske, K.; Mankertz, J.; Berben, G. Detection of transgenic Atlantic and Coho salmon by real-time PCR. Food Anal. Methods 2018, 11, 2396–2406. [Google Scholar] [CrossRef]
- Masri, S.; Rast, H.; Ripley, T.; James, D.; Green, M.; Jia, X.; Devlin, R.H. Detection of genetically modified coho salmon using polymerase chain reaction (PCR) amplification. J. Agric. Food Chem. 2002, 50, 3161–3164. [Google Scholar] [CrossRef]
- Hafsa, A.B.; Nabi, N.; Zellama, M.S.; Said, K.; Chaouachi, M. A new specific reference gene based on growth hormone gene (GH1) used for detection and relative quantification of Aquadvantage® GM salmon (Salmo salar L.) in food products. Food Chem. 2016, 190, 1040–1045. [Google Scholar] [CrossRef]
- Kishimoto, K.; Washio, Y.; Yoshiura, Y.; Toyoda, A.; Ueno, T.; Fukuyama, H.; Kato, K.; Kinoshita, M. Production of a breed of red sea bream Pagrus major with an increase of skeletal muscle mass and reduced body length by genome editing with CRISPR/Cas9. Aquaculture 2018, 495, 415–427. [Google Scholar] [CrossRef]
- Hallerman, E. Genome editing in cultured fishes. CABI Agric. Biosci. 2021, 2, 46. [Google Scholar] [CrossRef]
- Van Eenennaam, A.; Olin, P. Careful risk assessment needed to evaluate transgenic fish. Calif. Agric. 2006, 60, 126–131. [Google Scholar]
- Pan, X.; Wan, H.; Chia, W.; Tong, Y.; Gong, Z. Demonstration of site-directed recombination in transgenic zebrafish using the Cre/loxP system. Transgenic Res. 2005, 14, 217–223. [Google Scholar] [CrossRef]
- Doyon, Y.; McCammon, J.M.; Miller, J.C.; Faraji, F.; Ngo, C.; Katibah, G.E.; Amora, R.; Hocking, T.D.; Zhang, L.; Rebar, E.J. Heritable targeted gene disruption in zebrafish using designed zinc-finger nucleases. Nat. Biotechnol. 2008, 26, 702–708. [Google Scholar] [CrossRef] [Green Version]
- Huang, P.; Xiao, A.; Zhou, M.; Zhu, Z.; Lin, S.; Zhang, B. Heritable gene targeting in zebrafish using customized TALENs. Nat. Biotechnol. 2011, 29, 699–700. [Google Scholar] [CrossRef]
- Hwang, W.Y.; Fu, Y.; Reyon, D.; Maeder, M.L.; Tsai, S.Q.; Sander, J.D.; Peterson, R.T.; Yeh, J.; Joung, J.K. Efficient genome editing in zebrafish using a CRISPR-Cas system. Nat. Biotechnol. 2013, 31, 227–229. [Google Scholar] [CrossRef] [Green Version]
- Zhang, Y.; Qin, W.; Lu, X.; Xu, J.; Huang, H.; Bai, H.; Li, S.; Lin, S. Programmable base editing of zebrafish genome using a modified CRISPR-Cas9 system. Nat. Commun. 2017, 8, 118. [Google Scholar] [CrossRef] [Green Version]
- Amsterdam, A.; Lin, S.; Hopkins, N. The Aequorea victoria green fluorescent protein can be used as a reporter in live zebrafish embryos. Dev. Biol. 1995, 171, 123–129. [Google Scholar] [CrossRef] [PubMed]
- Gong, Z.; Wan, H.; Tay, T.L.; Wang, H.; Chen, M.; Yan, T. Development of transgenic fish for ornamental and bioreactor by strong expression of fluorescent proteins in the skeletal muscle. Biochem. Biophys. Res. Commun. 2003, 308, 58–63. [Google Scholar] [CrossRef] [PubMed]
- Soga, K.; Nakamura, K.; Ishigaki, T.; Kimata, S.; Ohmori, K.; Kishine, M.; Mano, J.; Takabatake, R.; Kitta, K.; Nagoya, H. Development of a novel method for specific detection of genetically modified Atlantic salmon, AquAdvantage, using real-time polymerase chain reaction. Food Chem. 2020, 305, 125426. [Google Scholar] [CrossRef] [PubMed]
- Du, S.J.; Gong, Z.; Fletcher, G.L.; Shears, M.A.; Hew, C.L. Growth hormone gene transfer in Atlantic salmon: Use of fish antifreeze/growth hormone chimeric gene construct. In Transgenic Fish; World Scientific: Singapore, 1992; pp. 176–189. [Google Scholar]
- Shears, M.; Fletcher, G.; Hew, C.; Gauthier, S.; Davies, P. Transfer, expression, and stable inheritance of antifreeze protein genes in Atlantic salmon (Salmo salar). Mol. Mar. Biol. Biotechnol. 1991, 1, 58. [Google Scholar]
- Hernández, O.; Castro, F.; Aguilar, A.; Uliver, C.; Pérez, A.; Herrera, L.; de la Fuente, J. Gene transfer in common carp (CyprinuscarpioL.) by microinjection into the germinal disc. Theriogenology 1991, 35, 625–632. [Google Scholar] [CrossRef]
- Zhang, P.; Hayat, M.; Joyce, C.; Gonzalez-Villaseñor, L.I.; Lin, C.; Dunham, R.A.; Chen, T.T.; Powers, D.A. Gene transfer, expression and inheritance of pRSV-rainbow trout-GH cDNA in the common carp, Cyprinus carpio (Linnaeus). Mol. Reprod. Dev. 1990, 25, 3–13. [Google Scholar] [CrossRef]
- Zhu, Z.; He, L.; Chen, S. Novel gene transfer into the fertilized eggs of gold fish (Carassius auratus L. 1758). J. Appl. Ichthyol. 1985, 1, 31–34. [Google Scholar] [CrossRef]
- Gross, M.L.; Schneider, J.F.; Moav, N.; Moav, B.; Alvarez, C.; Myster, S.H.; Liu, Z.; Hallerman, E.M.; Hackett, P.B.; Guise, K.S. Molecular analysis and growth evaluation of northern pike (Esox Iucius) microinjected with growth hormone genes. Aquaculture 1992, 103, 253–273. [Google Scholar] [CrossRef]
- Kishimoto, K.; Washio, Y.; Murakami, Y.; Katayama, T.; Kuroyanagi, M.; Kato, K.; Yoshiura, Y.; Kinoshita, M. An effective microinjection method for genome editing of marine aquaculture fish: Tiger pufferfish Takifugu rubripes and red sea bream Pagrus major. Fish. Sci. 2019, 85, 217–226. [Google Scholar] [CrossRef]
- Ohama, M.; Washio, Y.; Kishimoto, K.; Kinoshita, M.; Kato, K. Growth performance of myostatin knockout red sea bream Pagrus major juveniles produced by genome editing with CRISPR/Cas9. Aquaculture 2020, 529, 735672. [Google Scholar] [CrossRef]
- Chiou, P.P.; Chen, M.J.; Lin, C.-M.; Khoo, J.; Larson, J.; Holt, R.; Leong, J.-A.; Thorgarrd, G.; Chen, T.T. Production of homozygous transgenic rainbow trout with enhanced disease resistance. Mar. Biotechnol. 2014, 16, 299–308. [Google Scholar] [CrossRef] [Green Version]
- Chae, J.-S.; Wang, H.-Y.; Han, J.-C.; Cho, M.; Park, J.; Choi, M.-S.; Choi, S.-H. Detection of Living Modified Rainbow Trout and Super Mud Loach by Real-time TAQ Man PCR. In Proceedings of the 11th International Conference of the Association of Institutions for Tropical Veterinary Medicine, Serdang, Malaysia, 23–27 August 2004; p. 390. [Google Scholar]
- Rahman, M.A.; Maclean, N. Production of transgenic tilapia (Oreochromis niloticus) by one-cell-stage microinjection. Aquaculture 1992, 105, 219–232. [Google Scholar] [CrossRef]
- Brem, G.; Brenig, B.; Hörstgen-Schwark, G.; Winnacker, E.-L. Gene transfer in tilapia (Oreochromis niloticus). Aquaculture 1988, 68, 209–219. [Google Scholar] [CrossRef]
- Ju, B.; Xu, Y.; He, J.; Liao, J.; Yan, T.; Hew, C.L.; Lam, T.J.; Gong, Z. Faithful expression of green fluorescent protein (GFP) in transgenic zebrafish embryos under control of zebrafish gene promoters. Dev. Genet. 1999, 25, 158–167. [Google Scholar] [CrossRef]
- Wan, H.; He, J.; Ju, B.; Yan, T.; Lam, T.J.; Gong, Z. Generation of two-color transgenic zebrafish using the green and red fluorescent protein reporter genes gfp and rfp. Mar. Biotechnol. 2002, 4, 146–154. [Google Scholar] [CrossRef]
- Tanner, N.A.; Zhang, Y.; Evans, T.C., Jr. Simultaneous multiple target detection in real-time loop-mediated isothermal amplification. Biotechniques 2012, 53, 81–89. [Google Scholar] [CrossRef] [Green Version]
- Preckel, L.; Brünen-Nieweler, C.; Denay, G.; Petersen, H.; Cichna-Markl, M.; Dobrovolny, S.; Hochegger, R. Identification of mammalian and poultry species in food and pet food samples using 16s rdna metabarcoding. Foods 2021, 10, 2875. [Google Scholar] [CrossRef]
- Gense, K.; Peterseil, V.; Licina, A.; Wagner, M.; Cichna-Markl, M.; Dobrovolny, S.; Hochegger, R. Development of a DNA Metabarcoding Method for the Identification of Bivalve Species in Seafood Products. Foods 2021, 10, 2618. [Google Scholar] [CrossRef]
- Yue, G.H.; Orban, L. Rapid isolation of DNA from fresh and preserved fish scales for polymerase chain reaction. Mar. Biotechnol. 2001, 3, 199–204. [Google Scholar] [CrossRef]
- Alvarado Bremer, J.; Smith, B.L.; Moulton, D.; Lu, C.P.; Cornic, M. Shake and stew: A non-destructive PCR-ready DNA isolation method from a single preserved fish larva. J. Fish Biol. 2014, 84, 267–272. [Google Scholar] [CrossRef]
- Martínez, G.; Shaw, E.M.; Carrillo, M.; Zanuy, S. Protein salting-out method applied to genomic DNA isolation from fish whole blood. Biotechniques 1998, 24, 238–239. [Google Scholar] [CrossRef] [PubMed] [Green Version]
- Mukhopadhyay, T.; Bhattacharjee, S. Standardization of genomic DNA isolation from minute quantities of fish scales and fins amenable to RAPD-PCR. Proc. Zool. Soc. 2014, 67, 28–32. [Google Scholar] [CrossRef]
- Kenk, M.; Panter, S.; Engler-Blum, G.; Bergemann, J. Sensitive DNA-based allergen detection depends on food matrix and DNA isolation method. Eur. Food Res. Technol. 2012, 234, 351–359. [Google Scholar] [CrossRef]
- Rahman, M.A.; Mak, R.; Ayad, H.; Smith, A.; Maclean, N. Expression of a novel piscine growth hormone gene results in growth enhancement in transgenic tilapia (Oreochromis niloticus). Transgenic Res. 1998, 7, 357–370. [Google Scholar] [CrossRef] [PubMed]
- Zhu, Z. Generation of fast growing transgenic fish: Methods and mechanisms. In Transgenic Fish; World Scientific: Singapore, 1992; pp. 92–119. [Google Scholar]
- Shahi, N.; Mallik, S.K.; Sarma, D. Muscle growth in targeted knockout common carp (Cyprinus carpio) mstn gene with low off-target effects. Aquaculture 2022, 547, 737423. [Google Scholar] [CrossRef]
- Yang, Z.; Yu, Y.; Tay, Y.X.; Yue, G.H. Genome editing and its applications in genetic improvement in aquaculture. Rev. Aquac. 2022, 14, 178–191. [Google Scholar] [CrossRef]
- Forabosco, F.; Löhmus, M.; Rydhmer, L.; Sundström, L.F. Genetically modified farm animals and fish in agriculture: A review. Livest. Sci. 2013, 153, 1–9. [Google Scholar] [CrossRef]
- Chen, T.T.; Vrolijk, N.H.; Lu, J.-K.; Lin, C.-M.; Reimschuessel, R.; Dunham, R.A. Transgenic fish and its application in basic and applied research. Biotechnol. Annu. Rev. 1996, 2, 205–236. [Google Scholar]
- Sarmasik, A.; Warr, G.; Chen, T.T. Production of transgenic medaka with increased resistance to bacterial pathogens. Mar. Biotechnol. 2002, 4, 310–322. [Google Scholar] [CrossRef]
- Gabillard, J.-C.; Rallière, C.; Sabin, N.; Rescan, P.-Y. The production of fluorescent transgenic trout to study in vitro myogenic cell differentiation. BMC Biotechnol. 2010, 10, 39. [Google Scholar] [CrossRef] [Green Version]
- Zeng, Z.; Shan, T.; Tong, Y.; Lam, S.H.; Gong, Z. Development of estrogen-responsive transgenic medaka for environmental monitoring of endocrine disrupters. Environ. Sci. Technol. 2005, 39, 9001–9008. [Google Scholar] [CrossRef]
- Bowman, T.V.; Zon, L.I. Swimming into the future of drug discovery: In vivo chemical screens in zebrafish. ACS Chem. Biol. 2010, 5, 159–161. [Google Scholar] [CrossRef] [Green Version]
- Hrytsenko, O.; Rayat, G.R.; Xu, B.-Y.; Krause, R.; Pohajdak, B.; Rajotte, R.V.; Wright, J.R., Jr. Lifelong stable human insulin expression in transgenic tilapia expressing a humanized tilapia insulin gene. Transgenic Res. 2011, 20, 1397. [Google Scholar] [CrossRef]
- Pohajdak, B.; Mansour, M.; Hrytsenko, O.; Michael Conlon, J.; Clayton Dymond, L.; Wright, J.R., Jr. Production of transgenic tilapia with Brockmann bodies secreting [desThrB30] human insulin. Transgenic Res. 2004, 13, 313–323. [Google Scholar] [CrossRef]


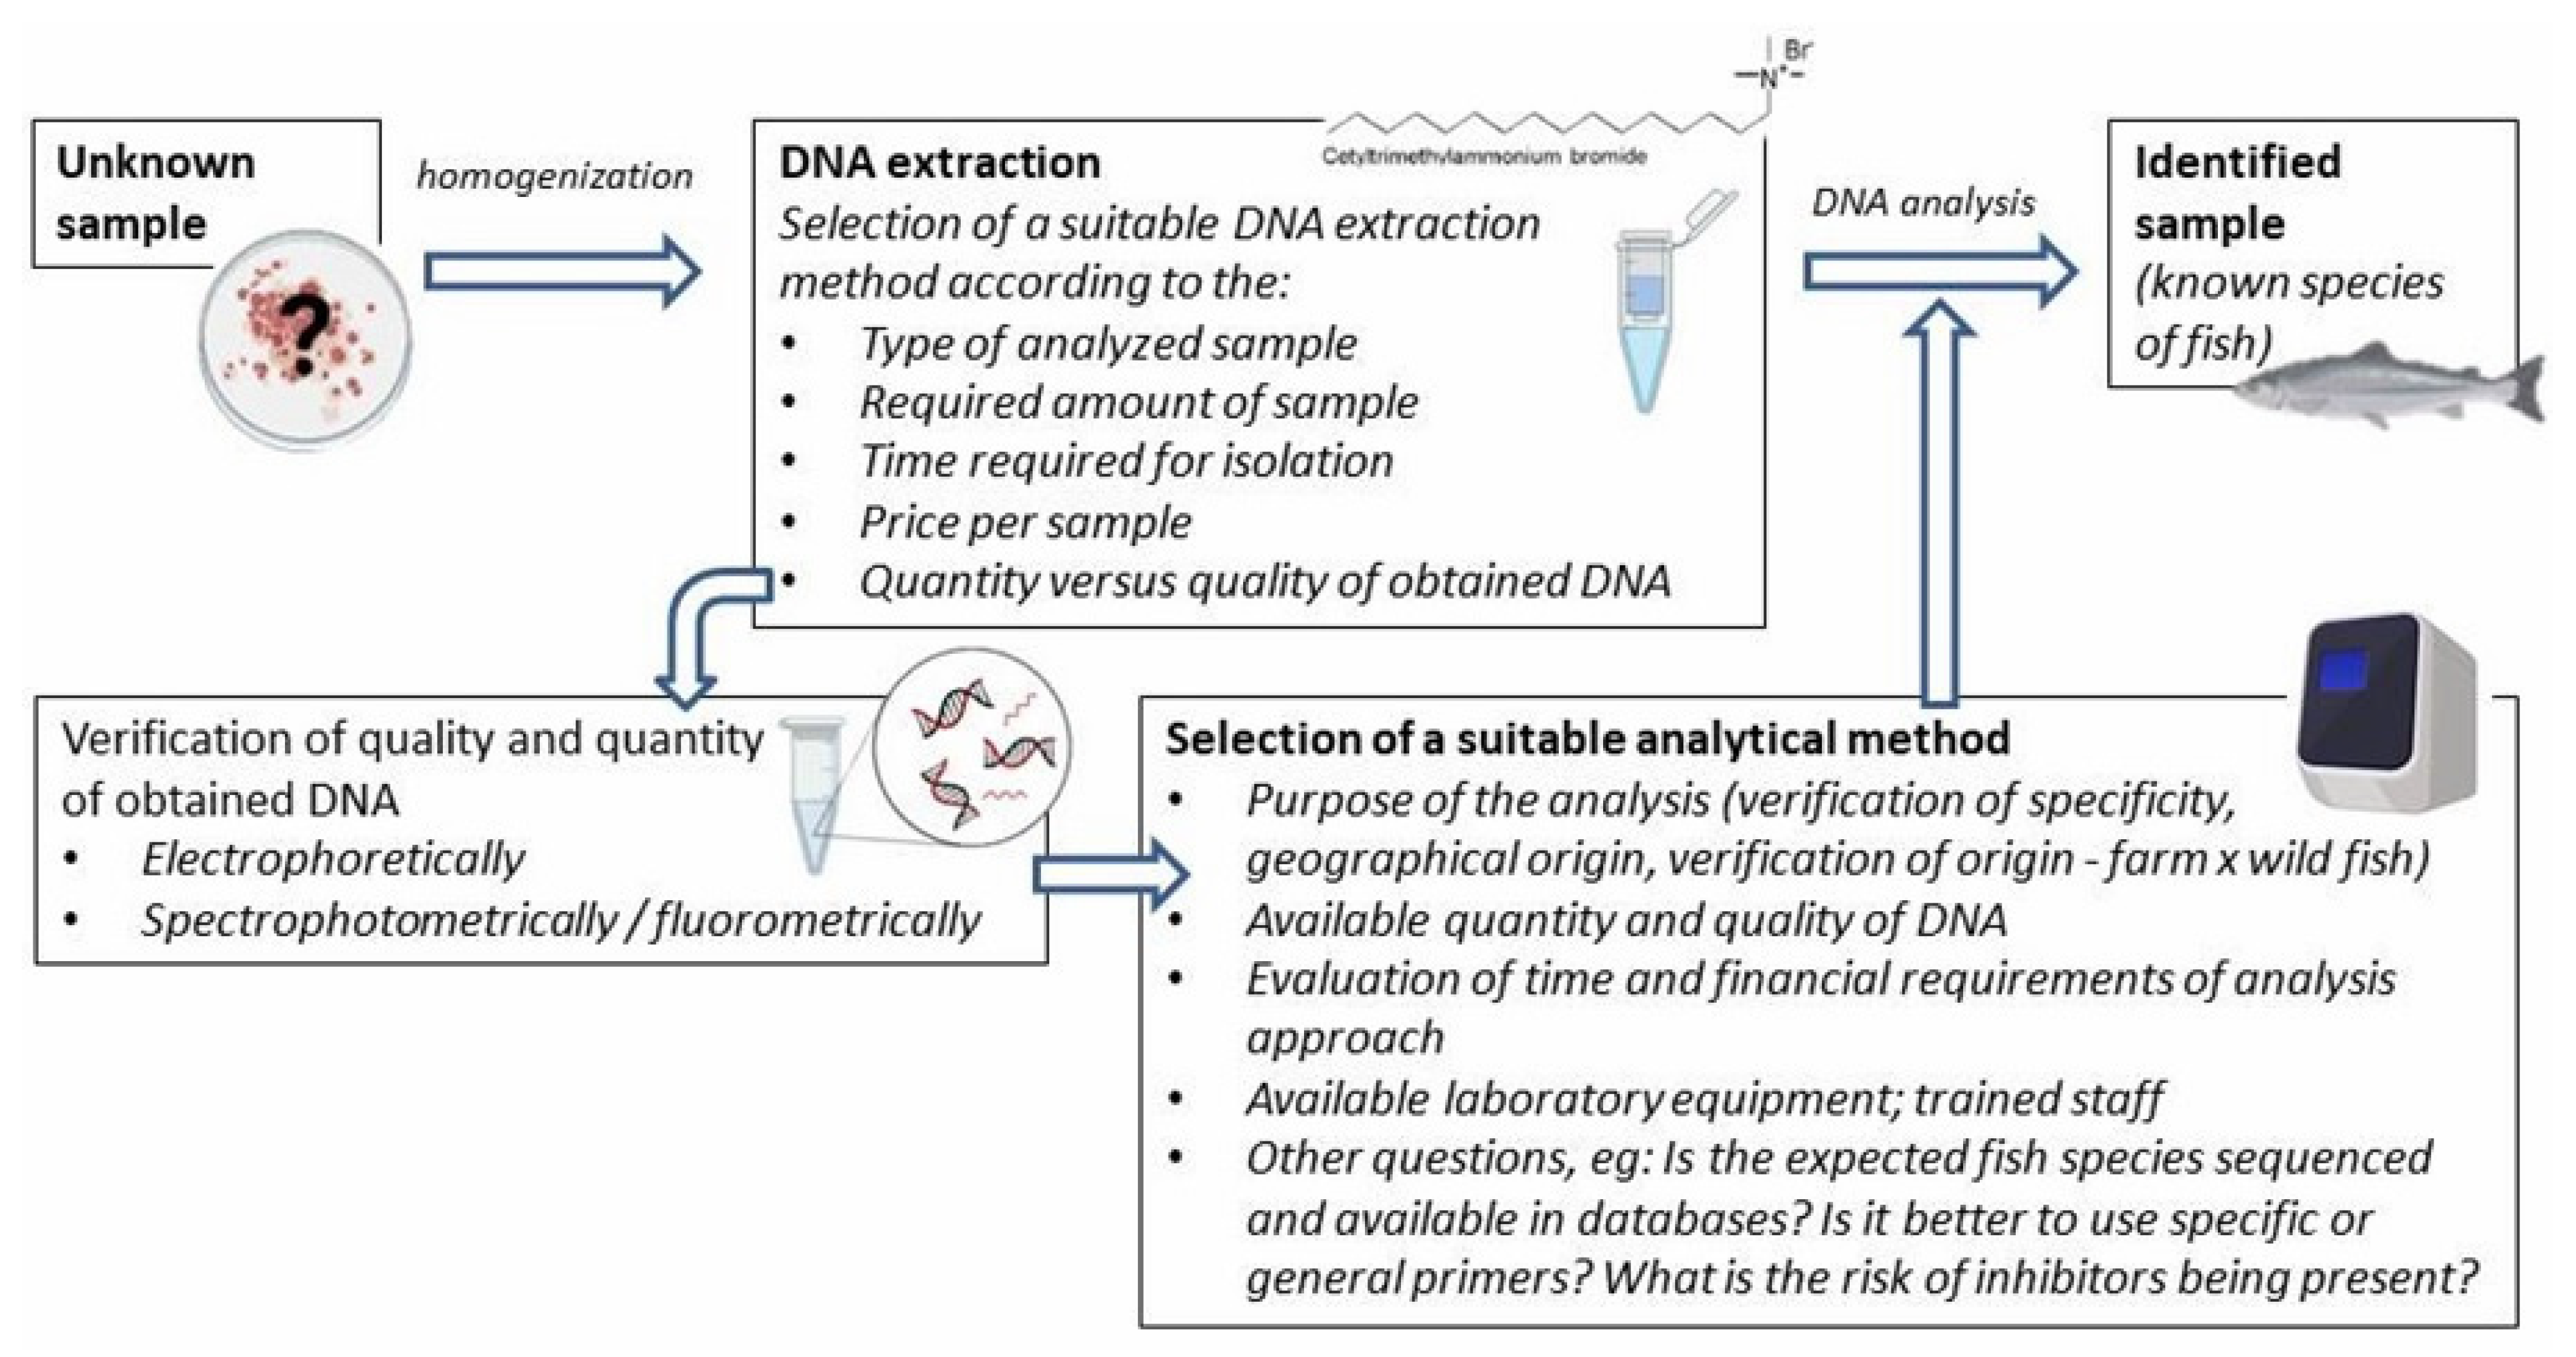
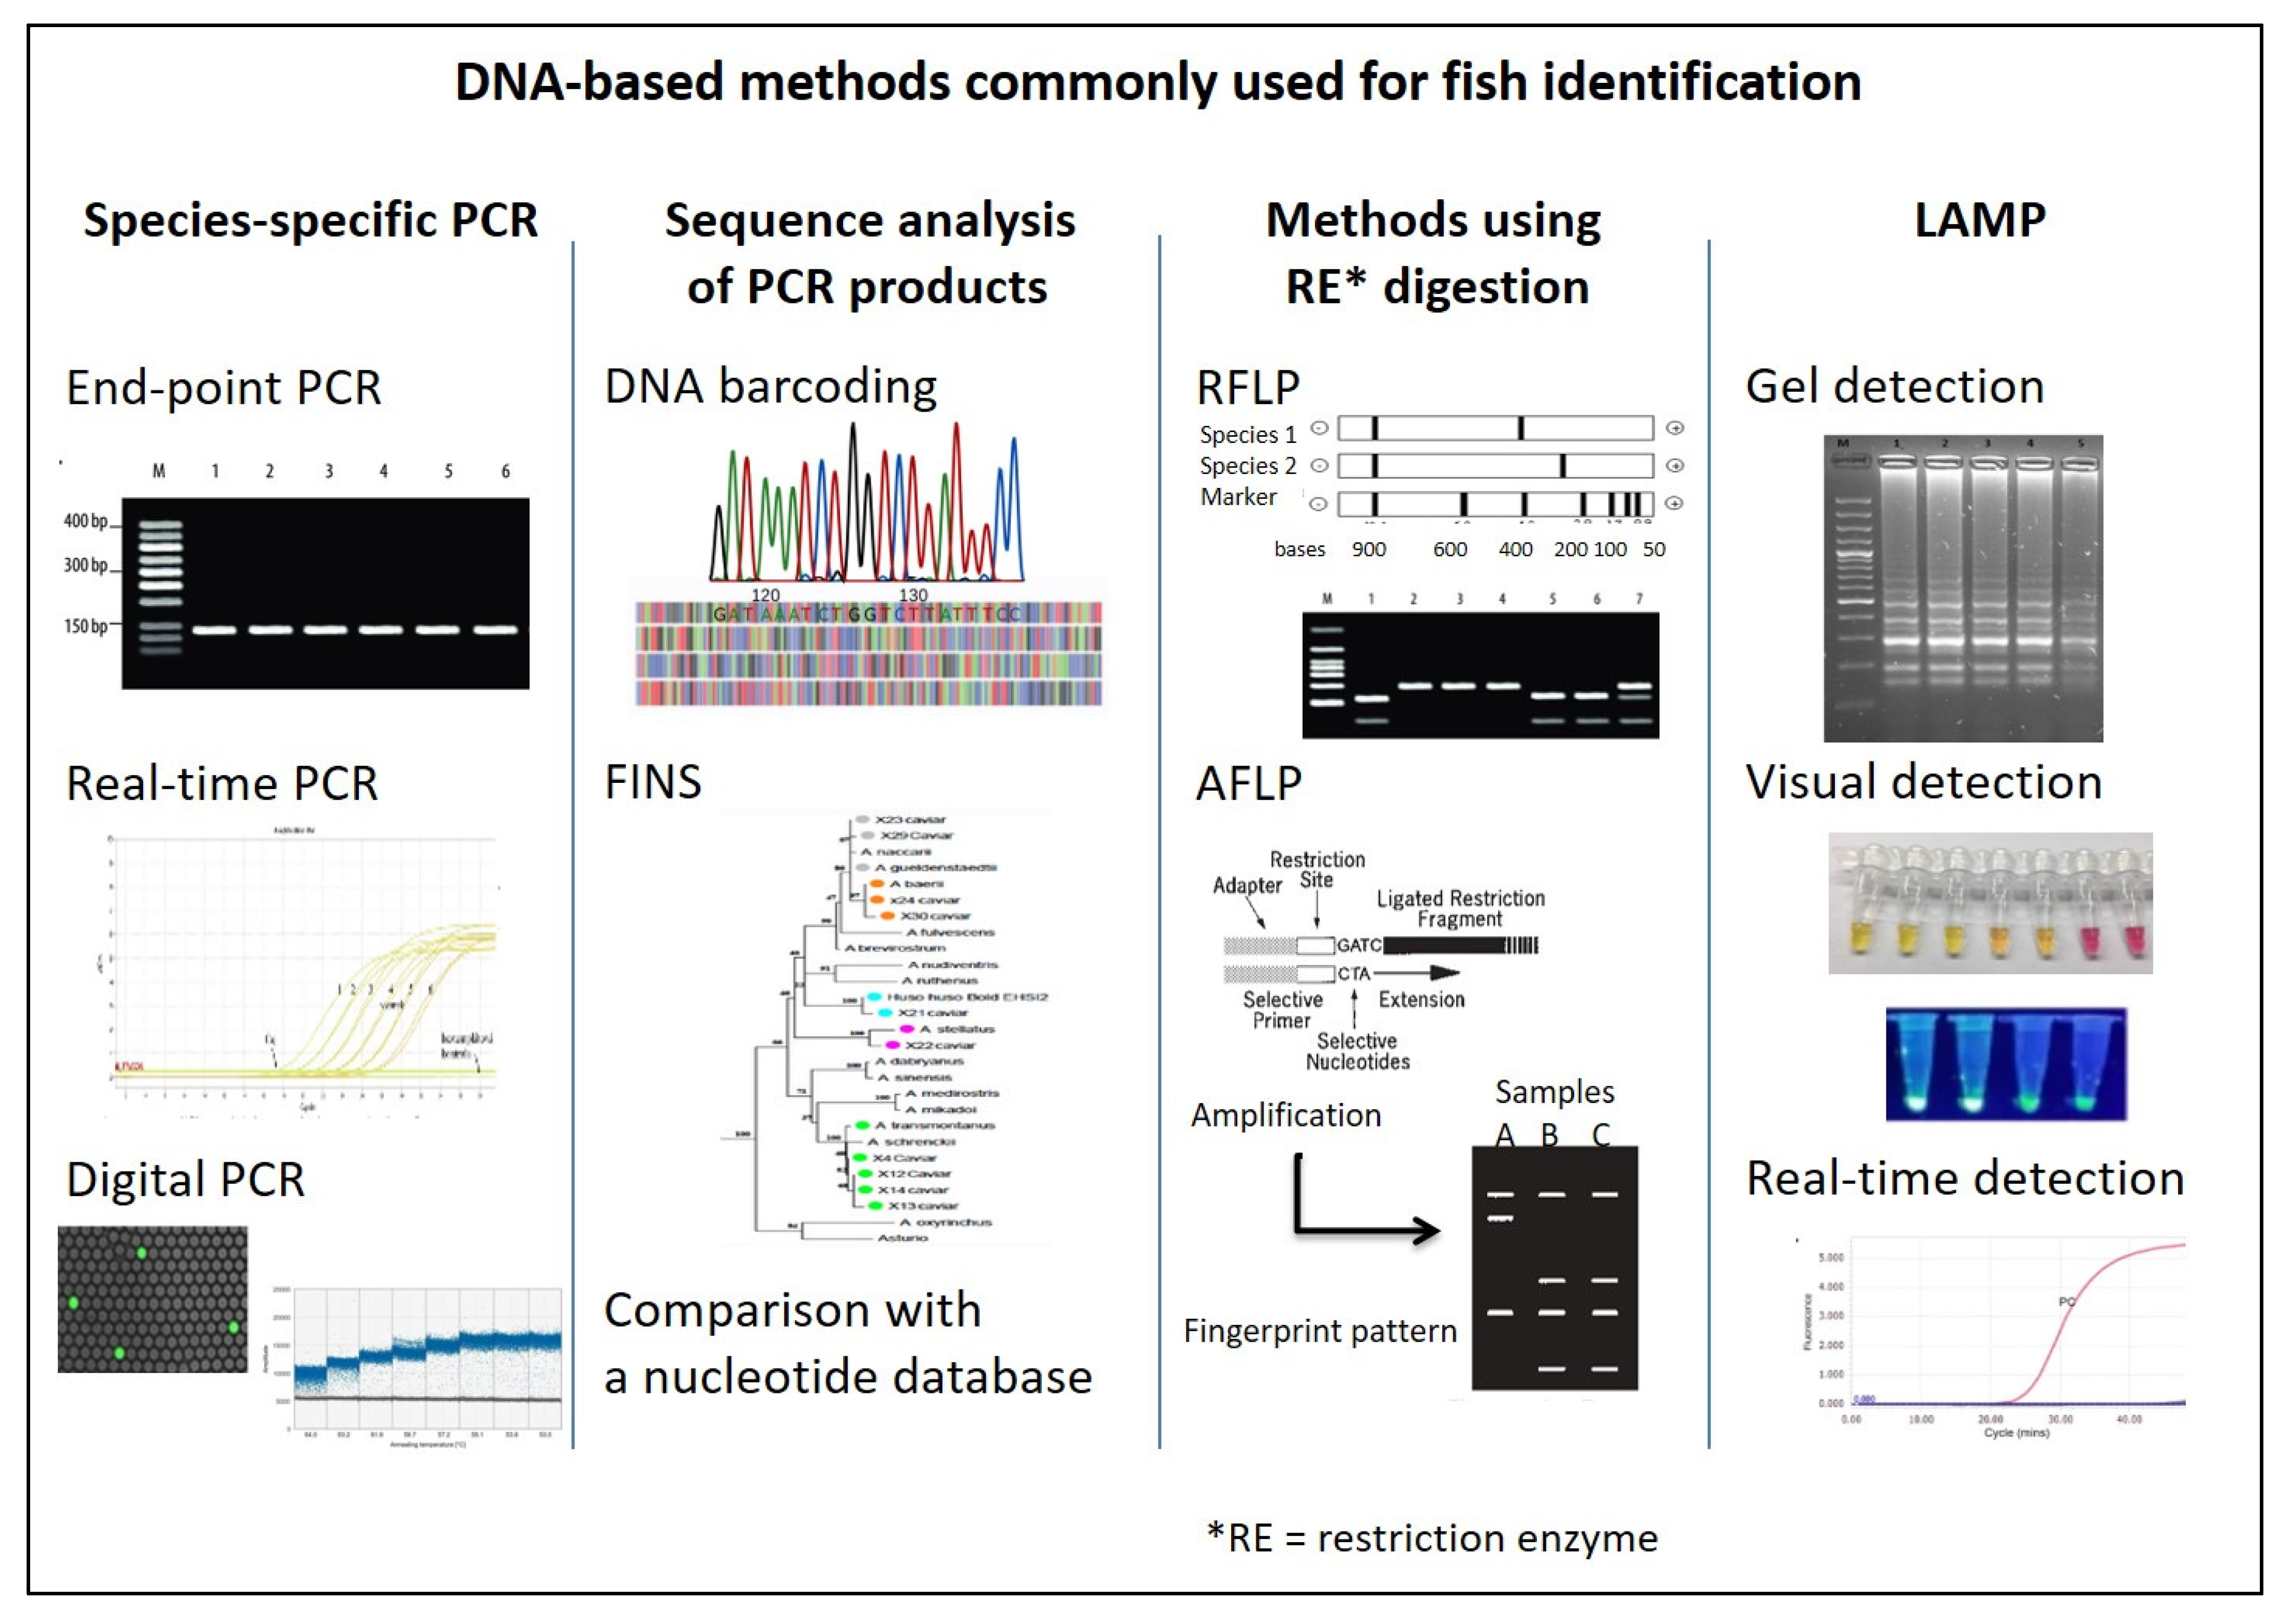
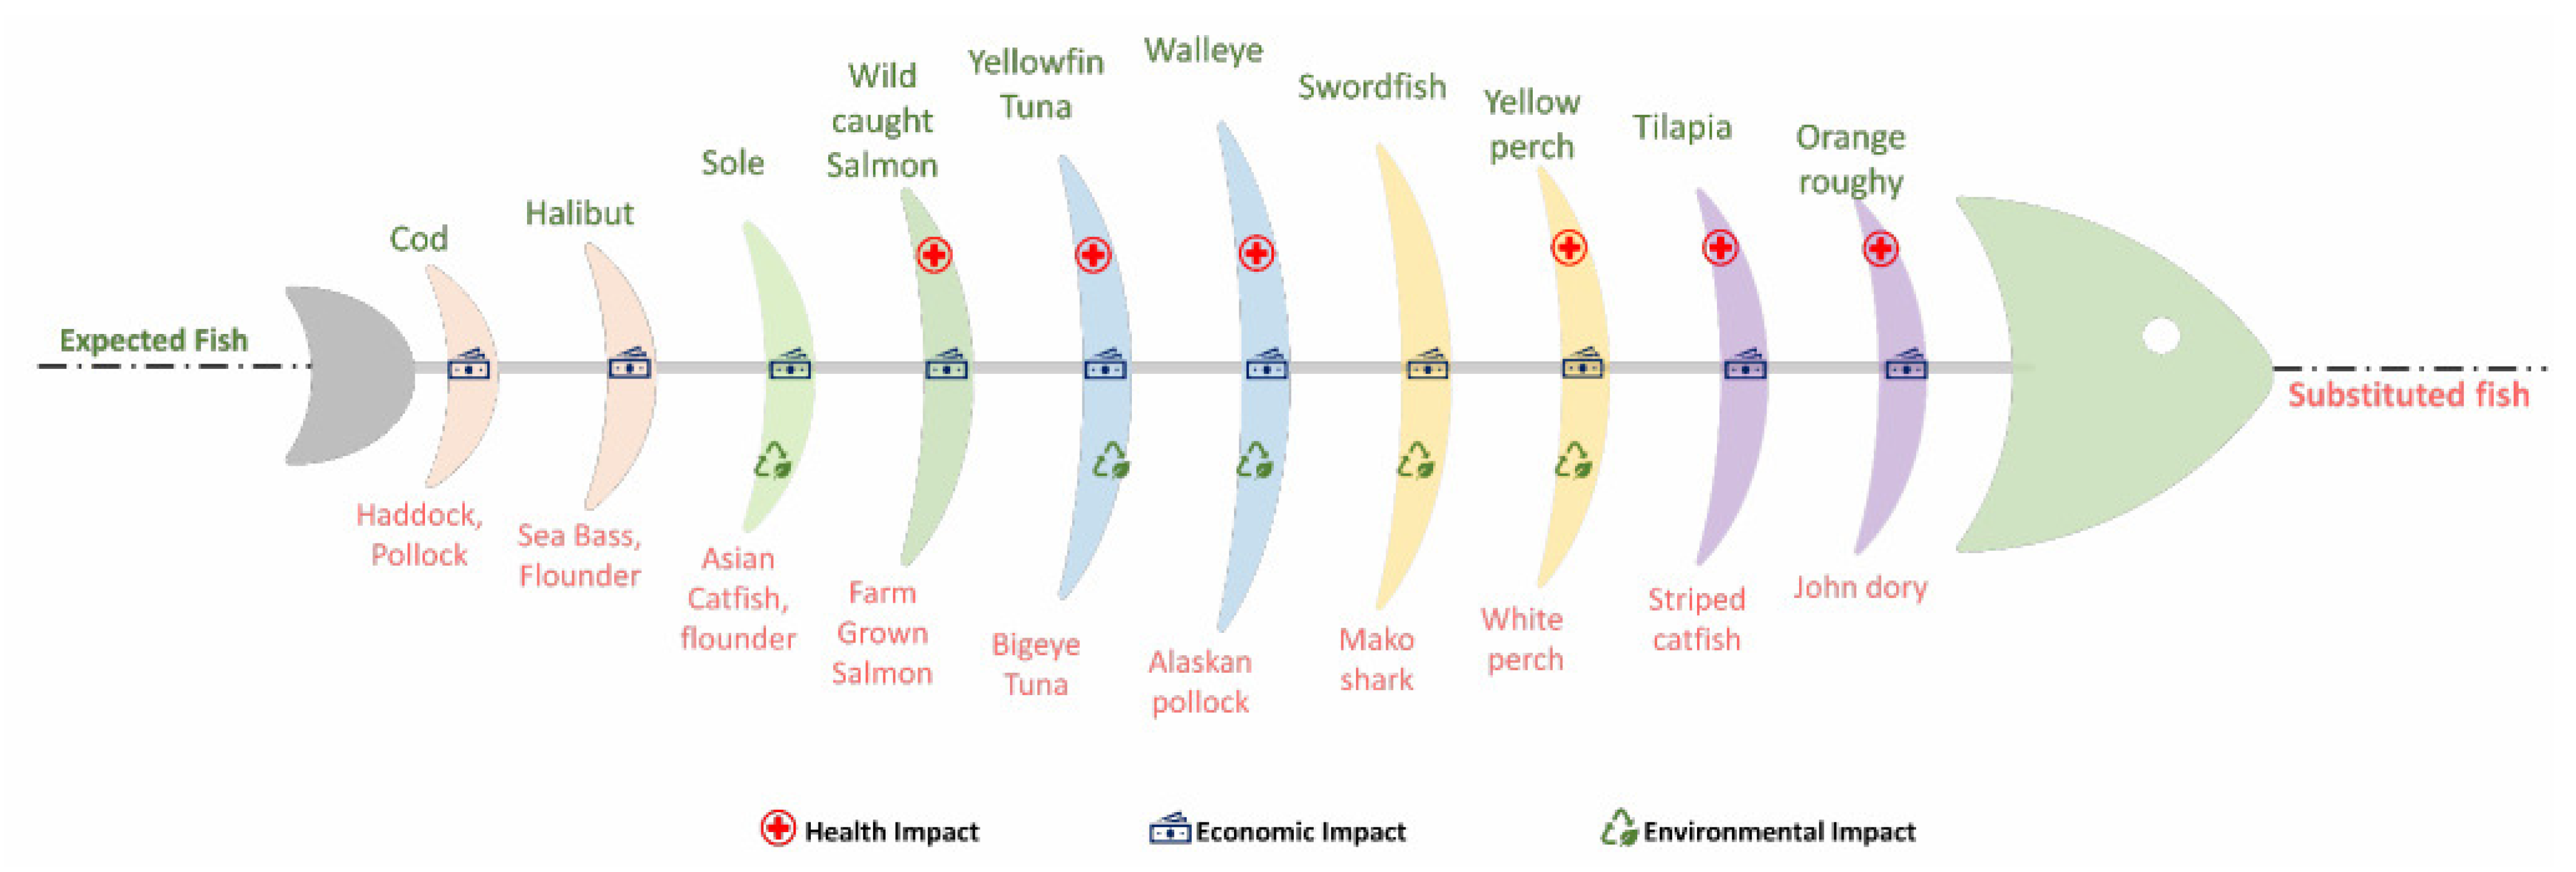
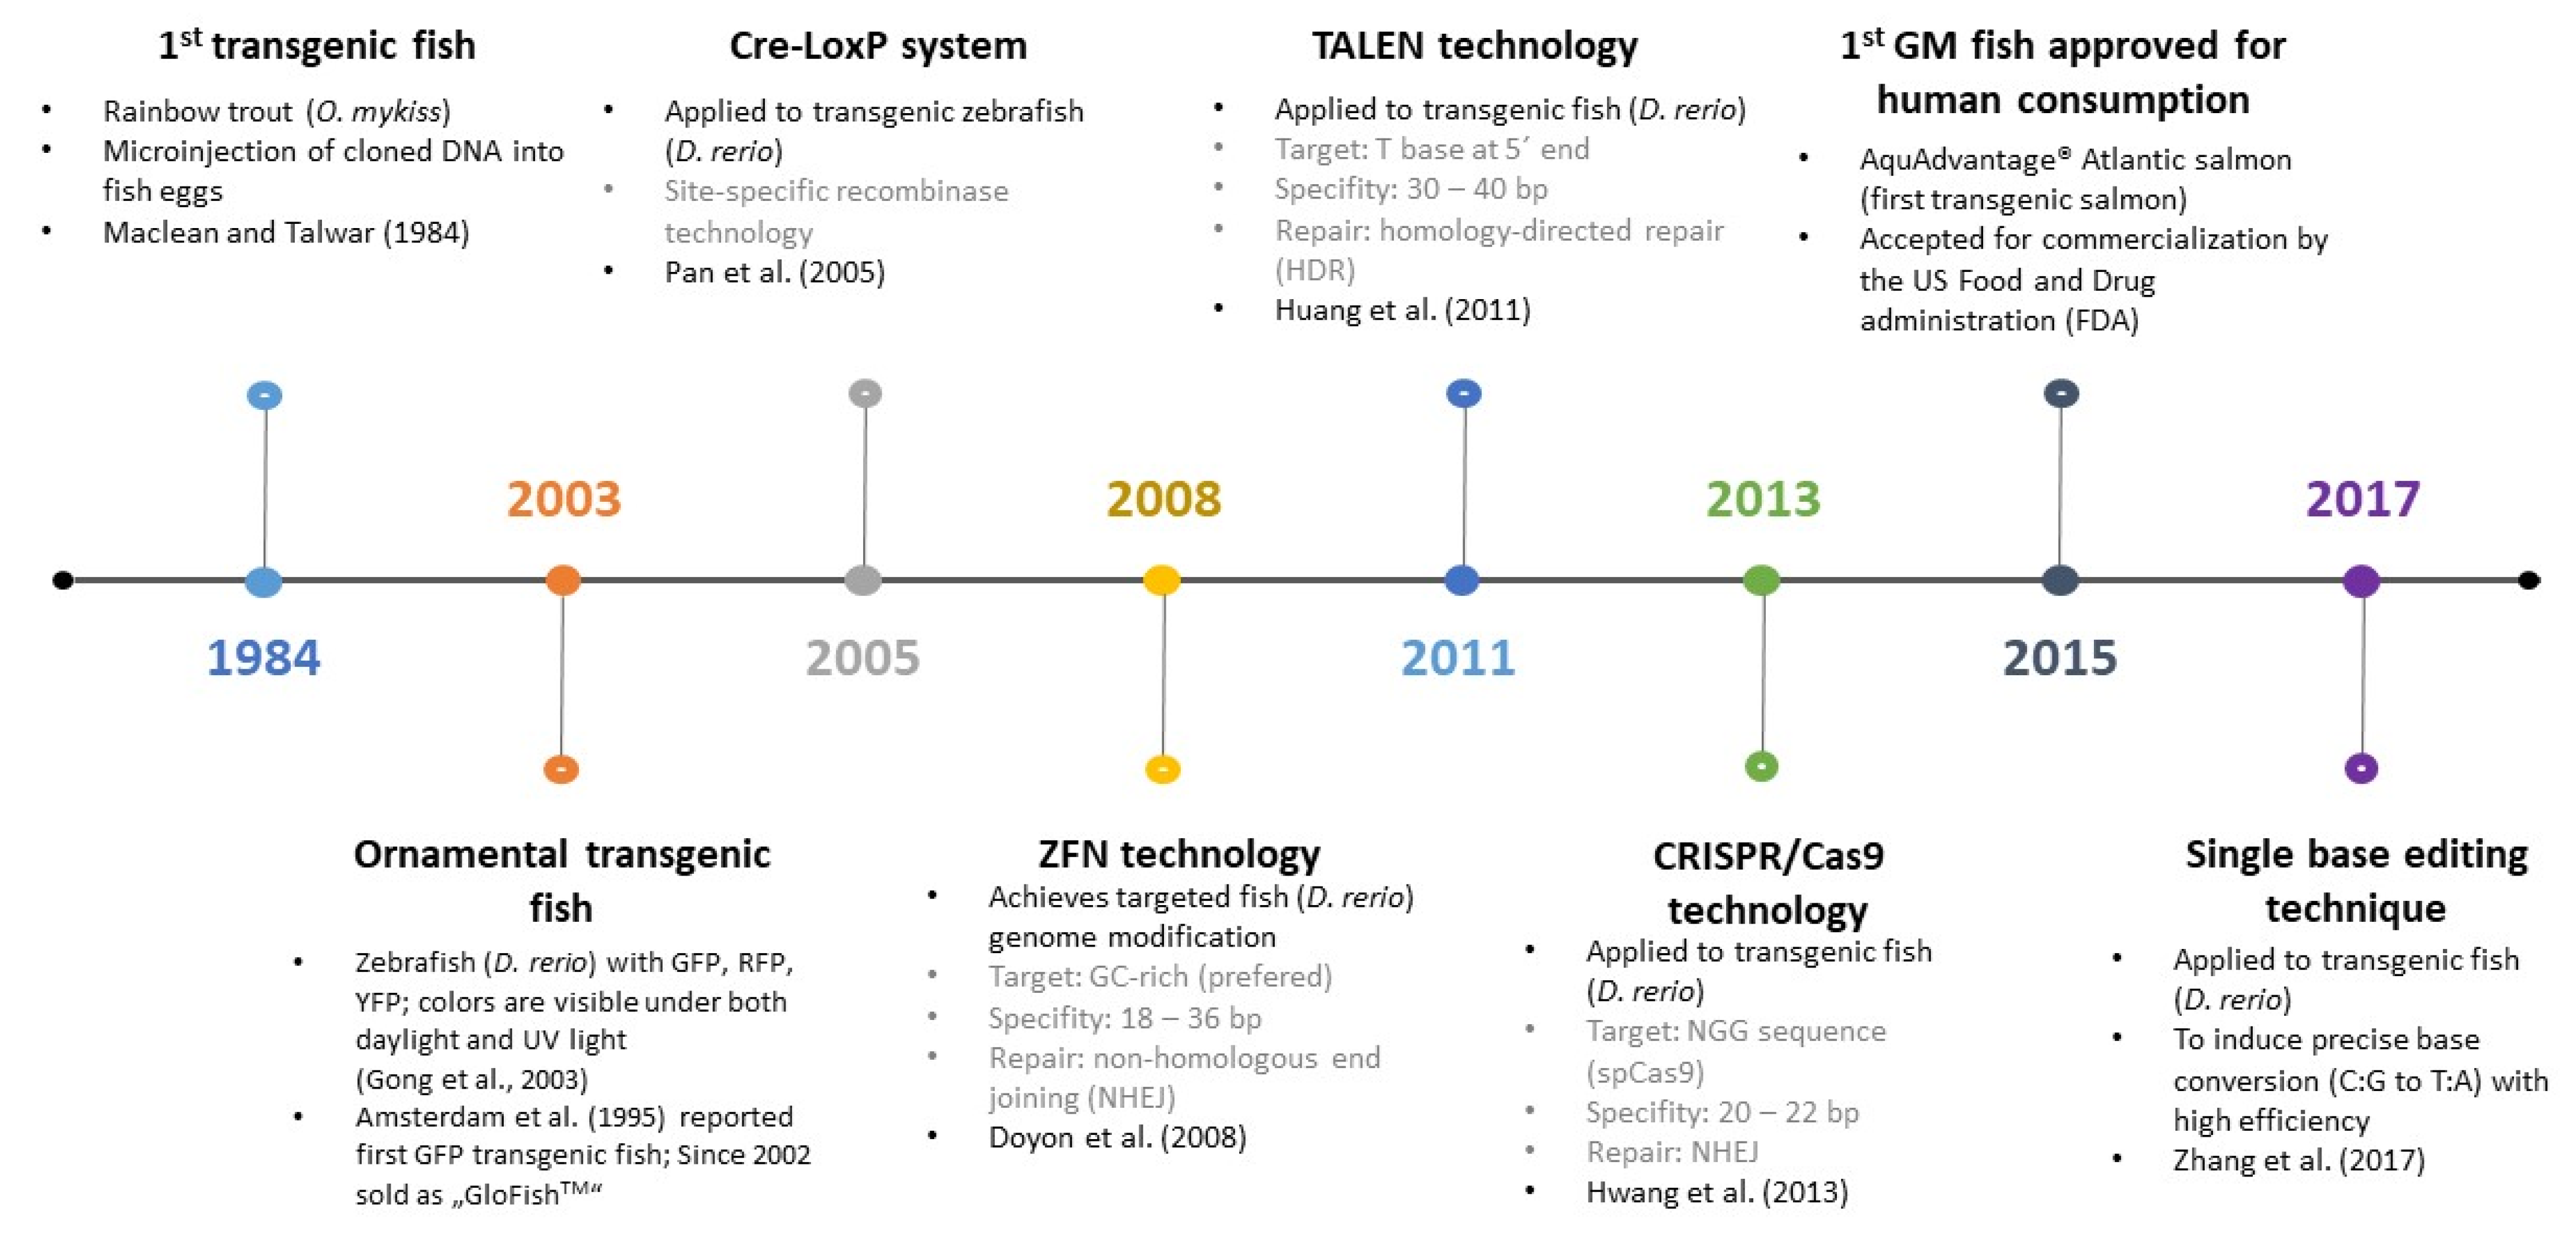
| Family | Genus | Detection Method | DNA Marker * | Declared Species Specifity | References | |
|---|---|---|---|---|---|---|
| Gene | Type | |||||
| Anguillidae | Eel (Anguilla) | PCR-RFLP, PCR-SSCP | cytb | mtDNA | A. anguilla, A. australis, A. rostrate, A. japonica | Rehbein et al. [87] |
| AFLP | - (genomic DNA) | nDNA | A. anguilla | Maldini et al. [88] | ||
| Carangidae | Horse mackerel (Trachurus) | FINS | cytb | mtDNA | 25 species (22 Carangidae, 1 Mullidae, 2 Scombridae species) | Lago et al. [89] |
| real-time PCR | pvb | nDNA | T. trachurus, S. scombrus | Prado et al. [90] | ||
| Clupeidae | Sardines (Sardina) | PCR-RFLP | cytb | mtDNA | B. aurea, C. harengus, +C. edentulous (Engraulidae) | Leonardo et al. [91] |
| Sardines, Sprat, Herrings (Sardina, Sardinella, Sprattus, Clupea) | FINS, searching in BLAST | 16S rRNA | mtDNA | S. pilchardus, S. aurita, S. sprattus, C. harengus +Fish species from Engraulidae, Salangidae and Scombridae family | Armani et al. [92] | |
| Sardines (Sardina) | DNA barcoding, real-time PCR | COI | mtDNA | S. pilchardus +other sardine species (identification by DNA barcoding) | Xiong et al. [93] | |
| Cyprinidae | Carp (Cyprinus) | real-time PCR | D-loop area | mtDNA | C. carpio | Bajzik et al. [94] |
| Carp, Barbell, Minnow (Acrossocheilus, Candidia, Carassius, Ctenopharyngodon, Cyprinus, Varicorhinus, Hemibarbus, Zacco) | PCR-RFLP, FINS | cytb | mtDNA | A. paradoxus, C. auratus auratus, C. barbatus, C. carpio carpio, C. idella, H. labeo, V. barbatulus, Z. pachycephalus | Chen et al. [95] | |
| Carp, Barbell, Minnow, Gudgeon, Bitterling (Acrossocheilus, Candidia, Carassius, Ctenopharyngodon, Cyprinus, Varicorhinus, Hemibarbus, Zacco, Pseudorasbora, Rhodeus) | PCR-RFLP | cytb | mtDNA | A. paradoxus, C. auratus auratus, C. barbatus, C. carpio carpio, C. idella, H. labeo, P. parva, R. ocellatus ocellatus, V. barbatulus, Z. pachycephalus. | Chen et al. [96] | |
| Carp (Cirrhinus, Labeo) | RAPD | - | genome | C.catla, L. rohita, L. calbasu, C. mrigala | Barman et al. [97] | |
| Esocidae | Pike (Esox) | microsatellites | 7 microsatellite loci in genome | E. lucius | Lucentini et al. [98] | |
| AFLP | COI, cytb | mtDNA | E. lucius, E. flaviae | Lucentini et al. [99] | ||
| DNA minibarcoding, PCR | COI, Plagl2 | mtDNA, nDNA | E. lucius, E. aquitanicus | Denys et al. [100] | ||
| Gadidae | Cod (Gadus) | LAMP, PCR | cytb | mtDNA | G. morhua | Saull et al. [101] |
| real-time PCR | COI | mtDNA | G. morhua | Herrero et al. [102] | ||
| RFLP | COI | mtDNA | G.morhua, G. macrocephalus | Mueller et al. [103] | ||
| SNPs | 8221 loci | genome | G. morhua | Poćwierz-Kotus et al. [104] | ||
| DNA barcoding, NGS | 10 nuclear barcode regions | nDNA | G.morhua, G. macrocephalus | Paracchini, Petrillo, Lievens, Kagkli and Angers-Loustau [56] | ||
| PCR-RFLP | tRNAGlu/cytb | mtDNA | G. morhua +23 species from different genus | Wolf et al. [105] | ||
| Cod, haddock (Gadus, Melanogrammus) | LAMP | cytb (+12S rDNA) | mtDNA | G. morhua, G. macrocephalus, M. aeglefinus | Wang, Feng and Tian [44] | |
| Cod, pollock (Gadus, Theragra) | LAMP | cytb | mtDNA | G. morhua, G. macrocephalus, T. chalcogramma +two oilfish species (R. pretiosus, L. flavobrunneum) | Li et al. [106] | |
| Cod, haddock, Pollock (Gadus, Melanogrammus, Theragra) | PCR | PanI | nDNA | G. morhua, M. poutassou, M. merlangus, P. virens, T. chalcogrammaz +Merluccius spp. | Hubalkova, Kralik, Kasalova and Rencova [33] | |
| HRM | 12S rRNA | mtDNA | G. morhua, G. macrocephalus, G. chalcogrammus, P. virens, M. aeglefinusz +M. merluccius, M. australis, A. pectoralis | Shi et al. [107] | ||
| Cod, escolar (Gadus, Lepidocybium) | PCR-RFLP | cytb | mtDNA | G. morhua, G. microcephalus, L. flavobrunneum +R. pretiosus, R. hippoglossoides | Hwang et al. [108] | |
| Haddock (Melanogrammus) | real-time PCR | transferrin | nDNA | M. aeglefinus | Hird et al. [109] | |
| Lophiidae | Angler (Lophius) | FINS, PCR-RFLP | COI | mtDNA | L. budegassa, L. vomerinus, L. piscatorius | Espineira et al. [110] |
| RAPD | - | genome | L. gastrophysus | Ramella et al. [111] | ||
| real-time PCR | pvb | nDNA | L. budegassa, L. piscatorius | Mukherjee et al. [112] | ||
| Merluccidae | Hake (Merluccius) | FINS | cytb | mtDNA | M. merluccius, M. hubbsi, M. capensis, M. merluccius +G. morhua (genus Gadus) | Pepe et al. [113] |
| AFLP | - (genomic DNA) | nDNA | M. capensis +others species from different genus | Maldini, Marzano, Fortes, Papa and Gandolfi [88] | ||
| PCR-RFLP | COI | mtDNA | M. capensis, M. paradoxus, M. polli | Pappalardo and Ferrito [114] | ||
| Real-time PCR, FINS | mtDNA control region (PCR), cytb (FINS) | mtDNA | M. merluccius | Sánchez et al. [115] | ||
| PCR | PanI | nDNA | Merluccius spp. +gadoid species | Hubalkova, Kralik, Kasalova and Rencova [33] | ||
| Pleuronectidae | Flatfish (Glyptocephalus, Hippoglossoides, Kareius, Lepidopsetta, Limanda, Microstomus, Platichthys, Pleuronectes Reinhardtius, Verasper) | FINS | COI | mtDNA | more than 50 flatfish species; including also samples from Bothidae, Citharidae, Cynoglossidae, Paralichthyidae, Psettodidae, Rhombosoleidae, Scophthalmidae, and Soleidae family | Espineira et al. [116] |
| Salmonidae | Salmon (Salmo) | LAMP, PCR | cytb (LAMP), COI (PCR) | mtDNA | S. salar (in qPCR, other tested species provided Ct app. 30–34) | Xiong et al. [117] |
| real-time LAMP, PCR | cytb | mtDNA | S. salar | Xiong et al. [118] | ||
| real-time LAMP | cytb | mtDNA | S. salar | Li, Cheng, Xu, Cui, Cao, Xiong, Wang and Xiong [45] | ||
| real-time PCR | GH1, 18S rDNA | nDNA | S. salar | Soga et al. [119] | ||
| SNPs | 94 SNPs loci | genome | S. salar | Holman et al. [120] | ||
| SNPs | 39 SNPs loci | genome | S. trutta | Drywa et al. [121] | ||
| Salmon (Salmo, Oncorhynchus) | real-time PCR | pvb | nDNA | S. salar, O.nerka | Hildebrandt and Garber [122] | |
| real-time PCR | ITS1 | nDNA | S. salar, S. trutta (O. mykiss, O. gorbuscha and O. keta was amplified with higher Ct value; cut off for this species is Ct > 27) | Herrero et al. [123] | ||
| AFLP-SCAR | cytb | mtDNA | S. salar, O.mykkis | Zhang and Cai [124] | ||
| PCR-RFLP | tRNAGlu/cytb | mtDNA | O. gorbuscha, O. keta, O. kisutch, S. salar +20 others species from different genus | Wolf, Burgener, Hübner and Lüthy [105] | ||
| Salmon, trout (Salmo) | RAPD | - | genome | S. salar, S. trutta | Elo et al. [125] | |
| Salmon, trout (Salmo, Oncorhynchus) | PCR-RFLP | COII | mtDNA | S. salar, O. mykkis | Carrera et al. [126] | |
| PCR-RFLP | p53 | nDNA | S. salar, O. mykkis | Carrera et al. [127] | ||
| PCR-RFLP | 16S rRNA | mtDNA | S. salar, O. mykkis | Carrera et al. [128] | ||
| PCR-RFLP | cytb | mtDNA | S. salar, O. mykkis | Carrera et al. [129] | ||
| PCR-RFLP | COI | mtDNA | O. gorbuscha, O. keta, O. kisutch, O. mykkis, O. tshawytscha, S. salar | Mueller et al. [103] | ||
| SNPs | 566 SNPs loci | genome | O. mykkis, S.salar, S.trutta | Drywa et al. [130] | ||
| real-time LAMP | cytb | mtDNA | O. mykkis, S.salar | Li et al. [131] | ||
| real-time PCR | COI, cytb | mtDNA | O. mykkis, S.salar | Xu et al. [132] | ||
| Salmon, trout, bream (Salmo, Oncorhynchus, Brama) | PCR-RFLP, FINS | cytb | mtDNA | O. clarki, O. mykiss, O. tschawytscha, O. nerka, O. gorbuscha, O. kisutch, O. masou, O. keta, S. salar, S. trutta, Brama spp | Espiñeira et al. [133] | |
| Salmon, trout, char (Salmo, Oncorhynchus, Salvelinus) | PCR-SSCP | cytb, GH, pvb | mtDNA, nDNA | S. salar, S. trutta, S. alpinus, S. fontinalis, O. mykiss, O. kisutch, O. nerka, O. keta, O. gorbuscha, O. tschawytscha | Rehbein [134] | |
| AFLP | - (genomic DNA) | nDNA | O. keta, O.mykkis, S. alpinus, S. fontinalis +others species from different genus | Maldini, Marzano, Fortes, Papa and Gandolfi [88] | ||
| Salmonids (Oncorhynchus, Salvelinus, Hucho, Brachymystax, Salmo, Coregonus, Thymallus) | real-time PCR | GH2 | nDNA | 31 salmonid species | Li et al. [135] | |
| Trout (Oncorhynchus) | PCR, LAMP | COI (PCR), cytb (LAMP) | mtDNA | O. mykkis | Xiong et al. [136] | |
| SNPs | 95 SNPs loci | nDNA | O. mykkis | Liu et al. [137], Liu et al. [138] | ||
| Scombridae | Mackerel (Scomber) | real-time PCR, FINS | cytb | mtDNA | S. scombrus | Velasco et al. [139] |
| PCR-RFLP | 5S rDNA nontranscribed spacer | nDNA | S. japonicus, S. australasicus, S. scombrus | Aranishi [140] | ||
| PCR-RFLP | 5S rDNA nontranscribed spacer | nDNA | S. japonicus, S. scombrus | Aranishi [141] | ||
| real-time PCR | pvb | nDNA | S.scombrus, T.trachurus | Prado, Boix and von Holst [90] | ||
| Bonito (Sarda) | microsatellites | 5 microsatellite loci in genome | S. sarda (loci previously published for other Scombrid fishes) | Turan [142] | ||
| Tuna (Thunnus) | LAMP | cytb | mtDNA | K. pelamis | Xiong et al. [143] | |
| PCR-SSCP | cytb | mtDNA | K. pelamis, T. alalunga, T. albacares, T.thynnus, T. obesus | Rehbein et al. [144] | ||
| Bonito, Tuna (Sarda, Thunnus) | PCR | cytb | mtDNA | S. sarda, T. thynnus | Lockley and Bardsley [145] | |
| Mackerel, tuna (Auxis, Euthynnus, Katsuwonus, Scomber, Thunnus) | FINS | 16S rRNA | mtDNA | T. thynnus, T. albacares, T. obesus, T. alalunga, T. maccoyii, T. tonggol, T. orientalis, A. thazard, A. rochei, E. affinis, E. alletteratus, E. lineatus, K. pelamis, A. fallai, S. orientalis, S. australis, S. chiliensis, S. scombrus, S. japonicus, S. australasicus, S. colias +Fish species from genus Clupeidae, Engraulidae, Salangidae family | Armani, Tinacci, Xiong, Castigliego, Gianfaldoni and Guidi [92] | |
| - | 40 animal genus | PCR-SSCP | cytb | mtDNA | 23 fish species, 19 other animal species | Weder et al. [146] |
| Fish genus | real-time PCR | 16S rRNA | mtDNA | 26 fish species (universal primers for fish detection) | Fernandes et al. [147] | |
| Parameters | PCR | DNA Barcoding | FINS | RFLP/PCR-RFLP | SSCP | LAMP |
|---|---|---|---|---|---|---|
| Required amount of DNA for analysis * | Low | Medium | Medium | High/medium | Low | Low |
| Used length of DNA or DNA fragment | Depend on used format (usually 80–600 bp) | usually app. 600 bp; DNA minibarcoding up to 200 bp | Usually 200–800 bp | depends on the size of diagnostic restriction fragments in nuclear DNA or PCR product | Usually up to 250 bp | Up to 250 bp |
| Capacity of the machine | Mainly 96 reactions in one run | Mainly 96 reactions in one run | Mainly 96 reactions in one run | depending on the capacity of the gel (usually up to 40 holes)/PCR machine (96 reactions) | Mainly 96 reactions in one run (PCR machine) | Mainly 96 reactions in one run (PCR machine) or according to the capacity of the water bath |
| Duration of the analysis without DNA extraction | 45–120 min | Min 24 h | Min 24 h | Min 6 h Evaluation: quick | Min 24 h | 15–60 min |
| Possibility of product detection/visualization | Fluorimetry, agarose gel | Capillary electrophoresis (sequencing chromatogram) | Capillary electrophoresis (sequencing chromatogram) | Agarose gel (for RFLP follow by detection of labeled probes) | Polyacrylamide gel or capillary electrophoresis | Turbidimetry, colorimetry, fluorimetry, agarose gel |
| Feasibility for analysis of raw products | Yes, reliable | Yes, reliable | Yes, reliable | Yes, reliable | Yes, reliable | Yes, reliable |
| Feasibility for analysis of heat-treated fish products | Yes, reliable | Yes, depend on DNA degradation rate; minibarcoding can be used | Yes, depend on DNA degradation rate (more applicable for shorter products) | Yes, depend on DNA degradation rate | Yes, reliable | Yes, reliable |
| Possibility for species identification from mixed samples | Yes | No | No | Yes | Yes | Yes |
| Possibility of the multiplex analysis | Yes, reliable | No (for Sanger sequencing); possible by metabarcoding | No (for Sanger sequencing) | No/Yes if the specific restriction site is inside PCR amplicons for each identified species | Yes (fluorescence detection) | Yes (potencial for fluorescence detection) |
| Operation | Simple | Moderate | Moderate | Moderate | Moderate | Simple |
| Need for obtained data bioinformatical analysis | No | Yes | Yes | No | No | No |
| Potential for interlaboratory reproducibility | High | High | High | High | Medium | Medium |
| Potential for database construction | High (amplicon sequence or length) | High | High | Medium (fingerprint) | Medium | No |
| Usage | Simple to evaluate. The PCR amplicon or fluorescence curve is or is not there, which is clearly visible from the primary results. | Comparison of obtained sequence with available, updated databases. Primers and reaction conditions are verified and available in databases and/or articles. | Necessity of DNA sequences reference samples for the construction of a phylogenetic tree. | Necessity of reference fingerprint database. | Necessity of reference fingerprint database. | Simple to evaluate. The presence of lamplicons are clearly visible on the gel, by turbidimetry or color change of solution. |
Disclaimer/Publisher’s Note: The statements, opinions and data contained in all publications are solely those of the individual author(s) and contributor(s) and not of MDPI and/or the editor(s). MDPI and/or the editor(s) disclaim responsibility for any injury to people or property resulting from any ideas, methods, instructions or products referred to in the content. |
© 2023 by the authors. Licensee MDPI, Basel, Switzerland. This article is an open access article distributed under the terms and conditions of the Creative Commons Attribution (CC BY) license (https://creativecommons.org/licenses/by/4.0/).
Share and Cite
Cermakova, E.; Lencova, S.; Mukherjee, S.; Horka, P.; Vobruba, S.; Demnerova, K.; Zdenkova, K. Identification of Fish Species and Targeted Genetic Modifications Based on DNA Analysis: State of the Art. Foods 2023, 12, 228. https://doi.org/10.3390/foods12010228
Cermakova E, Lencova S, Mukherjee S, Horka P, Vobruba S, Demnerova K, Zdenkova K. Identification of Fish Species and Targeted Genetic Modifications Based on DNA Analysis: State of the Art. Foods. 2023; 12(1):228. https://doi.org/10.3390/foods12010228
Chicago/Turabian StyleCermakova, Eliska, Simona Lencova, Subham Mukherjee, Petra Horka, Simon Vobruba, Katerina Demnerova, and Kamila Zdenkova. 2023. "Identification of Fish Species and Targeted Genetic Modifications Based on DNA Analysis: State of the Art" Foods 12, no. 1: 228. https://doi.org/10.3390/foods12010228