Article

Nutritional, Functional, Textural and Sensory Evaluation of Spirulina Enriched Green Pasta: A Potential Dietary and Health Supplement

1
Centre for Conservation and Utilisation of Blue Green Algae (CCUBGA), Division of Microbiology, ICAR—Indian Agricultural Research Institute, New Delhi 110012, India
2
Division of Food Science and Postharvest Technology, ICAR—Indian Agricultural Research Institute, New Delhi 110012, India
3
Division of Design of Experiments, ICAR—Indian Agricultural Statistics Research Institute, New Delhi 110012, India
*
Author to whom correspondence should be addressed.
Foods 2022, 11(7), 979; https://doi.org/10.3390/foods11070979
Submission received: 28 December 2021 / Revised: 8 March 2022 / Accepted: 11 March 2022 / Published: 28 March 2022
(This article belongs to the Section Food Engineering and Technology)

Abstract

:
In house cultivated Spirulina powder was incorporated at 2 to 15% concentrations to enrich pasta prepared from semolina. Spirulina incorporation led to development of green color pasta with nutritional and functional fortification resulting in increase in its protein, total phenols, flavonoids, iron and calcium content by up to 77.47%, 76.62%, 162.88%, 296.99% and 57.27%, respectively, without causing detrimental changes to the textural and sensory attributes. FAME analysis revealed 2 to 2.5 times enhanced levels of γ-linolenic acid and docosahexaenoic acid in enriched pasta. Significant improvement in phenolics, flavonoids and antioxidant activity were also observed in comparison to control pasta. Analysis of theoretical and realized composition confirmed retention of nutrients post cooking revealing no significant loss in proteins and other nutrients. Principal components analysis demonstrated significant contribution of Spirulina to nutritional and functional attributes especially at higher concentrations. Pasta enriched with 12.5% Spirulina was rated as “liked very much” and the purchase intention was also high. Spirulina enrichment at concentrations above 10% (12.5%) with appreciable increase in nutritional and functional attributes without affecting textural or cooking quality and acceptable sensory evaluation can be a preferred alternative to augment health and prevent sickness. Since green color symbolizes freshness, hope, renewal and physical health, the consumption of Spirulina incorporated green pasta may be a potential option to enhance the livelihood and nutritional security of rural poor and a good alternative for hidden hunger alleviation programs for mass nutrition especially for infants and children in an effective manner.

1. Introduction

Microalgae have long been known to be well endowed to enhance the nutritional quality of conventional foods and positively affect human health owing to their high macro- and micro-nutrients content. Indeed, for thousands of years, edible microalgae Arthrospira, Nostoc and Aphanizomenon spices have been used for food [1]. Even though the first commercialized microalgae Chlorella and Spirulina as “health food” in Japan, Taiwan and Mexico emerged over 70 years ago [2], they still have not gained much ground in health foods segment owing to a peculiar flavor and aroma associated with them. Being a rich source of promising compounds with biological activity that could be used as functional ingredients, WHO has labeled them as super food. Owing to increasing awareness of health promoting nutrients and nutraceuticals necessary to ward off the lifestyle disorders, microalgae are receiving renewed attention in nutritional and food sciences. Spirulina platensis belonging to the family Oscillatoriaceae, is a multicellular and filamentous blue-green microalga (cyanobacteria) that thrives in warm, alkaline fresh-water bodies. The word “Spirulina” is derived from the Latin word meaning “helix” or “spiral”; denoting the physical configuration of the organism when it forms swirling, microscopic strands. This cyanobacterium contains 55–70% protein, 15–25% polysaccharides, 5–6% total lipids, 6–13% nucleic acids and 2.2–4.8% minerals [3]. Among the micronutrients, it contains a complex of vitamins A, B, D, E and K [4]. Spirulina is rich in minerals such as calcium, potassium, iron, nickel, chromium, magnesium, manganese, copper, sodium, zinc, selenium and lead along with carotenoids and essential fatty acids (3,6 γ-linolenic acid, α-linolenic acid, stearidonic acid, eicosapentaenoic acid, docosahexaenoic acid and arachidonic acid) necessary for a holistic balanced diet [5]. Besides, Spirulina is the richest natural source of digestible protein that offers all essential amino acids to the human body [6]. The higher digestibility of these microalgae is realized because of lack of cellulose in the cell wall of Spirulina, its wall material being composed of 86% digestible polysaccharides [7]. Contrary to misconception associated with them regarding the content of nucleic acids, in both S. maxima and S. platensis, the total nucleic acid content has been reported in the range of 4.2–6% on dry matter basis [8] which is well within safety norms, and thus do not pose any risk of rise in plasma uric acid upon consumption up to 10 g/day. Potential health benefits of Spirulina consumption include immunomodulation, antioxidant, anticancer, antiviral and antibacterial activities, as well as positive effects against malnutrition, hyperlipidemia, diabetes, obesity, inflammatory allergic reactions, heavy metal/chemical-induced toxicity, radiation damage and anemia without any toxicological effects [3]. Owing to these features, Spirulina is widely approved in several countries and has earned GRAS (Generally Recognized as Safe) status. It has been authorized by the FDA (Silver Spring, MD, USA) and The Brazilian Health Regulatory Agency (ANVISA, Brasília, Brazil) for consumption as food or food supplement. Since Spirulina cultivation requires high pH, it prevents the growth of other organisms [9], and that is why Spirulina has long been used as a dietary supplement by people living close to the alkaline lakes where it is naturally found. In many countries of Africa, it is still used as human food as a major source of protein and is collected from natural water, dried and eaten. Today, Spirulina is being used for self-health care strategy in many countries.
Most of the Spirulina available as dietary supplements is sold in the form of dried powder, capsules and tablets. Present forms of food aid by various agencies such as Algama, Phycon and few others, focus on fighting hunger as well as treating malnutrition especially in context of the needs of young children who are at maximum risk. There is an increasing demand for sophisticated products from microalgae as more consumers prefer to augment their health and prevent sickness, seek and try to incorporate these microalgae into their daily diet in the form of foods and/or ingredients [10] rather than the capsules or tablets. Attractive, more innovative products based on microalgae and/or their derivatives are positioning firmly in the food market.
Keeping in view, the high content of nutraceuticals present in Spirulina biomass, the new trend of research is inclined towards development of bioactive fortified functional food items consumed popularly such as doughnuts, pasta, salad dressing, mayonnaises and gelled-desserts. Batista et al. [11] have reported the enhancement of protein and functional properties of cookies along with increase in the total phenolic content and antioxidant capacity upon enrichment with different microalgae viz. Spirulina platensis, Chlorella vulgaris, Tetraselmis suecica and Phaeodactylum tricornutum at 2% and 6% levels. Santos et al. [12] developed chocolate flavor shake-type powdered food with Spirulina enrichment (750 mg/100 g of microalgal biomass) and found to contain 43.40, 41.34% protein, 45.73, 46.51% carbohydrates with 7.68 and 7.77 average acceptance rate for shakes with and without Spirulina, respectively. Recently, Lafarga et al. [13] formulated a broccoli soup enriched with different types of microalgae Spirulina sp., Chlorella sp., or Tetraselmis sp. at concentrations ranging from 0.5 to 2.0% (w/v) with incorporation effecting increase in phenolic, antioxidant activity and good consumer acceptance at correct formulation proportion. Addition of Spirulina at 2.6% concentration in snacks resulted in increased protein (22.6%), minerals (46.4%) and lipids (28.1%) without significantly affecting their sensory and physiological characteristics [14]. Rodríguez et al. [15] incorporated Spirulina biomass in fresh pasta, resulting in enhanced nutritional compositions, without affecting the sensory, textural and cooking quality. That Spirulina platensis could be used as an ingredient in the preparation of commercial unconventional dry pasta with acceptable sensorial and technological characteristics have been advocated by Pagnussatt et al. [16] too. Since pasta products are popular as convenience foods in tune with the requirements of modern life, their acceptance among consumers is mainly due to good sensory attributes, low cost, ease of preparation, amenability to suit various cuisines and longer shelf life. Pasta can also be employed in the preparation of different varieties of meals. According to the latest report by IMARC Group, the pasta market in India reached a sales value of US$335.4 million in 2018, exhibiting a compound annual growth rate (CAGR) of 17.1% during 2011–2018. Although many studies have investigated use of Spirulina in pasta, they pertain to levels between 2 to 10%. To the best of knowledge of authors, although hypothesized, no systematic studies exist on use of levels beyond 10% in pasta which were found acceptable in taste. Scientific records on textural and cooking profile of Spirulina enriched pasta are scanty and the detailed nutrient profile of cooked pasta is rarely reported. In this study we report the nutritive value of cooked pasta and losses upon cooking whatsoever. In view of the above observations, the aims of this research work were to: (i) evaluate the effect of Spirulina incorporation on the nutritive value and cooking attributes of green pasta; (ii) determine the consumer preferences for Spirulina supplemented pasta.

2. Material and Methods

2.1. Cultivation and Production of Spirulina

The Spirulina sp. CCC 540 was obtained from the germplasm collection of Centre for Conservation and Utilisation of Blue Green Algae (CCUBGA, New Delhi, India), Indian Agricultural Research Institute, New Delhi. India. The culture was maintained in Zarrouk’s medium [17] and its growth and purity were examined on regular basis. For experimental purpose, the Spirulina strain was cultivated in 100 mL autoclaved medium in 250 mL Erlenmeyer flasks in growth room at 28 ± 2 °C and light intensity of 55–60 μmol photon m−2 s−1 with photoperiod of 16 h:8 h light and dark rhythm. For large scale production of Spirulina biomass, it was cultivated in raceway ponds lodged in a semi-controlled Greenhouse using economical medium containing commercial fertilizers (Na2CO3 9 g/L; Sufala, N:P:K (19:19:19) 1 g/L; NaCl 1 g/L; MgSO4 0.2 g/L and single super phosphate 0.1 g/L). The cultures were circulated continuously by the paddle wheels at a flow rate of 20 cm/s. Culture depth was maintained at 10 cm in the ponds. The culture was harvested after 21–25 days of growth, filtered, washed properly, sun dried and stored at room temperature (25 ± 2 °C) until further use within a week.

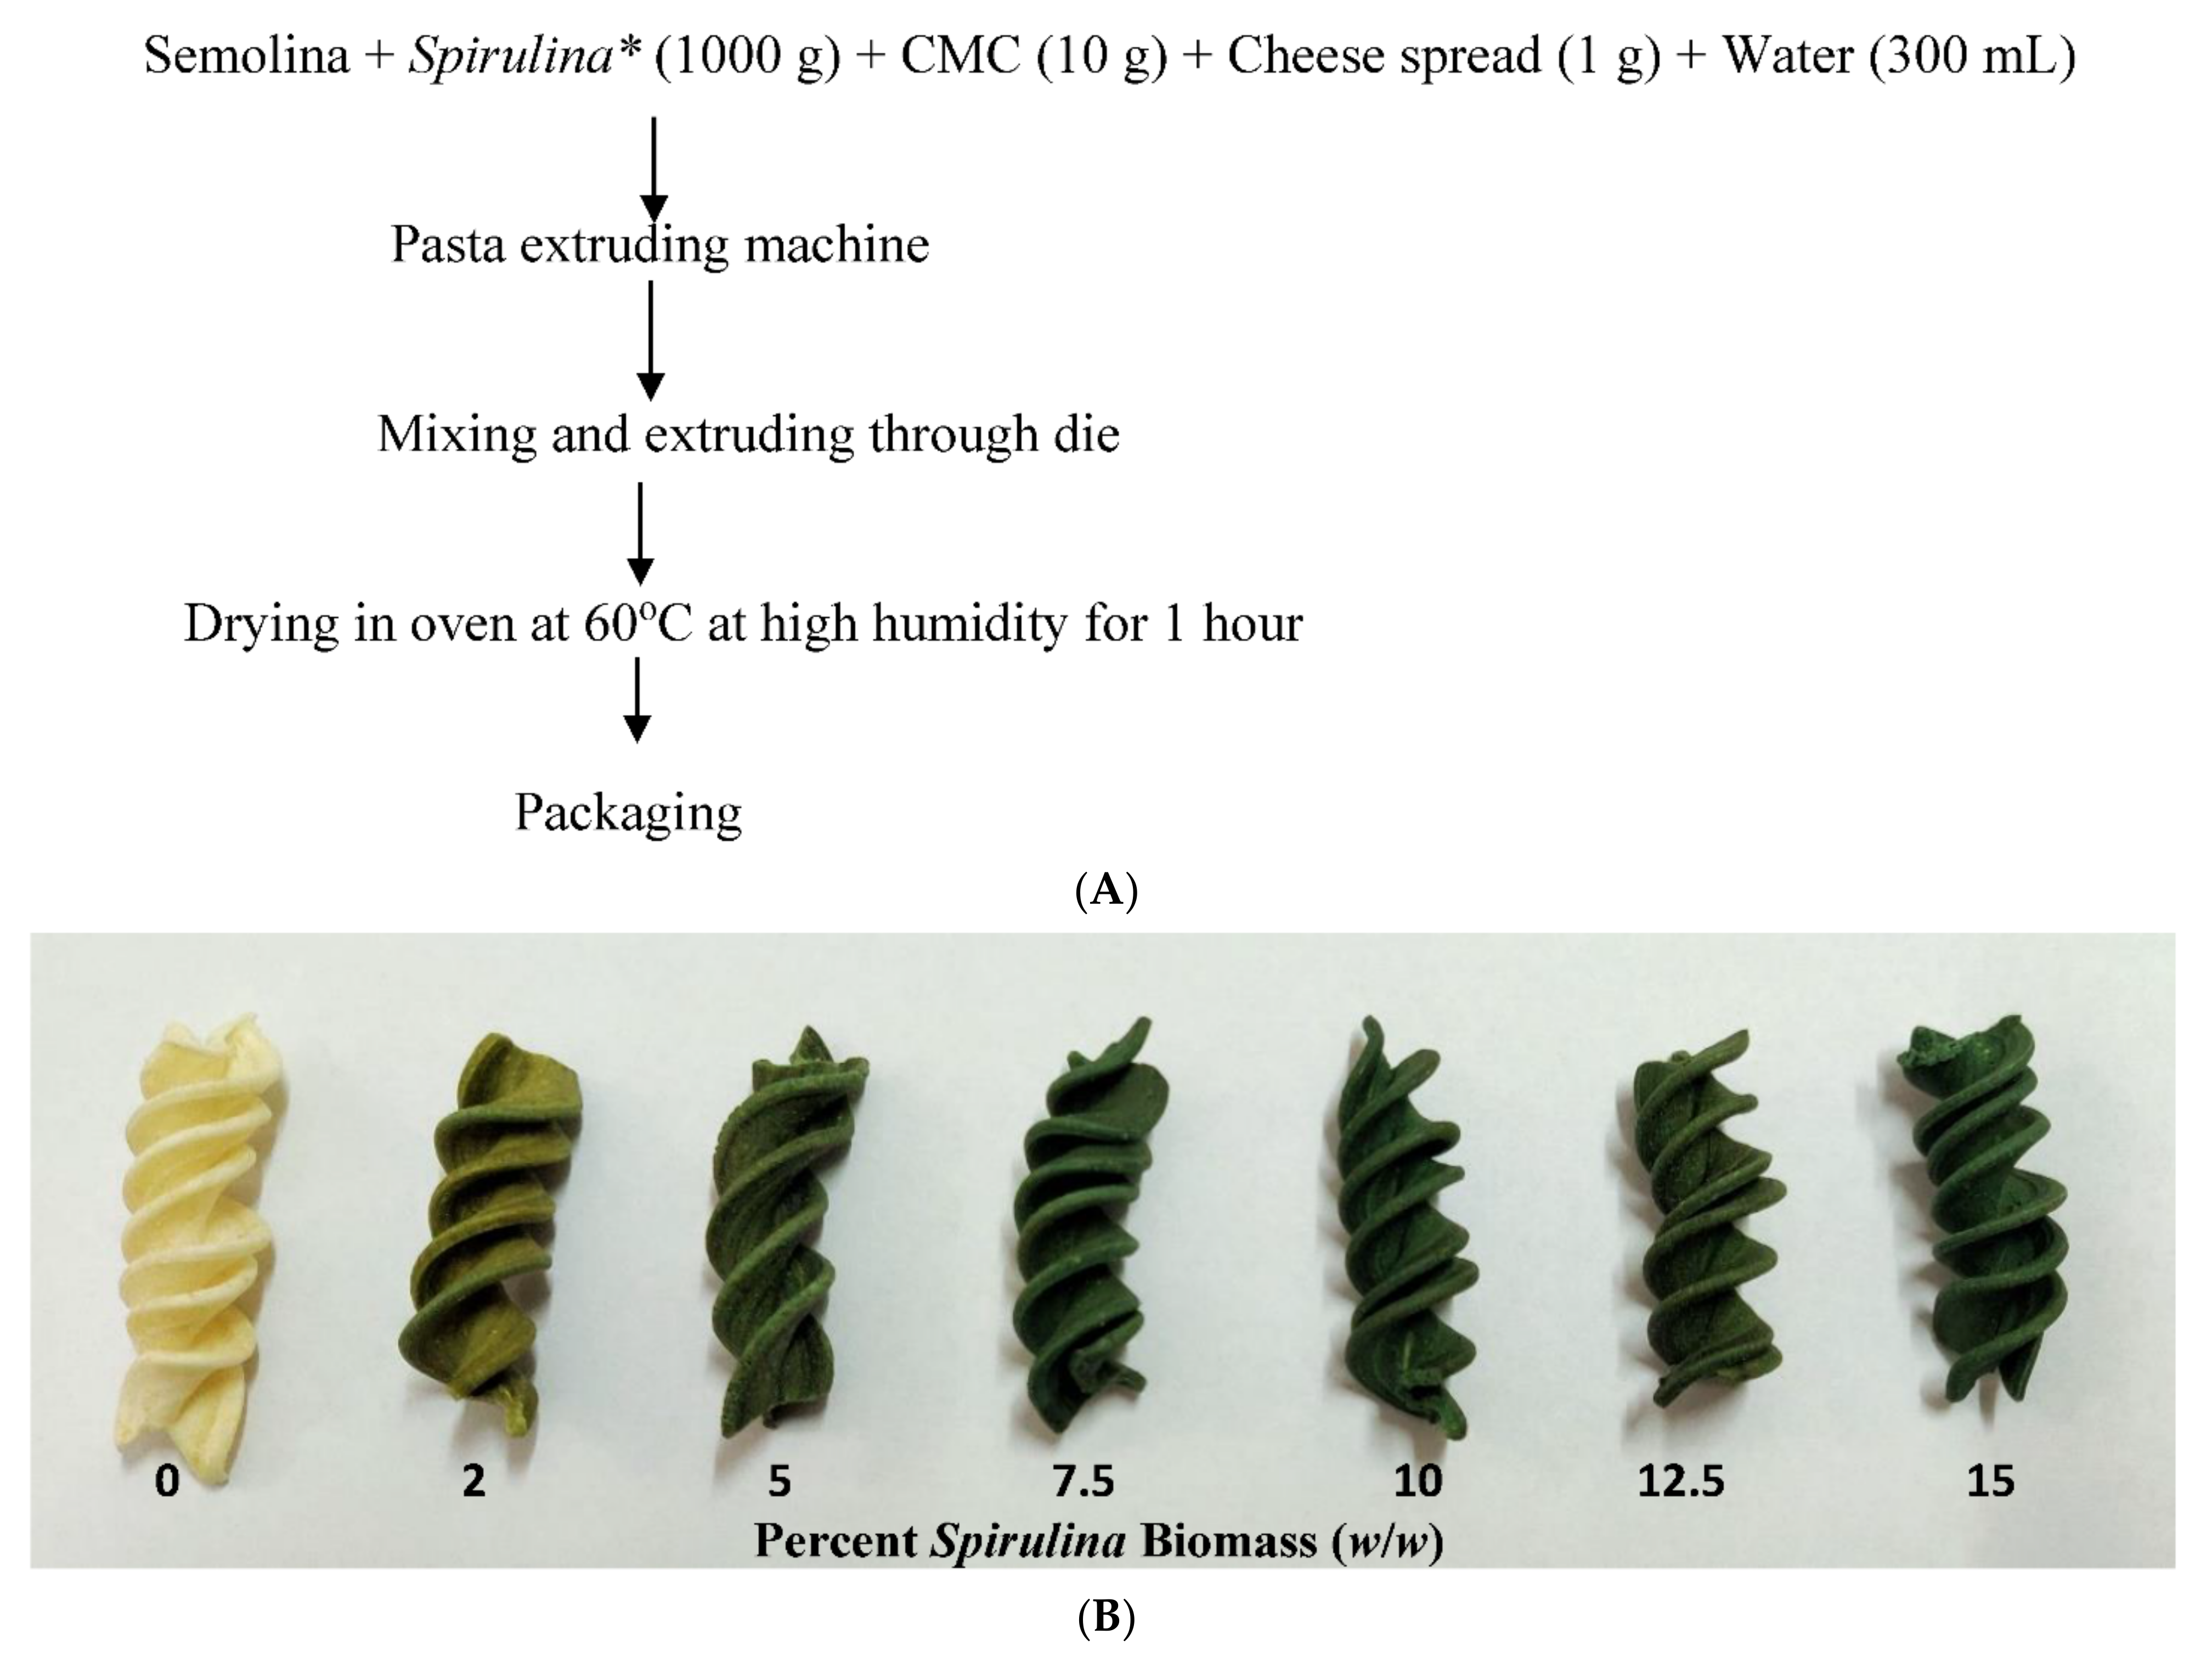
2.2. Pasta Preparation

Pasta elaboration into fusilli shape (Figure 1A) was performed using laboratory scale cold extrusion equipment (Dolly, La Montiferrina, Cittadella, Italy). Fresh pasta was prepared using commercial durum wheat semolina, water, carboxymethyl cellulose (1%, fl. basis), cheese spread (0.1%, Mother Dairy, Delhi, India) Spirulina biomass 2, 5, 7.5%, 10%, 12.5% and 15% (w/w, n = 3) and dehydrated in hot air oven at 60 ± 2 °C under high humidity until attainment of 7–8% moisture (Figure 1B). For analysis, 250 g samples of each group were packaged in LDPE packets and stored in a dark place at room temperature (25 ± 2 °C) until analysis.

2.3. Nutritional Evaluation

Proximate analysis (fat, fiber, ash and protein) of both raw and cooked pasta was performed using AOAC (Association of Official Analytical Chemists, Rockville, MD, USA) methods. The protein content of pasta was calculated by determining nitrogen using micro Kjeldahl method [18] with fully automatic digester and distillation unit (Velp Scientifica, Usmate, Italy) and multiplying by factor of 6.25 [19]. The crude lipids content was estimated by using chloroform: methanol extraction method [20]. Derivatization of total lipids as fatty acid methyl esters (FAME) was performed according to Ichihara and Fukubayashi [21] the fatty acids profile for each of the pasta samples was determined by Gas Chromatography (Shimadzu GC-2014, Serial no.—C121652, Kyoto, Japan) on Restek Stabilwax column (30 m, 0.25 mm ID) using flame ionization detector (FID, Shimadzu, Kyoto, Japan). The carbohydrates content was determined by Anthrone method [22]. Calorific value of pasta was calculated based on the composition, using the Atwater conversion factors of 4 kcal/100 g for protein and carbohydrates, and 9 kcal/100 g for lipids [23]. Moisture content was determined by weight difference method upon drying in the oven at 100 °C [18] and ash content was determined using muffle furnace [18]. Total phenolic content of pasta samples was estimated spectrophotometrically (Varian Cary, Melbourne, Australia) using Folin–Ciocalteu reagent [24], and results were expressed as Gallic Acid Equivalent (mg GAE 100 g−1). Flavonoids content estimation was performed with spectrophotometric determination using aluminum chloride solution [25] and results were expressed as pmol Quercetin Equivalent per gram (QE/g). Antioxidant activity was determined using two in vitro assays, namely: Ferric Reducing Antioxidant Activity (FRAP) according to Benzie and Strain [26]; and 2, 2-diphenyl-1-picryl hydrazyl (DPPH) assay as specified by Apak, Güclü et al. [27]. The results were expressed as μmol Trolox Equivalents (TE) 100 g−1. All reagents and chemicals used for the study were of analytical grade from SRL chemicals, Mumbai, India.

2.4. Minerals

Pasta samples were digested with di-acid (HNO3: HClO4 4:1). The wet digest was made up to 100 mL with double distilled water and filtered with Whatman 42 paper (pore size 2.5 μm). Iron and zinc content were estimated through atomic absorption spectrophotometer (Z-Xpress 8000, Spectrum Instruments GmbH, Überlingen, Germany ). Calcium content in the digested pasta sample was determined using flame photometer [28].

2.5. Cooking Quality of Pasta

Cooking quality of pasta was determined following protocols of AACC method 16–50 [29]. Optimum cooking time (min) for each sample was determined by observing disappearance of white core after the pasta was pressed between two Plexiglass plates. Cooked weight (g), as a measure of the degree of pasta hydration taking 10 g dry pasta sample was recorded. Cooking loss (weight of total solids lost in cooking water, expressed as percent), was measured by evaporating the pasta cooking water to dryness in an oven set at 100 °C.

2.6. Textural Analysis

The textural attributes of cooked pasta viz., firmness, stickiness upon compression and cutting force were measured on Texture Analyzer (TA-XT2; Stable Micro Systems Ltd., Surrey, UK) using software Exponent (6.1). Texture of the cooked pasta samples was measured using Texture Analyzer using 5 kg load cell, and settings as: pre-test speed 2.0 mm/s, test speed 0.5 mm s−1, post-test speed 0.5 mm s−1, strain 90% in compression mode (return mode) with 36 mm radiused cylindrical probe. The maximum force in force-time graph was taken as firmness and the negative force was noted as stickiness. Five measurements were taken for each sample. Cutting force for cooked pasta was determined by HDP/BS probe of TAXT2 Texture Analyzer for three cooked pasta singlets kept side by side under the blade with test speed 3 mm/s and distance 20 mm in compression mode. The peak positive force determined using texture exponent software was noted as cutting force (g).

2.7. Sensory Evaluation

Eighty-three semi-trained panelists (58 males and 25 females), aged between 21 to 45 years, ranked the freshly cooked pasta served in random order two hours post meal. All panelists were briefed about the product and health benefits of Spirulina. All of them were regular consumers of pasta and knew about desirable quality attributes. Sensory evaluation of cooked pasta was performed based on 9-point hedonic scale (0 = not acceptable; 9 = highly acceptable). Intention to purchase the pasta was also asked from the panelists in the proforma. Sensory evaluations were conducted in the isolated booths at room temperature (25 ± 2 °C). Between two samplings, the panelists were provided with plain water to rinse their mouth.

2.8. Statistical Analysis

All analysis was conducted in triplicates. Test of significance when the p-value was <0.05, was calculated with Tukey’s HSD test for comparison of treatment effects for each of the parameters by SPSS-16.0 statistical package. Principal Components Analysis (PCA) was carried out to determine multivariate relation among varying concentrations of Spirulina supplementation on nutritional parameters, functional attributes and antioxidant activity of pasta. It was also analyzed through R version 3.6.2 (12 December 2019)—Copyright © 2019 The R Foundation for Statistical Computing (Vienna, Austria), Platform: x86_64-w64-mingw32/x64 (64-bit). Dendrogram (UPGMA) was also prepared to confirm the grouping of the different parameters.

3. Results and Discussion

3.1. Proximate Composition of Spirulina Platensis

Spirulina sp. CCC 540 was found to contain 65.71% protein, 6.94% total lipids, 21.87% carbohydrates, 8.34% ash and 26.59, 107.83 and 1.87 mg/100 g of iron, calcium and zinc, respectively (Table 1). Our in-house Spirulina’s composition was in range with Spirulina powder used by Tańska et al. [30] for preparation of corn extrudates which contained 60.7% protein, 7.2% fat, 15.2% carbohydrates and 7.9% ash. Spirulina platensis cultivated in our lab was found superior over the culture used by El-Hameed et al. [31] for spaghetti preparation; it also contained similar range of nutrient composition (53.92% crude protein, 6.67% total lipids, 18.10% carbohydrates and 13.11% ash).

3.2. Nutritional Composition of Spirulina Enriched Pasta (SEP)

Significant variation was observed for protein, total lipids and micronutrients content of different pasta formulations (Table 2).

3.2.1. Proteins

Protein content of semolina pasta was 11.52% and upon enrichment with Spirulina at various levels (2%, 5%, 7.5%, 10%, 12.5% and 15% w/w), increase in protein content by up to 77.47% was recorded. The augmentation in protein content with Spirulina addition is in conformity with studies conducted by several researchers [32,33]. The theoretical protein content in SEP12.5 (most acceptable formulation) was envisaged to be 19.74% but the realized value in cooked samples was 18.66% confirming that most of the nutritional qualities of Spirulina remained intact in final product. Cooked pasta samples recorded a marginal decrease in the protein content due to leaching in the gruel and lay in the range of 11.00–19.51% on dry weight basis (Figure 2) as against 11.52–20.44% in uncooked pasta (Table 2). Considering serving size of dry pasta as 85 g, a single serve of SEP12.5 upon cooking provides 15.86 g of protein which is 26.4% of recommended protein intake (60 g per day for adults, Dietary Guidelines for Indians, National Institute of Nutrition, India) [34]. Hence this pasta can qualify for high protein foods category (section 101.54 of FDA food labeling norms, [35]).

3.2.2. Fats

Increase in lipid content was also reported for SEP over Semolina pasta, containing 2.99% crude fat. The increase in lipids content ranged from 4.53 to 37.60% (Table 2). Lucas et al. [14] developed snacks with addition of Spirulina biomass at 2.6% concentration and reported an increase in lipid, protein and minerals content by 28.1%, 22.6% and 46.4%, respectively, over control snacks. Tańska et al. [30] also reported an increase in protein (4%), total lipids (0.4%), ash (0.4%) and fiber (0.7%) with 8% Spirulina addition in corn extrudates. While raw pasta enriched with 12.5% Spirulina had 3.94% lipids, its cooked form had 2.8% lipids on dry weight basis (Figure 2). Our findings are in agreement with another report by Agustini et al. [36] that there was a decrease in total lipids content of the noodles post cooking. Further, the fatty acid analysis of the pasta samples revealed variation in amongst samples with respect to proportion of Spirulina biomass used for enrichment. Major fatty acids reported from Spirulina sp. CCC 540 in increasing number of carbons were: myristic acid (MA, C14:0): 0.40%, myristoleic acid (MTA, C14:1): 0.47%, palmitic acid (PA, C16:0): 41.10%, palmitoleic acid (PTA, C16:1): 4.41%, stearic acid (SA, C18:0): 1.28%, oleic acid (OA, C18:1): 25.48%, linoleic acid (LA, C18:2): 5.88%, arachidic acid (ARA, C20:0): 0.52%, γ-linolenic acid (GLA, C18:3): 9.25% and docosahexaenoic acid (DHA, C22:6): 0.59% of total fatty acids. As per Almahrouqi et al. [37] fatty acid profile of S. platensis at different salinity were reported as: PA (54.78–57.25%), PTA (2.47–2.74%), Heptadecanoic acid (0.14–0.23%), SA (0.96–1.27%), OA (3.19–3.77%), LA (23.84–24.94%), GLA (11.55–12.81%) and Eicosadienoic acid (0.22–0.31%). The applications of gamma-linolenic acid (GLA) and docosahexaenoic acid (DHA) and other poly unsaturated fatty acids in the treatment and prevention of gastrointestinal cancer and cardiovascular disease have been widely reported [38]. Thus, their enhanced content in Spirulina enriched pasta (SEP) points towards the nutraceutical potential of this preparation. A sequential increase was reported in MTA, PA, PTA, LA, ARA, GLA and DHA, while MA, SA and OA were found to decrease. Raw SEP12.5 was found to contain 0.81%, 33.94%, 3.98%, 12.25%, 1.97%, 0.33 and 0.59% MTA, PA, PTA, LA, ARA, GLA and DHA of total fatty acids, respectively. GLA and DHA were reported to increase up to 252.64% and 222.98% of total fatty acids in SEP12.5 in comparison to control.
Thus, a single serve of cooked SEP12.5 pasta can provide 19.75 mg DHA and 11.05 mg GLA. Considering recommended EPA+DHA and GLA amounts of 500 mg and 1.4 g/day [39,40], this amounts to 10% of recommended intake. Vatsala and Sudesh [41] have reported the value of γ-linolenic, palmitic and stearic acid in the range of 0.70–2.10%, 40.48–42.00% and 17.00–18.40% of total fatty acids upon enrichment of noodles with 2%, 4% and 6% Spirulina biomass. El-Hameed et al. [31] have also reported that the increase in concentration of Spirulina platensis from 0.5–2% led to increase of fatty acids (palmitic, margaric, stearic, oleic and γ-linolenic acid) in spaghetti. To the best of the knowledge of authors, this is the first report of GLA and DHA content in raw and cooked Spirulina enriched pasta products.

3.2.3. Carbohydrates

The carbohydrates content in control pasta was estimated to be 71.68% (Table 2). Upon enriching pasta with Spirulina biomass (21.87% carbohydrates) at different levels, a proportional decrease in carbohydrates’ content was reported. SEP12.5 and SEP15 were found to contain 65.84% and 63.49% carbohydrates, respectively. Our findings are in consonance to Fradique et al. [42] who have also reported almost 10–12% decrease in carbohydrates upon incorporation of Spirulina in pasta at 2% level. Similarly, Tańska et al. [30] reported a decrease in carbohydrates content from 79.4 to 74.3% in control and Spirulina enriched corn extrudates, respectively. Reduction in carbohydrates content upon cooking ranged from 18.31 to 21.51%. Carbohydrates content for cooked control, SEP12.5 and SEP15 was found to be 56.81%, 52.29% and 51.87%, respectively.

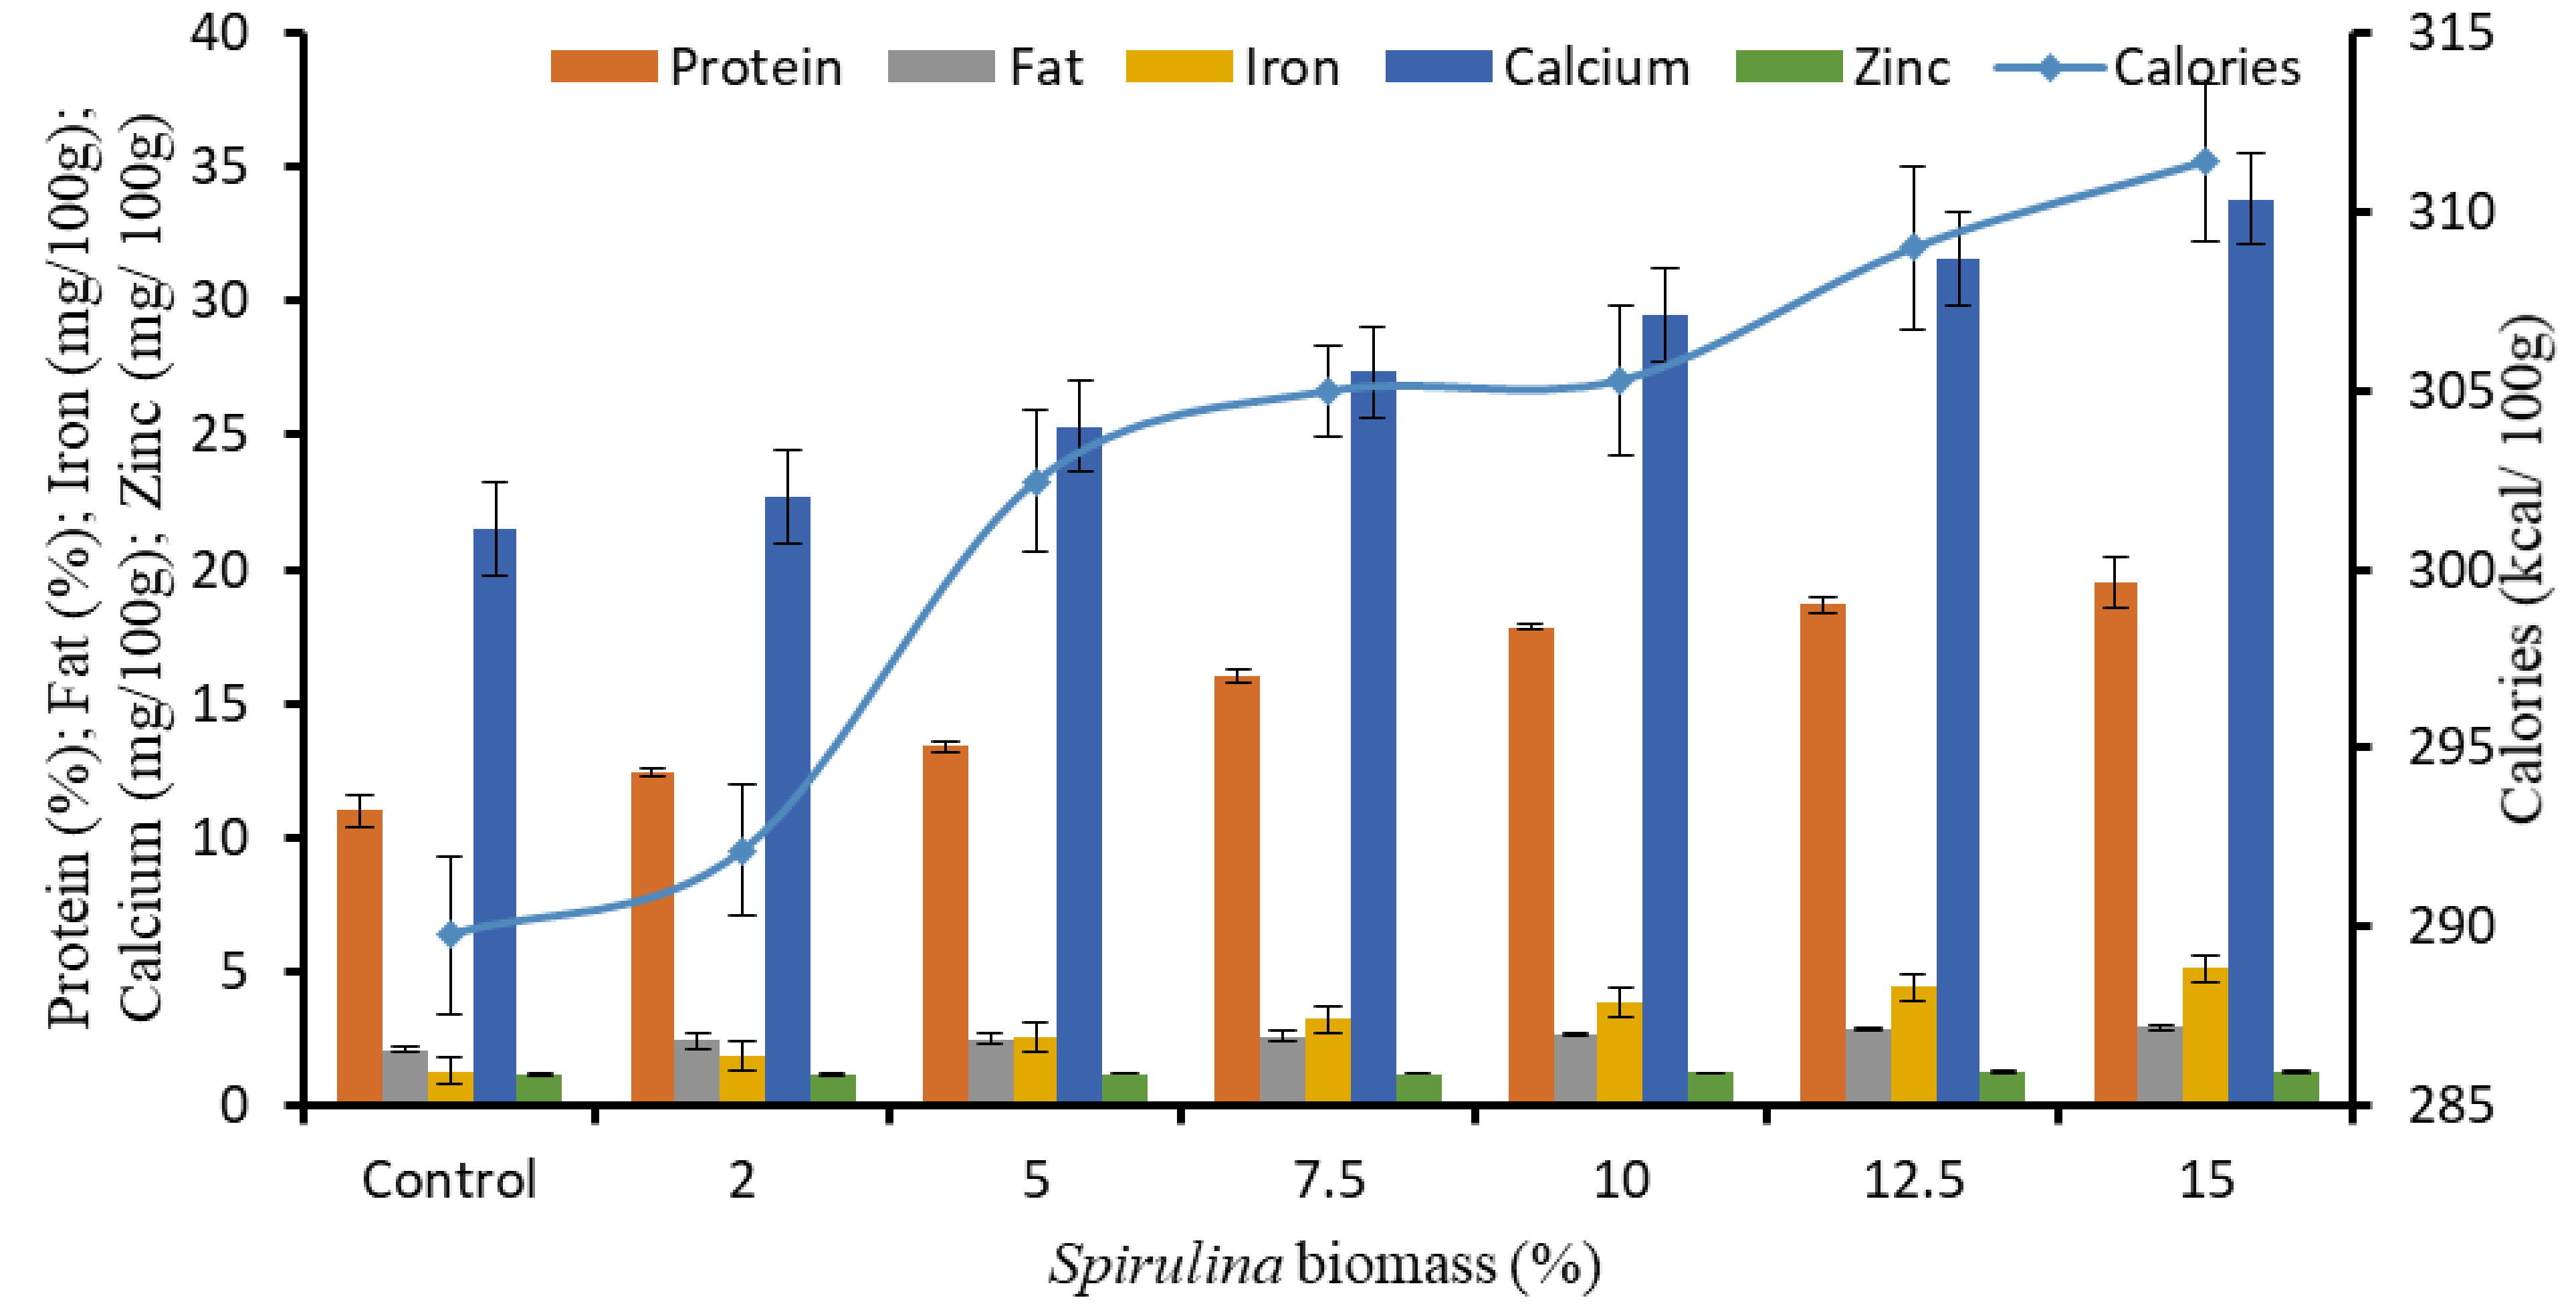
3.2.4. Micronutrients

The cultivated Spirulina platensis had 26.59, 107.83 and 1.87 mg/100 g of iron, calcium and zinc, respectively, on dry weight basis. While control pasta had 1.28, 21.57 and 1.13 mg/100 g of iron, calcium and zinc, their content in SEP increased up to 296.99%, 57.27% and 10%, respectively (Table 2). These findings are similar to those of Burcu et al. [43] who supplemented bread with 10% S. platensis and reported an increase of 45.95, 14.0 and 3.24 mg/100 g of calcium, magnesium and iron content, respectively, over control. Several researchers [16,44] have also reported similar findings for Spirulina enriched pasta, biscuits or cookies. No significant differences were recorded between minerals content of cooked and raw pasta, indicating non-significant leaching of minerals in cooking water (Figure 2). A single serve of cooked SEP12.5 pasta could provide 19.68% of RDA for iron and 11.66% of zinc. Its label can therefore claim “good source of iron” on the package. Further, it provides calcium content of 26.86 mg per serving. SEP can therefore emerge as a suitable means for hidden hunger alleviation programs.
On the basis of the nutrients’ composition, the calorific value per 100 g of pasta was calculated in the range of 359.71 to 372.75 calories which was 4.12% more in SEP12.5 pasta when compared with control (Table 2). These findings are on anticipated lines as Spirulina is a rich source of protein with low lipids and low calories content and is cholesterol-free unlike the other protein sources viz. dairy and meat products [45]. The ash content in control pasta was estimated to be 0.57% while that of SEP ranged from 1.04 to 1.39%. SEP12.5 and SEP15 were found to have 1.34% and 1.39% ash content (Table 2), respectively. Agustini et al. [36] have reported profound increase in the ash content for S. platensis enriched dried noodles (2.46%) as compared to control noodles (1.37% ash). No significant difference was recorded in the initial moisture content (5.52–6.21%) of the control and SEP (Table 2).

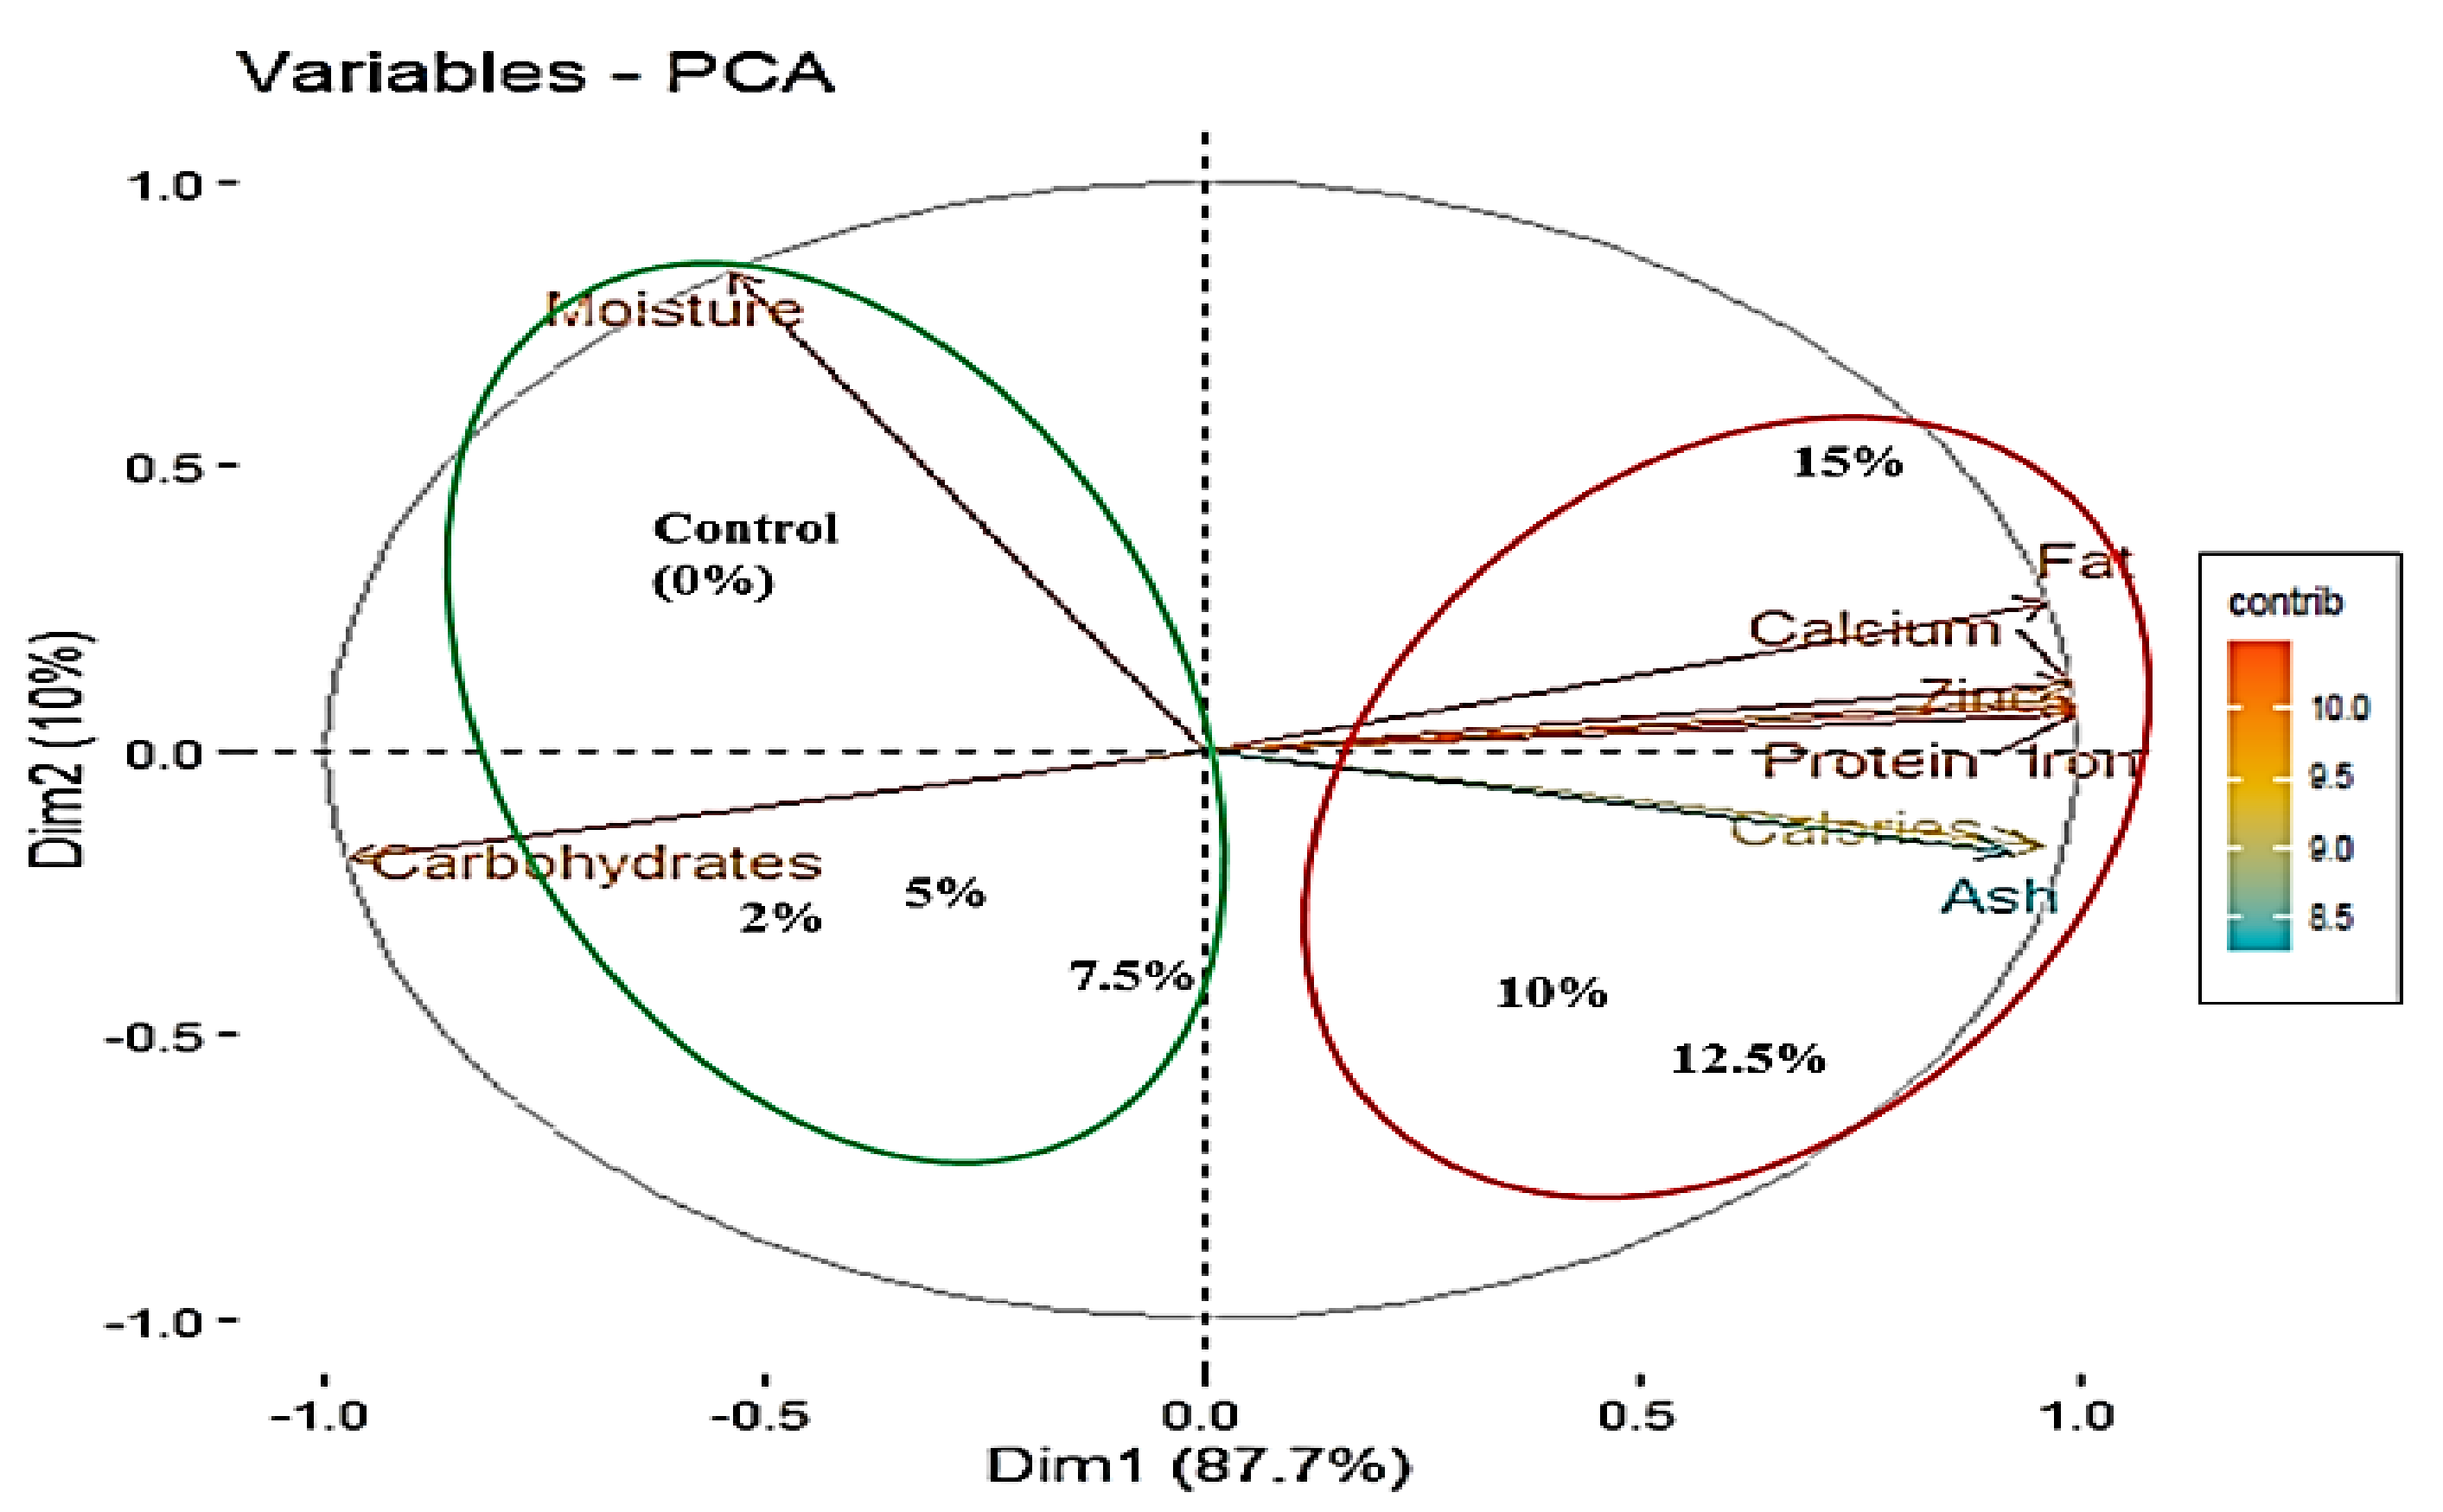
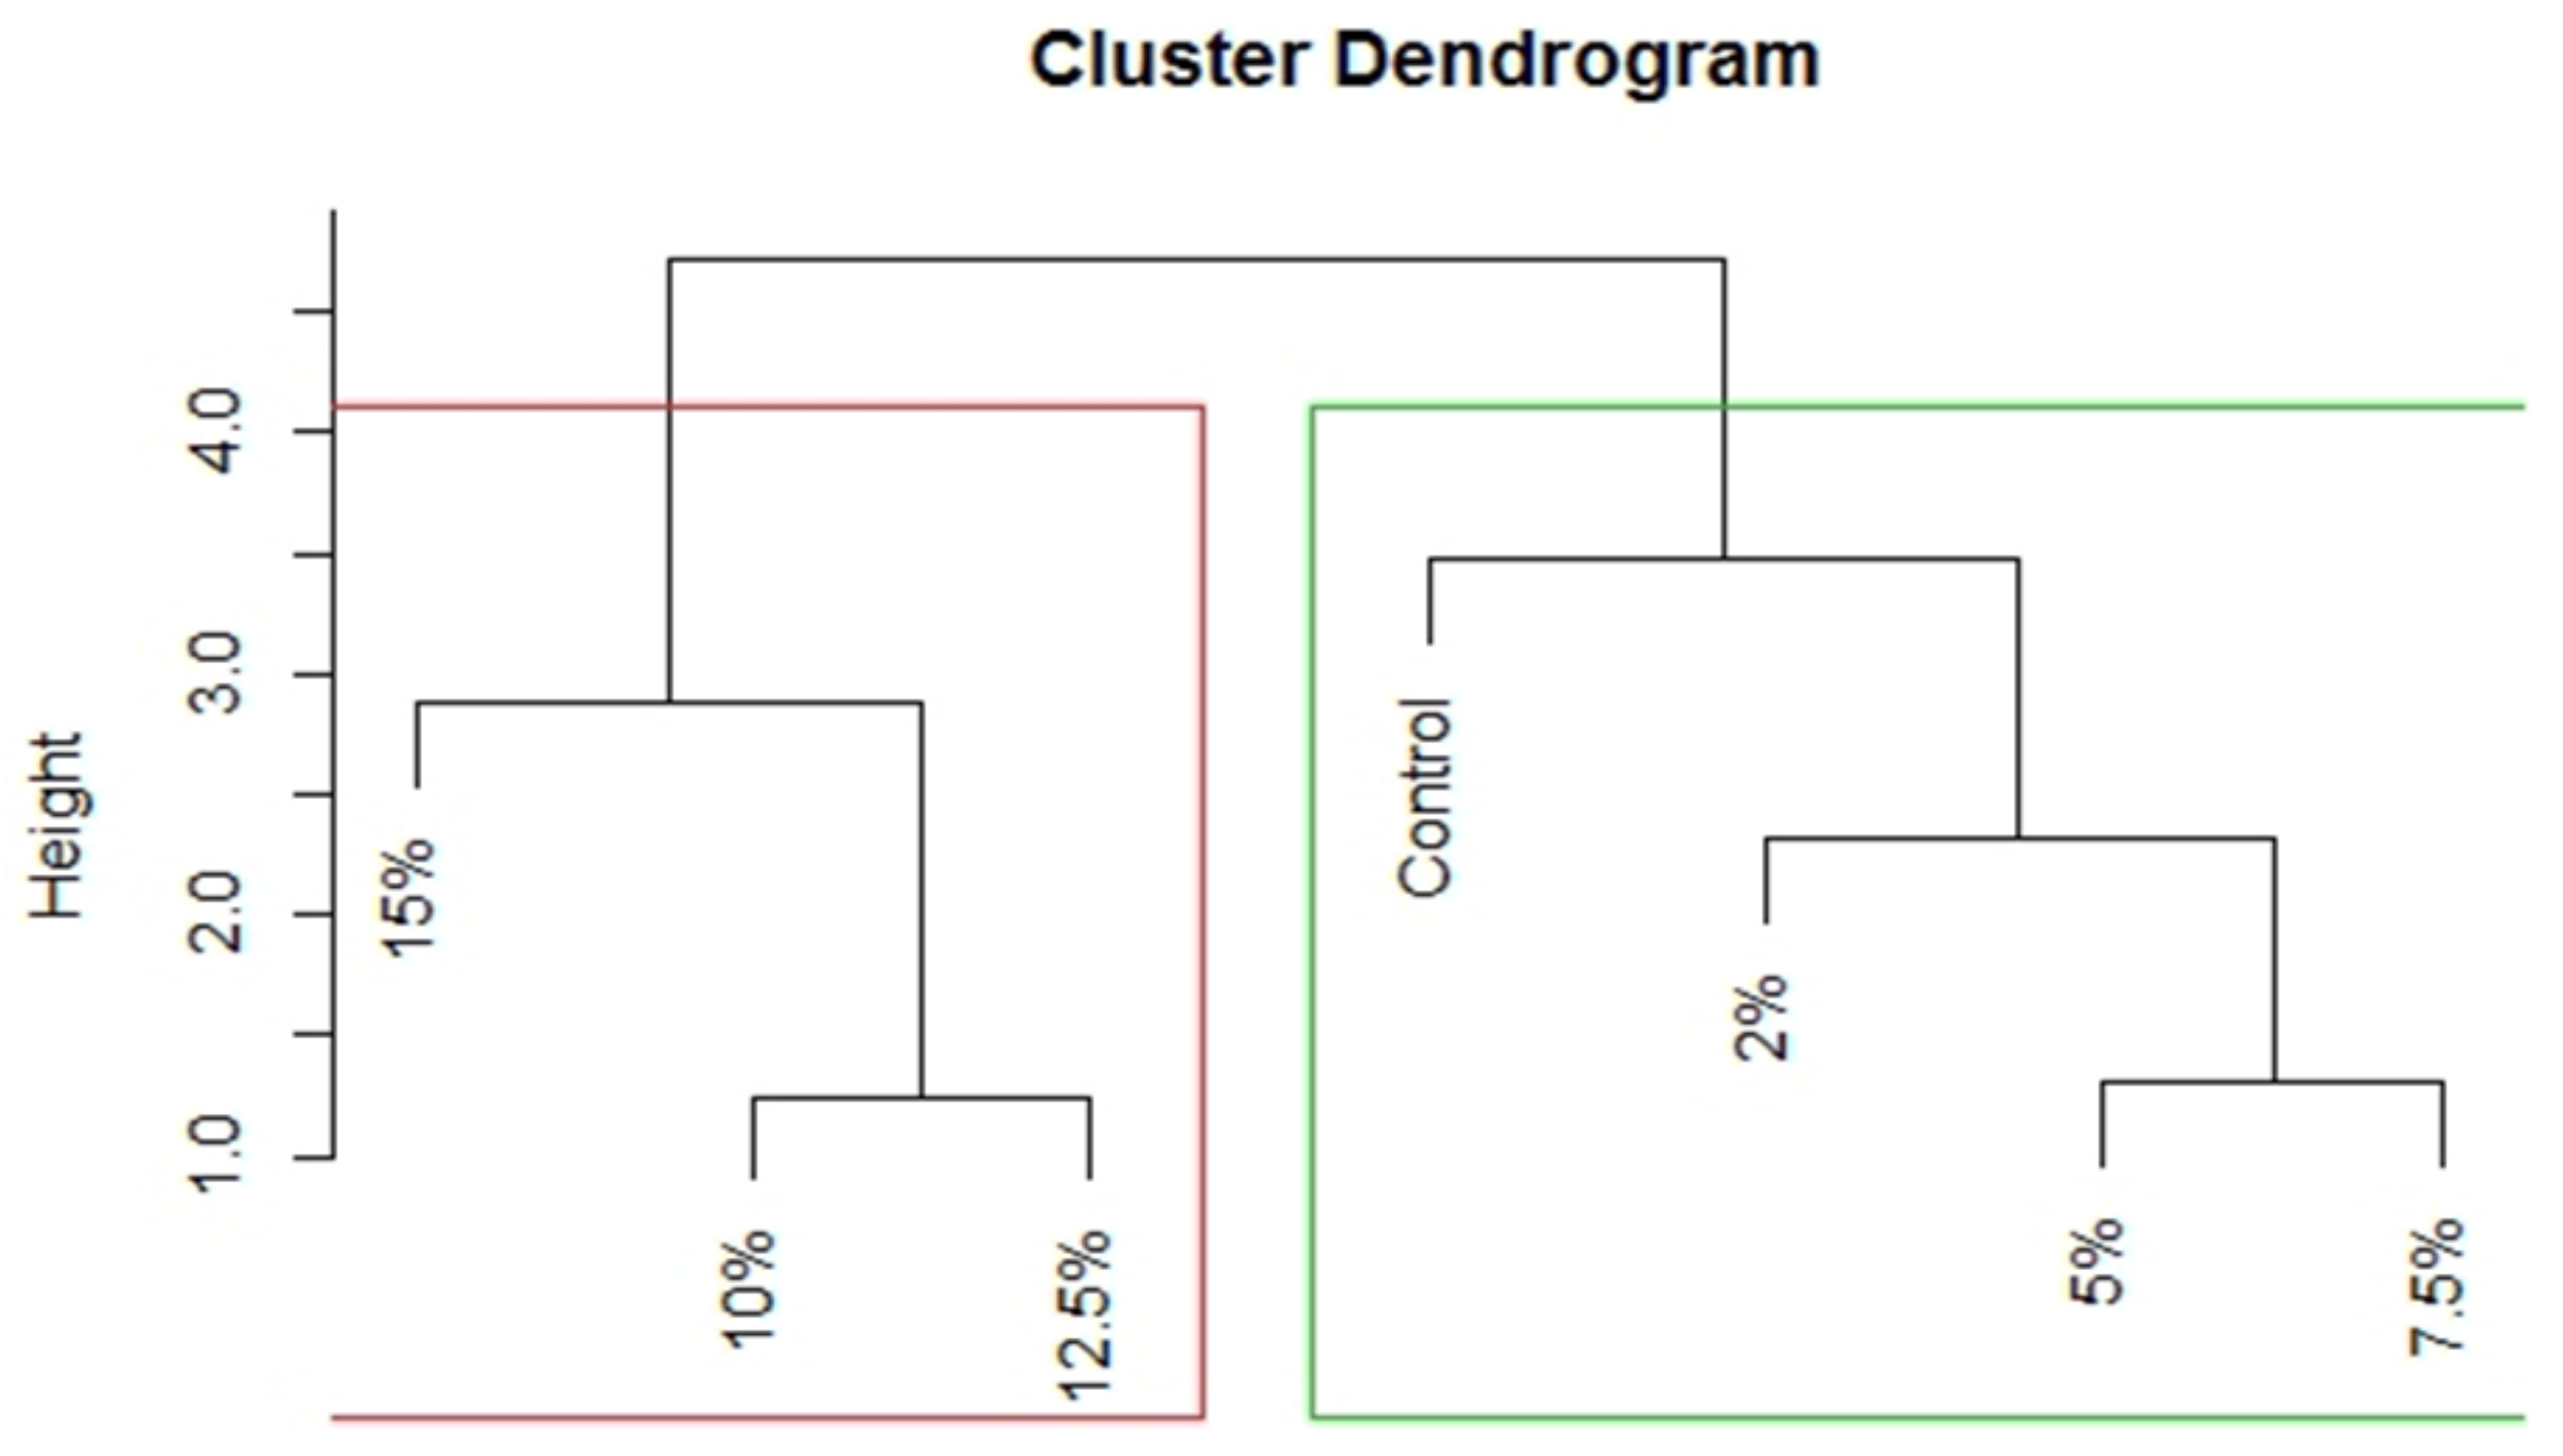
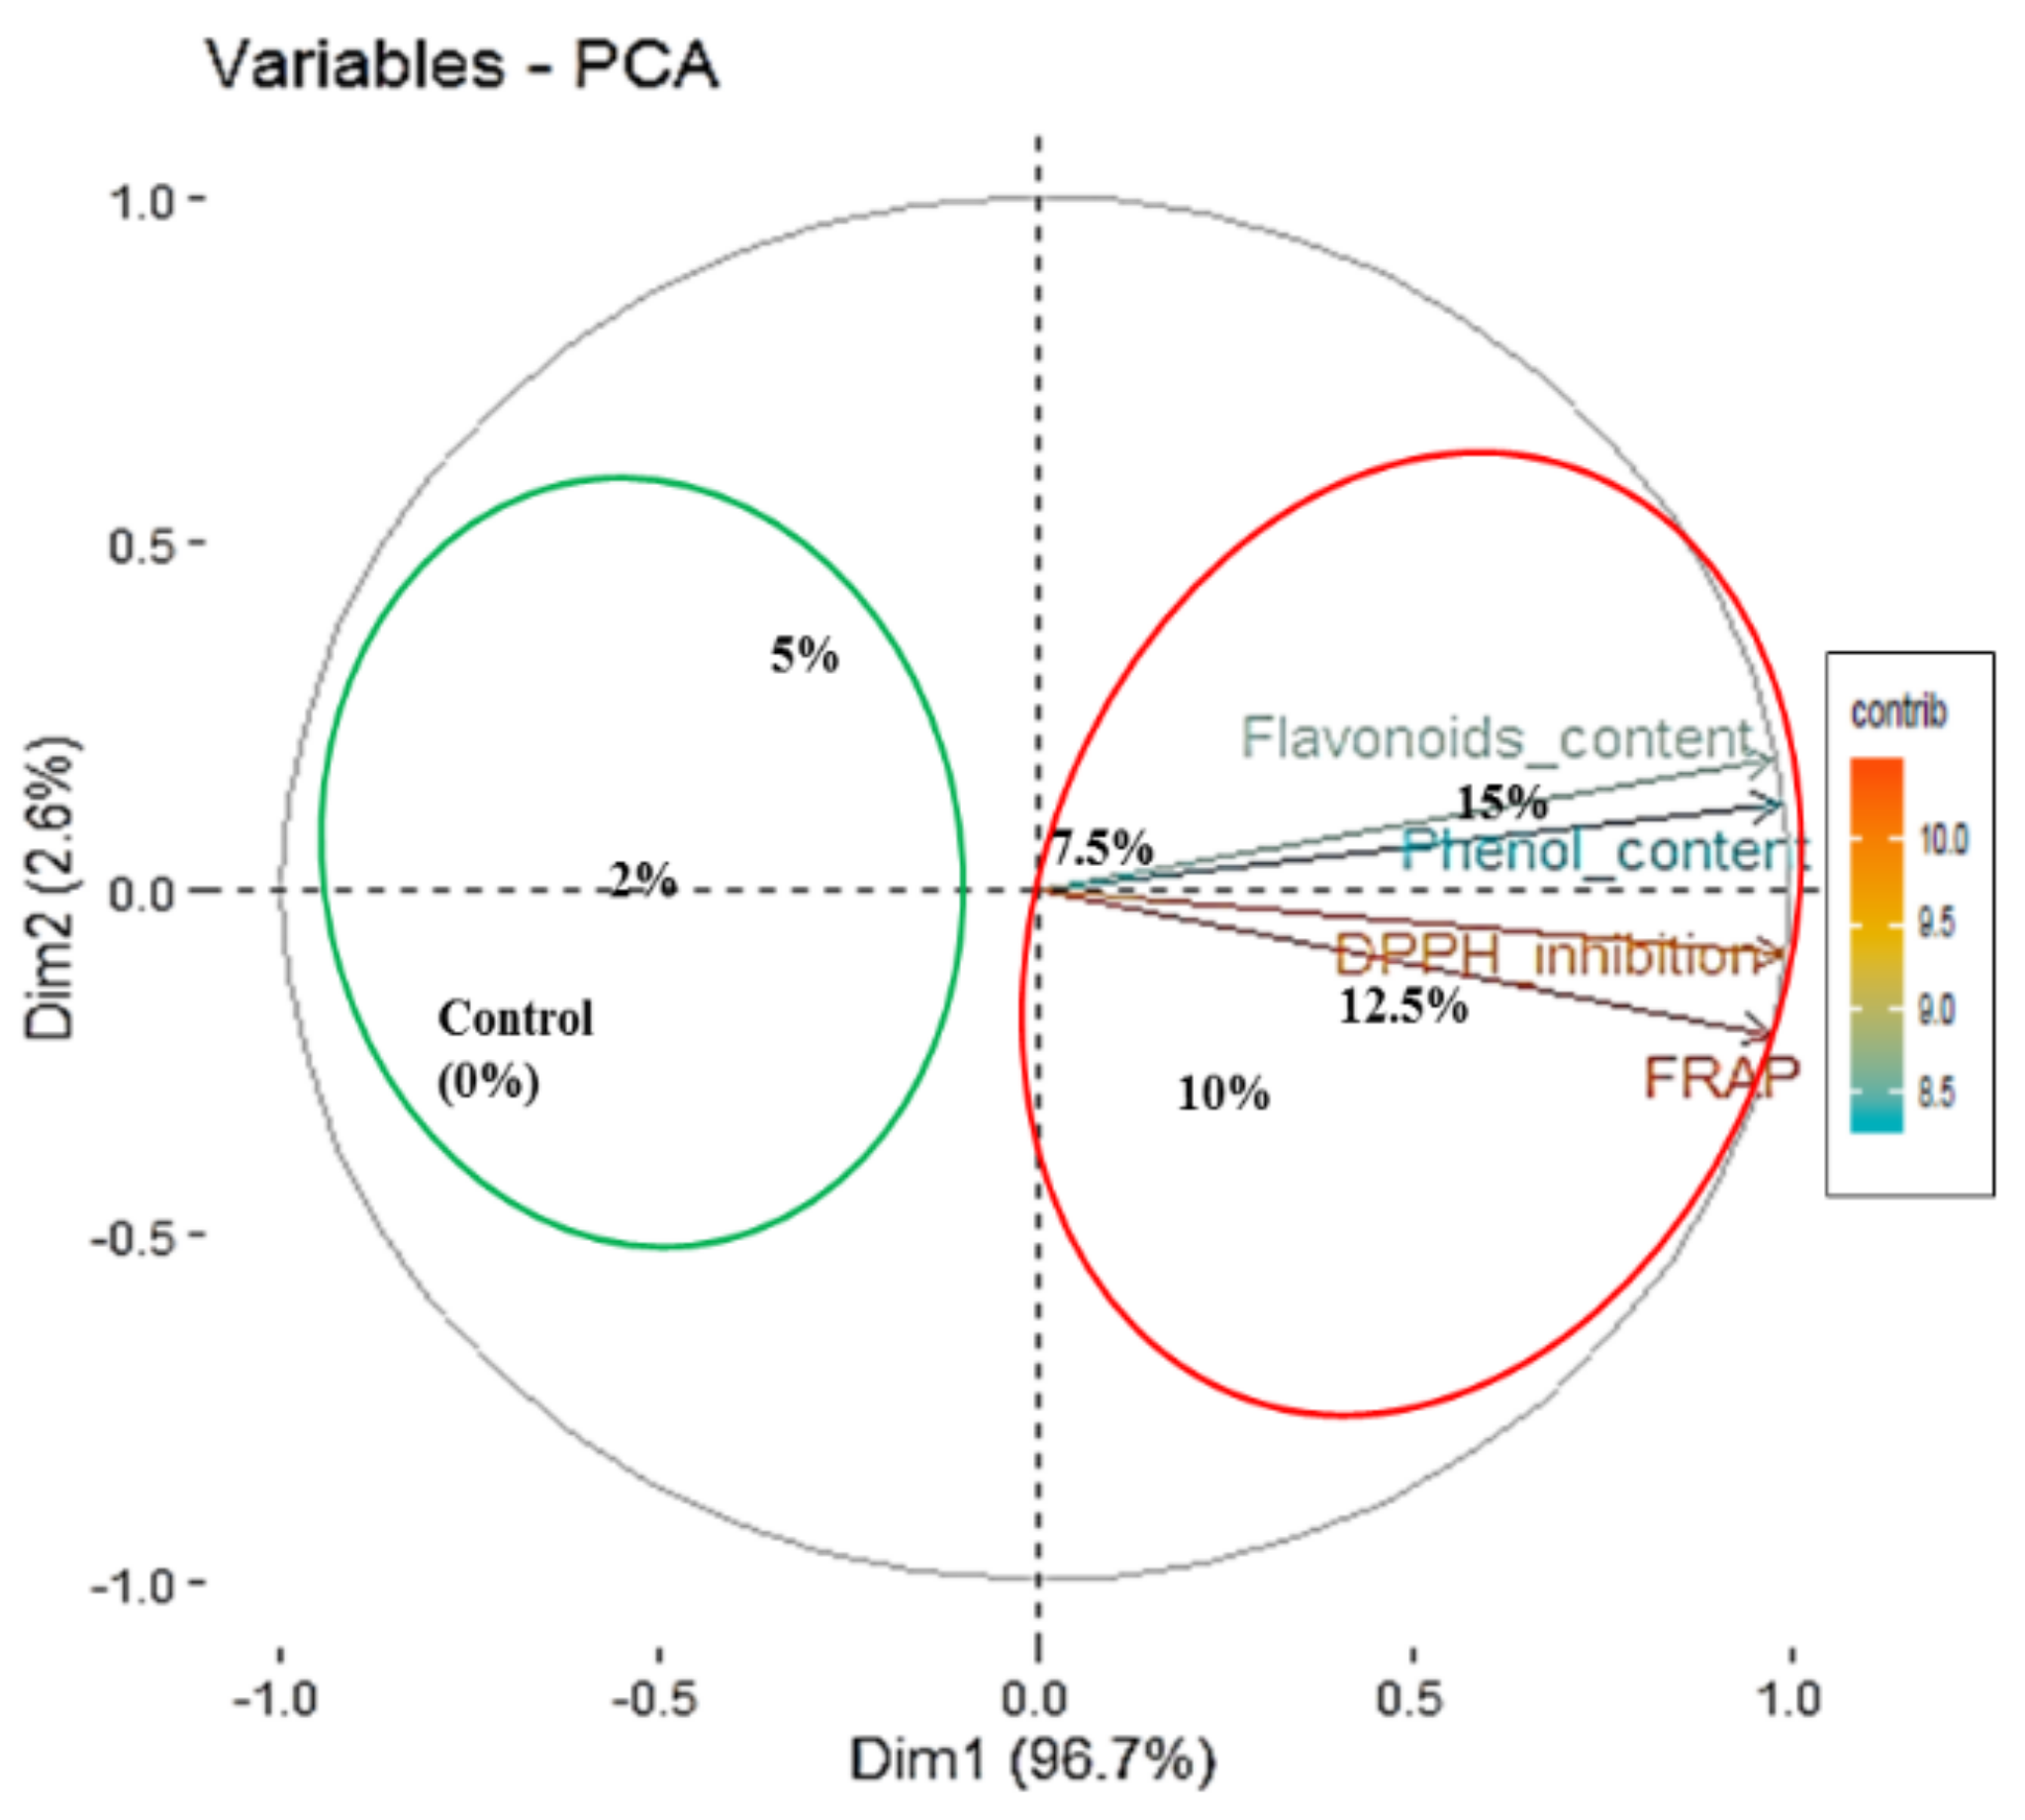
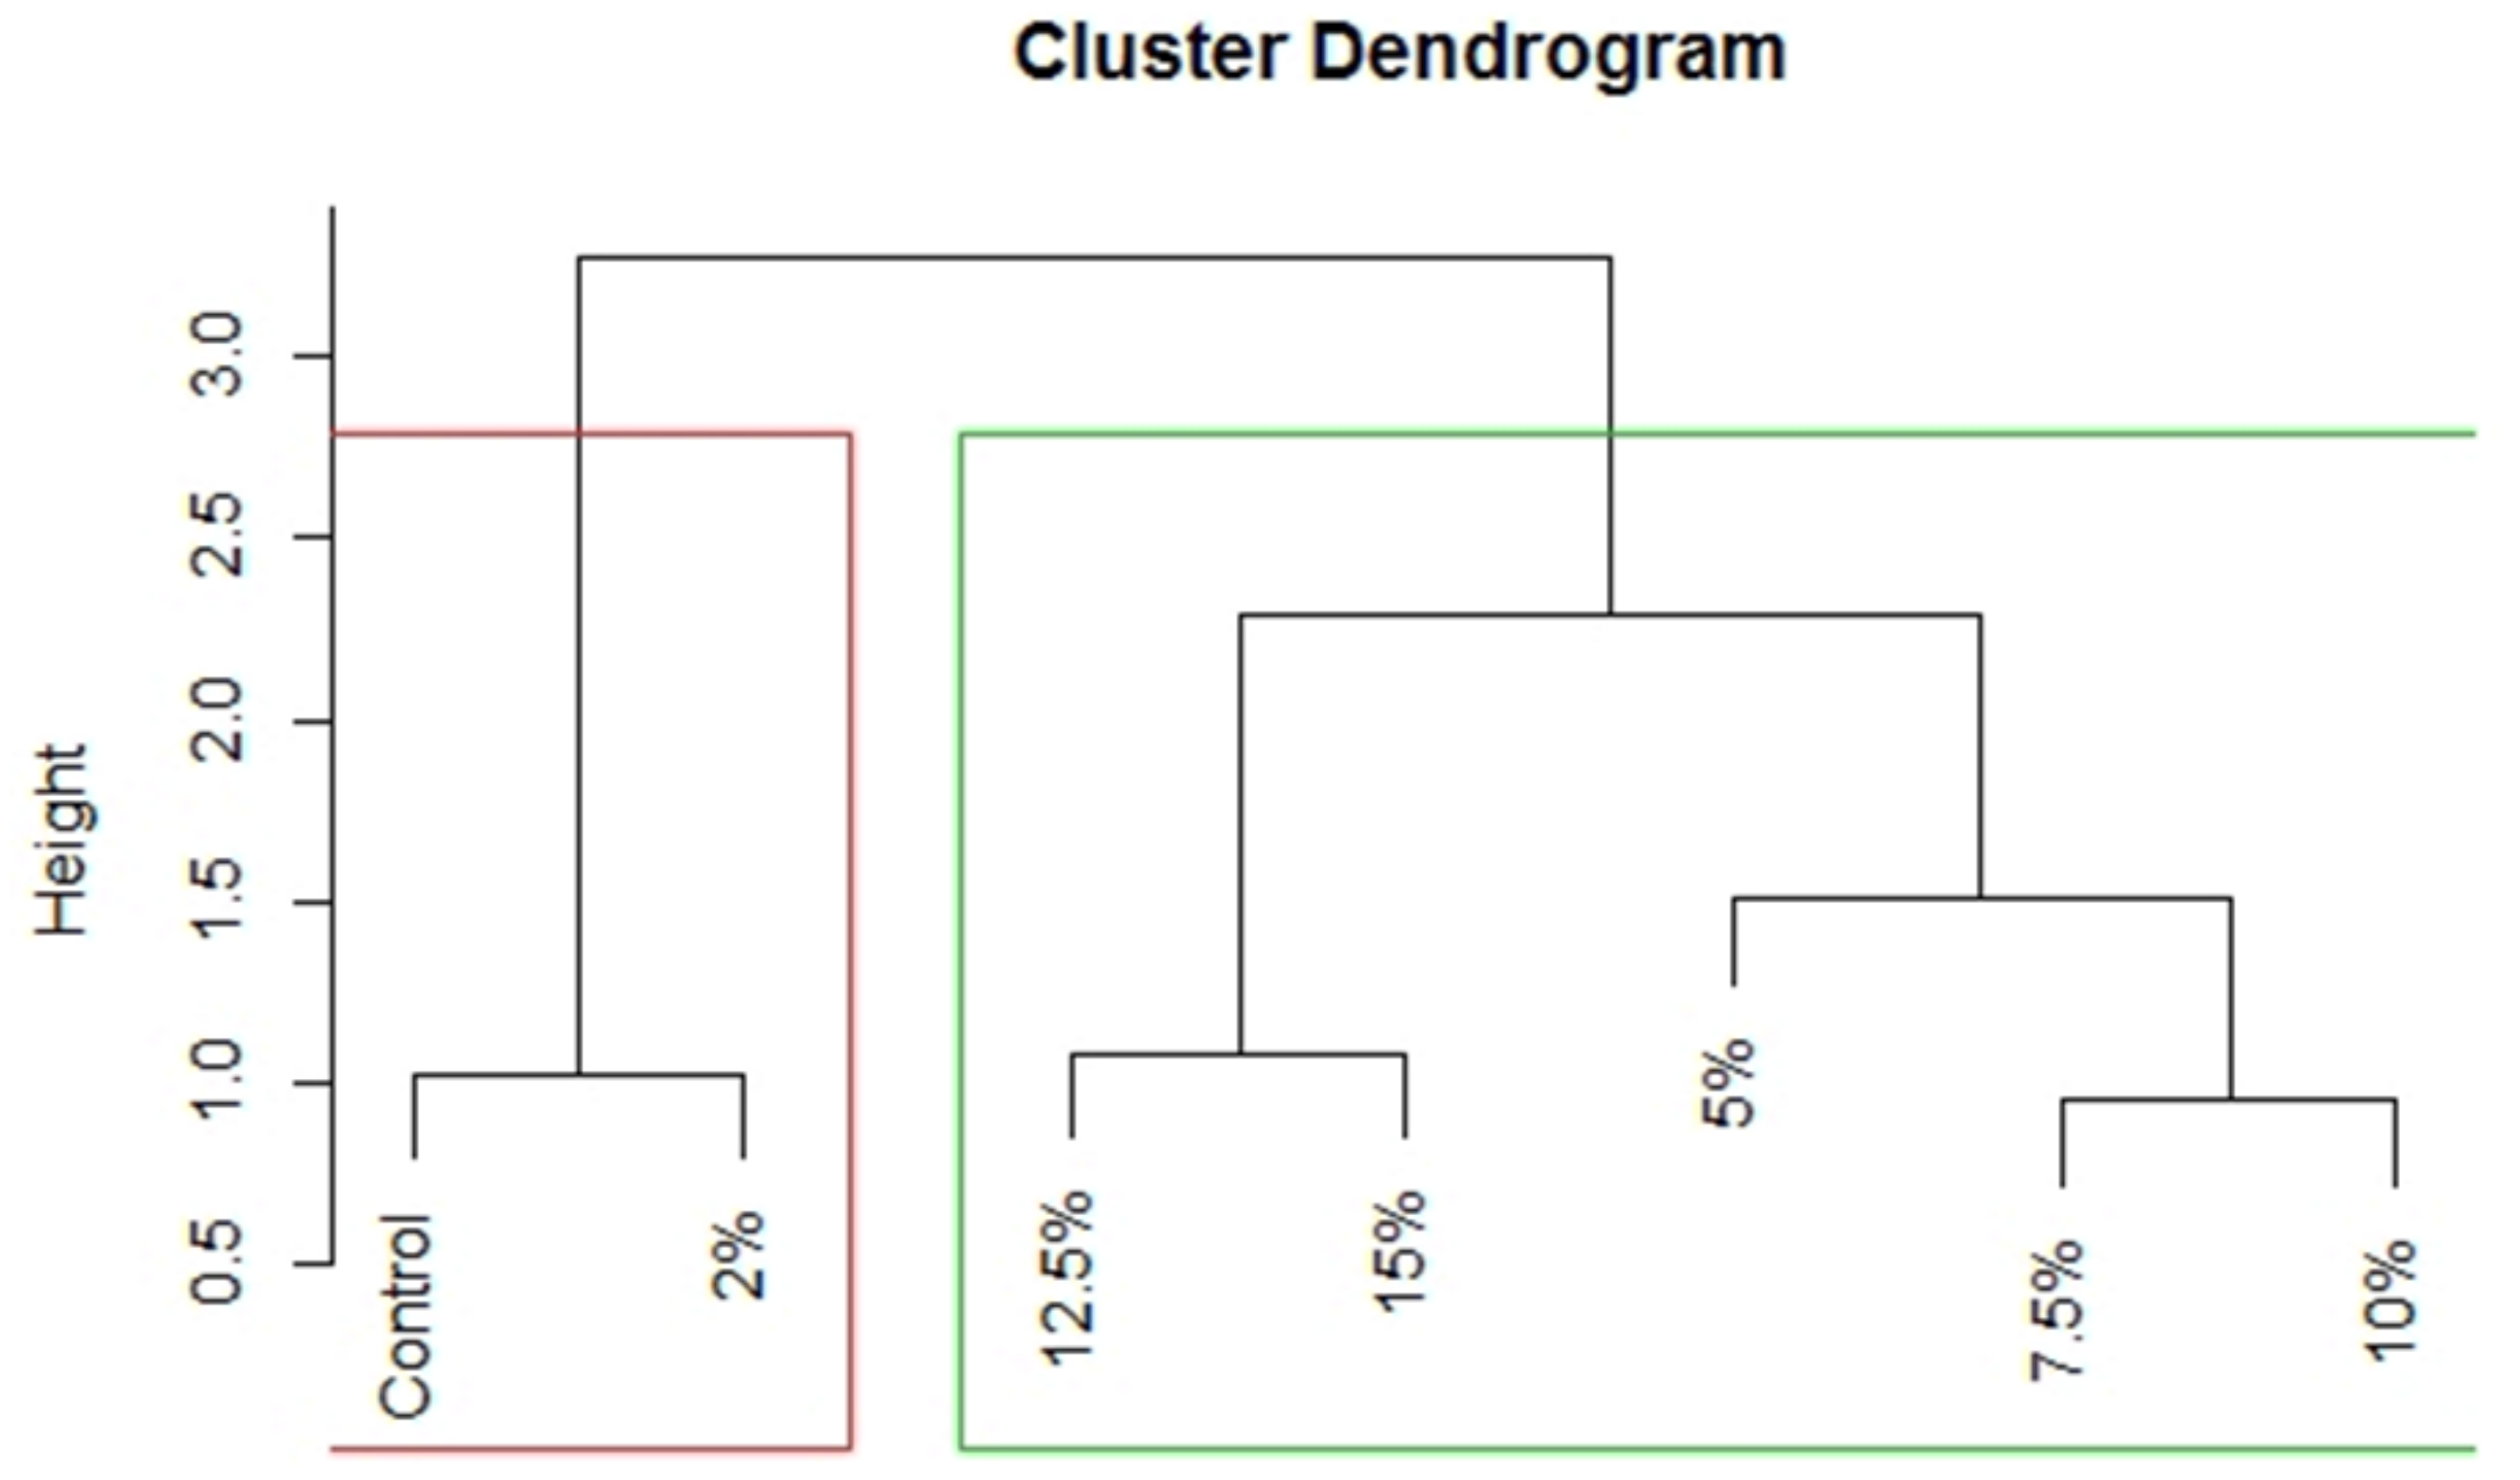
3.2.5. Principal Component Analysis

Principal Component Analysis (PCA) was carried out to establish correlation among different nutritional parameters (Table 3) due to change in Spirulina biomass supplementation of pasta. Out of the six Dimensions (Dim) or Principal Components (PC), first PC alone accounted for 87.65% variation and second PC for 10% variation. These two PCs together explained 97.72% variation in the data. Thus, these two PCs were screened out for further interpretation. All the variables except moisture were having high loading on Dim 1 whereas moisture was having high loading on dimension 2. Besides, carbohydrates and moisture were having negative impact on dimension 1. The PCA results also produced contribution values of variables under study. Based on Figure 3 it could be interpreted that treatments are having significant impact on almost all the variables (which are lying above the cutoff line of expected contribution of variables) except calories and ash. From the biplot (Figure 3) obtained through PCA method based on contribution of variables towards Dim 1 and 2, it was clear that, two groups can be formed where Group 1 treatments viz. 15%, 12.5% and 10% supplementations were having measurable impacts on all the nutritional composition parameters which were significant except moisture and carbohydrates. On the other hand, Group 2 treatments viz. 7.5%, 5% and 2%, including control (0%), mainly impacted moisture and carbohydrates. Dendrogram (UPGMA) which is a simple agglomerative hierarchical clustering method based on Euclidian distance also revealed the same grouping (Figure 4).

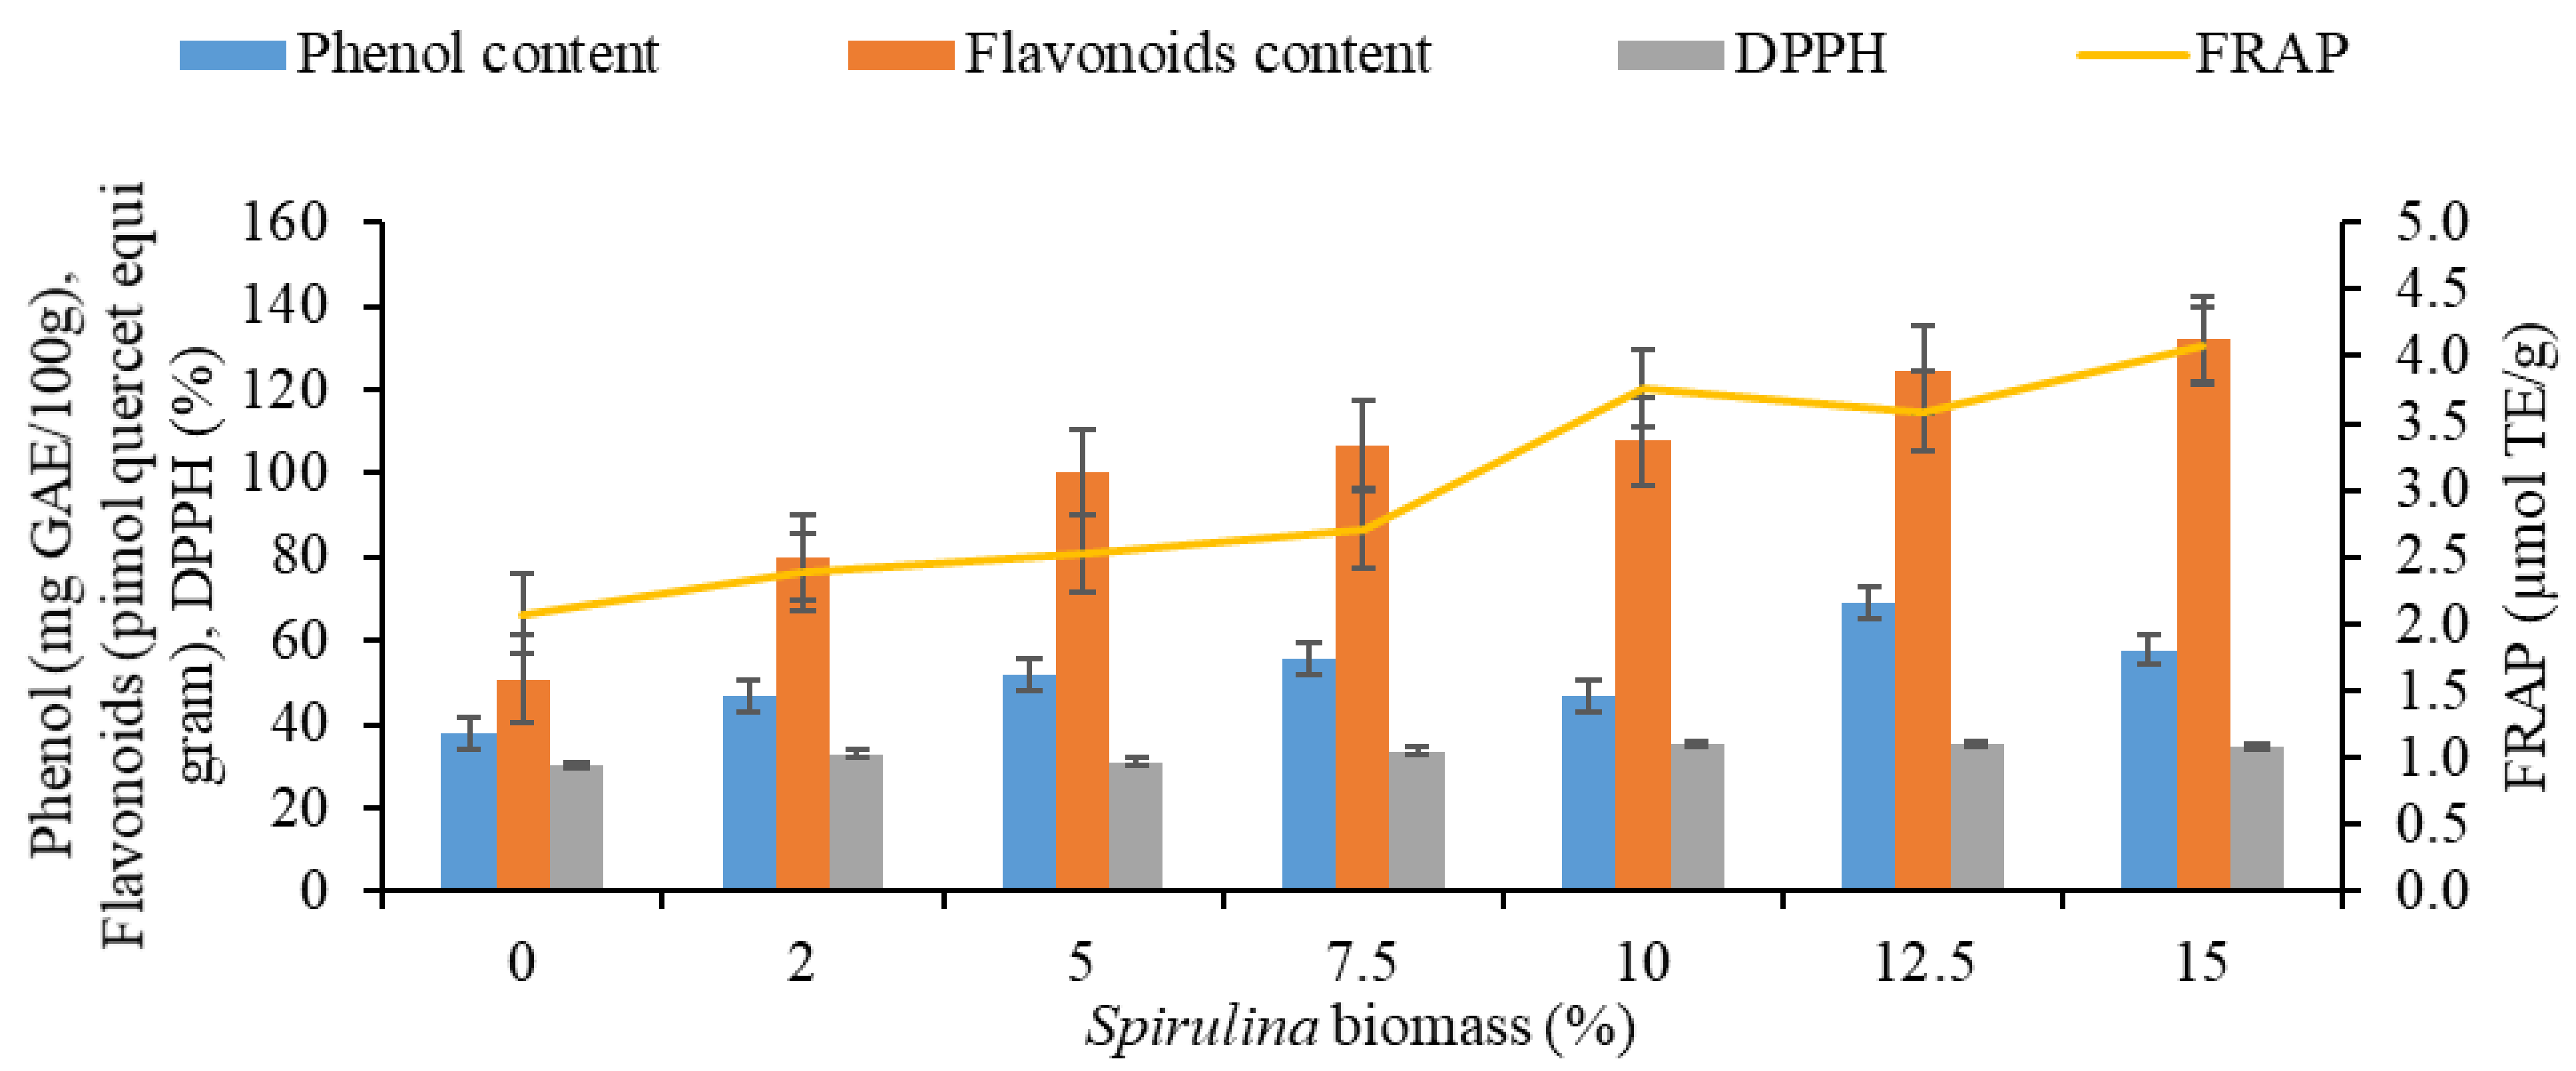
3.3. Total Phenolics, Flavonoids and In Vitro Antioxidant Activity

Total phenolics, flavonoids which represent the functional component of a food material were found to be higher in SEP as compared to control pasta. The total phenolics content (TPC) of pasta ranged from 50.25 to 88.75 mg GAE 100 g−1 increased from 8.71 to 76.62% after incorporation of Spirulina biomass (Table 2). Phenolics as secondary metabolites are major health promoting compounds and contribute to antioxidant activity of microalga and subsequently, preparations supplemented with microalgae. These phenolic compounds are known to scavenge reactive oxygen species (ROS) and free radicals which are harmful to the human body. The raw and cooked SEP12.5 were found to have 81.75 and 69.05 mg GAE/100 g TPC. These values are comparable to that provided by strawberry juice (81 mg GAE/100 g) [46], considered as good source of polyphenolics. Flavonoids content of raw SEP12.5 was found to decrease from 144.25 to 124.55 picomol QE/g after cooking. The flavonoids provided by the SEP are also in good proportion and has potential for functional use. Flavonoids are considered to possess anti-inflammatory, anti-proliferative, hepato-protective, antiviral activities and help to protect from cancer, cardiovascular and age-related diseases. Increase in TPC from 0.72 mg GAE/g to 1.89 mg GAE/g upon enrichment with Spirulina powder at 6% level in bread has also been reported by Vatsala and Sudesh [47]. Kumar et al. [48] prepared Spirulina enriched bars whose TPC ranged from 5.56–7.90 mg GAE/g compared to 0.98 ± 0.03 mg GAE/g in control. Increment in TPC is in accordance with the previous reports [15,49] who have developed various Spirulina enriched products. Flavonoids content for SEP ranged from 92.06 to 167.31 pimol QE/g when compared to the control (63.65 pimol QE/g). SEP12.5 and SEP15 recorded 126.64% and 162.88% increase in flavonoids content, respectively (Table 2). After cooking of the pasta samples, the decrease in TPC and flavonoids content was recorded in the range of 37.93–57.78 mg GAE 100 g−1 and 50.69–132.10 pimolQE/g, respectively (Figure 5). Similar findings have been reported owing to degradation of a specific fraction of phenolics after heat treatment during cooking or leaching in boiling water [50].
The percentage inhibition of DPPH and FRAP measured the free radical scavenging attributes of the SEP and indicate its antioxidant potential. The DPPH inhibition of pasta ranged from 42.80 to 50.69% and FRAP ranged from 2.52 to 5.12 μmol TE g−1. Significant improvement in both the parameters was observed in comparison to control pasta, and maximum DPPH inhibition and FRAP activity was recorded for SEP15 (50.69% and 5.12 μmol TEg−1) followed by SEP12.5 (49.37% and 4.62 μmol TE g−1: Table 2). DPPH free radical scavenging activity varies in proportion to the phenolics content in a particular substance [49]. The addition of Spirulina biomass significantly improved the antioxidant capacity in terms of DPPH scavenging activity with nearly four times increase even upon enrichment at 5% level from the control pasta [51]. Similar trend of increased DPPH activity has been reported in the range of 11.90 to 16.61% in bread prepared with varied concentrations (2–6%) of Spirulina biomass which also exhibited increased phenolic content [47]. Rodríguez et al. [15] prepared bread wheat pasta with 5, 10 and 20% of Spirulina addition along with control and reported FRAP activity viz. 1.93, 2.87, 4.24 and 1.16 μmol TE g−1, respectively. The DPPH scavenging activity and FRAP activity after cooking were recorded in the range 30.10–35.19% and 2.07–4.08 μmol TE g−1, respectively. After cooking, DPPH scavenging activity and FRAP activity was recorded for SEP15 (34.73% and 4.08 μmol TE g−1) and for SEP12.5 (35.16% and 3.59 μmol TE g−1: Figure 5). The maximum “%-scavenging of DPPH-radical” up to 50.69% was obtained at SEP15, which indicates the proton donating ability of Spirulina. The result of DPPH assay signified that the Spirulina’s antioxidant virtue also works well in hydrophobic environment whereas, the FRAP and reducing power assay signified the possible presence of a high amount of amino acids that have reducing ability. The positive results in DPPH together with FRAP and reducing power assays suggest that the Spirulina’s antioxidant activity is contributed by both through scavenging the already produced ROS via redox reaction and by reducing the oxidized-metal ions, which can promote more ROS production. In case of PCA of antioxidant and functional activity related parameters, first PC alone explains 96.7% variation in the data i.e., all the variables are having high loading on Dim 1 or PC1 (Table 4). Based on Figure 6, it can be inferred that treatments are having significant impact on DPPH inhibition and FRAP (which are lying above the cutoff line of expected contribution of variables). From the biplot (Figure 6) obtained through PCA method based on contribution of variables towards Dim 1, it is clear that, again two groups can be formed; Group 1 with 15%, 12.5%, 10%, 7.5% and 5% of treatments, respectively, having measurable impacts on antioxidant activity as measured by DPPH inhibition and FRAP whereas Group 2 consisting of only 2% and control (0%) treatments which will be having not that much impact on the characters under study. In this case also the dendrogram (UPGMA) prepared based on Euclidian distance reveals the same grouping (Figure 7).

3.4. Cooking Quality

Optimum Cooking Time (OCT) of pasta was 5.35 and 5.21 min for control and SEP12.5, respectively, (Table 5) showing marginal change. Fradique et al. [42] also reported no change in OCT and textural properties in fresh spaghetti prepared with addition of Spirulina maxima and Chlorella vulgaris. The lower OCT could be due to the fact that proteins present in Spirulina hindered the development of gluten network, therefore, the cooking time reduced with increase in Spirulina biomass after initial increase in OCT [52]. Increase in true volume, increase in weight and cooking loss are main attributes determining the physical changes occurring during cooking of pasta. These are important indicators which also determine the quality of pasta prepared. Increase in length and width of 23.76% and 58%, respectively, was recorded for SEP12.5 post cooking as compared to control (30.97% and 47.11%: Table 5). True volume of pasta as determined by volume displacement of toluene recorded increase in the range of 70.67 to 96.67% in SEP as compared to control (100%: Table 5). The true volume increase was found to be significantly lower for SEP as compared to control. SEP pasta was also found to have higher increment of weight (151.95 to 193.99%) after cooking over control (137.82%). Fradique et al. [42] have also reported higher weight of SEP upon cooking owing to high hydration of the starch present in the product in the presence of weaker protein network. Similar observations for pasta enriched with microalgae have been reported by Prabhasankar et al. [53]. The gruel loss of control and SEP was found to lie in the range of 4.13% (control pasta) to 6.66% (Table 5). The gruel loss was below the technologically acceptable limit (≤8%) [54] for all the pasta samples. In particular, SEP12.5 and SEP15 recorded cooking loss of 6.66% and 6.22%, respectively. The increase in cooking loss upon Spirulina enrichment can be related to steric hindrance in the gluten-protein network that is responsible for physical integrity of product during cooking [55]. The reinforced dough matrix of microalgae proteins and gluten is able to entrap starch and that may be a possible reason for cooking loss in a technologically acceptable limit. The recorded cooking loss for SEP was found to be lower than that reported by Özyurt et al. [44] which was in the range of 6.83 to 7.84%.

3.5. Textural Analysis

There were significant variations in textural attributes viz. firmness, stickiness, cut force, consistency and cohesiveness of cooked pasta with varied levels of Spirulina biomass supplementation. The mean firmness and cut force varied from 2 596.45 to 4912.19 g and 531.78 to 637.28 g, respectively, across different preparations of pasta (Table 6). Firmness of cooked pasta is one of the most important parameters governing its acceptability. It is analyzed by measuring the resistance offered by the pasta upon compression. The increasing proportion of Spirulina biomass in the matrix is certain to hamper the cross-linkages of gluten responsible for binding starch–protein complexes together. However, the decrease in firmness should not be so excessive that the structure of pasta becomes lumpy and unable to hold itself. In the present study, as anticipated, firmness of SEP was lower than control, however, no systematic trend was recorded with increase in biomass level in cooked pasta. Cutting force, another major indicator of acceptability of pasta is the force required by knife or fork to cut the cooked pasta and comes closer to the actual process of consuming the pasta as compared to firmness, which resembles the process of bite post-consumption [56]. Cut force of control pasta recorded as 637.28 g was found higher than SEP at all concentrations. However, an interesting trend reversal was observed beyond biomass level of 10% where increase in cut force was observed for SEP 12.5 and SEP 15. It is possible that the proteins and dietary fiber contributed by Spirulina reached the threshold level of interaction above 10% and were able to forge intra- and inter-constituent linkages promoting the cohesion and resulted in higher cut force.
Stickiness of pasta is another important attribute to measure the al dente feeling upon consumption of pasta. Stickiness of control pasta was found to be lower than SEP, however, again no definite trend was observed with increment in level of Spirulina biomass in line with other textural characters. The increment in stickiness was found to vary from 6.27 to, as high as, 78% (Table 6). This increase is again on expected lines as Spirulina possesses soluble polysaccharides or dietary fibers. Depending on the complex interaction during cooking process between fiber-starch and available water for hydration, the soluble fibers are able to hydrate and exert adhesive/stickiness attribute to the cooked pasta. The consistency of cooked pasta generally relates to the smooth texture and stickiness of pasta. While consistency of control pasta was recorded to be 23.98 kg.s., the SEP recorded lower consistency values of 13.53 kg.s. and 15.52 kg.s. for SEP12.5 and SEP15, respectively, indicating partial disruption of gluten network owing to interference by biomass constituents (Table 6). Though the consistency of SEP pasta was lower than control, no systematic trend was observed with increase in proportion of Spirulina biomass in semolina matrix. These findings hold relevance as the water holding capacity of the product also increases with increase in biomass that helps to soften the structure of the formulated product [57]. Thus, even though the network formation is not disrupted, beyond a threshold limit, which in this case was above 12.5%, the moisture uptake might be comparatively high for the structure to support and strengthen. Despite the anomaly, the firmness, cut force and other textural properties of pasta are perceived by consumers and pervasively have been found to have negative correlation with cell structure and expansion of the product [32].

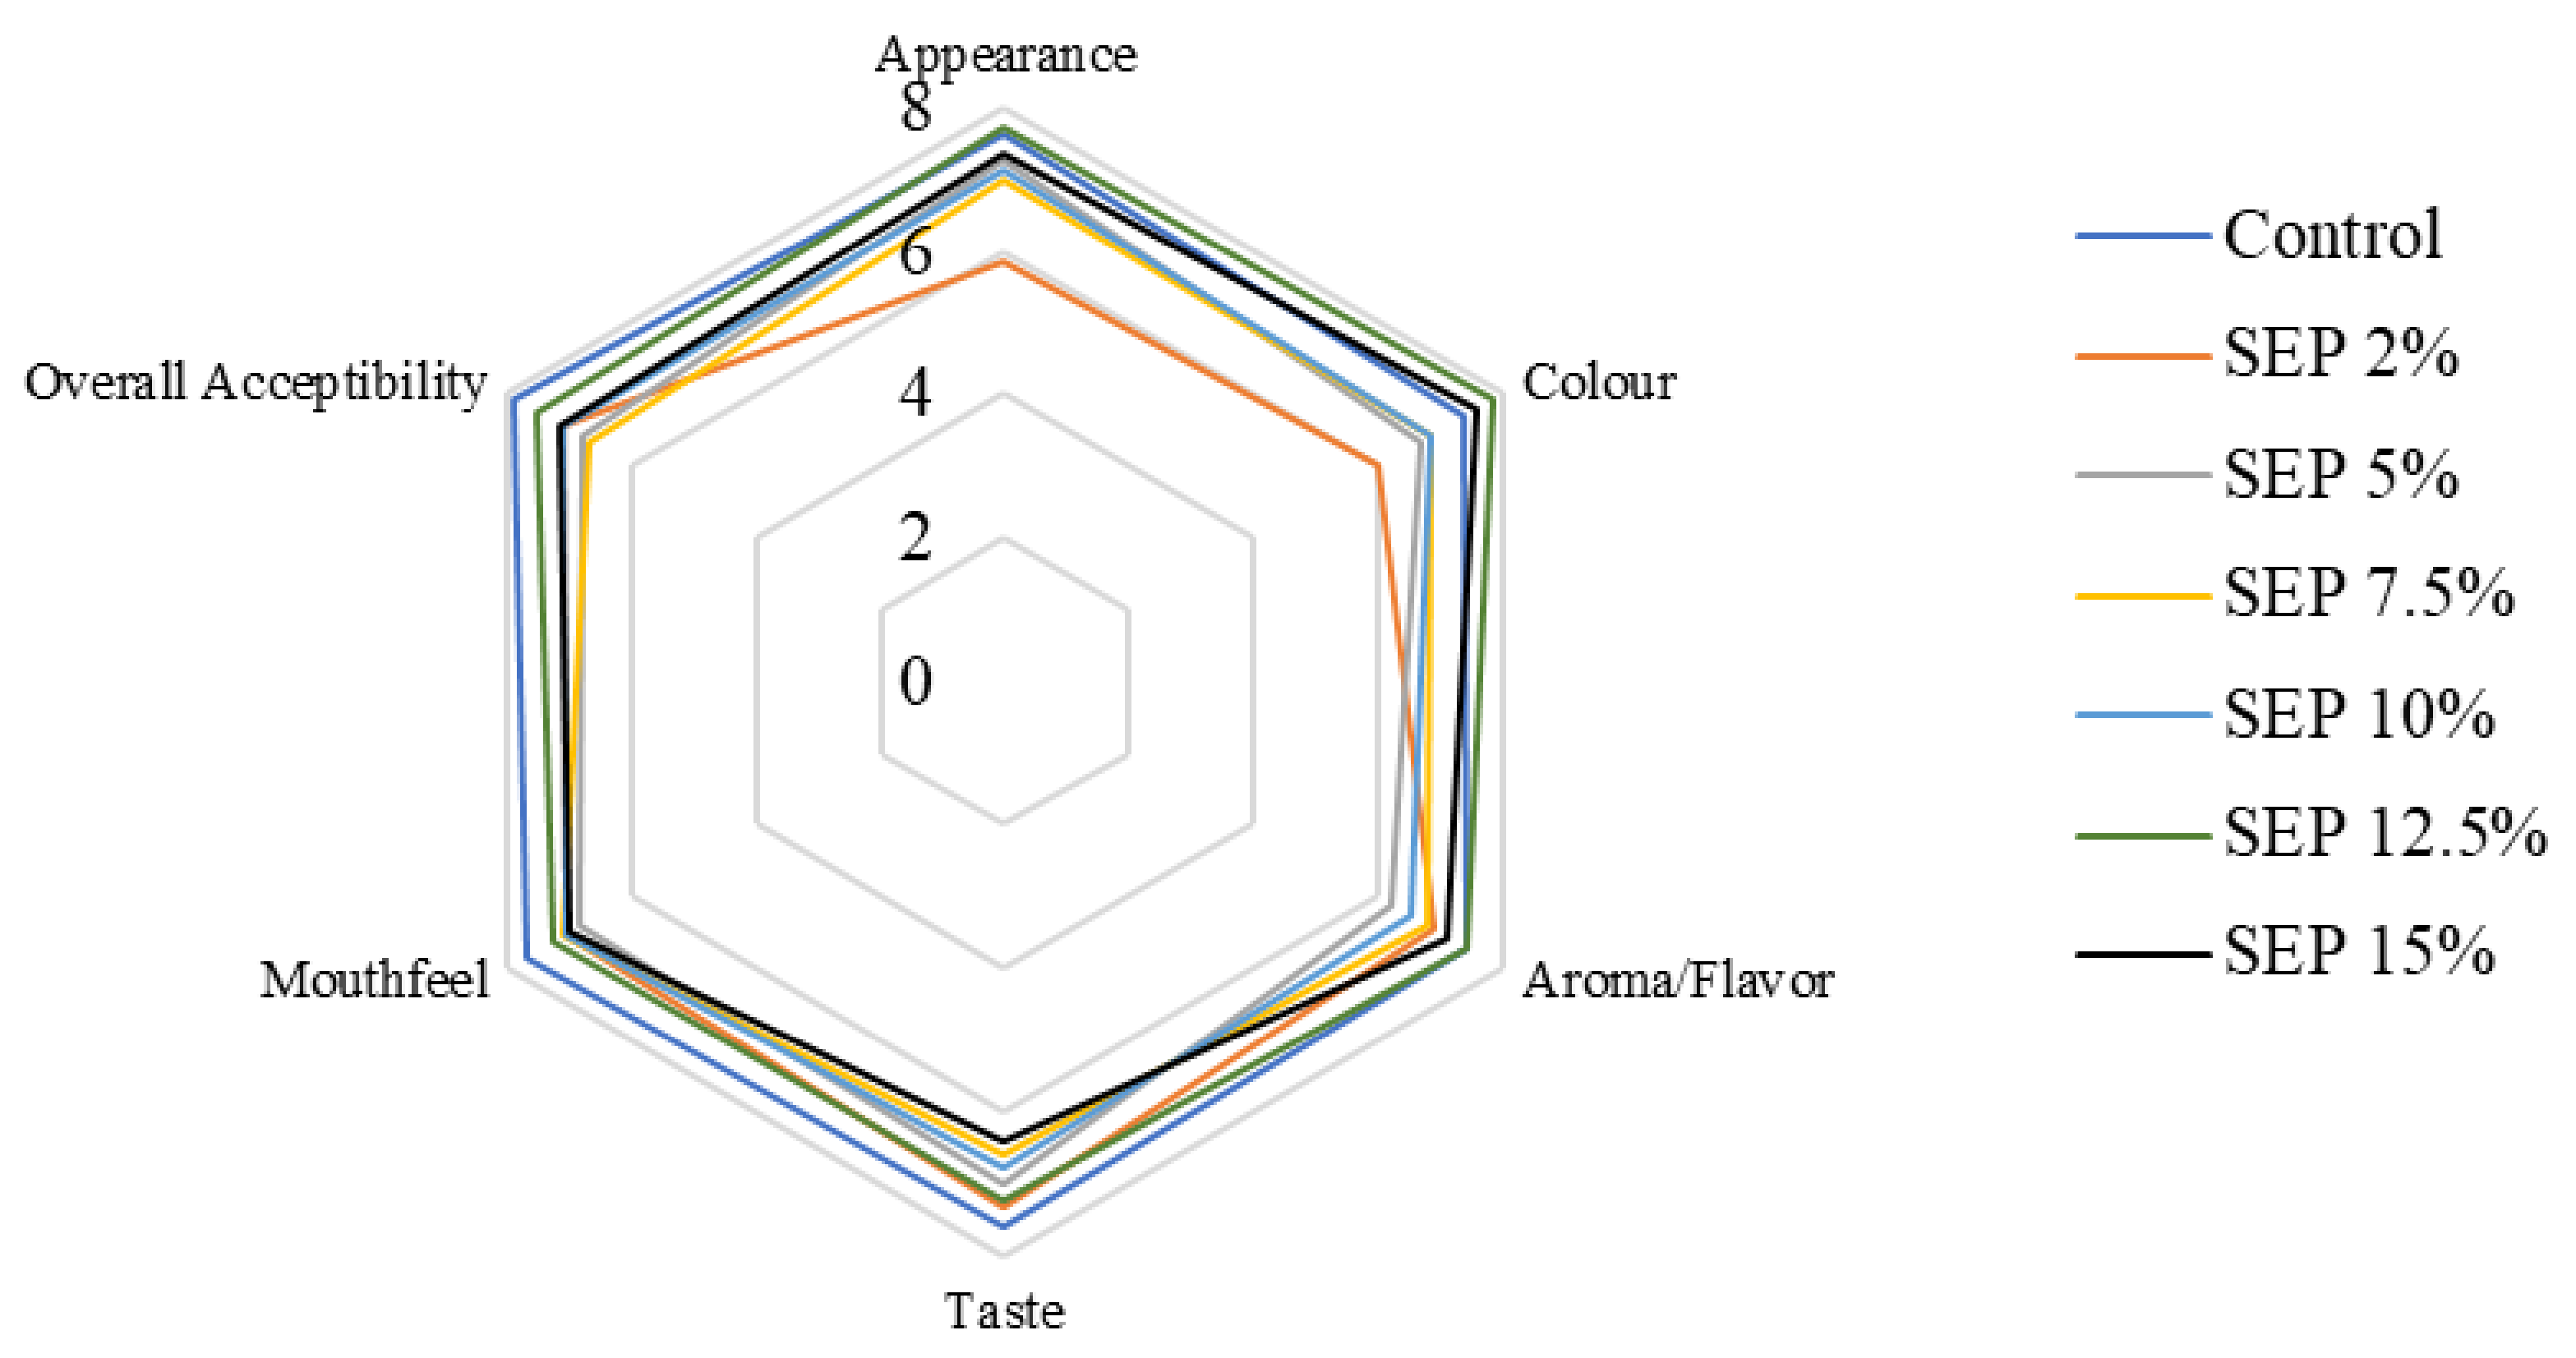
3.6. Sensory Attributes

Figure 8 depicts the average findings on sensory attributes following evaluation by 83 panelists. The addition of Spirulina in pasta led to development of bright green color that improved its appearance. Similarly, other parameters were in the range of “Like moderately” for degree of acceptance. SEP12.5 was rated as “Like very much” among all other formulations. The average overall score of acceptability was reported highest for control pasta (7.91) followed by SEP12.5 (7.56). Further, the appearance, color and aroma of pasta enriched with Spirulina were found better than the control. In terms of color, appearance and flavor, also SEP12.5 was rated high (7.81, 7.82 and 7.48, respectively). Further, the purchase intention of the pasta was high (approximately 8.13) implying that the evaluators “probably would buy” the evaluated products if offered in the market. Our findings are contrary to Morsy et al. [32] who reported that sensory acceptance for snack food formulated with 12.5% Spirulina powder decreased. It could be made possible by the incorporation of cheese in the pasta which was able to mask the flavor of Spirulina. Muresan et al. [51] have also revealed that the nutritional value and sensory attributes of pasta was significantly improved by addition of Spirulina (2% and 5%). Ours is the first study to have overcome the flavor barrier for Spirulina at such high concentrations. Earlier, a study performed by Burcu et al. [42] revealed the taste, smell and aroma attributes of bread enriched with 10% Spirulina biomass as “consumable” during panelist’s evaluation.

4. Conclusions

Results reveal that green pasta prepared with supplementation of Spirulina biomass submitted significantly higher in chemical composition such as protein, minerals, ash and total lipids over the control pasta. Besides, pasta enriched with Spirulina, at different levels of addition, possessed higher phenolic, flavonoids and antioxidants activity over control. Spirulina biomass supplementation above 7.5% was more effective in enhancing the nutritional value of pasta and accounted for higher positive influence on antioxidant activity and functional properties expressed in terms of phenolics and flavonoids. The pasta cooking quality was not affected adversely by incorporation of microalgae in the composition of pasta, and the textural properties were also favored that represent acceptable technological characteristics. Although, all the pasta samples were favorably evaluated for sensory attributes, pasta enriched with 12.5% Spirulina biomass was rated most acceptable by the panelists. Therefore, green pasta enriched with Spirulina shall surely have a positive impact on the consumer and be considered as a feasible and attractive option for improving the nutritional health of the population besides providing the industry with a diversified functional product.

Author Contributions

D.K.K.—Formal analysis, Investigation and Writing—Original draft; S.G.R.—Methodology, Supervision, Writing—review & editing; A.B.—Statistical analysis; S.P.—Conceptualization, Methodology, Supervision, Writing—review & editing. All authors have read and agreed to the published version of the manuscript.

Funding

This research received no external funding.

Data Availability Statement

The data presented in this study are available on request from the corresponding author.

Acknowledgments

The facilities provided by the Division of Microbiology, Centre for Conservation and Utilisation of Blue Green Algae and Division of Food Science and Postharvest Technology, IARI, New Delhi, India for carrying out these investigations are gratefully acknowledged. The first author (D.K.K.) acknowledges the financial support provided by ICAR-Indian Agricultural Research Institute, New Delhi and University Grants Commission (UGC), New Delhi for the study. Authors also acknowledge the financial support from Director, ICAR-Indian Agricultural Research Institute, New Delhi provided under the SCSP grant for publication.

Conflicts of Interest

The authors declare that they have no known competing financial interests or personal relationships that could have appeared to influence the work reported in this paper.

References

  1. Jensen, G.S. Blue-green algae as an immuno-enhancer and bio modulator. J. Am. Nutraceutical Assoc. 2001, 3, 24–30. [Google Scholar]
  2. Tamiya, H. Mass culture of algae. Ann. Rev. Plant Physiol. 1957, 8, 309–344. [Google Scholar] [CrossRef]
  3. Wu, Q.; Liu, L.; Miron, A.; Klímová, B.; Wan, D.; Kuča, K. The antioxidant, immunomodulatory, and anti-inflammatory activities of Spirulina: An overview. Arch. Toxicol. 2016, 90, 1817–1840. [Google Scholar] [CrossRef] [PubMed]
  4. Varga, L.; Szigeti, J.; Kovacs, R.; Foldes, T.; Buti, S. Influence of a Spirulina platensis biomass on the microflora of fermented ABT milks during storage (R1). J. Dairy Sci. 2002, 85, 1031–1038. [Google Scholar] [CrossRef]
  5. Andrica, F.M.; Marți, T.D.; Pânzaru, I.; Coricovac, D.; Dehelean, C.; Drăgan, S. Preliminary study on the Evaluation of Spirulina on TPA induced Mouse Ear Inflammation. J. Agro Aliment. Processes Technol. 2015, 21, 268–273. [Google Scholar]
  6. Guil-Guerrero, J.L.; Navarro-Juárez, R.; López-Martínez, J.C.; Campra-Madrid, P.; Rebolloso-Fuentes, M.M. Functional properties of the biomass of three microalgal species. J. Food Eng. 2004, 65, 511–517. [Google Scholar] [CrossRef]
  7. Li, D.M.; Qi, Y.Z. Spirulina Industry in China: Present status and future prospects. J. Appl. Phycol. 1997, 9, 25–28. [Google Scholar] [CrossRef]
  8. Soni, R.A.; Sudhakar, K.; Rana, R.S.; Baredar, P. Food Supplements Formulated with Spirulina. In Algae; Springer: Singapore, 2020; pp. 201–226. [Google Scholar]
  9. Soni, R.A.; Sudhakar, K.; Rana, R.S. Spirulina—From growth to nutritional product: A review. Trends Food Sci. Technol. 2017, 69, 157–171. [Google Scholar] [CrossRef] [Green Version]
  10. Sloan, E. The top 10 functional food trends. Food Technol. 2008, 4, 24–44. [Google Scholar]
  11. Batista, A.P.; Niccolai, A.; Fradinho, P.; Fragoso, S.; Bursic, I.; Rodolfi, L.; Raymundo, A. Microalgae biomass as an alternative ingredient in cookies: Sensory, physical and chemical properties, antioxidant activity and in vitro digestibility. Algal Res. 2017, 26, 161–171. [Google Scholar] [CrossRef]
  12. Santos, T.D.; de Freitas, B.C.B.; Moreira, J.B.; Zanfonato, K.; Costa, J.A.V. Development of powdered food with the addition of Spirulina for food supplementation of the elderly population. Innov. Food Sci. Emerg. 2016, 37, 216–220. [Google Scholar] [CrossRef]
  13. Lafarga, T.; Acién-Fernández, F.G.; Castellari, M.; Villaró, S.; Bobo, G.; Aguiló-Aguayo, I. Effect of microalgae incorporation on the physicochemical, nutritional, and sensorial properties of an innovative broccoli soup. Lebensm. Wiss. Technol. 2019, 111, 167–174. [Google Scholar] [CrossRef]
  14. Lucas, B.F.; de Morais, M.G.; Santos, T.D.; Costa, J.A.V. Spirulina for snack enrichment: Nutritional, physical and sensory evaluations. Lebensm. Wiss. Technol. 2018, 90, 270–276. [Google Scholar] [CrossRef]
  15. De Marco, E.R.; Steffolani, M.E.; Martínez, C.S.; León, A.E. Effects of Spirulina biomass on the technological and nutritional quality of bread wheat pasta. LWT-Food Sci. Technol. 2014, 58, 102–108. [Google Scholar] [CrossRef]
  16. Pagnussatt, F.A.; Spier, F.; Bertolin, T.E.; Costa, J.A.V.; Gutkoski, L.C. Technological and nutritional assessment of dry pasta with oatmeal and the microalga Spirulina platensis. Braz. J. Food Technol. 2014, 17, 296–304. [Google Scholar] [CrossRef]
  17. Zarrouk, C. Contribution à l‘étuded‘unecyanophycée. Influence de Divers Facteurs Physiques et Chimiques sur la Croissance et Photosynthese de Spirulina maxima Geitler. Ph.D. Thesis, University of Paris, Paris, France, 1966. [Google Scholar]
  18. AOAC. Official Methods of Analysis of the Association of Official Analytical Chemists, 15th ed.; Williams, S., Ed.; Office of The Federal Register Washington, D.C.: Arlington, VA, USA, 1984. [Google Scholar]
  19. Sosulski, F.W.; Imafidon, G.I. Amino acid composition and Nitrogen to Protein conversion factors for Animal and Plant Foods. J. Agric. Food Chem. 1990, 34, 1351–1356. [Google Scholar] [CrossRef]
  20. Folch, J.; Lees, M.; Stanley, G.S. A simple method for the isolation and purification of total lipids from animal tissues. J. Biol. Chem. 1957, 226, 497–509. [Google Scholar] [CrossRef]
  21. Ichihara, K.; Fukubayashi, Y. Preparation of fatty acid methyl esters for gas liquid chromatography. J. Lipid Res. 2010, 51, 635–640. [Google Scholar] [CrossRef] [Green Version]
  22. Ludwig, T.G.; Goldberg, H.J. The anthrone method for the determination of carbohydrates in foods and in oral rinsing. J. Dent. Res. 1956, 35, 90–94. [Google Scholar] [CrossRef]
  23. Merril, A.L.; Watt, B.K. Energy Value of Foods: Basis and Derivation; United States Department of Agriculture: Washington, DC, USA, 1973. [Google Scholar]
  24. Singleton, V.L.; Orthofer, R.; Lamuela-Raventós, R.M. Analysis of total phenols and other oxidation substrates and antioxidants by means of folin-ciocalteu reagent. In Methods in Enzymology; Academic Press: Cambridge, MA, USA, 1999; Volume 299, pp. 152–178. [Google Scholar]
  25. Barnum, D.W. Spectrophotometric determination of catechol, epinephrine, dopa, dopamine and other aromatic vic-diols. Anal. Chim. Acta 1977, 89, 157–166. [Google Scholar] [CrossRef]
  26. Benzie, I.F.; Strain, J.J. The ferric reducing ability of plasma (FRAP) as a measure of “antioxidant power”: The FRAP assay. Anal. Biochem. 1996, 239, 70–76. [Google Scholar] [CrossRef] [PubMed] [Green Version]
  27. Apak, R.; Güclü, K.; Özyürek, M.; Celik, S.E. Mechanism of antioxidant capacity assays and the CUPRAC (cupric ion reducing antioxidant capacity assay. Microchim. Acta 2008, 160, 413–419. [Google Scholar] [CrossRef]
  28. Watanabe, F.S.; Olsen, S.R. Test of an ascorbic acid method for determining phosphorus in water and NaHCO3 extracts from soil 1. Soil Sci. Soc. Am. J. 1965, 29, 677–678. [Google Scholar] [CrossRef]
  29. AACC. Approved Methods of the AACC, (Methods 08-01, 30-25, 44-15A, 46-10, 54-10, 54-21), 10th ed.; American Association of Cereal Chemists: Saint Paul, MN, USA, 2000. [Google Scholar]
  30. Tańska, M.; Konopka, I.; Ruszkowska, M. Sensory, physico-chemical and water sorption properties of corn extrudates enriched with Spirulina. Plant Food Hum. Nutr. 2017, 72, 250–257. [Google Scholar] [CrossRef] [Green Version]
  31. El-Hameed, A.; Mahmoud, K.; El-Maatti, A.; El-Saidy, S.M.; Ahmed, S.M. Effect of adding Spirulina platensis in pasta products (spaghetti). J. Agric. Res. 2018, 45, 293–300. [Google Scholar] [CrossRef]
  32. Morsy, O.M.; Sharoba, A.M.; El-Desouky, A.I.; Bahlol, H.E.M.; Abd El Mawla, E.M. Production and evaluation of some extruded food products using Spirulina alga. Ann. Agric. Sci. Moshtohor 2014, 52, 329–342. [Google Scholar]
  33. Selmo, M.S.; Salas-Mellado, M.M. Technological quality of bread from rice flour with Spirulina. Int. Food Res. J. 2014, 21, 1523–1528. [Google Scholar]
  34. ICMR-NIN Expert Group on Nutrient Requirements for Indians. Recommended Dietary Allowances (RDA) and Estimated Average Requirements (EAR)-2020; ICMR-National Institute of Nutrition: Secunderabad, India, 2020. [Google Scholar]
  35. Code of Federal Regulations Title 21. Available online: www.accessdata.fda.gov/ (accessed on 10 November 2021).
  36. Agustini, T.W.; Ma’ruf, W.F.; Wibowo, B.A. Study on the effect of different concentration of Spirulina platensis paste added into dried noodle to its quality characteristics. In IOP Conference Series: Earth and Environmental Science; IOP Publishing: Bristol, UK, 2017; Volume 55, p. 012068. [Google Scholar]
  37. Almahrouqi, H.A.; Sukumaran, P.; Naqqiuddin, M.A.; Omar, H.; Ismail, A. The effect of salinity on growth, biochemical composition and fatty acid profile of SpiruliIna (Arthrospira platensis) grown in sheltered outdoor conditions in Oman. J. Algal Biomass Util. 2015, 6, 61–67. [Google Scholar]
  38. Aung, T.; Halsey, J.; Kromhout, D.; Gerstein, H.C.; Marchioli, R.; Tavazzi, L.; Chew, E.Y. Associations of omega-3 fatty acid supplement use with cardiovascular disease risks: Meta-analysis of 10 trials involving 77,917 individuals. JAMA Cardiol. 2018, 3, 225–233. [Google Scholar] [CrossRef] [Green Version]
  39. Kris-Etherton, P.M.; Grieger, J.A.; Etherton, T.D. Dietary reference intakes for DHA and EPA. Prostaglandins Leukot. Essent. Fat. Acids 2009, 81, 99–104. [Google Scholar] [CrossRef]
  40. Pizzorno, J.E.; Murray, M.T.; Joiner-Bey, H. The Clinician’s Handbook of Natural Medicine Book, 3rd ed.; Elsevier: Amsterdam, The Netherlands, 2016. [Google Scholar] [CrossRef]
  41. Vatsala, S.; Sudesh, J. Quality Characteristics of Noodles Enriched with Spirulina platensis Powder. Int. J. Agric. Sci. 2017, 9, 4091–4094. [Google Scholar]
  42. Fradique, M.; Batista, A.P.; Nunes, M.C.; Gouveia, L.; Bandarra, N.M. Incorporation of Chlorella vulgaris and Spirulina maxima biomass in pasta products-Part 1: Preparation and evaluation. J. Sci. Food Agric. 2010, 90, 1656–1664. [Google Scholar] [CrossRef] [PubMed]
  43. Burcu, A.K.; Avsaroglu, E.; Isik, O.; Özyurt, G.; Kafkas, E.; Etyemez, M. Nutritional and physicochemical characteristics of bread enriched with microalgae Spirulina platensis. Int. J. Eng. Res. Appl. 2016, 6, 30–38. [Google Scholar]
  44. Özyurt, G.; Uslu, L.; Yuvka, I.; Gökdoğan, S.; Atci, G.; Ak, B.; Işik, O. Evaluation of the cooking quality characteristics of pasta enriched with Spirulina platensis. J. Food Qual. 2015, 38, 268–272. [Google Scholar] [CrossRef]
  45. Richmond, A. Biological principles of mass cultivation. In Handbook of Microalgal Culture: Biotechnology and Applied Phycology; Richmon, A., Ed.; Blackwell Science Ltd.: Oxford, UK, 2004; pp. 125–177. [Google Scholar]
  46. Bhat, R.; Goh, K.M. Sonication treatment convalesce the overall quality of hand-pressed strawberry juice. Food Chem. 2017, 215, 470–476. [Google Scholar] [CrossRef]
  47. Vatsala, S.; Sudesh, J. Vitamins, minerals, protein digestibility and antioxidant activity of bread enriched with Spirulina platensis powder. J. Agric. Sci. 2017, 7, 1292–1297. [Google Scholar]
  48. Kumar, A.; Mohanty, V.; Yashaswini, P. Development of high protein nutrition bar enriched with Spirulina plantensis for undernourished children. Curr. Res. Nutr. Food Sci. J. 2018, 6, 835–844. [Google Scholar] [CrossRef] [Green Version]
  49. Abd El Baky, H.H.; El-Baroty, G.S.; Ibrahem, E.A. Functional characters evaluation of biscuits sublimated with pure phycocyanin isolated from Spirulina and Spirulina biomass. Nutr. Hosp. 2015, 32, 231–241. [Google Scholar]
  50. Rocchetti, G.; Lucini, L.; Chiodelli, G.; Giuberti, G.; Gallo, A.; Masoero, F.; Trevisan, M. Phenolic profile and fermentation patterns of different commercial gluten-free pasta during in vitro large intestine fermentation. Food Res. Int. 2017, 97, 78–86. [Google Scholar] [CrossRef]
  51. Muresan, C.; Pop, A.; Man, S.; Socaci, S.; Fărcas, A.; Nagy, M.; Rus, B. The influence of different proportions of Spirulina (Arthrospiraplantensis) on the quality of pasta. J. Agroaliment. Processes Technol. 2016, 22, 24–27. [Google Scholar]
  52. Fardet, A.; Abecassis, J.; Hoebler, C.; Baldwin, P.M.; Buléon, A.; Bérot, S. Influence of technological modifications of the protein network from pasta on in vitro starch degradation. J. Cereal Sci. 1999, 30, 133–145. [Google Scholar] [CrossRef]
  53. Prabhasankar, P.; Ganesan, P.; Bhaskar, N.; Hirose, A.; Stephen, N.; Gowda, L. Edible Japanese seaweed, wakame (Undaria pinnatifida) as an ingredient in pasta: Chemical, functional and structural evaluation. Food Chem. 2009, 115, 501–508. [Google Scholar] [CrossRef]
  54. Dick, J.; Youngs, V. Evaluation of durum wheat, semolina and pasta in the United States. In Durum Wheat Chemistry Technology; Fabriani, G., Lintas, C., Eds.; AACC Monograph Series; AACC Press: St. Paul, MN, USA, 1988; pp. 237–248. [Google Scholar]
  55. Khan, I.; Yousif, A.; Johnson, S.; Gamlath, S. Effect of sorghum flour addition on resistant starch content, phenolic profile and antioxidant capacity of durum wheat pasta. Food Res. Int. 2013, 54, 578–586. [Google Scholar] [CrossRef] [Green Version]
  56. Rudra, S.G.; Anand, V.; Kaur, C.; Bhooshan, N.; Bhardwaj, R. Hydrothermal Treatment to Improve Processing Characteristics of Flour for Gluten-Free Pasta. Starch-Stärke 2020, 72, 1900320. [Google Scholar] [CrossRef]
  57. Shahbazizadeh, S.; Khosravi-Darani, K.; Sohrabvandi, S. Fortification of Iranian traditional cookies with Spirulina platensis. Ann. Res. Rev. Biol. 2014, 7, 144–154. [Google Scholar] [CrossRef]
Figure 1. (A). Flow chart for preparation of Spirulina enriched pasta. * Spirulina addition shall vary with its percentage enrichment in total mixture. (B). Fusilli pasta (control and enriched green pasta with increasing order of Spirulina biomass) (w/w). Supplementation with edible blue green alga, Spirulina provided an appealing green tone that varied with Spirulina concentration.
Foods 11 00979 g001
Figure 2. Proximate and mineral composition of cooked pasta enriched with different concentration of Spirulina biomass.
Foods 11 00979 g002
Figure 3. Results of PCA of data on the effect of supplementation of pasta with different concentrations of Spirulina biomass (%) on nutritional parameters presented as scatter biplots.
Foods 11 00979 g003
Figure 4. Unweighted pair group method with arithmetic mean (UPGMA) depicting the grouping based on all the nutritional composition parameters.
Foods 11 00979 g004
Figure 5. Total phenolic, flavonoid and antioxidant content of cooked pasta enriched with different concentration of Spirulina biomass.
Foods 11 00979 g005
Figure 6. Results of PCA of data on the effect of supplementation of pasta with different concentrations of Spirulina biomass (%) on antioxidant and functional properties/parameters presented as scatter biplots.
Foods 11 00979 g006
Figure 7. Unweighted pair group method with arithmetic mean (UPGMA) depicting the grouping based on functional and antioxidant parameters.
Foods 11 00979 g007
Figure 8. Acceptability scores of pasta containing different levels of Spirulina.
Foods 11 00979 g008
Table 1. Proximal composition of biomass of Spirulina sp. CCC 540 (means ± SD).
ConstituentAmount
Moisture (%, db)5.81 ± 0.17
Energy (kcal in 100 g)412.78 ± 11.04
Carbohydrates (%, db)21.87 ± 0.44
Protein (%, db)65.71 ± 1.00
Fat (%, db)6.94 ± 0.55
Ash (%, db) 8.34 ± 0.06
Iron (mg/100 g)26.59 ± 0.80
Calcium (mg/100 g)107.83 ± 2.50
Zinc (mg/100 g)1.87 ± 0.03
All values are provided on dry weight basis (db) and are average values for analysis in triplicates.
Table 2. Nutritional, phenolic, flavonoids and antioxidant content of different formulations of Spirulina biomass enriched pasta.
ComponentControl2%5%7.50%10%12.50%15%
Moisture (%)6.21 ± 0.182 a5.89 ± 0.135 abc5.89 ± 0.215 abc5.72 ± 0.212 abc5.67 ± 0.016 bc5.52 ± 0.021 c6.05 ± 0.025 ab
Energy (kcal in 100 g)359.71 ± 2.74 c360.52 ± 1.81 c367.14 ± 1.45 b369.80 ± 1.61 b371.93 ± 2.37 b374.54 ± 1.19 b372.75 ± 2.47 b
Carbohydrates (%)71.68 ± 1.48 b70.30 ± 0.73 b69.64 ± 0.45 bc68.43 ± 0.83 bcd66.62 ± 0.18 cde65.84 ± 1.00 de63.49 ± 1.09 e
Protein (%)11.52 ± 0.38 g12.80 ± 0.13 f14.58 ± 0.10 e16.07 ± 0.13 d17.97 ± 0.31 c18.93 ± 0.39 b20.44 ± 0.18 a
Fat (%)2.99 ± 0.14 b3.12 ± 0.86 ab3.36 ± 0.26 ab3.53 ± 0.22 ab3.73 ± 0.25 ab3.94 ± 0.11 ab4.41 ± 0.10 a
Ash (%)0.57 ± 0.002 e1.04 ± 0.030 d1.13 ± 0.034 cd1.12 ± 0.066 cd1.23 ± 0.006 bc1.34 ± 0.005 ab1.39 ± 0.023 a
Iron (mg/100 g)1.28 ± 0.003 g1.81 ± 0.006 f2.55 ± 0.007 e3.19 ± 0.008 d3.86 ± 0.007 c4.44 ± 0.013 b5.081 ± 0.004 a
Calcium (mg/100 g)21.57 ± 0.208 g22.69 ± 0.081 f25.33 ± 0.021 e27.44 ± 0.070 d29.50 ± 0.031 C31.62 ± 0.035 b33.92 ± 0.055 a
Zinc (mg/100 g)1.13 ± 0.004 g1.14 ± 0.002 g1.17 ± 0.002 f1.18 ± 0.001 e1.21 ± 0.003 d1.25 ± 0.003 c1.27 ± 0.003 b
Phenolic content (mg GAE/100 g)50.25 ± 1.72 d54.63 ± 2.26 d66.68 ± 1.56 c68.25 ± 2.28 c71.50 ± 1.32 c81.75 ± 3.44 b88.75 ± 3.94 b
Flavonoids (pmol QE gram)63.65 ± 0.30 f92.06 ± 1.48 e119.60 ± 1.49 d124.54 ± 0.32 cd133.67 ± 2.50 c144.25 ± 4.13 b167.31 ± 5.23 a
DPPH (% inhibition)42.80 ± 1.76 c43.95 ± 1.82 bc44.64 ± 1.61 bc46.49 ± 0.17 abc47.76 ± 1.92 abc49.37 ± 1.30 ab50.69 ± 1.13 a
FRAP (µmol TE/g)2.52 ± 0.08 e2.84 ± 0.14 d2.96 ± 0.03 d3.78 ± 0.04 c4.56 ± 0.12 b4.62 ± 0.13 b5.12 ± 0.07 a
All values are provided on dry weight basis and are average values for analysis in triplicates. Superscripts along the rows indicate significant difference (p < 0.05). Values in this table pertain to the composition of raw pasta.
Table 3. PCA results based on different nutritional parameters of different formulations of Spirulina biomass enriched pasta.
AttributesComponent Loading PCA Summary Results
Dim 1Dim 2Principal ComponentsEigenvalue% Variance% Cumulative Variance
Moisture−0.5380.838Dim 17.92187.65187.651
Energy (kcal)0.960−0.169Dim 20.9110.07097.720
Carbohydrates−0.975−0.190Dim 30.1591.75999.480
Protein0.9960.064Dim 40.0390.43299.911
Fat0.9650.254Dim 50.0070.07799.989
Ash0.920−0.178Dim 60.0010.011100.000
Iron0.9950.079
Calcium0.9910.114
Zinc0.9920.090
Table 4. PCA results based on functional and antioxidant activity related parameters of different formulations of Spirulina biomass enriched pasta.
AttributesComponent Loading PCA Summary Results
Dim 1Dim 2Principal ComponentsEigenvalue% Variance% Cumulative Variance
Phenol content0.9740.119Dim 13.86096.66996.669
Flavonoids content0.9540.187Dim 20.1032.57999.248
DPPH inhibition0.985−0.096Dim 30.0270.67699.924
FRAP0.951−0.210Dim 40.0030.075100
Table 5. Cooking quality of different formulations of Spirulina biomass enriched pasta.
ParameterControl2%5%7.5%10%12.5%15%
Cooking Time (min.)5.35 ± 0.09 d5.35 ± 0.03 cd5.30 ± 0.06 bc5.30 ± 0.05 bc5.28 ± 0.06 b5.21 ± 0.04 a5.20 ± 0.06 a
Change in Length (%)30.97 ± 7.90 a26.13 ± 6.59 a25.92 ± 6.73 a27.03 ± 6.70 a24.98 ± 5.94 a23.76 ± 5.15 a24.67 ± 4.94 a
Change in Width (%)47.11 ± 6.88 ab59.33 ± 6.64 a40.00 ± 7.07 b58.00 ± 4.47 ab54.00 ± 8.94 ab58.00 ± 4.47 ab60.00 ± 5.00 a
Gruel loss (%)4.13 ± 0.15 e6.06 ± 0.31 a6.61 ± 0.33 b5.53 ± 0.33 cd5.13 ± 0.40 de6.66 ± 0.30 b6.22 ± 0.33 bc
Increase in wt after cooking (%)137.82 ± 3.41 e151.95 ±0.53 d161.66 ± 0.33 c162.10 ± 2.07 c182.22 ± 1.05 b190.70 ± 1.83 a193.99 ± 3.28 a
Volume displacement (%)10.00 ± 0.00 c9.67 ± 0.58 c9.33 ± 1.15 c8.67 ± 0.58 cd8.33 ± 0.58 cd8.00 ± 0.00 cd7.07 ± 0.12 d
All values are provided on dry weight basis and are average values for analysis in triplicates. Superscripts along the rows indicate significant difference (p < 0.05).
Table 6. Textural attributes of different formulations of Spirulina biomass enriched pasta.
Level of Incorporation of SpirulinaFirmness (g)Cut Force (g)Stickiness (g.s)Consistency (g.s)Cohesiveness (g)
Control4912.19 ± 201.08 a637.28 ± 27.56 a23.68 ± 1.25 c23.98 ± 2.77 a522.87 ± 16.92 b
2.0%3712.86 ± 125.56 b585.18 ± 49.81 ab41.81 ± 0.95 a14.57 ± 2.63 bc573.125 ± 18.12 ab
5.0%3689.38 ± 170.67 b562.01 ± 6.75 b39.86 ± 2.42 ab14.63 ± 2.54 b663.74 ± 11.06 a
7.5%3674.50 ± 177.73 b538.24 ± 68.91 b26.41 ± 0.57 bc11.91 ± 1.22 bc403.135 ± 12.62 c
10.0%2596.45 ± 157.36 c531.78 ± 31.10 c42.31 ± 1.90 a16.66 ± 0.23 b580.77 ± 6.41 ab
12.5%2818.56 ± 135.46 c550.02 ± 18.36 bc36.31 ± 1.62 ab13.53 ± 0.96 bc508.89 ± 19.65 b
15.0%2708.12 ± 136.76 c542.65 ± 27.46 bc25.17 ± 0.53 bc15.52 ± 1.13 b450.10 ± 14.50 bc
All values are provided on dry weight basis and are average values for analysis in triplicates. Superscripts along the rows indicate significant difference (p < 0.05).
Publisher’s Note: MDPI stays neutral with regard to jurisdictional claims in published maps and institutional affiliations.

