
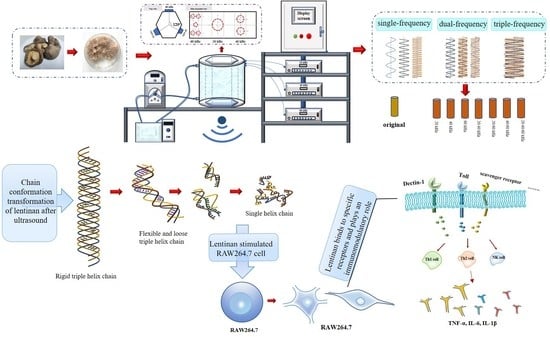
Effects of Ultrasound Modification with Different Frequency Modes on the Structure, Chain Conformation, and Immune Activity of Polysaccharides from Lentinus edodes


Abstract
:Highlights
- Effects of ultrasonic frequency modes on the lentinan conformation were studied.
- Ultrasonic treatment could transform triple-helix chain into single helix chains.
- Dual-frequency ultrasound can change the triple-helix chain from rigid to flexible.
- Dual-frequency ultrasound significantly improved the immune activity of lentinan.
Abstract
1. Introduction
2. Materials and Methods
2.1. Materials and Equipment
2.2. Preparation and Ultrasonic Treatment of Lentinan
2.3. Characterization of Polysaccharides
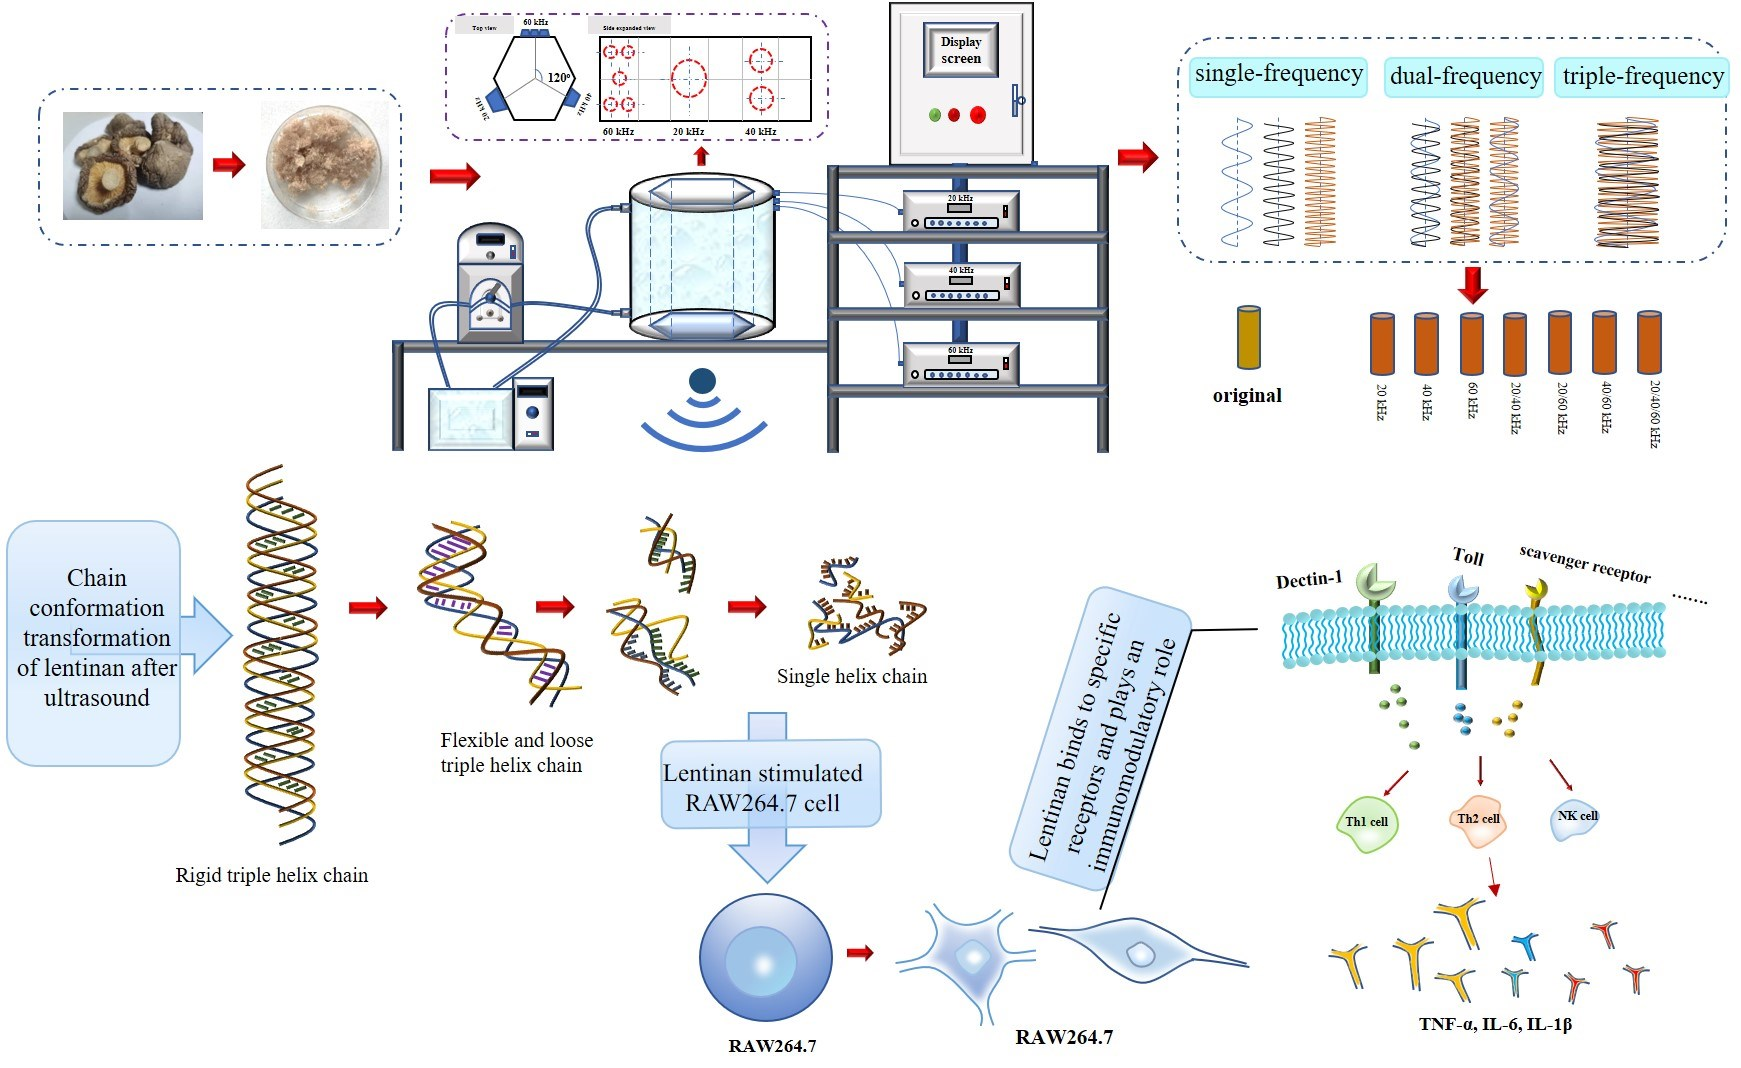
2.3.1. UV–Visible (UV–Vis) Spectroscopy
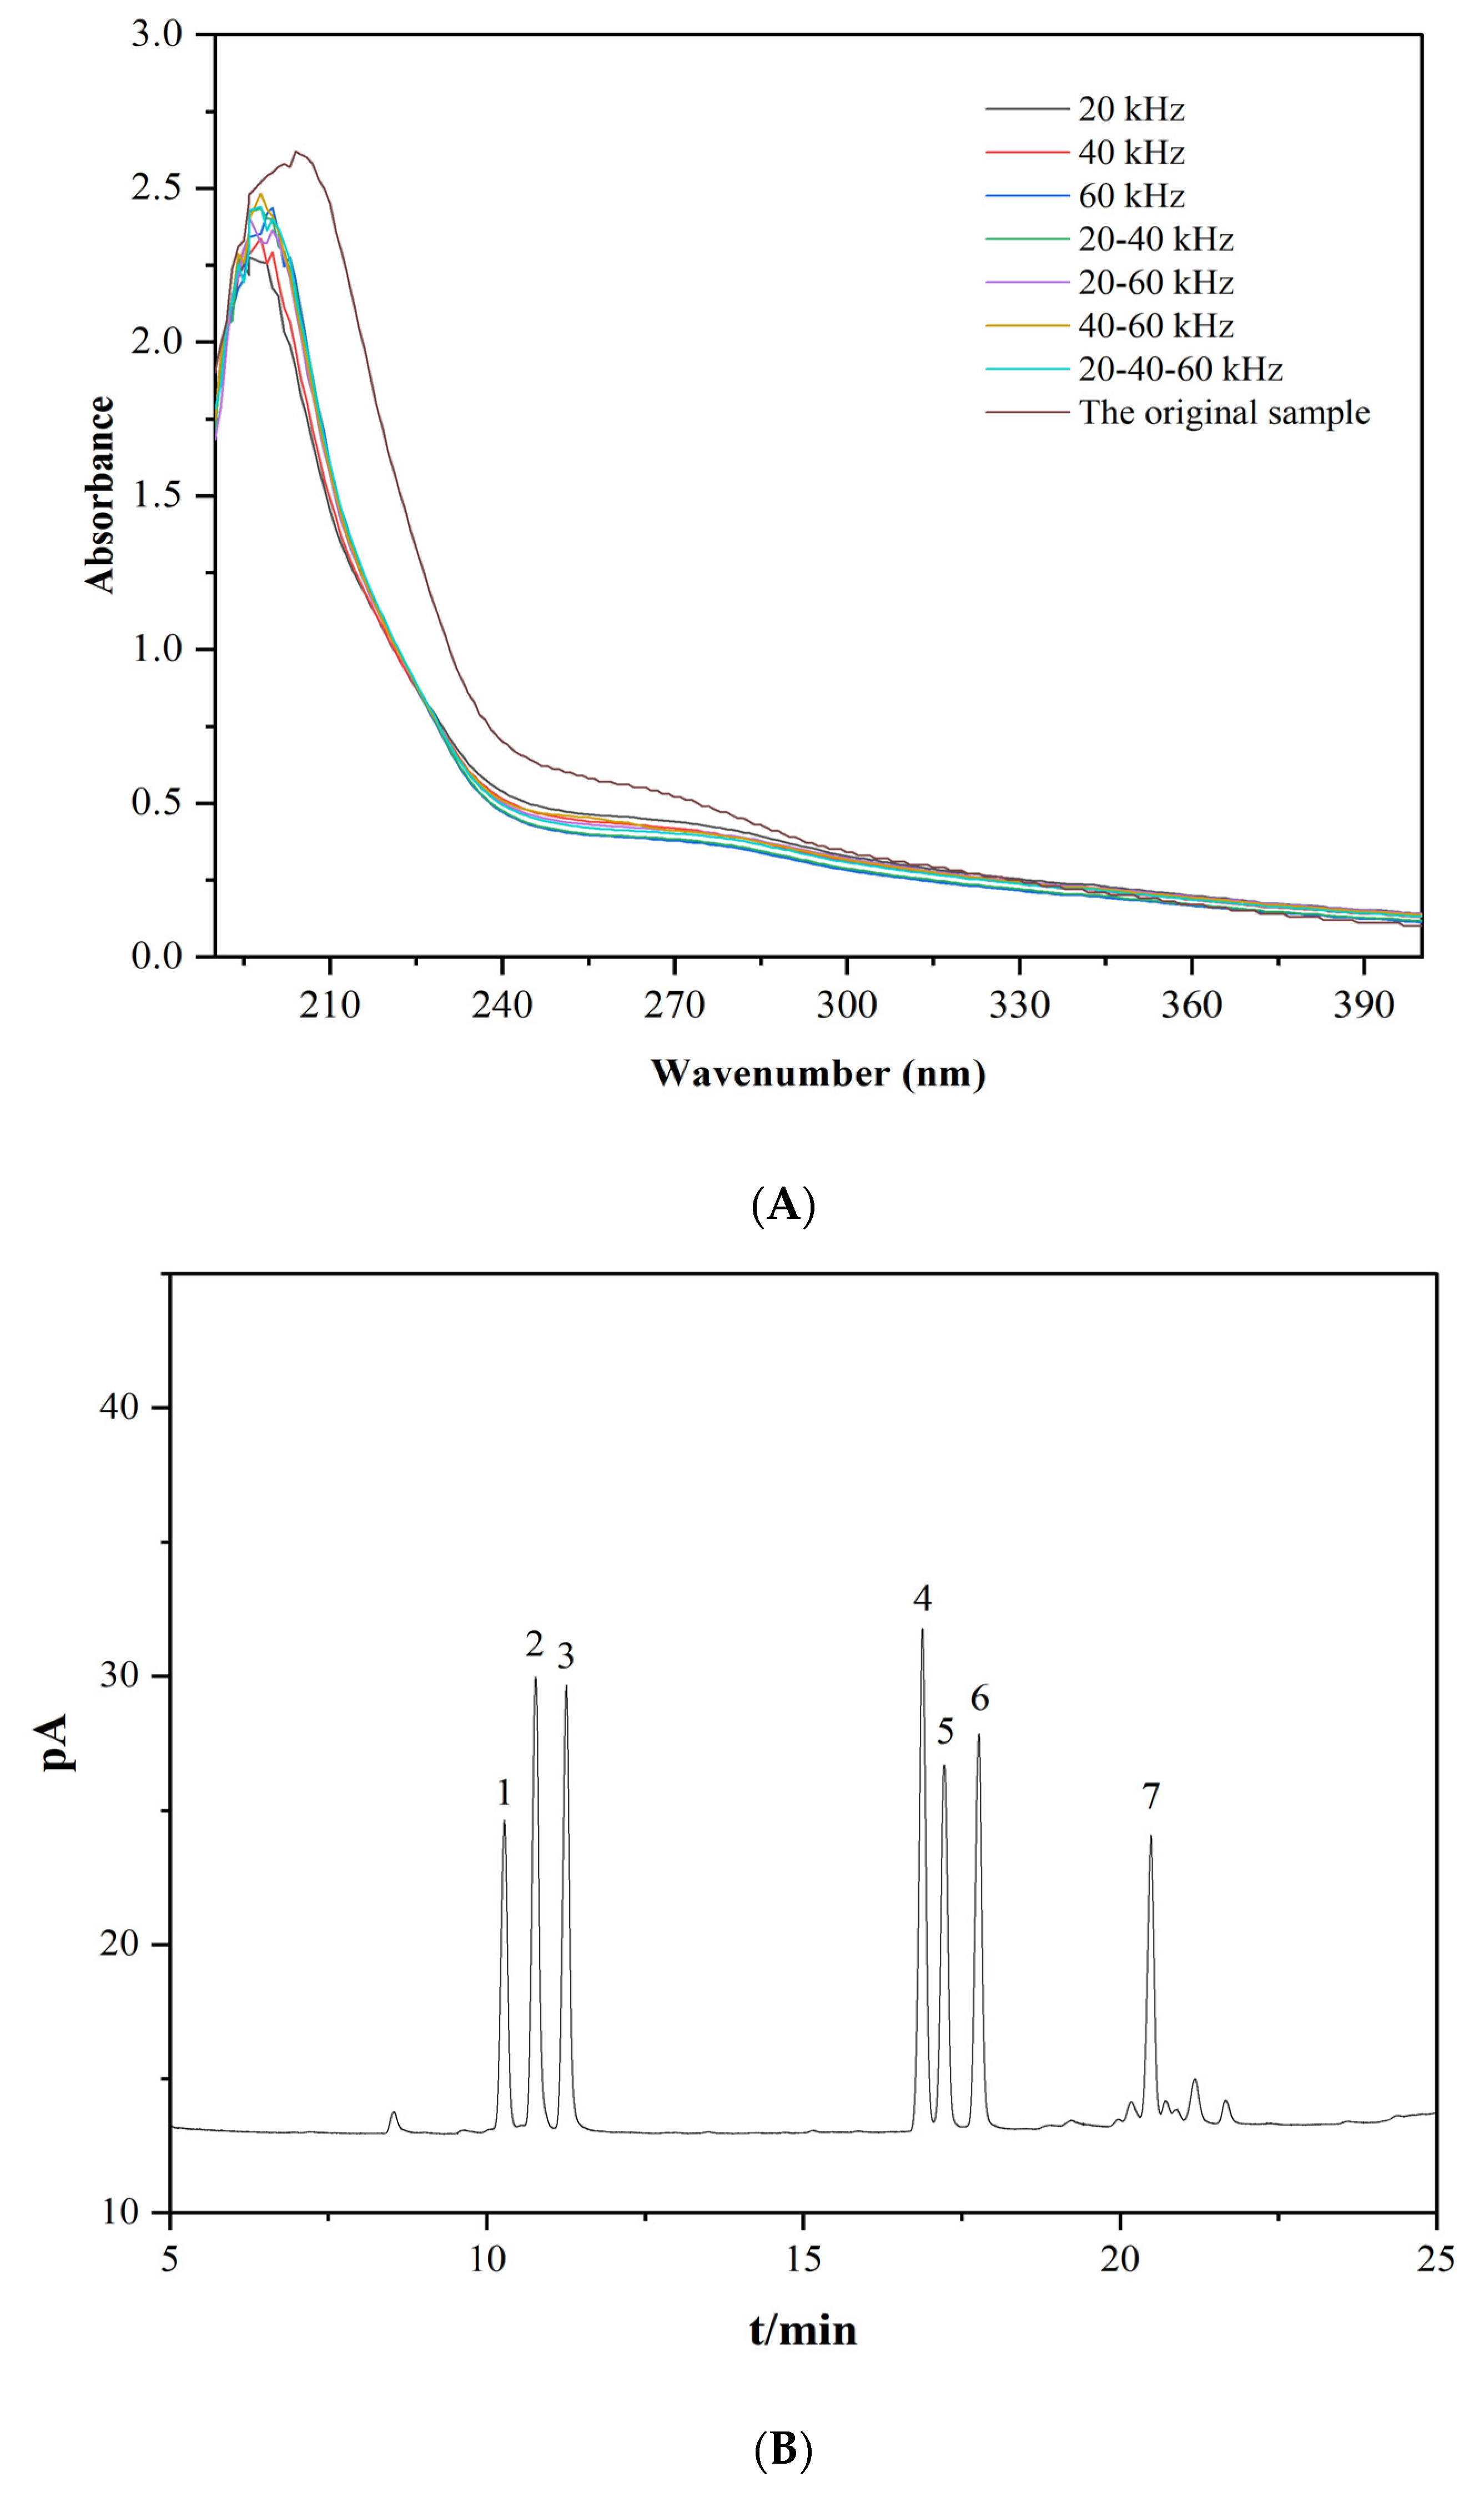
2.3.2. Monosaccharide Composition Analysis
2.3.3. FT-IR Spectroscopy Analysis
2.3.4. Circular Dichroism (CD) Spectra
2.3.5. Scanning Electronic Microscopy (SEM)
2.3.6. Congo Red Analysis
2.3.7. Analysis of Molecular Weight and Chain Conformation
2.3.8. Intrinsic Viscosity Measurements
2.3.9. Atomic Force Microscopy Analysis
2.3.10. X-ray Diffraction Spectroscopy
2.4. In Vitro Immunomodulatory Activity Assay
2.4.1. Cell Culture
2.4.2. Cell Proliferation Assay
2.4.3. Phagocytosis Assay
2.4.4. Cell Morphological Observation
2.4.5. Determination of Nitric Oxide (NO)
2.4.6. Measurement of Immune Factors
3. Results and Discussion
3.1. Chemical Structure Characterization
3.1.1. UV Spectral Analysis
3.1.2. Monosaccharide Composition Analysis
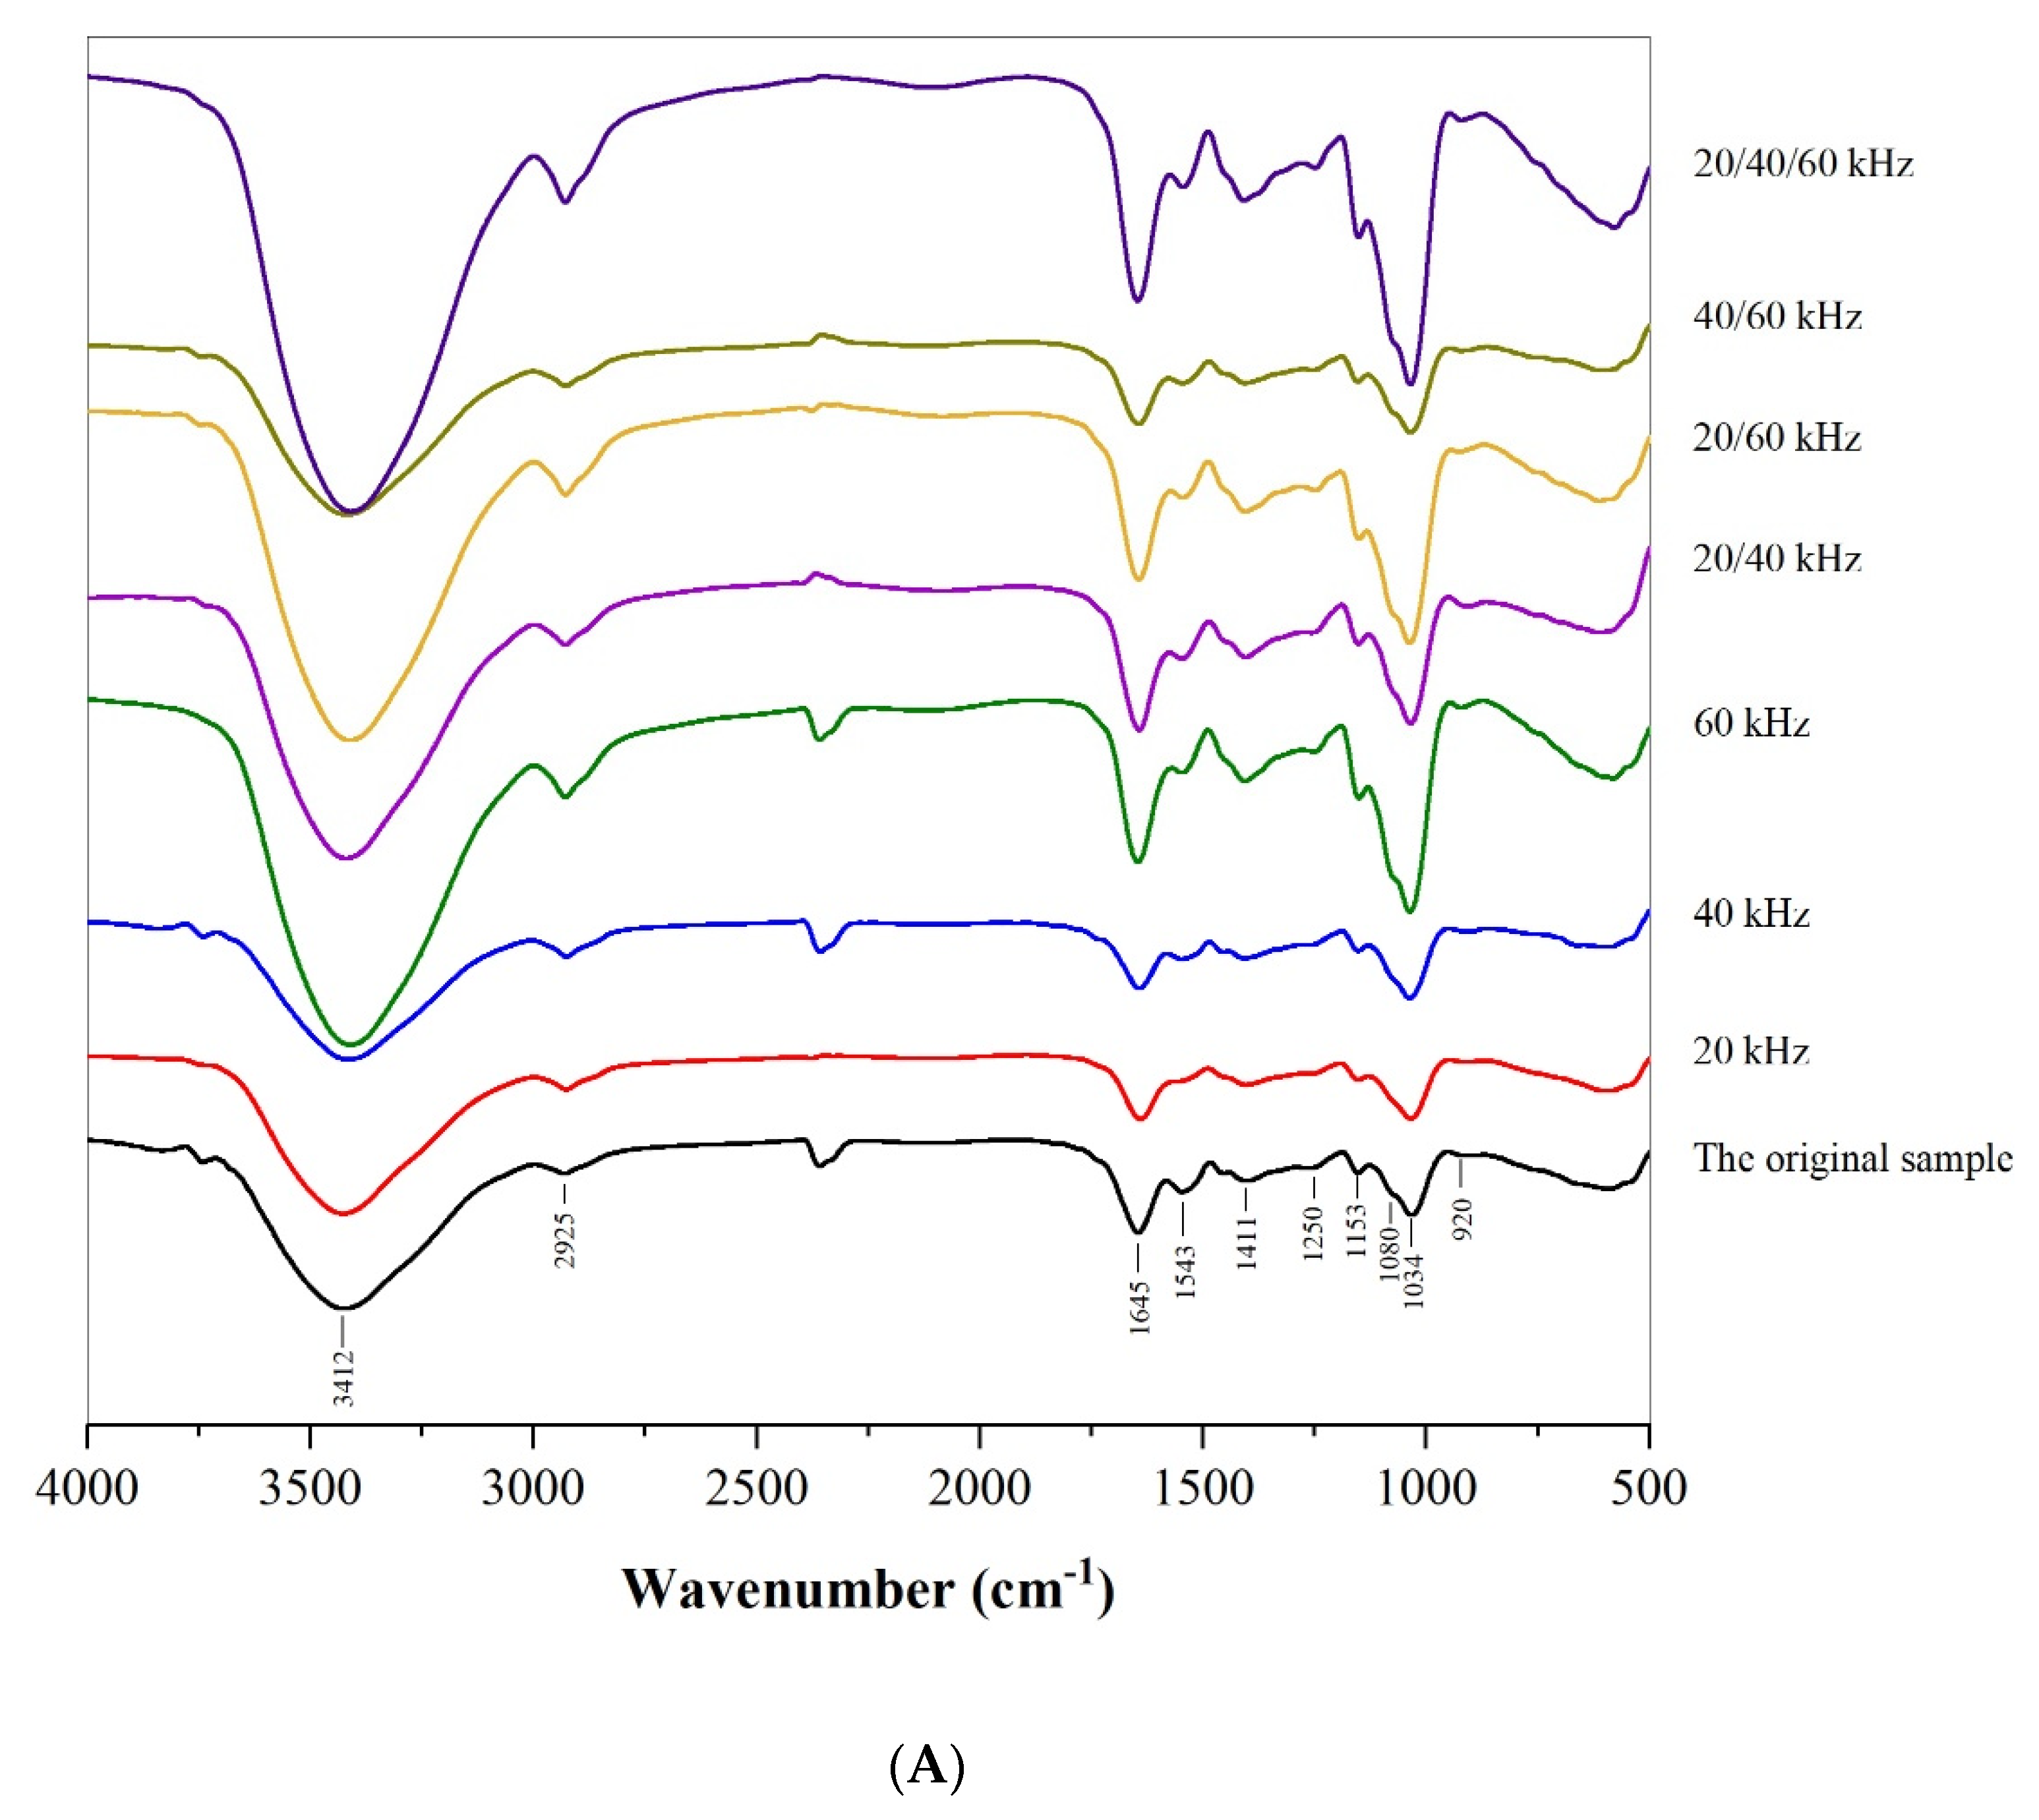
3.1.3. FT-IR Analysis
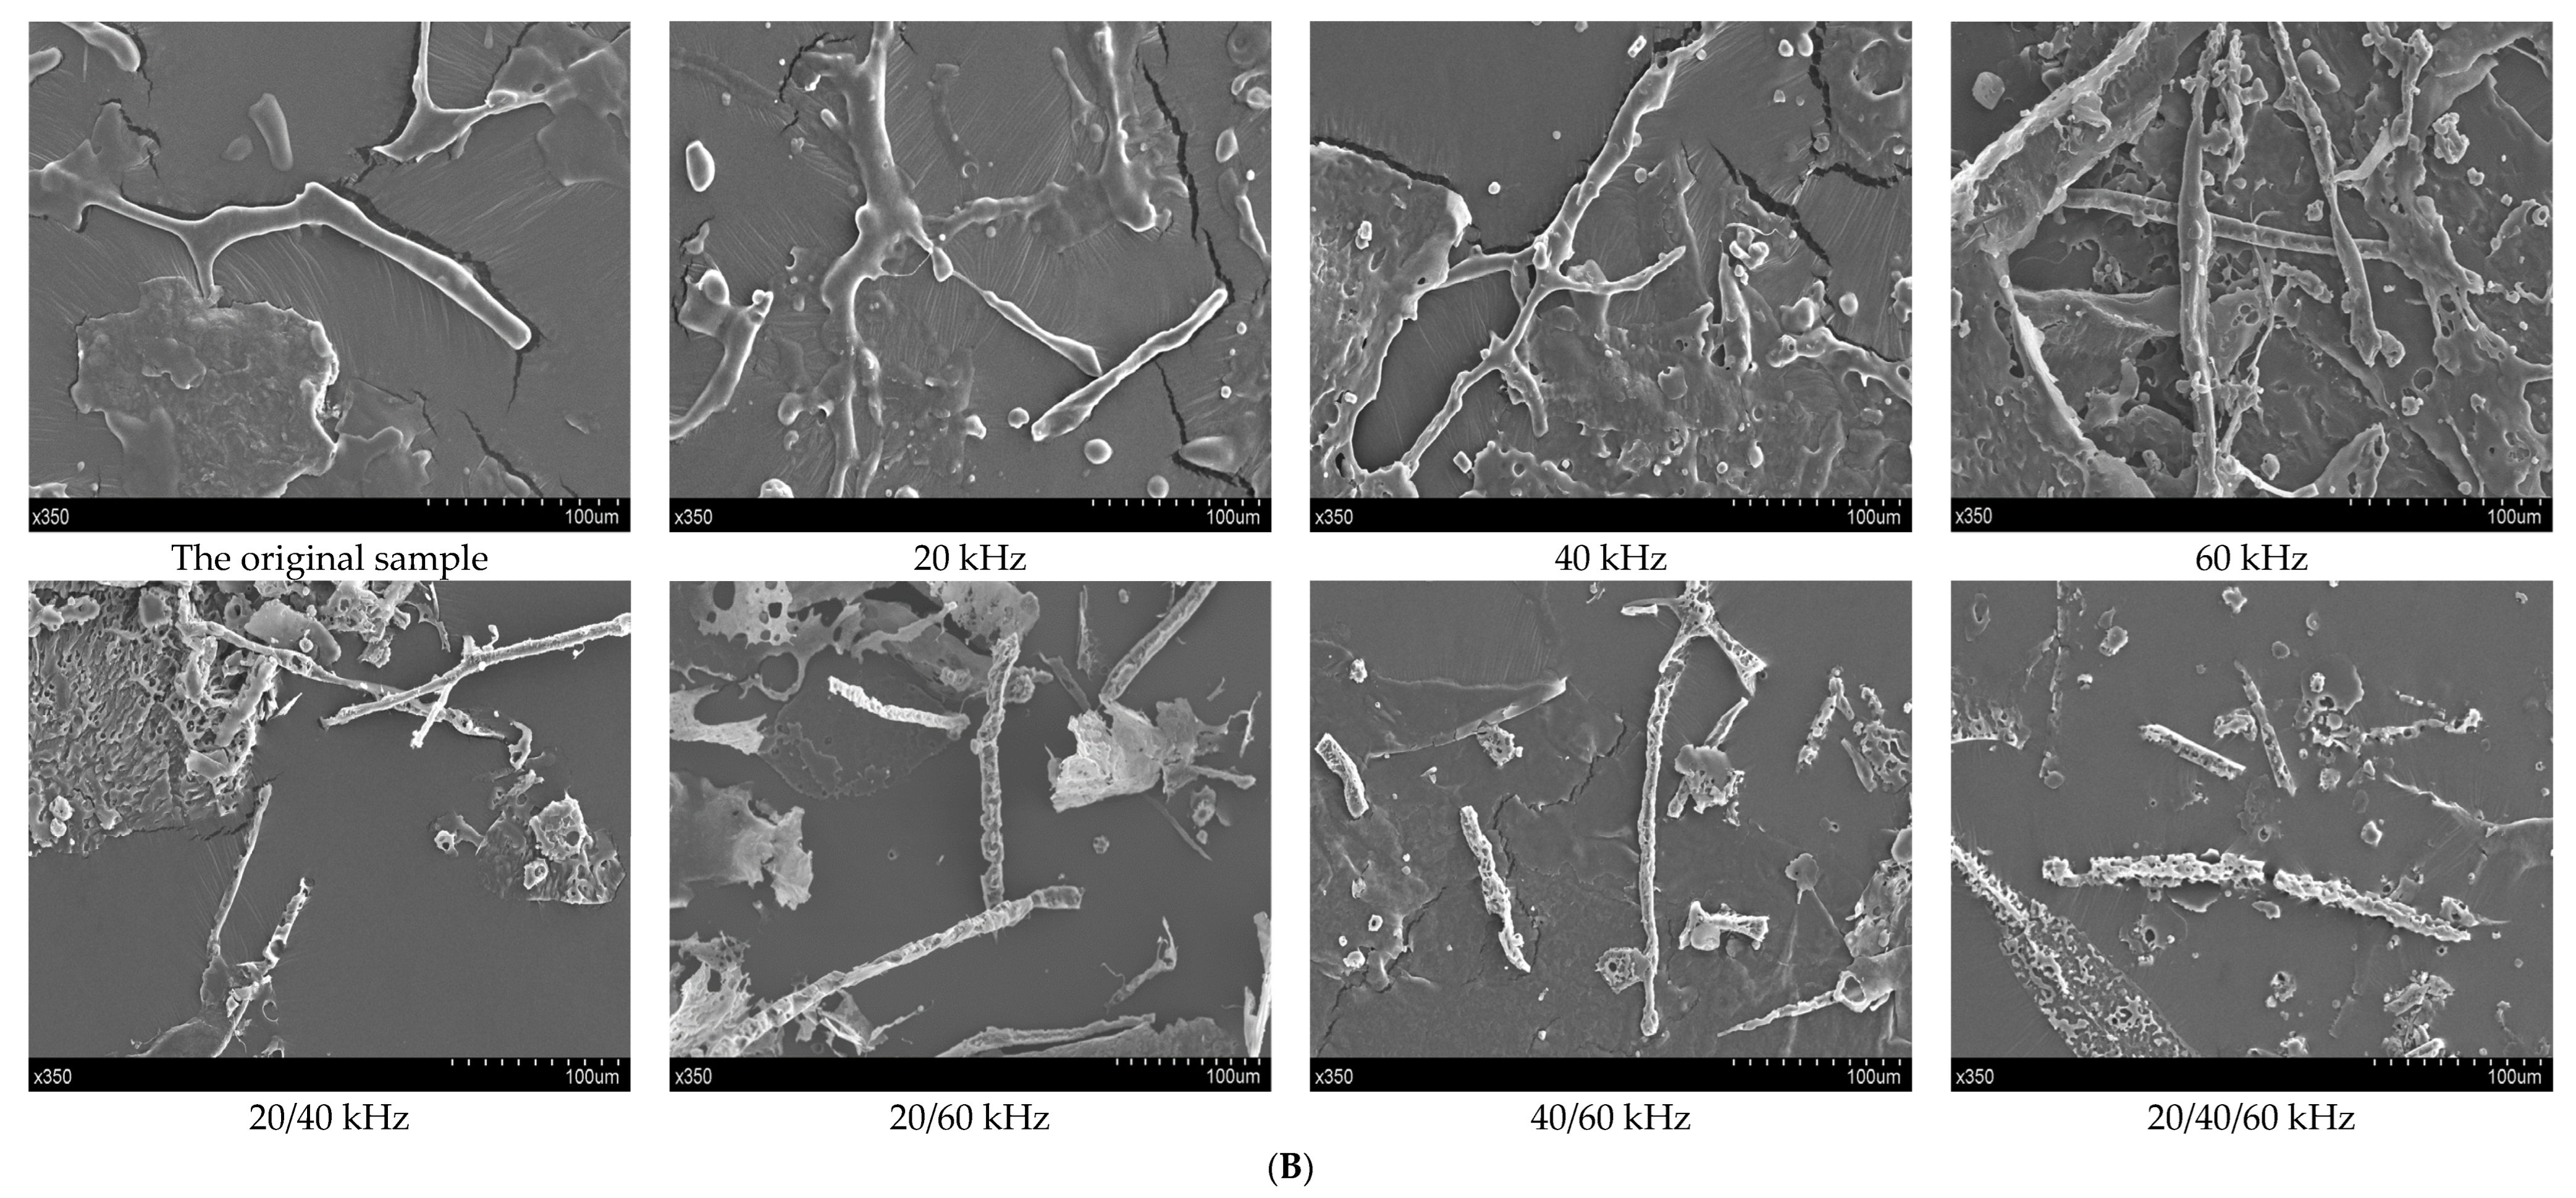
3.1.4. SEM Analysis
3.2. Chain Conformation
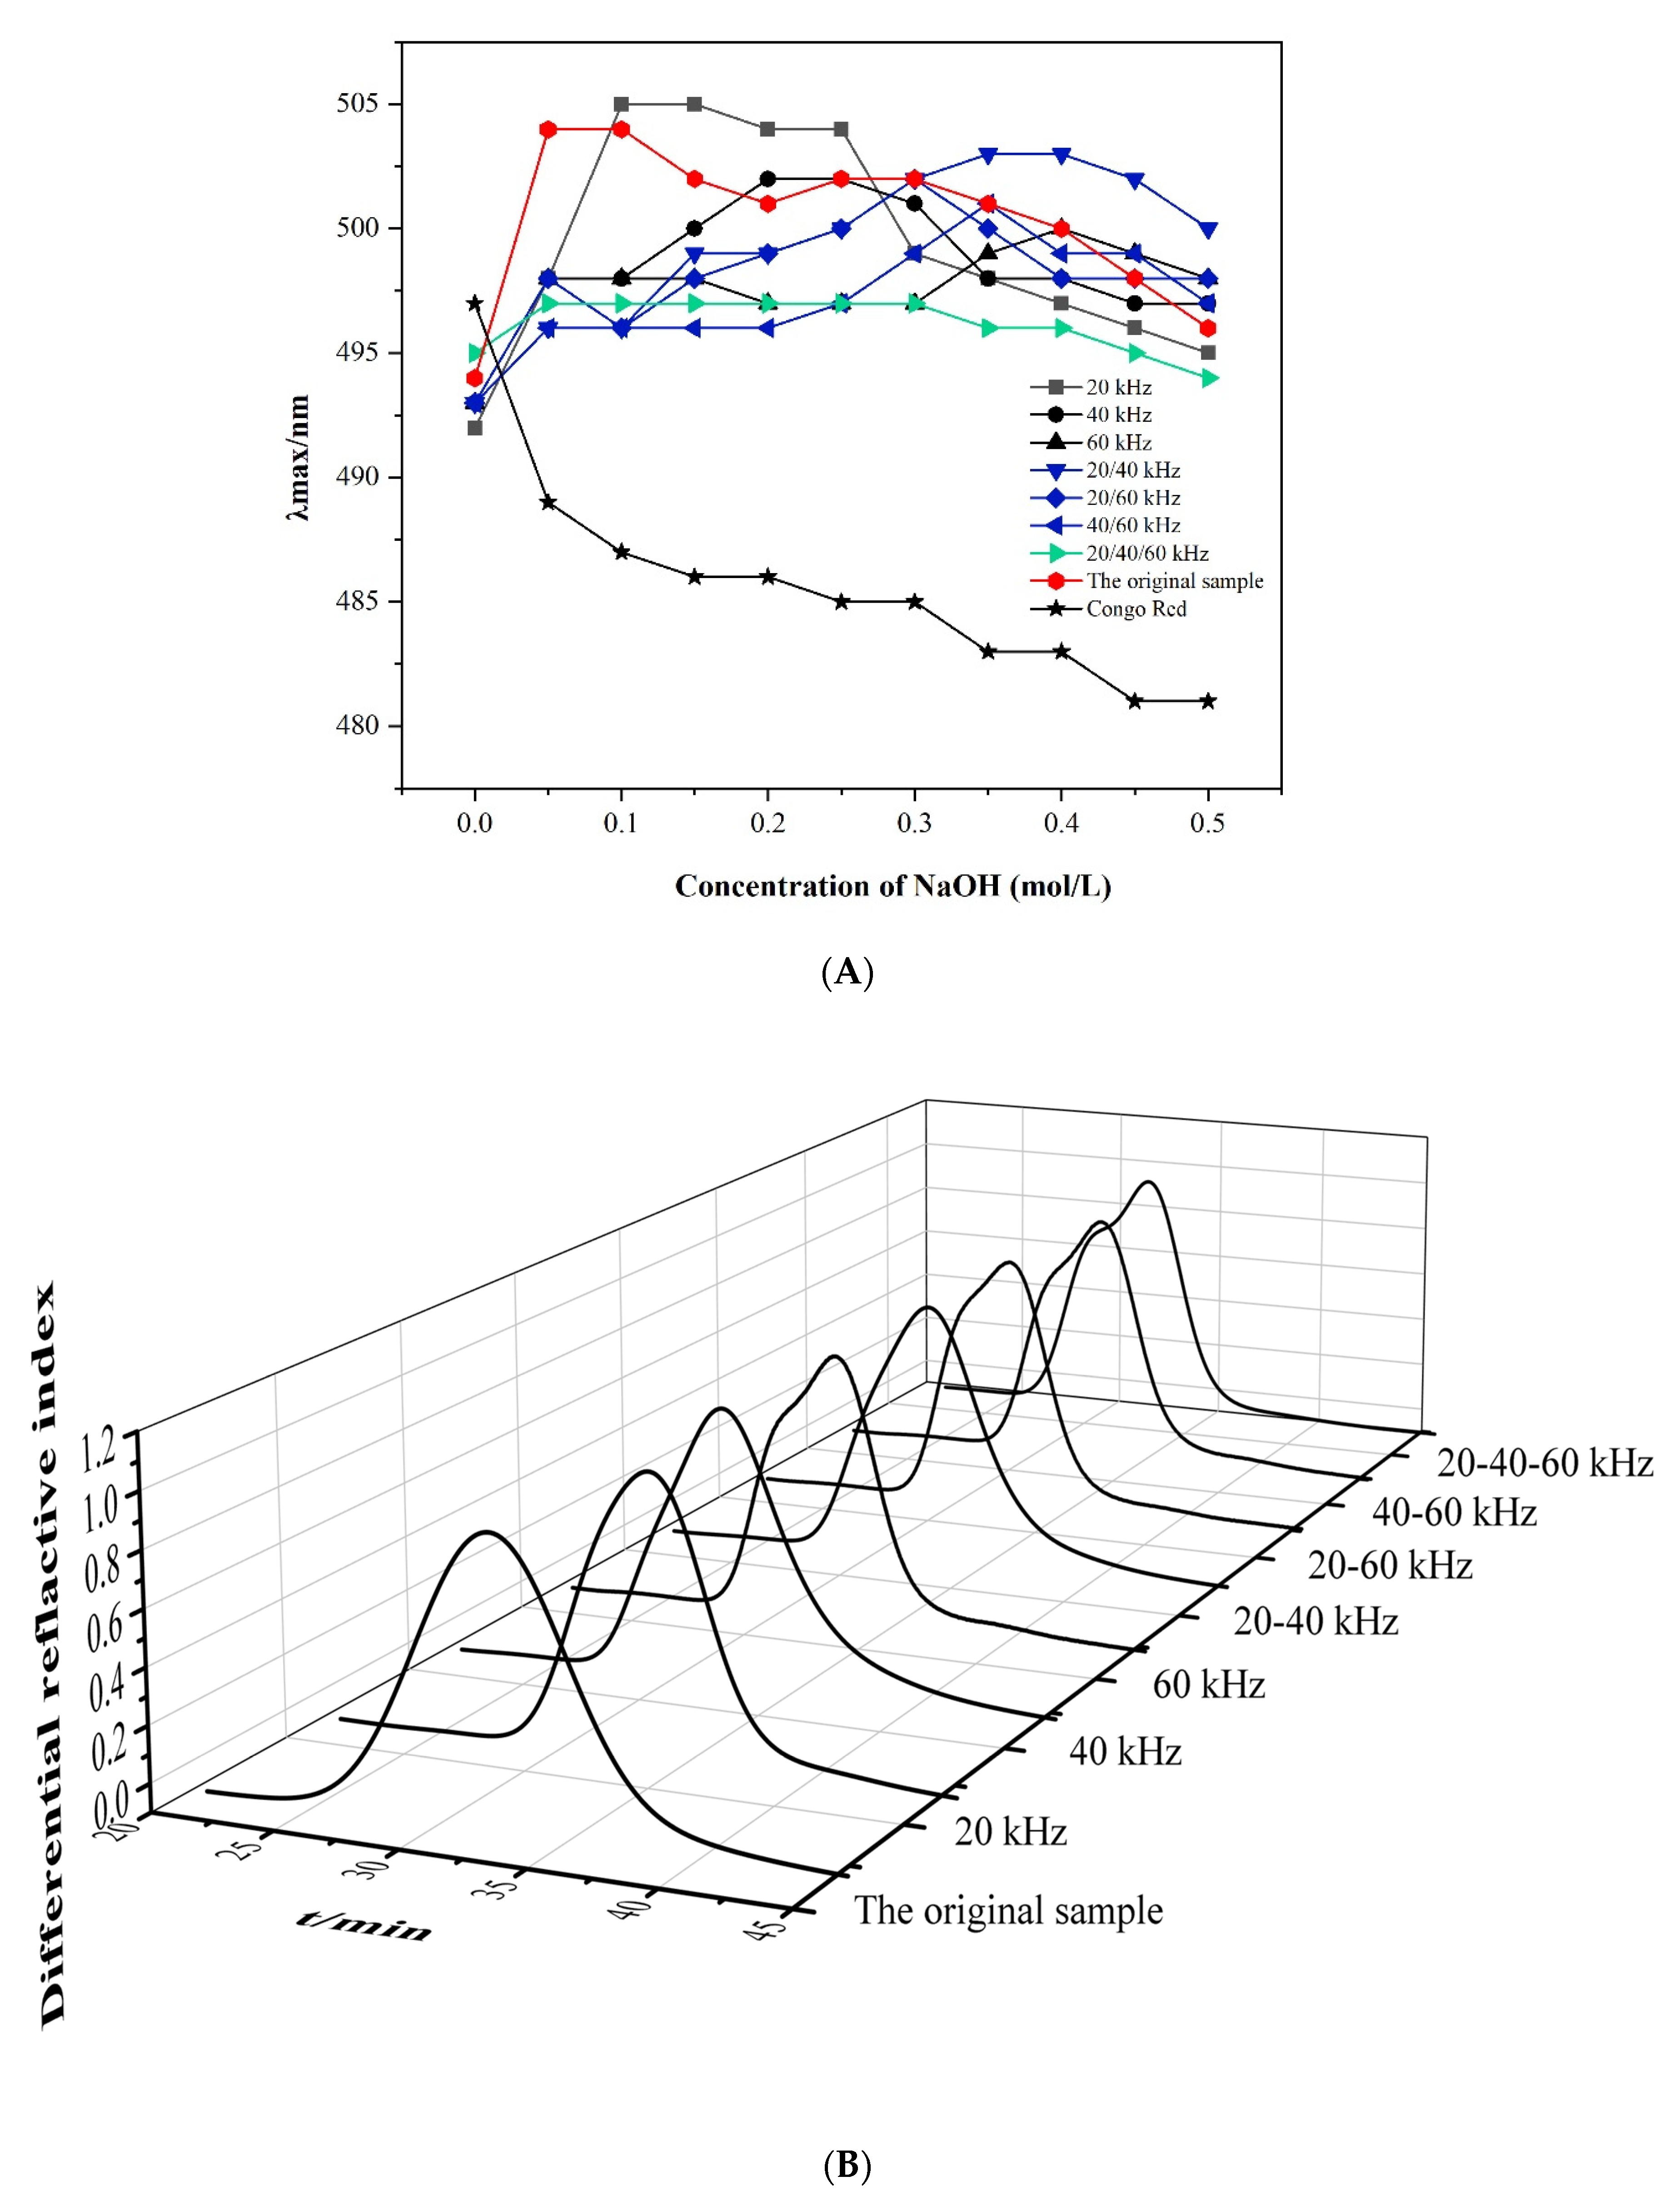
3.2.1. Congo Red Test
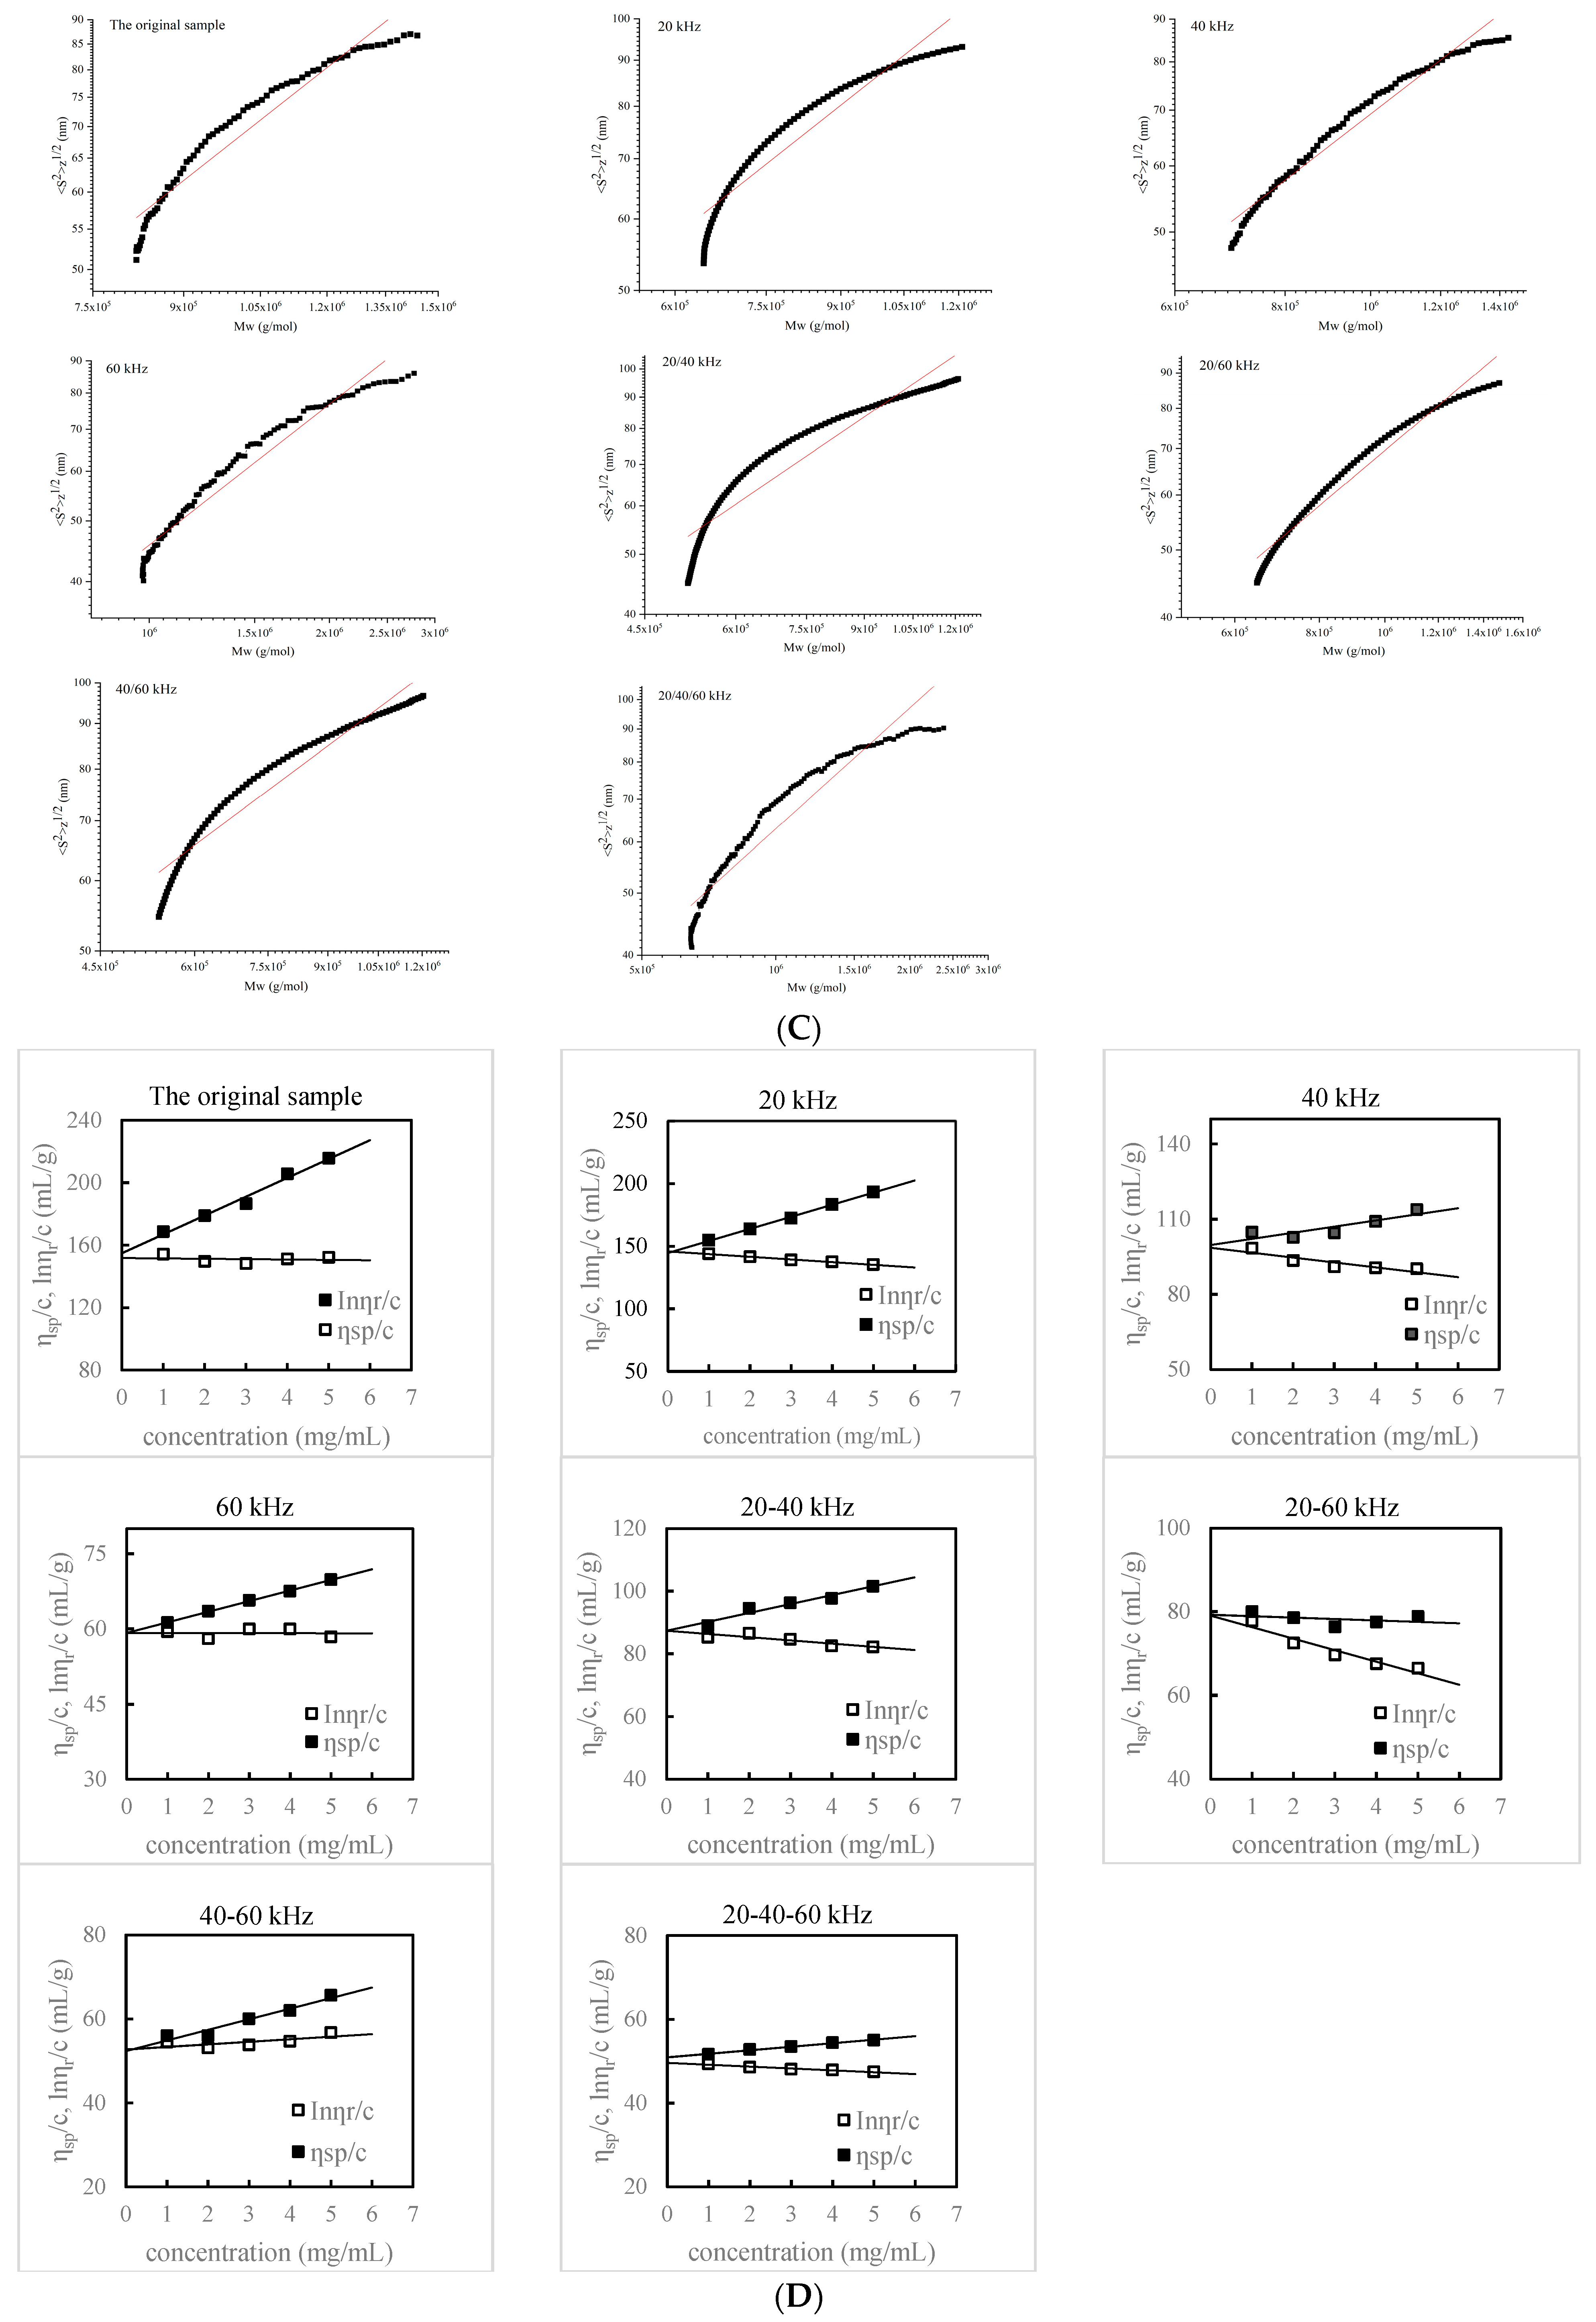
3.2.2. Molecular Weight and Chain Conformation Analysis
3.2.3. Intrinsic Viscosity Measurement
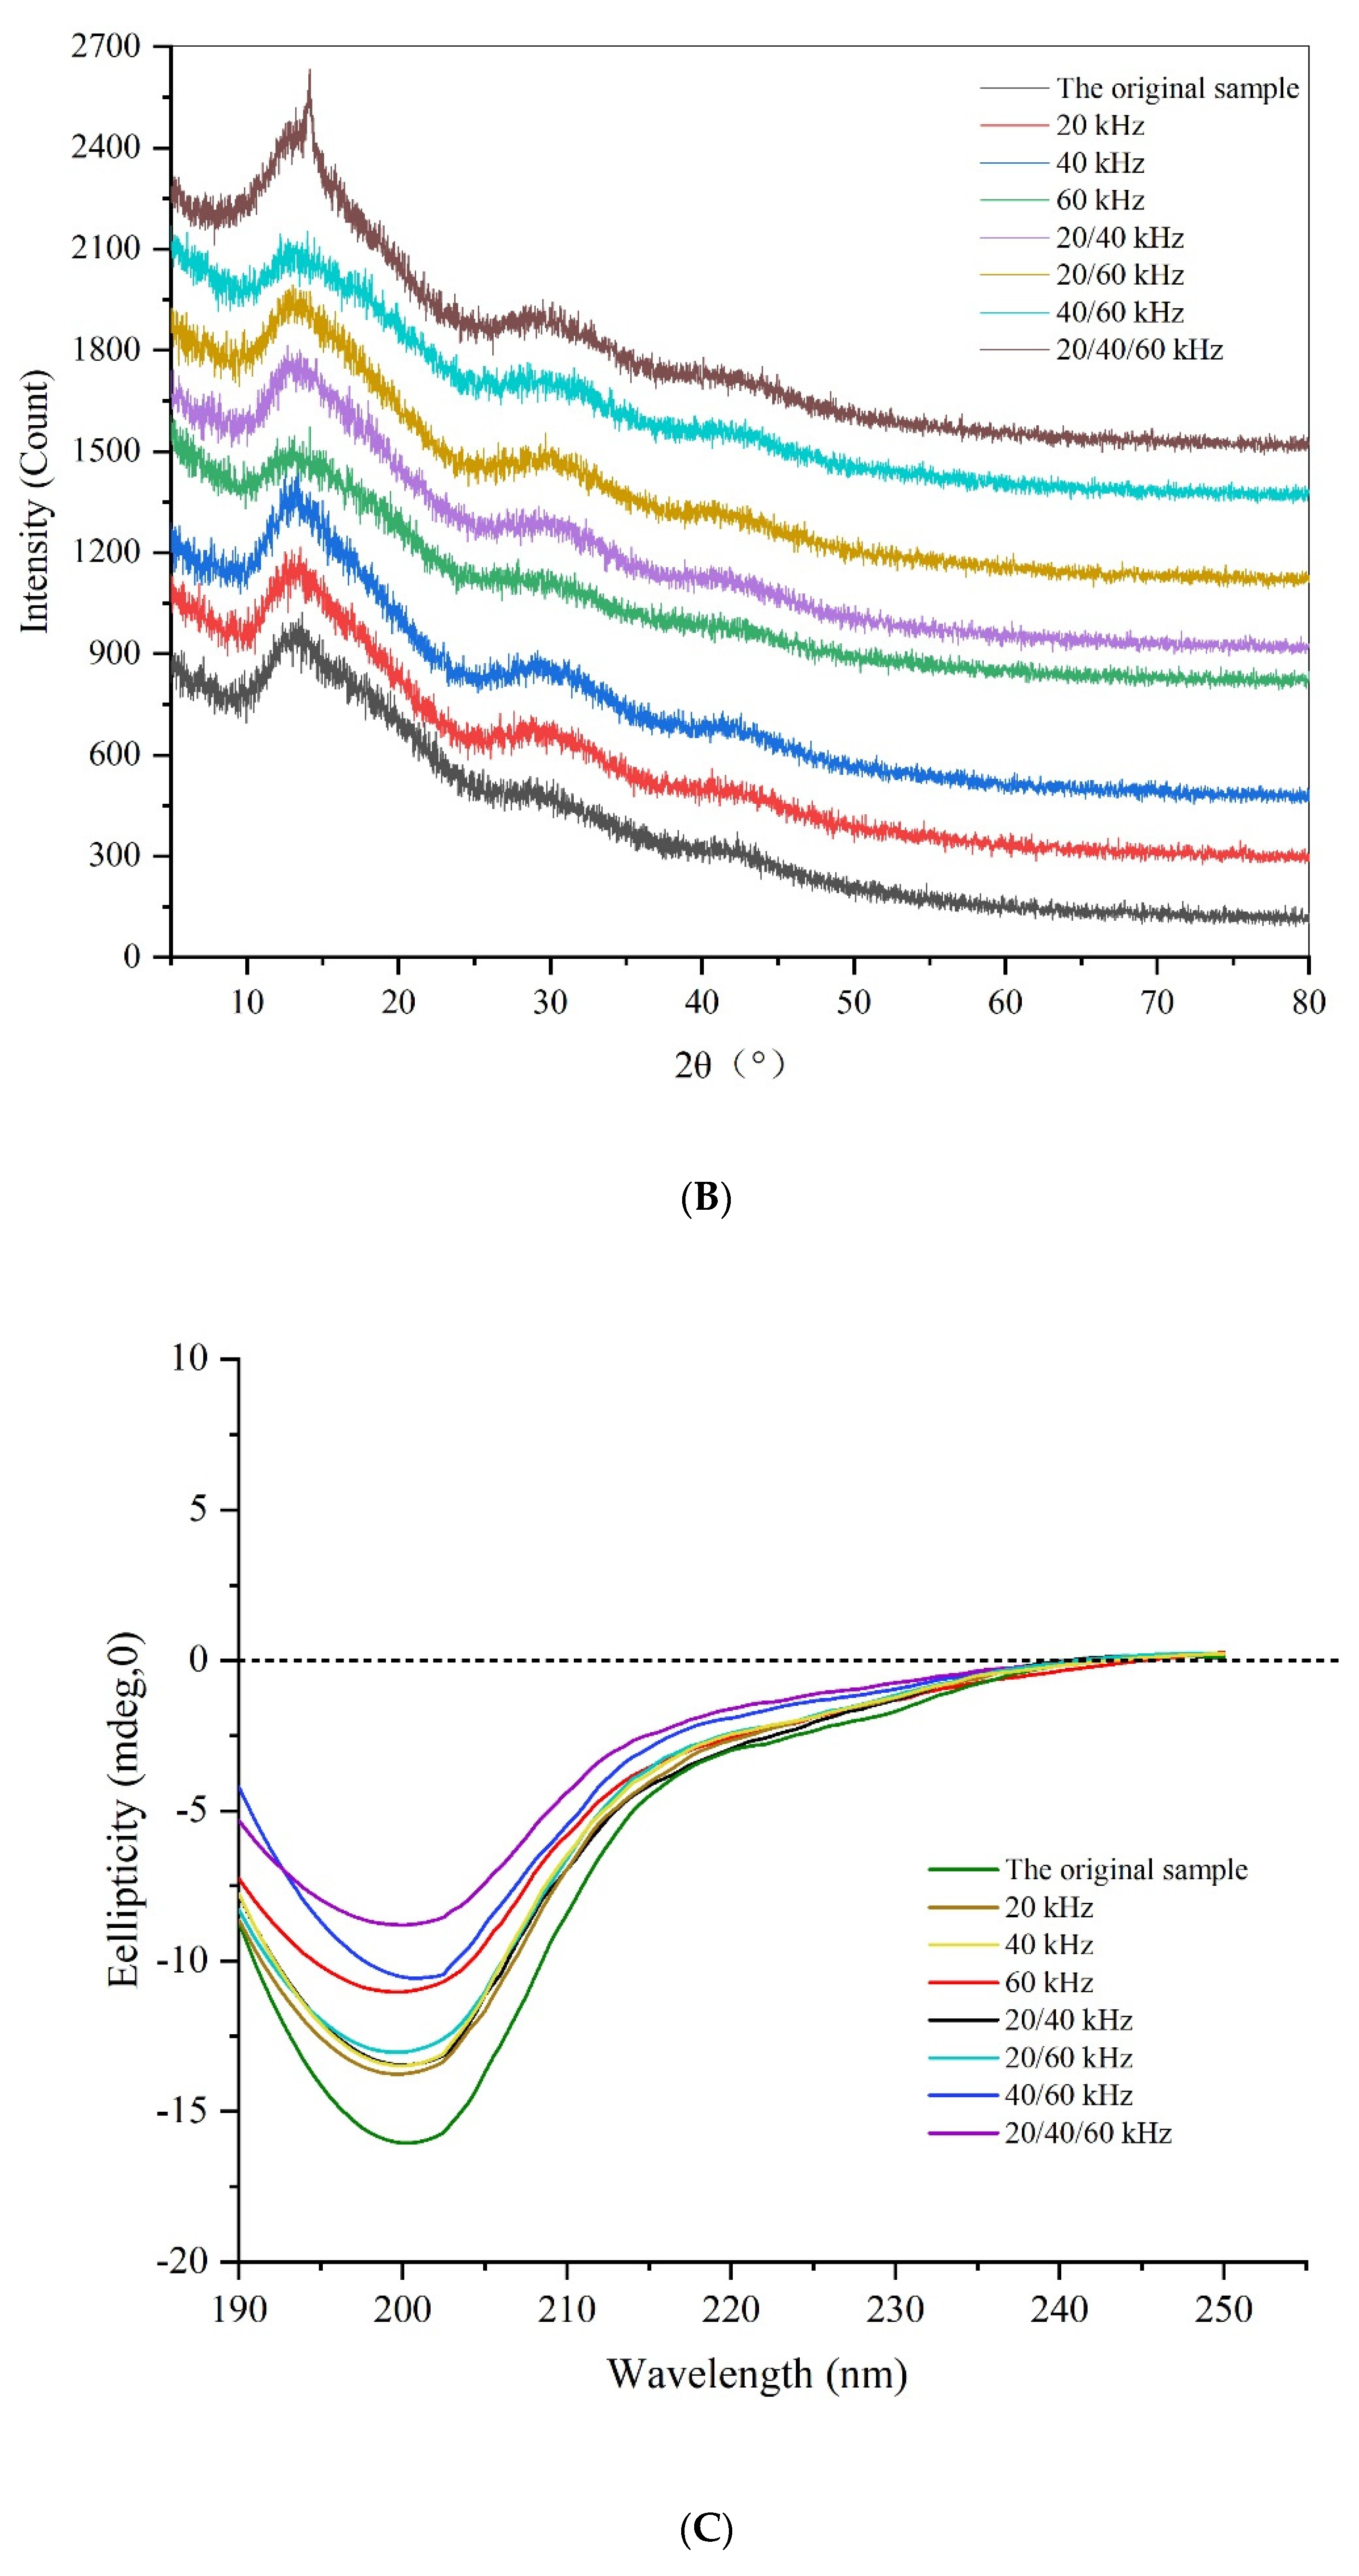
3.2.4. XRD Analysis
3.2.5. CD Analysis
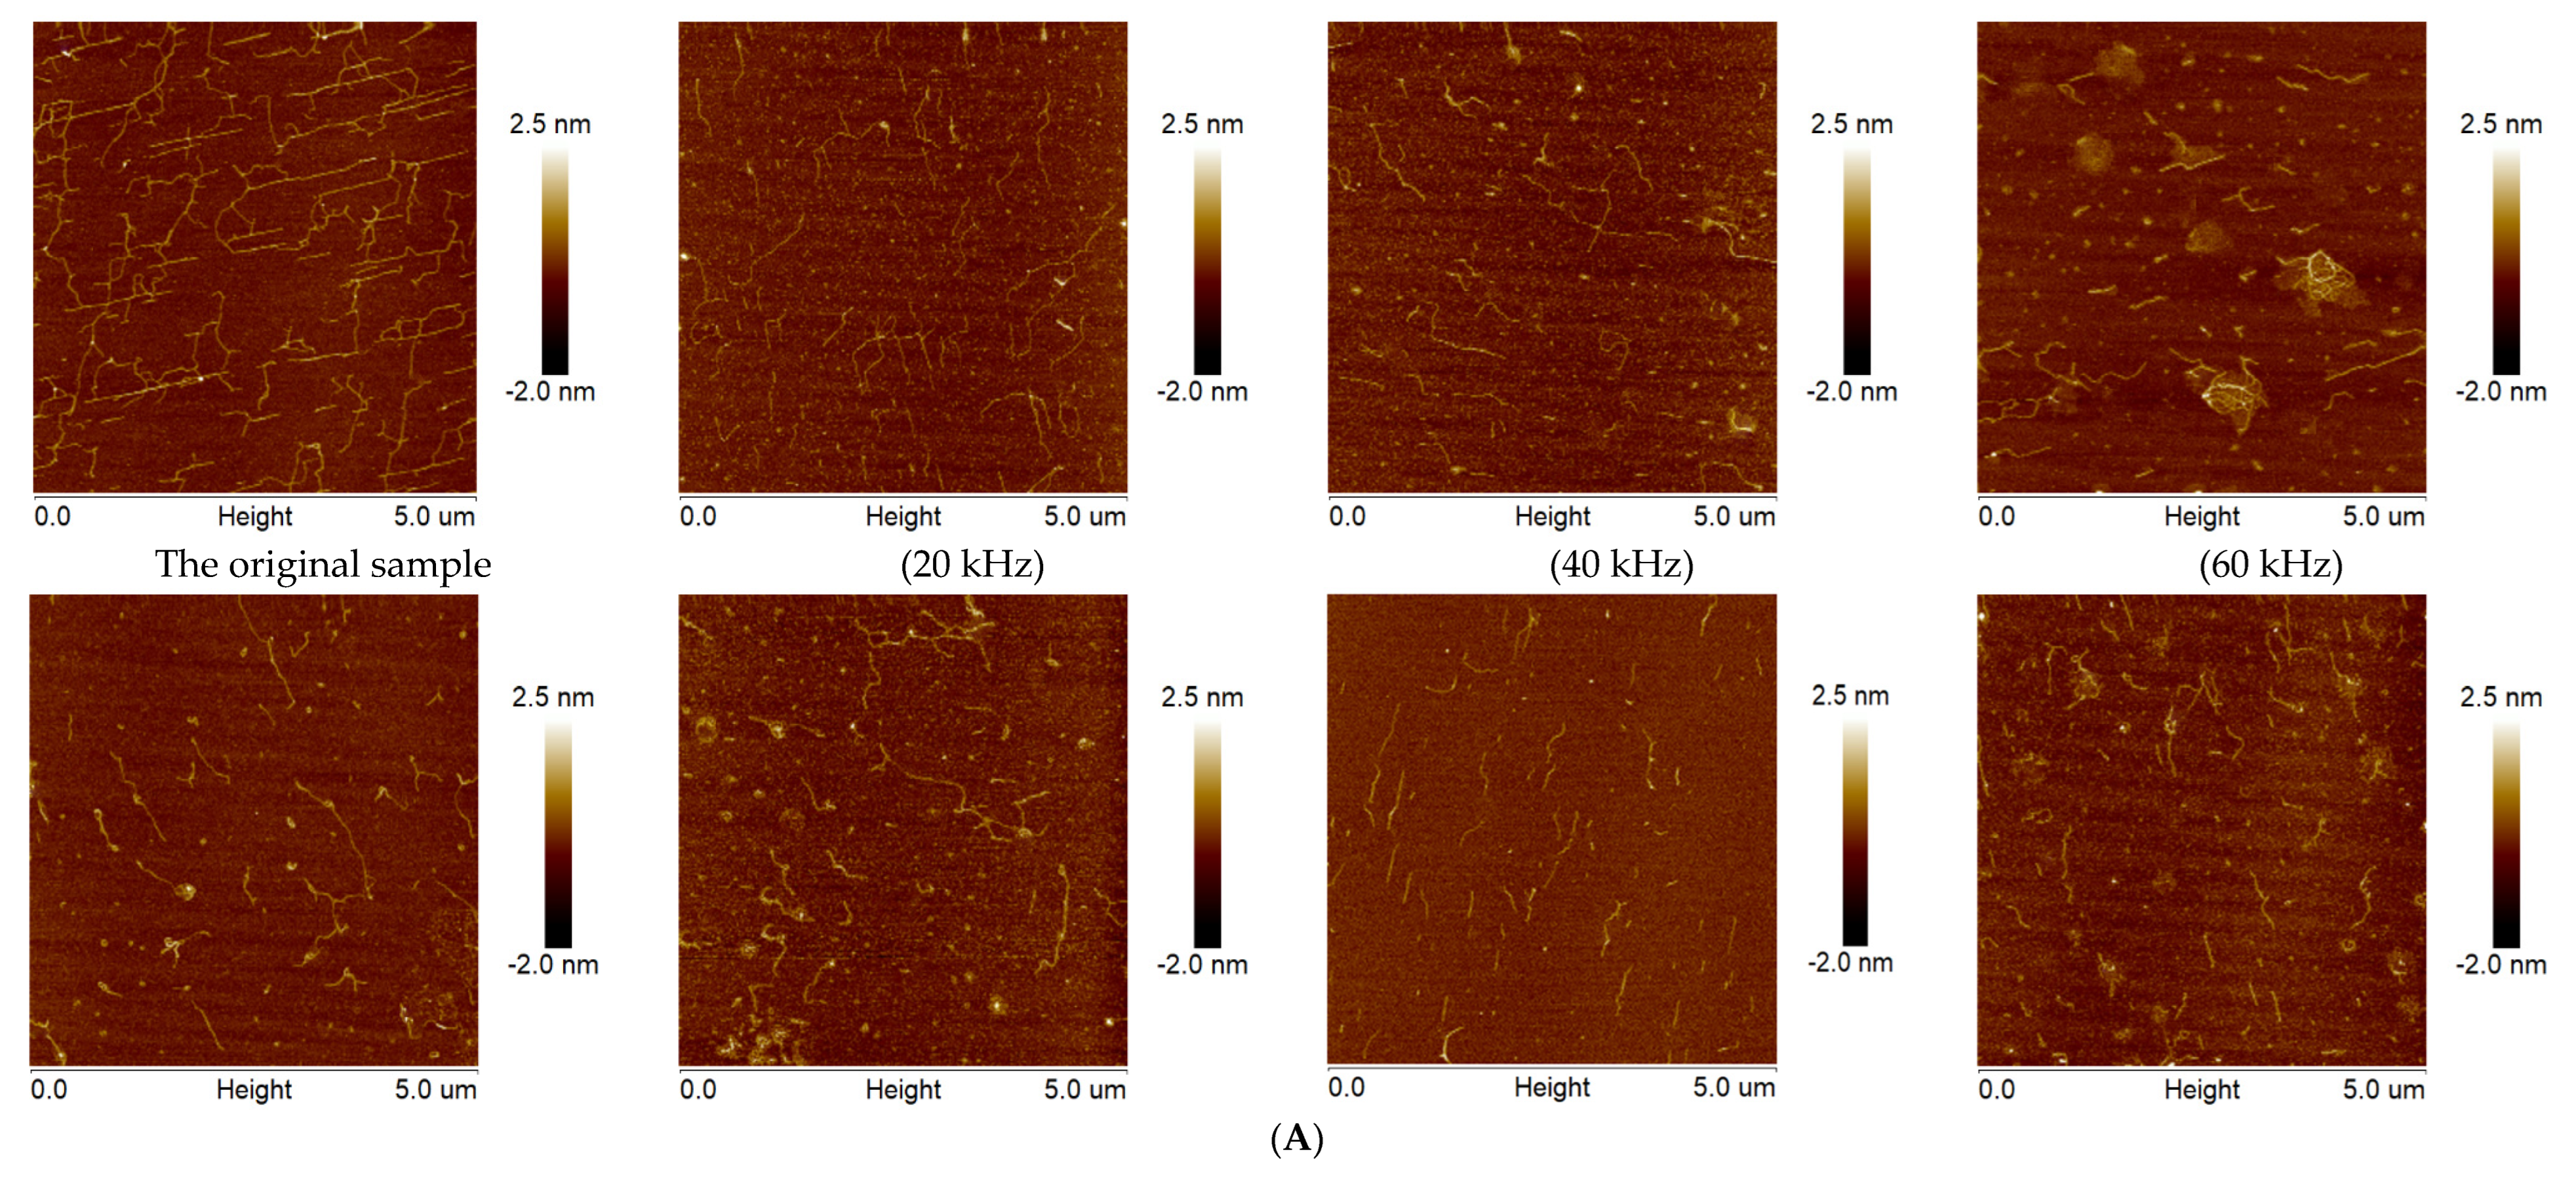
3.2.6. AFM Analysis
3.3. Immunomodulatory Activities
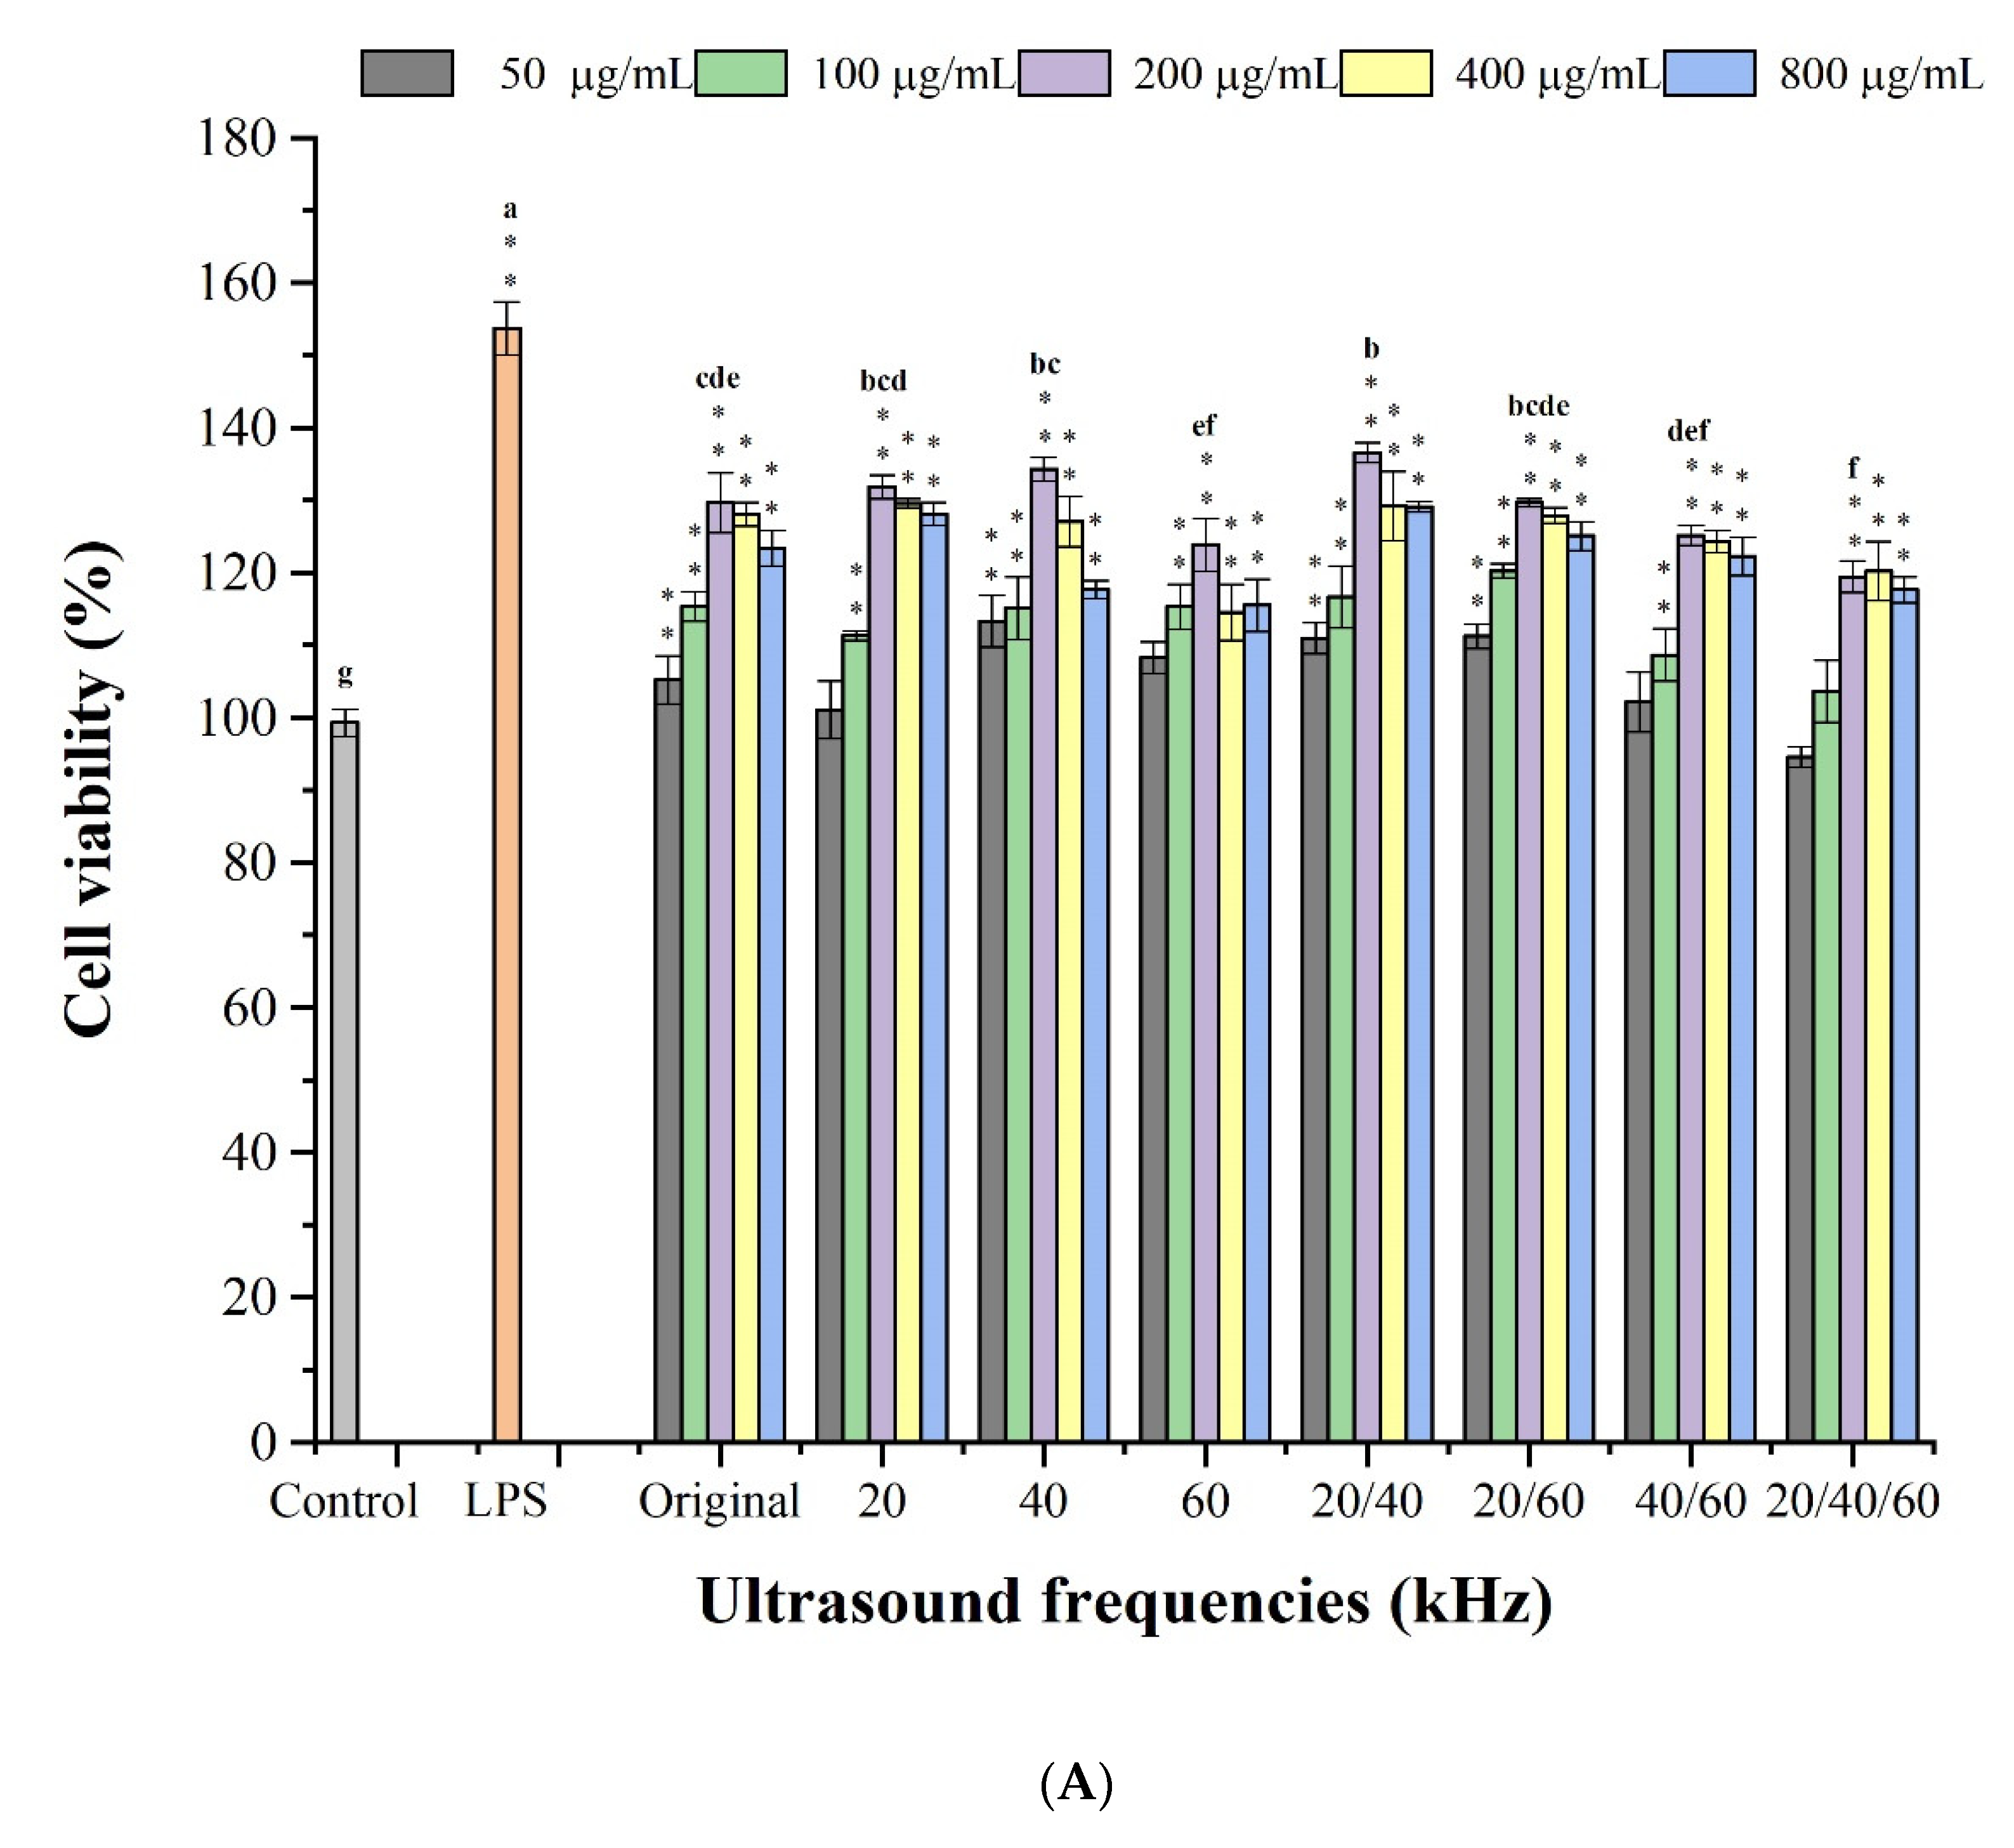
3.3.1. Effects of Lentinan on Cell Viability
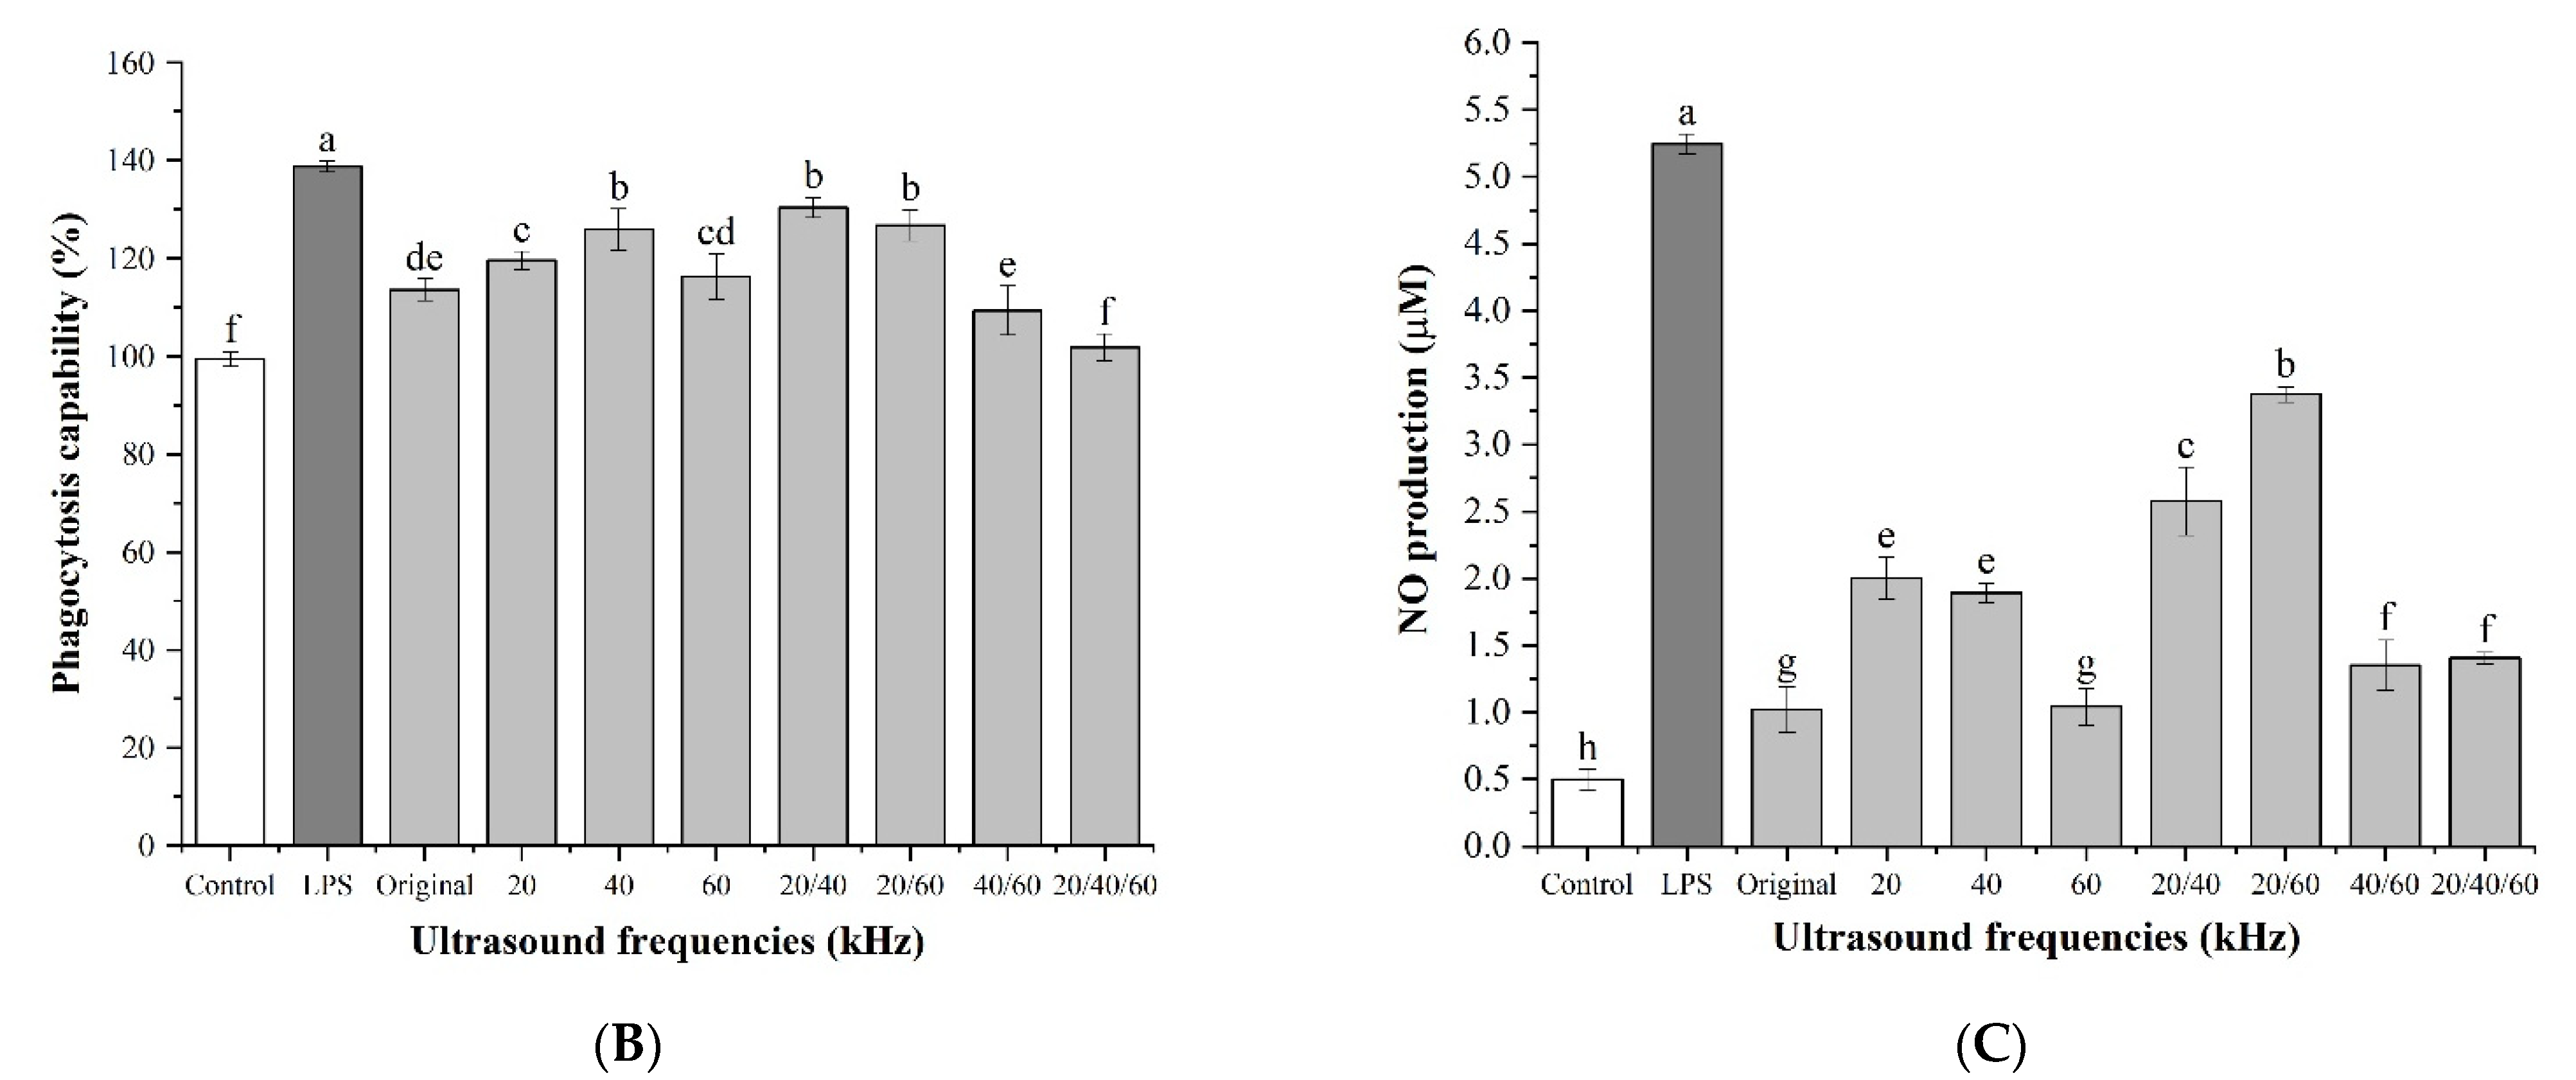
3.3.2. Effects of Lentinan on Cell Phagocytic Activity
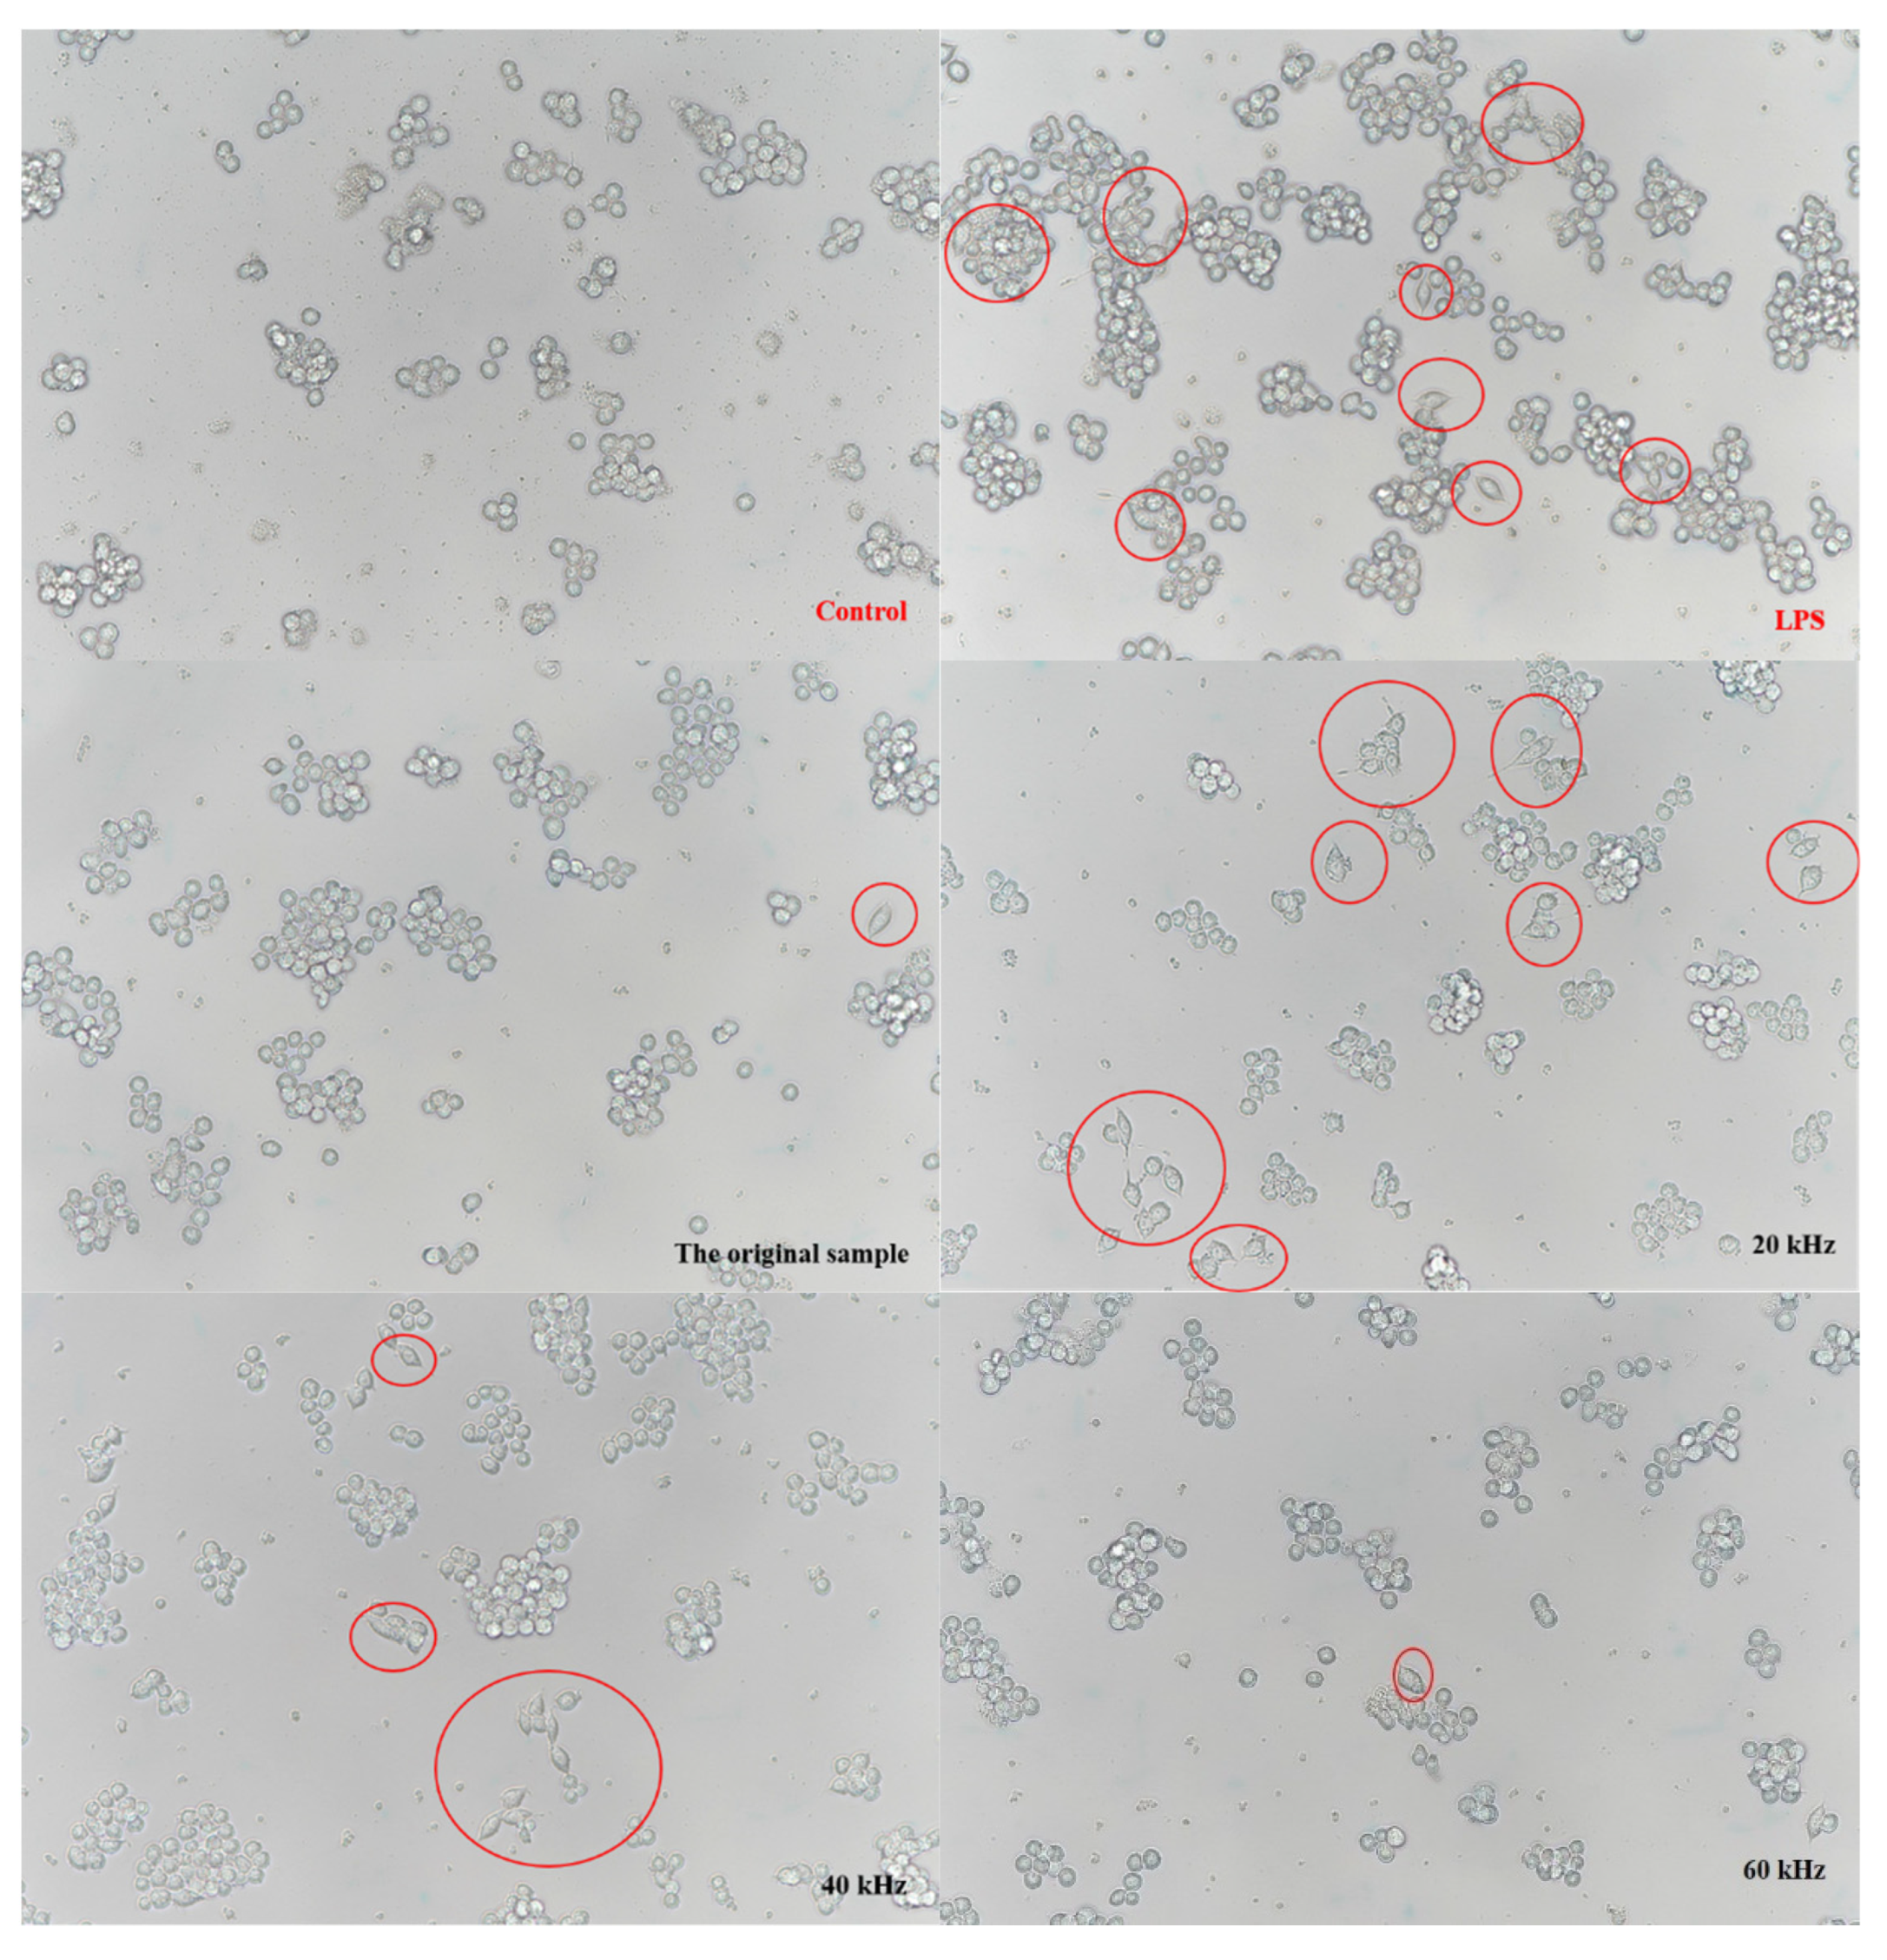
3.3.3. Effects of Lentinan on Cell Morphology
3.3.4. Effect of Lentinan on Cell NO Production
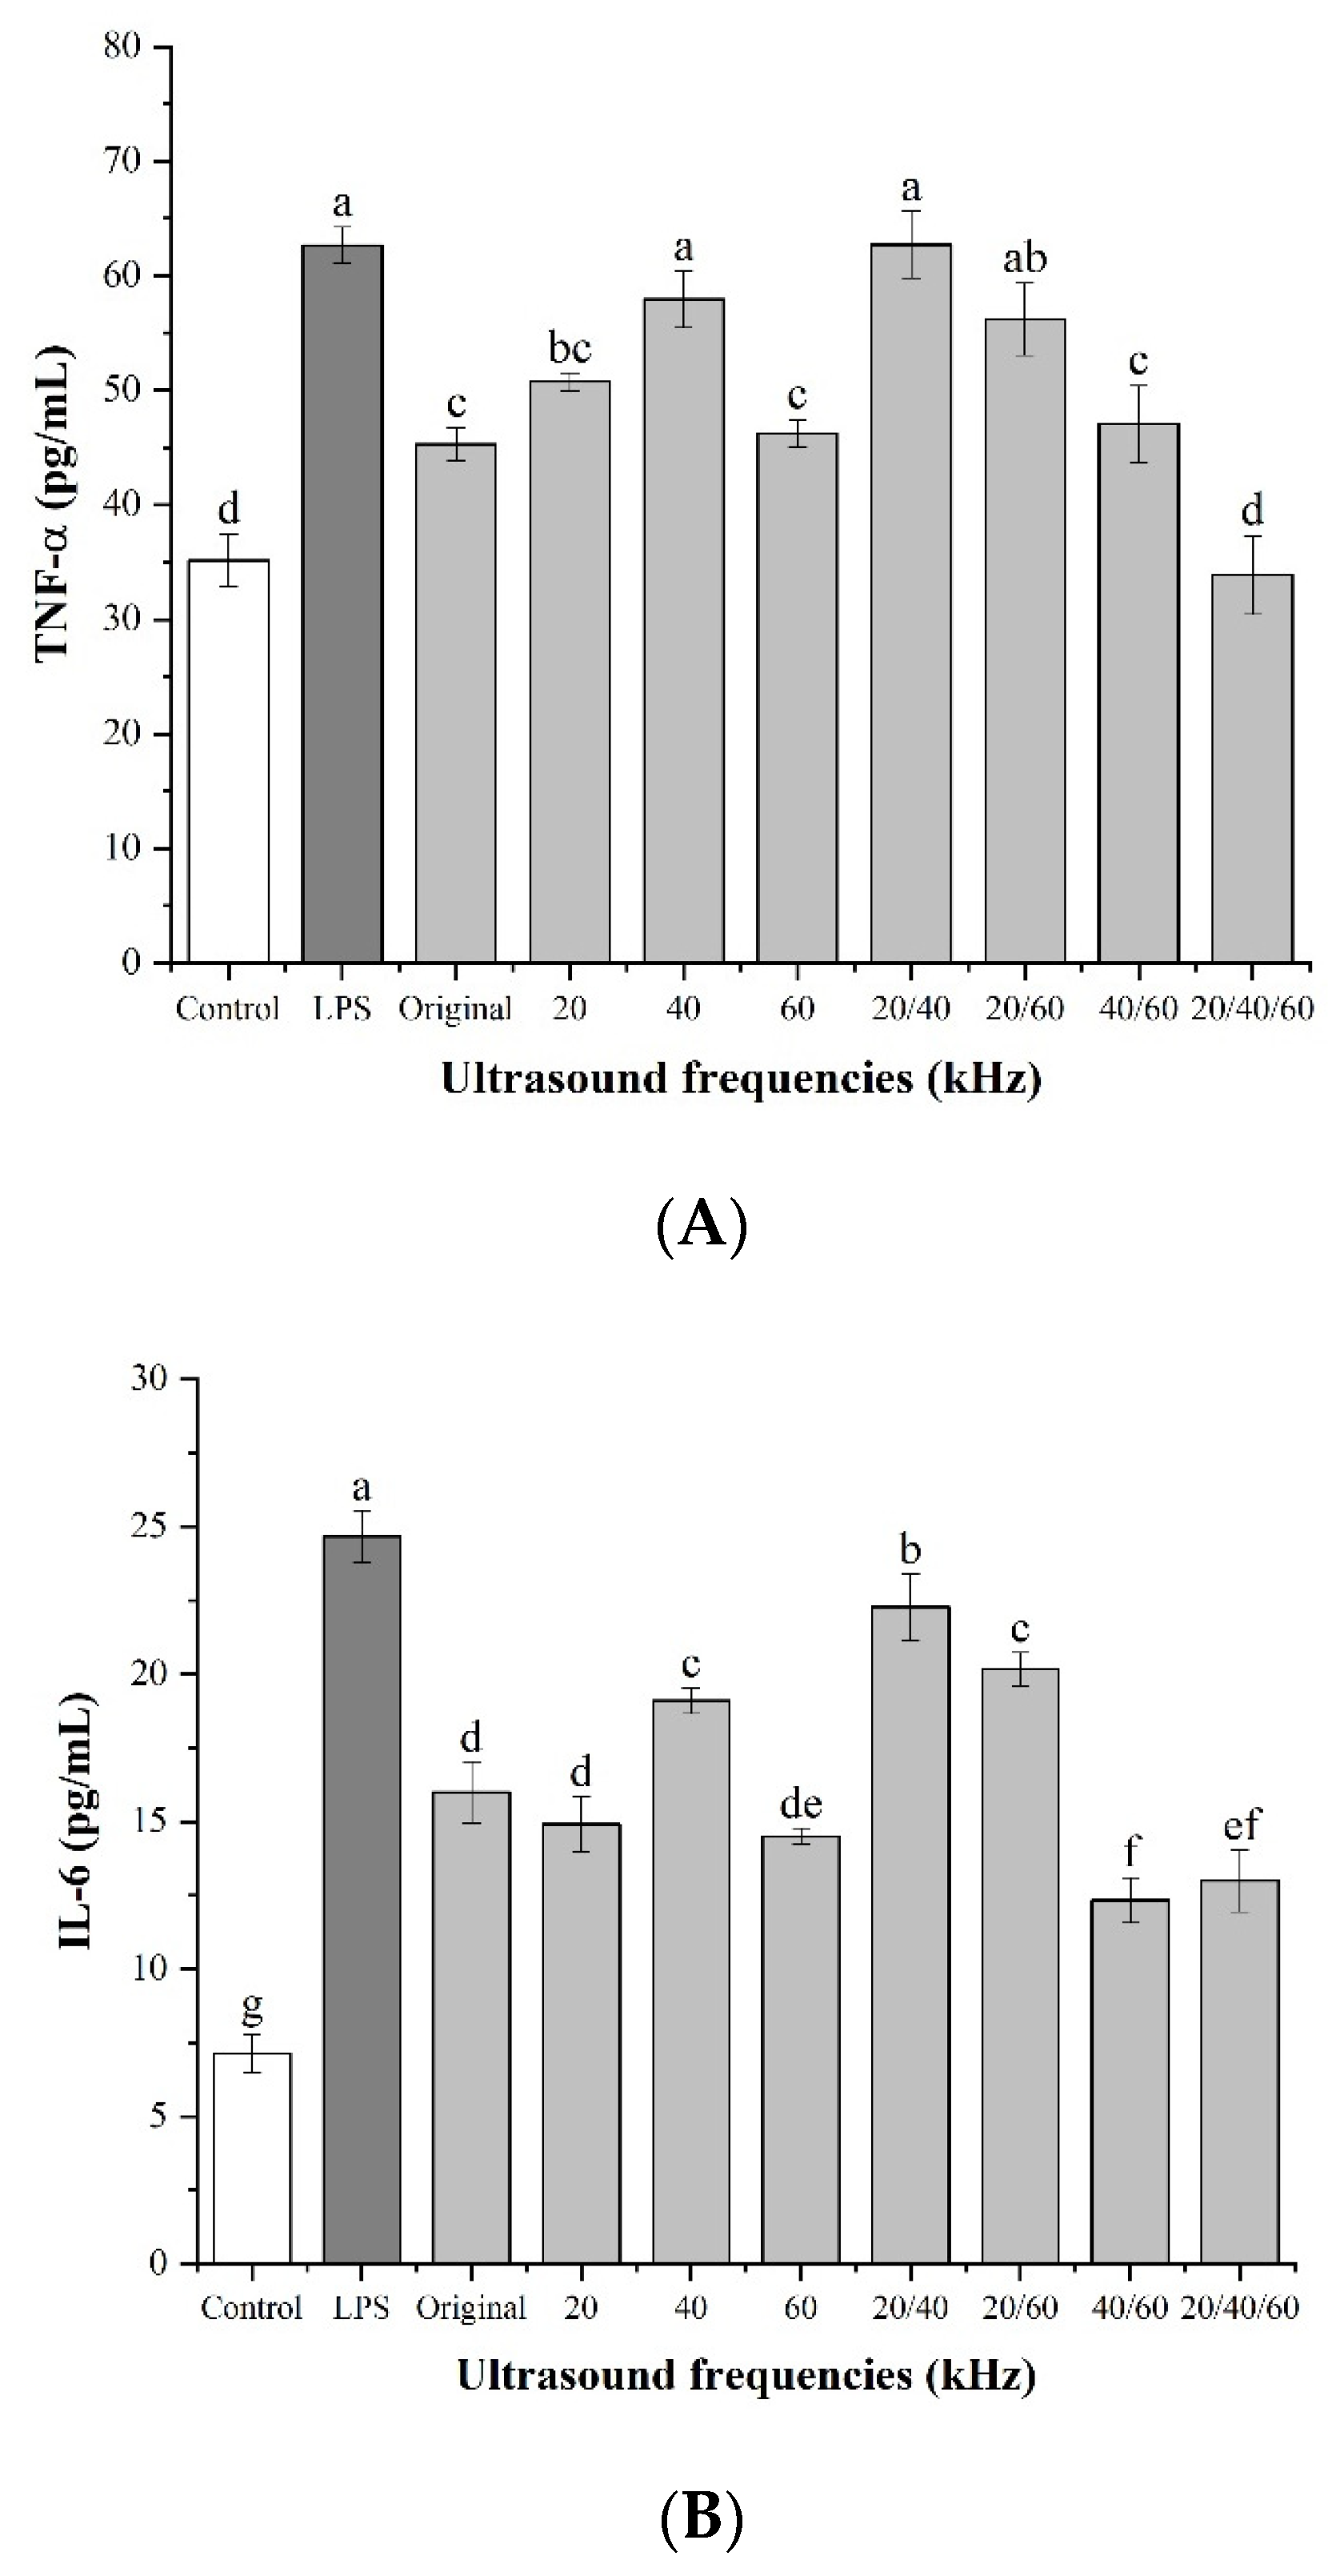
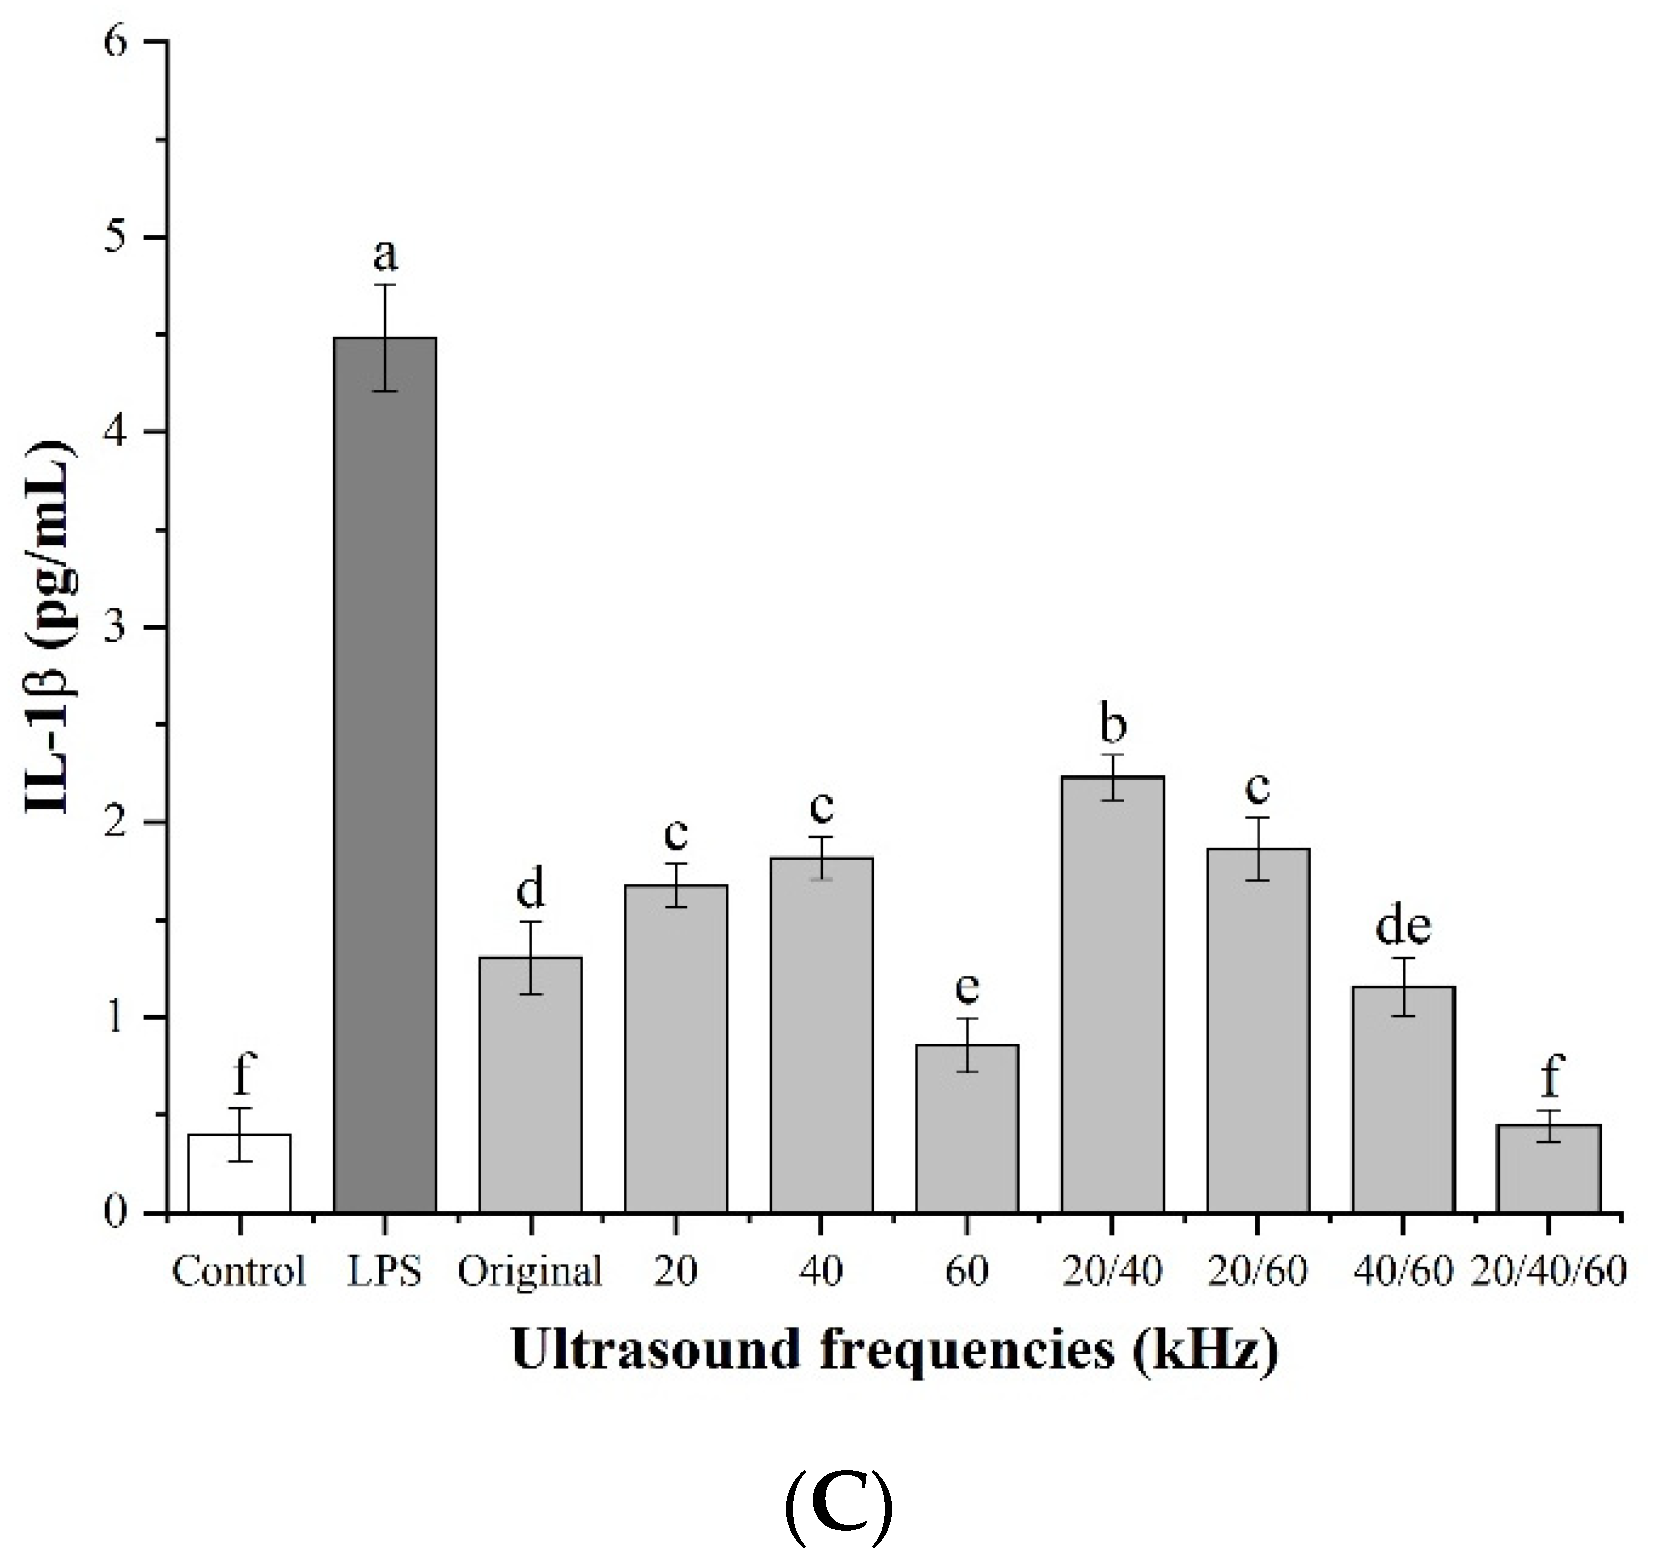
3.3.5. Effect of Lentinan on Cell Cytokine Secretion
3.4. Correlation Analysis
4. Conclusions
Supplementary Materials
Author Contributions
Funding
Institutional Review Board Statement
Informed Consent Statement
Data Availability Statement
Acknowledgments
Conflicts of Interest
References
- Silva, E.R.; Cavallazzi, J.R.P.; Muller, G.; Souza, J.V.B. Biotechnological Applications of Lentinus edodes. J. Food Agric. Environ. 2007, 5, 403–407. [Google Scholar]
- Xu, X.; Yan, H.; Tang, J.; Chen, J.; Zhang, X. Polysaccharides in Lentinus edodes: Isolation, Structure, Immunomodulating Activity and Future Prospective. Crit. Rev. Food Sci. Nutr. 2014, 54, 474–487. [Google Scholar] [CrossRef] [PubMed]
- Gaitán-Hernández, R.; López-Peña, D.; Esqueda, M.; Gutiérrez, A. Review of Bioactive Molecules Production, Biomass, and Basidiomata of Shiitake Culinary-Medicinal Mushrooms, Lentinus edodes (Agaricomycetes). IJM 2019, 21, 841–850. [Google Scholar] [CrossRef] [PubMed]
- Xu, X.; Chen, P.; Zhang, L.; Ashida, H. Chain Structures of Glucans from Lentinus edodes and Their Effects on NO Production from RAW 264.7 Macrophages. Carbohydr. Polym. 2012, 87, 1855–1862. [Google Scholar] [CrossRef]
- Zhang, J.; Wen, C.; Gu, J.; Ji, C.; Duan, Y.; Zhang, H. Effects of Subcritical Water Extraction Microenvironment on the Structure and Biological Activities of Polysaccharides from Lentinus edodes. Int. J. Biol. Macromol. 2019, 123, 1002–1011. [Google Scholar] [CrossRef]
- Yu, Z.; Ming, G.; Kaiping, W.; Zhixiang, C.; Liquan, D.; Jingyu, L.; Fang, Z. Structure, Chain Conformation and Antitumor Activity of a Novel Polysaccharide from Lentinus edodes. Fitoterapia 2010, 81, 1163–1170. [Google Scholar] [CrossRef]
- Ren, G.; Xu, L.; Lu, T.; Yin, J. Structural Characterization and Antiviral Activity of Lentinan from Lentinus edodes Mycelia against Infectious Hematopoietic Necrosis Virus. Int. J. Biol. Macromol. 2018, 115, 1202–1210. [Google Scholar] [CrossRef]
- Li, J.; Hu, X.; Li, X.; Ma, Z. Effects of Acetylation on the Emulsifying Properties of Artemisia sphaerocephala Krasch. Polysaccharide. Carbohydr. Polym. 2016, 144, 531–540. [Google Scholar] [CrossRef]
- Zákány, J.; Chihara, G.; Fachet, J. Effect of Lentinan on Tumor Growth in Murine Allogeneic and Syngeneic Hosts. Int. J. Cancer 1980, 25, 371–376. [Google Scholar] [CrossRef]
- Guo, M.-Z.; Meng, M.; Duan, S.-Q.; Feng, C.-C.; Wang, C.-L. Structure Characterization, Physicochemical Property and Immunomodulatory Activity on RAW264.7 Cells of a Novel Triple-Helix Polysaccharide from Craterellus cornucopioides. Int. J. Biol. Macromol. 2019, 126, 796–804. [Google Scholar] [CrossRef]
- Huang, Z.; Zeng, Y.-J.; Chen, X.; Luo, S.-Y.; Pu, L.; Li, F.-Z.; Zong, M.-H.; Lou, W.-Y. A Novel Polysaccharide from the Roots of Millettia speciosa Champ: Preparation, Structural Characterization and Immunomodulatory Activity. Int. J. Biol. Macromol. 2020, 145, 547–557. [Google Scholar] [CrossRef] [PubMed]
- Meng, Y.; Shi, X.; Cai, L.; Zhang, S.; Ding, K.; Nie, S.; Luo, C.; Xu, X.; Zhang, L. Triple-Helix Conformation of a Polysaccharide Determined with Light Scattering, AFM, and Molecular Dynamics Simulation. Macromolecules 2018, 51, 10150–10159. [Google Scholar] [CrossRef]
- Xu, X.; Wang, X.; Cai, F.; Zhang, L. Renaturation of Triple Helical Polysaccharide Lentinan in Water-Diluted Dimethylsulfoxide Solution. Carbohydr. Res. 2010, 345, 419–424. [Google Scholar] [CrossRef] [PubMed]
- Meng, Y.; Lyu, F.; Xu, X.; Zhang, L. Recent Advances in Chain Conformation and Bioactivities of Triple-Helix Polysaccharides. Biomacromolecules 2020, 21, 1653–1677. [Google Scholar] [CrossRef] [PubMed]
- Wang, X.; Xu, X.; Zhang, L. Thermally Induced Conformation Transition of Triple-Helical Lentinan in NaCl Aqueous Solution. J. Phys. Chem. B 2008, 112, 10343–10351. [Google Scholar] [CrossRef]
- Zhang, L.; Li, X.; Xu, X.; Zeng, F. Correlation between Antitumor Activity, Molecular Weight, and Conformation of Lentinan. Carbohydr. Res. 2005, 340, 1515–1521. [Google Scholar] [CrossRef]
- Cui, R.; Zhu, F. Ultrasound Modified Polysaccharides: A Review of Structure, Physicochemical Properties, Biological Activities and Food Applications. Trends Food Sci. Technol. 2021, 107, 491–508. [Google Scholar] [CrossRef]
- Yuan, Q.; Lin, S.; Fu, Y.; Nie, X.-R.; Liu, W.; Su, Y.; Han, Q.-H.; Zhao, L.; Zhang, Q.; Lin, D.-R.; et al. Effects of Extraction Methods on the Physicochemical Characteristics and Biological Activities of Polysaccharides from Okra (Abelmoschus esculentus). Int. J. Biol. Macromol. 2019, 127, 178–186. [Google Scholar] [CrossRef]
- Zheng, Z.; Huang, Q.; Luo, X.; Xiao, Y.; Cai, W.; Ma, H. Effects and Mechanisms of Ultrasound- and Alkali-Assisted Enzymolysis on Production of Water-Soluble Yeast β-Glucan. Bioresour. Technol. 2019, 273, 394–403. [Google Scholar] [CrossRef]
- Qiu, W.-Y.; Cai, W.-D.; Wang, M.; Yan, J.-K. Effect of Ultrasonic Intensity on the Conformational Changes in Citrus Pectin under Ultrasonic Processing. Food Chem. 2019, 297, 125021. [Google Scholar] [CrossRef]
- Gu, J.; Zhang, H.; Wen, C.; Zhang, J.; He, Y.; Ma, H.; Duan, Y. Purification, Characterization, Antioxidant and Immunological Activity of Polysaccharide from Sagittaria sagittifolia L. Food Res. Int. 2020, 136, 109345. [Google Scholar] [CrossRef] [PubMed]
- Wang, H.; Chen, J.; Ren, P.; Zhang, Y.; Omondi Onyango, S. Ultrasound Irradiation Alters the Spatial Structure and Improves the Antioxidant Activity of the Yellow Tea Polysaccharide. Ultrason. Sonochemistry 2021, 70, 105355. [Google Scholar] [CrossRef] [PubMed]
- Yan, J.-K.; Pei, J.-J.; Ma, H.-L.; Wang, Z.-B. Effects of Ultrasound on Molecular Properties, Structure, Chain Conformation and Degradation Kinetics of Carboxylic Curdlan. Carbohydr. Polym. 2015, 121, 64–70. [Google Scholar] [CrossRef] [PubMed]
- Chen, T.-T.; Zhang, Z.-H.; Wang, Z.-W.; Chen, Z.-L.; Ma, H.; Yan, J.-K. Effects of Ultrasound Modification at Different Frequency Modes on Physicochemical, Structural, Functional, and Biological Properties of Citrus Pectin. Food Hydrocoll. 2021, 113, 106484. [Google Scholar] [CrossRef]
- Liu, H.-L.; Hsieh, C.-M. Single-Transducer Dual-Frequency Ultrasound Generation to Enhance Acoustic Cavitation. Ultrason. Sonochemistry 2009, 16, 431–438. [Google Scholar] [CrossRef] [PubMed]
- Zhang, Y.; Zhang, Y.; Li, S. The Secondary Bjerknes Force between Two Gas Bubbles under Dual-Frequency Acoustic Excitation. Ultrason. Sonochemistry 2016, 29, 129–145. [Google Scholar] [CrossRef]
- Chen, Z.-L.; Wang, C.; Ma, H.; Ma, Y.; Yan, J.-K. Physicochemical and Functional Characteristics of Polysaccharides from Okra Extracted by Using Ultrasound at Different Frequencies. Food Chem. 2021, 361, 130138. [Google Scholar] [CrossRef]
- Yang, B.; Luo, Y.; Wu, Q.; Yang, Q.; Kan, J. Hovenia dulcis Polysaccharides: Influence of Multi-Frequency Ultrasonic Extraction on Structure, Functional Properties, and Biological Activities. Int. J. Biol. Macromol. 2020, 148, 1010–1020. [Google Scholar] [CrossRef]
- Zhang, Z.; Wang, Y.; Jiang, H.; Dai, C.; Xing, Z.; Kumah Mintah, B.; Dabbour, M.; He, R.; Ma, H. Effect of Dual-Frequency Ultrasound on the Formation of Lysinoalanine and Structural Characterization of Rice Dreg Protein Isolates. Ultrason. Sonochemistry 2020, 67, 105124. [Google Scholar] [CrossRef]
- Tian, J.; Zhang, C.; Wang, X.; Rui, X.; Zhang, Q.; Chen, X.; Dong, M.; Li, W. Structural Characterization and Immunomodulatory Activity of Intracellular Polysaccharide from the Mycelium of Paecilomyces cicadae TJJ1213. Food Res. Int. 2021, 147, 110515. [Google Scholar] [CrossRef]
- Yang, L.; Zhang, H.; Zhao, Y.; Huang, J.; Zhu, D.; Wang, S.; Zhu, L.; Chen, L.; Xu, X.; Liu, H. Chemical Structure, Chain Conformation and Rheological Properties of Pectic Polysaccharides from Soy Hulls. Int. J. Biol. Macromol. 2020, 148, 41–48. [Google Scholar] [CrossRef] [PubMed]
- Feng, Y.; Qiu, Y.; Duan, Y.; He, Y.; Xiang, H.; Sun, W.; Zhang, H.; Ma, H. Characterization, Antioxidant, Antineoplastic and Immune Activities of Selenium Modified Sagittaria sagittifolia L. Polysaccharides. Food Res. Int. 2022, 153, 110913. [Google Scholar] [CrossRef] [PubMed]
- Chen, S.; Shang, H.; Yang, J.; Li, R.; Wu, H. Effects of Different Extraction Techniques on Physicochemical Properties and Activities of Polysaccharides from Comfrey (Symphytum officinale L.) Root. Ind. Crops Prod. 2018, 121, 18–25. [Google Scholar] [CrossRef]
- Wang, L.; Liu, H.-M.; Qin, G.-Y. Structure Characterization and Antioxidant Activity of Polysaccharides from Chinese Quince Seed Meal. Food Chem. 2017, 234, 314–322. [Google Scholar] [CrossRef]
- Dou, Z.; Chen, C.; Fu, X. The Effect of Ultrasound Irradiation on the Physicochemical Properties and α-Glucosidase Inhibitory Effect of Blackberry Fruit Polysaccharide. Food Hydrocoll. 2019, 96, 568–576. [Google Scholar] [CrossRef]
- Feng, Y.; Juliet, I.C.; Wen, C.; Duan, Y.; Zhou, J.; He, Y.; Zhang, H.; Ma, H. Effects of Multi-Mode Divergent Ultrasound Pretreatment on the Physicochemical and Functional Properties of Polysaccharides from Sagittaria sagittifolia L. Food Biosci. 2021, 42, 101145. [Google Scholar] [CrossRef]
- Li, L.; Huang, T.; Liu, H.; Zang, J.; Wang, P.; Jiang, X. Purification, Structural Characterization and Anti-UVB Irradiation Activity of an Extracellular Polysaccharide from Pantoea agglomerans. Int. J. Biol. Macromol. 2019, 137, 1002–1012. [Google Scholar] [CrossRef]
- Wu, Y.-T.; Huo, Y.-F.; Xu, L.; Xu, Y.-Y.; Wang, X.-L.; Zhou, T. Purification, Characterization and Antioxidant Activity of Polysaccharides from Porphyra haitanensis. Int. J. Biol. Macromol. 2020, 165, 2116–2125. [Google Scholar] [CrossRef]
- Wang, C.; Yu, Y.-B.; Chen, T.-T.; Wang, Z.-W.; Yan, J.-K. Innovative Preparation, Physicochemical Characteristics and Functional Properties of Bioactive Polysaccharides from Fresh Okra (Abelmoschus esculentus (L.) Moench). Food Chem. 2020, 320, 126647. [Google Scholar] [CrossRef]
- Xu, Y.; Guo, Y.; Duan, S.; Wei, H.; Liu, Y.; Wang, L.; Huo, X.; Yang, Y. Effects of Ultrasound Irradiation on the Characterization and Bioactivities of the Polysaccharide from Blackcurrant Fruits. Ultrason. Sonochemistry 2018, 49, 206–214. [Google Scholar] [CrossRef]
- Yan, J.-K.; Wang, Y.-Y.; Ma, H.-L.; Wang, Z.-B. Ultrasonic Effects on the Degradation Kinetics, Preliminary Characterization and Antioxidant Activities of Polysaccharides from Phellinus linteus Mycelia. Ultrason. Sonochemistry 2016, 29, 251–257. [Google Scholar] [CrossRef] [PubMed]
- Wang, D.; Wang, D.; Yan, T.; Jiang, W.; Han, X.; Yan, J.; Guo, Y. Nanostructures Assembly and the Property of Polysaccharide Extracted from Tremella fuciformis Fruiting Body. Int. J. Biol. Macromol. 2019, 137, 751–760. [Google Scholar] [CrossRef] [PubMed]
- Qiu, J.; Zhang, H.; Wang, Z. Ultrasonic Degradation OfPolysaccharides from Auricularia Auricula and the Antioxidant Activity of Their Degradation Products. LWT 2019, 113, 108266. [Google Scholar] [CrossRef]
- Chen, X.; Fang, D.; Zhao, R.; Gao, J.; Kimatu, B.M.; Hu, Q.; Chen, G.; Zhao, L. Effects of Ultrasound-Assisted Extraction on Antioxidant Activity and Bidirectional Immunomodulatory Activity of Flammulina velutipes Polysaccharide. Int. J. Biol. Macromol. 2019, 140, 505–514. [Google Scholar] [CrossRef]
- Hwang, H.-J.; Kim, S.-W.; Choi, J.-W.; Yun, J.-W. Production and Characterization of Exopolysaccharides from Submerged Culture of Phellinus linteus KCTC 6190. Enzym. Microb. Technol. 2003, 33, 309–319. [Google Scholar] [CrossRef]
- Zhang, L.; Wang, C.; Wang, Z.; Zhang, X. Single-Molecule Force Spectroscopy on Curdlan: Unwinding Helical Structures and Random Coils. Nano Lett. 2003, 3, 1119–1124. [Google Scholar] [CrossRef]
- Sato, T.; Norisuye, T.; Fujita, H. Double-Stranded Helix of Xanthan: Dimensional and Hydrodynamic Properties in 0.1 M Aqueous Sodium Chloride. Macromolecules 1984, 17, 2696–2700. [Google Scholar] [CrossRef]
- Yan, J.-K.; Cai, W.-D.; Wang, C.; Yu, Y.-B.; Zhang, H.-N.; Yang, Y.; Wang, W.-H. Macromolecular Behavior, Structural Characteristics and Rheological Properties of Alkali-Neutralization Curdlan at Different Concentrations. Food Hydrocoll. 2020, 105, 105785. [Google Scholar] [CrossRef]
- Marchessault, R.H.; Deslandes, Y. Fine Structure of (1→3)-β-d-Glucans: Curdlan and Paramylon. Carbohydr. Res. 1979, 75, 231–242. [Google Scholar] [CrossRef]
- Bai, W.; Faisal, S.; Wang, Q.; Liu, H. Dissolution, Regeneration and Characterization of Curdlan in the Ionic Liquid 1-Ethyl-3-Methylimidazolium Acetate. Int. J. Biol. Macromol. 2019, 130, 922–927. [Google Scholar] [CrossRef]
- Dentini, M.; Rinaldi, G.; Barbetta, A.; Risica, D.; Skjak-Braek, G. Acid Gel Formation in (Pseudo) Alginates with and without G Blocks Produced by Epimerising Mannuronan with C5 Epimerases. Carbohydr. Polym. 2006, 63, 519–526. [Google Scholar] [CrossRef]
- Yuan, Q.; Zhang, J.; Xiao, C.; Harqin, C.; Ma, M.; Long, T.; Li, Z.; Yang, Y.; Liu, J.; Zhao, L. Structural Characterization of a Low-Molecular-Weight Polysaccharide from Angelica pubescens Maxim. f. biserrata Shan et Yuan Root and Evaluation of Its Antioxidant Activity. Carbohydr. Polym. 2020, 236, 116047. [Google Scholar] [CrossRef] [PubMed]
- Rao, Z.; Dong, Y.; Zheng, X.; Tang, K.; Liu, J. Extraction, Purification, Bioactivities and Prospect of Lentinan: A Review. Biocatal. Agric. Biotechnol. 2021, 37, 102163. [Google Scholar] [CrossRef]
- Wang, Y.; Tian, Y.; Shao, J.; Shu, X.; Jia, J.; Ren, X.; Guan, Y. Macrophage Immunomodulatory Activity of the Polysaccharide Isolated from Collybia radicata Mushroom. Int. J. Biol. Macromol. 2017, 108, 300–306. [Google Scholar] [CrossRef]
- Lee, J.; Li, C.; Surayot, U.; Yelithao, K.; Lee, S.; Park, W.; Tabarsa, M.; You, S. Molecular Structures, Chemical Properties and Biological Activities of Polysaccharide from Smilax glabra Rhizome. Int. J. Biol. Macromol. 2018, 120, 1726–1733. [Google Scholar] [CrossRef]
- Zheng, Z.; Huang, Q.; Kang, Y.; Liu, Y.; Luo, W. Different Molecular Sizes and Chain Conformations of Water-Soluble Yeast β-Glucan Fractions and Their Interactions with Receptor Dectin-1. Carbohydr. Polym. 2021, 273, 118568. [Google Scholar] [CrossRef] [PubMed]
- Adams, E.L.; Rice, P.J.; Graves, B.; Ensley, H.E.; Yu, H.; Brown, G.D.; Gordon, S.; Monteiro, M.A.; Papp-Szabo, E.; Lowman, D.W.; et al. Differential High-Affinity Interaction of Dectin-1 with Natural or Synthetic Glucans Is Dependent upon Primary Structure and Is Influenced by Polymer Chain Length and Side-Chain Branching. J Pharm. Exp. Ther. 2008, 325, 115–123. [Google Scholar] [CrossRef]
- Li, C.; Dong, Z.; Zhang, B.; Huang, Q.; Liu, G.; Fu, X. Structural Characterization and Immune Enhancement Activity of a Novel Polysaccharide from Moringa oleifera Leaves. Carbohydr. Polym. 2020, 234, 115897. [Google Scholar] [CrossRef]


| Samples | Monosaccharide (mol.%) | |||
|---|---|---|---|---|
| Ara | Man | Glu | Gal | |
| Original | 1.57 ± 0.02 | 10.42 ± 0.17 | 77.51 ± 0.73 | 10.50 ± 0.35 |
| 20 kHz | 1.69 ± 0.03 | 10.79 ± 0.12 | 78.53 ± 0.99 | 9.09 ± 0.13 |
| 40 kHz | 1.73 ± 0.03 | 9.40 ± 0.11 | 79.37 ± 1.35 | 9.50 ± 0.25 |
| 60 kHz | 1.81 ± 0.05 | 8.11 ± 0.05 | 81.01 ± 1.21 | 9.07 ± 0.19 |
| 20/40 kHz | 1.68 ± 0.04 | 8.96 ± 0.07 | 79.49 ± 0.87 | 9.87 ± 0.11 |
| 20/60 kHz | 1.67 ± 0.04 | 8.32 ± 0.09 | 80.79 ± 1.03 | 9.22 ± 0.12 |
| 40/60 kHz | 1.89 ± 0.05 | 8.52 ± 0.06 | 81.33 ± 1.29 | 8.26 ± 0.06 |
| 20/40/60 kHz | 1.83 ± 0.03 | 8.20 ± 0.04 | 81.53 ± 1.05 | 8.44 ± 0.21 |
| Samples | Mn (g/mol) | Mw (g/mol) | Mw/Mn | <S2>z1/2 (nm) | Rh (nm) | α a | ρ b | df c | Conformation |
|---|---|---|---|---|---|---|---|---|---|
| Original | 2.218 ± 0.353 × | 2.804 ± 0.191 × | 1.264 ± 0.051 | 88.45 ± 3.22 | 40.79 ± 2.37 | 0.923 | 2.17 | 1.08 | Rigid chain |
| 20 kHz | 1.731 ± 0.105 × | 1.336 ± 0.112 × | 1.295 ± 0.013 | 60.16 ± 3.24 | 31.24 ± 1.09 | 0.825 | 1.93 | 1.21 | Rigid chain |
| 40 kHz | 1.103 ± 0.195 × | 1.265 ± 0.181 × | 1.146 ± 0.022 | 55.67 ± 3.31 | 29.18 ± 2.03 | 0.814 | 1.91 | 1.23 | Rigid chain |
| 60 kHz | 6.008 ± 0.445 × | 8.693 ± 0.597 × | 1.446 ± 0.019 | 42.13 ± 1.99 | 25.87 ± 2.23 | 0.746 | 1.63 | 1.34 | Linear flexible chain |
| 20/40 kHz | 8.004 ± 0.375 × | 9.399 ± 0.461 × | 1.174 ± 0.037 | 48.72 ± 2.07 | 25.65 ± 2.05 | 0.802 | 1.90 | 1.25 | Semirigid chain |
| 20/60 kHz | 7.582 ± 0.423 × | 8.281 ± 0.315 × | 1.092 ± 0.010 | 45.36 ± 1.64 | 24.15 ± 2.04 | 0.819 | 1.88 | 1.22 | Semirigid chain |
| 40/60 kHz | 6.052 ± 0.615 × | 7.760 ± 0.237 × | 1.282 ± 0.041 | 28.17 ± 1.17 | 18.61 ± 1.51 | 0.633 | 1.51 | 1.58 | Random coil |
| 20/40/60 kHz | 4.102 ± 0.409 × | 6.607 ± 0.365 × | 1.607 ± 0.041 | 25.15 ± 1.35 | 17.17 ± 1.16 | 0.605 | 1.42 | 1.65 | Random coil |
| α | ρ | df | ||
|---|---|---|---|---|
| NO | Pearson correlation | 0.315 | 0.329 | −0.385 |
| Sig. (2-tailed) | 0.447 | 0.426 | 0.347 | |
| TNF-α | Pearson correlation | 0.661 | 0.648 | −0.721 * |
| Sig. (2-tailed) | 0.074 | 0.082 | 0.044 | |
| IL-6 | Pearson correlation | 0.661 | 0.681 | −0.723 * |
| Sig. (2-tailed) | 0.065 | 0.063 | 0.043 | |
| IL-1β | Pearson correlation | 0.550 | 0.614 | −0.586 |
| Sig. (2-tailed) | 0.158 | 0.105 | 0.127 | |
Publisher’s Note: MDPI stays neutral with regard to jurisdictional claims in published maps and institutional affiliations. |
© 2022 by the authors. Licensee MDPI, Basel, Switzerland. This article is an open access article distributed under the terms and conditions of the Creative Commons Attribution (CC BY) license (https://creativecommons.org/licenses/by/4.0/).
Share and Cite
Hua, Y.; Zhang, H.; Fu, Q.; Feng, Y.; Duan, Y.; Ma, H. Effects of Ultrasound Modification with Different Frequency Modes on the Structure, Chain Conformation, and Immune Activity of Polysaccharides from Lentinus edodes. Foods 2022, 11, 2470. https://doi.org/10.3390/foods11162470
Hua Y, Zhang H, Fu Q, Feng Y, Duan Y, Ma H. Effects of Ultrasound Modification with Different Frequency Modes on the Structure, Chain Conformation, and Immune Activity of Polysaccharides from Lentinus edodes. Foods. 2022; 11(16):2470. https://doi.org/10.3390/foods11162470
Chicago/Turabian StyleHua, Yu, Haihui Zhang, Qian Fu, Yuqin Feng, Yuqing Duan, and Haile Ma. 2022. "Effects of Ultrasound Modification with Different Frequency Modes on the Structure, Chain Conformation, and Immune Activity of Polysaccharides from Lentinus edodes" Foods 11, no. 16: 2470. https://doi.org/10.3390/foods11162470