1. Introduction
The academic debate on the research role that university professors should have has never reached a unanimous agreement. While some think that the research function is inherent to the profession of a university professor, since teaching cannot be understood without research, the reality is quite different. Not surprisingly, most of the universities that share the top positions in the rankings (i.e., ARWU, THE, QS) have opted for two different tracks: the non-tenure track, focused exclusively on teaching assignments, generally being part-time professors and with professional jobs outside the University; and the tenure-track, a figure more focused on research, teaching, and administrative positions, generally full-time professors.
Certainly, the realities of most countries with universities at the top of the rankings (USA, UK, France, Switzerland, Canada, Japan, China) are diametrically different from other countries with lower levels of development and universities in which there are different faculty configurations. For example, in the case of Mexico, there is a public system for evaluating professors (SNI), which, after assessing their research output (published articles, participation in international conferences, the direction of doctoral theses, etc.), grants recognition and a researcher level that is reflected in their salary and the reduction of the teaching and administrative load. At the same time, there are also professors without these accreditations who dedicate themselves, even full-time, to university teaching.
The «Sistema Nacional de Investigadores» (National System of Researchers) (SNI) is an accreditation granted by the Mexican Ministry of Universities to researchers after a process of blind peer evaluation of the researcher’s curriculum, focusing mainly on research activities and outputs (scientific articles published in high-impact journals, participation in international conferences, the direction of doctoral theses and research projects and grants). There are five researcher proficiency levels: (1) National Researcher Candidate, (2) National Researcher (I, II, and III), and, (3) Emeritus National Researcher. This accreditation is re-evaluated every two years, except for the Emeritus level, and can be lost, decreased, or increased in the scale, depending on the scientific production generated in the previous three years. Achieving a good researcher proficiency level in the SNI gives access to salary supplements and the possibility of being PI of research projects and grants sponsored by the State.
Concerning the labor policies of many Latin American universities, including Mexican universities, there are two types of professors: full-time (similar to tenure-track) and part-time (similar to non-tenure-track). However, in most universities, the faculty—even those who are full-time—dedicate between 30 and 40 h per week to teaching, tutoring students, and administrative functions. Some universities have proactive research policies that reduce the teaching workload for professors dedicated to research, even, depending on the researcher’s profile, assigning them only to teaching in postgraduate studies. However, this happens in an elite minority of private universities and the main public universities of each country.
The research policies of developing countries and their universities are constantly debated in this duality. It is often alleged that the overload of teaching and administrative work of professors negatively affects their scientific production (basically in the number and quality of their publications) so that those professors who do not have sufficient research production find it very difficult to change their teaching profile to “researcher” to reduce their teaching workload. This study seeks to answer whether the teaching load is a limiting factor for scientific production, based on analyzing 785 professors at a university with 31 campuses in Mexico and 22 extensions in 15 countries.
It is important to point out that this private university has been chosen as the sample axis because it has a diverse geographical distribution throughout Mexico, but it also has a presence in 15 other Latin American countries, so this exploratory study would have results that could reflect the reality, at least, of Mexican private universities. In addition, this research examines the impact of gender, age, undergraduate and graduate teaching load, faculty researcher accreditation level (SNI), and undergraduate and graduate theses directed, among other issues, on scientific productivity as measured by the professors’ number of annual publications.
1.1. Multidimensional Factors in the Complexity of the Teaching Profession
Complexity and education are intertwined through the multidimensional knowledge that comes from the teaching function and the teaching-learning process. With changing conditions and the development of technologies and communications, it is necessary to train new generations to be citizens capable of working in an environment characterized by complexity and diversity [
1]. While acknowledging that the demanding nature of teaching, and the complexities of teacher attrition, cannot be denied [
2], society must accept the complexity of teaching and reject a simplistic understanding of what it entails [
3]. Ishii [
4] also warns that in Japan, the complexity of the teaching profession has been downplayed through repeated systemic reforms, in which the profession is increasingly seen as a technical operation. Similarly, Yuen [
5] calls for a reconsideration of the ethical responsibility of teacher educators to address the complexity of teacher work often neglected by politics and the political/practical divide in teacher education.
In contrast, Pischetola [
6] argued for addressing the complexity of learning with innovative pedagogies that integrate multiple and situated teaching activities, providing a bridge between learning theories and educational practices, as well as promoting knowledge in practice with spaces for imagination in teaching with technologies and addressing the dynamic evolution of higher education. These actions coincide with Carmi & Tamir [
7], who located three professional ideals: teachers as intellectuals, artisans, and artists. From this perspective, recognizing complexity in education places the teacher at the center of this multidimensional connection.
In the teaching profession, complexity is recognized through the interconnected nodes of the personal dimensions of the teacher, the institution, the context, social dimensions, and the educational practice itself. Educational science is the discipline that studies theoretical practices and techniques to analyze, understand, and explain the complex problems that occur in different spaces (both formal and non-formal learning) [
8]. Factors such as teacher training, the organization of courses, the delivery of particular subjects, and the profile of the teachers who teach them are substantive dimensions of the teaching profession [
9]. Similarly, Arista & Abbas [
10] recognized factors such as performance expectancy, social influence, facilitating conditions, and habitus. In the same vein, Flores [
11] locates personal dimensions with the need to confront present and past experiences, internal tensions, and dilemmas and raise awareness of the contextual complexity of the classroom. The increasing complexity of the profession requires teachers to be lifelong learners, but at the same time, this complexity stands in the way of teacher learning [
12]. Sancho-Gil & Hernández-Hernández [
13] locate dimensions from agencies and institutions: social relations, work approaches, and social inequalities. Similarly, Sanabria et al. [
14] identified that the intersection of political, social, environmental, economic, and educational systems would make it possible to move from a limited dimension to the whole cycle. The multiple dimensions of the teaching profession interconnect to recreate differentiated profiles. What happens in the complexity of roles that link large areas such as teaching and research?
1.2. Scientific Productivity of University Professors
Scientific productivity is often associated with research productivity (publications, conferences, posters, grants, research projects) as tangible outputs of mainly university professors. In the case of research professors, complexity and uncertainty mean that many academicians do not attain the expected heights of scientific productivity [
15]. The functioning of institutions has changed, and with it, new structures and needs, such as generating financial resources, intensive participation in networking, and pressure for scientific productivity, especially concerning the publication of scientific results in high-impact journals [
16]. In addition, scientific productivity links to institutional accreditations [
17], positions in international rankings, and patent generation [
18]. Scientific productivity evidence results through tangible aspects, but how is this productivity measured?
Measuring scientific output can be done through data analysis, such as the number of publications (bibliometrics) or investment in research and development. Buela-Casal et al. [
19] analyzed data from Spanish public universities using seven indicators (articles published in Journal Citation Reports journals, research sections, research projects, doctoral theses, grants for university teacher training, doctoral programs with Mention of Excellence, and patents). They noted the importance of funding in scientific production and the need to assess management based on the funding received. Vasiljeva et al. [
20] applied the principal-components method to study the structure of productivity indicators of scientific activity in Russian universities, revealing the characteristics of the emotional exhaustion factor on the scientific productivity of university professors. In Peru, Vicente et al. [
21] studied the influence of the program promoting the research culture on the strengthening of teaching competencies through the hypothetical deductive method, concluding that there was a favorable influence of the program promoting the research culture. It strengthened the research skills studied in teachers; this was manifested in the increase in their academic and scientific productivity. Rodríguez-García et al. [
22] analyzed the scientific production with the most significant impact on digital competency in teacher training in higher education through literature analysis. The results provided an overview of research on digital competency in future teachers, where the most scientific production occurred in recent years (2014–2017). Data analysis is relevant to measure productivity, but what happens when the teaching and research roles intersect?
1.3. Interrelation of Teaching and Research in University Professors
The implementation of quality systems (accreditation and evaluation and/or promotion agencies or systems, such as the SNI in Mexico or ANECA in Spain) for university professors has led to an imbalance in the tasks to be carried out, with greater importance and overvaluation being given to research and knowledge transfer than to teaching and management. This trend is fostering an increase in the complexity of academic work and its quality [
23,
24] and leads to the creation of a professional profile and identity based more on research than on teaching and, consequently, on the publications derived from it, with a less significant impact on the quality of teaching itself [
25,
26,
27,
28,
29]. Thus, everything points to the growing dichotomy between the tasks of university teaching professors.
In terms of the versatility of university teaching staff’s functions, Gómez [
30] pointed out that teaching and research can be conditioned by a series of factors such as time, dedication, commitment, interpersonal relationships, pedagogical training, research experience and the personality of the teacher, which in turn can be represented as “incompatible.” Similarly, Miranda et al. [
31] and Matthews & Kotzee [
32] questioned the possible coexistence between research and university teaching. These authors point out that the political university system has fostered a profile of more productive professionals through publications, which requires them to be more effective in teaching. Furthermore, they recognize that teaching and research are connected through learning, making research visible as a pillar and support for teaching, making it particular and unique. Similarly, research by Davis & Graham [
33] and Lapoule & Lynch [
34] shows how research brings practical and potential insights into teaching activities and practices.
1.4. Studies of the Impact of University Professors’ Time
A crucial element in the teaching profession is the quality of life in the work environment, as it determines its well-being, quality, and productivity. Time management (working hours, demands, deadlines, and task execution, among others) is a fundamental factor in the contextualization of work activity [
35]. Studies such as those by Castilla-Gutiérrez et al. [
36], provide teachers’ perceptions of their degree of satisfaction, tenure, commitment, productivity, and stress in their work context and work climate. The demands of university tasks, competitiveness, limited rest time (manifested in periods of insomnia and even anxiety), depersonalization, little recognition or prestige, low salary, resources for research development, and sustained overload over time are impact factors and determinants for chronic work-related stress, known as Burnout. Vega et al. [
37] and Méndez et al. [
38], pointed out that educators must consider job satisfaction and control variables to reduce stress. The results of the research by Castilla-Gutiérrez et al. [
36] show that excessive workload and increased responsibilities are conditioning factors that impact the lack of time to reconcile personal and family life and, consequently, balance the different facets of university teaching.
Another primary element impacting university professors’ time is labor productivity. Agustina et al. [
39] pointed out that the ability to perform assigned tasks results in the measurement of productivity, the results achieved, the “overcoming” of work (understood as competitiveness and improvement of the results achieved), self-development development to improve work skills through challenges and expectations, the quality of actions to provide better results and the effectiveness of teaching tasks. Thus, both authors point out that inputs and outputs are essential for productivity and significantly influence employees. Adams et al. [
40] suggested that effective time management is often associated with higher academic performance. Gul et al. [
41] investigated the university faculty’s perceptions of their teaching load related to their time management skills (working hours, satisfaction, assigned responsibility, work content, planning, scheduling, and management tasks, among others). The results showed that faculty had the skills to regularly manage their working hours (research, teaching, and management) and workload, fulfilling their responsibilities and academic demands. However, it also became apparent that the university professor’s time management skills diminished with an increased workload. Thus, time and management in the University is an issue that affects the tasks performed by the lecturer not only in teaching and learning processes but also in research, knowledge transfer, and administrative tasks.
2. Materials and Methods
This research examines the correlation between teaching workload and scientific production outputs of university professors based on the analysis of 785 professors and researchers at a private university in Mexico. Additionally, it aims to study the incidence of gender, undergraduate and graduate teaching load, the level of researcher accreditation (SNI) of the faculty, and the number of under and graduate theses directed, among other issues, on scientific productivity as measured by the professors’ number of annual publications.
The starting hypothesis (H1) is that the higher the number of groups taught, the lower the scientific productivity of the professor. The second hypothesis (H2) is that professors with an exclusive research contract (e.g., postdoctoral fellows) will have a higher scientific output than those with an exclusive teaching contract or administrative positions in the institution.
For this research, we requested institutional data and applied statistical and machine-learning techniques to analyze the influence of teaching workload on scientific productivity.
2.1. Data Collection
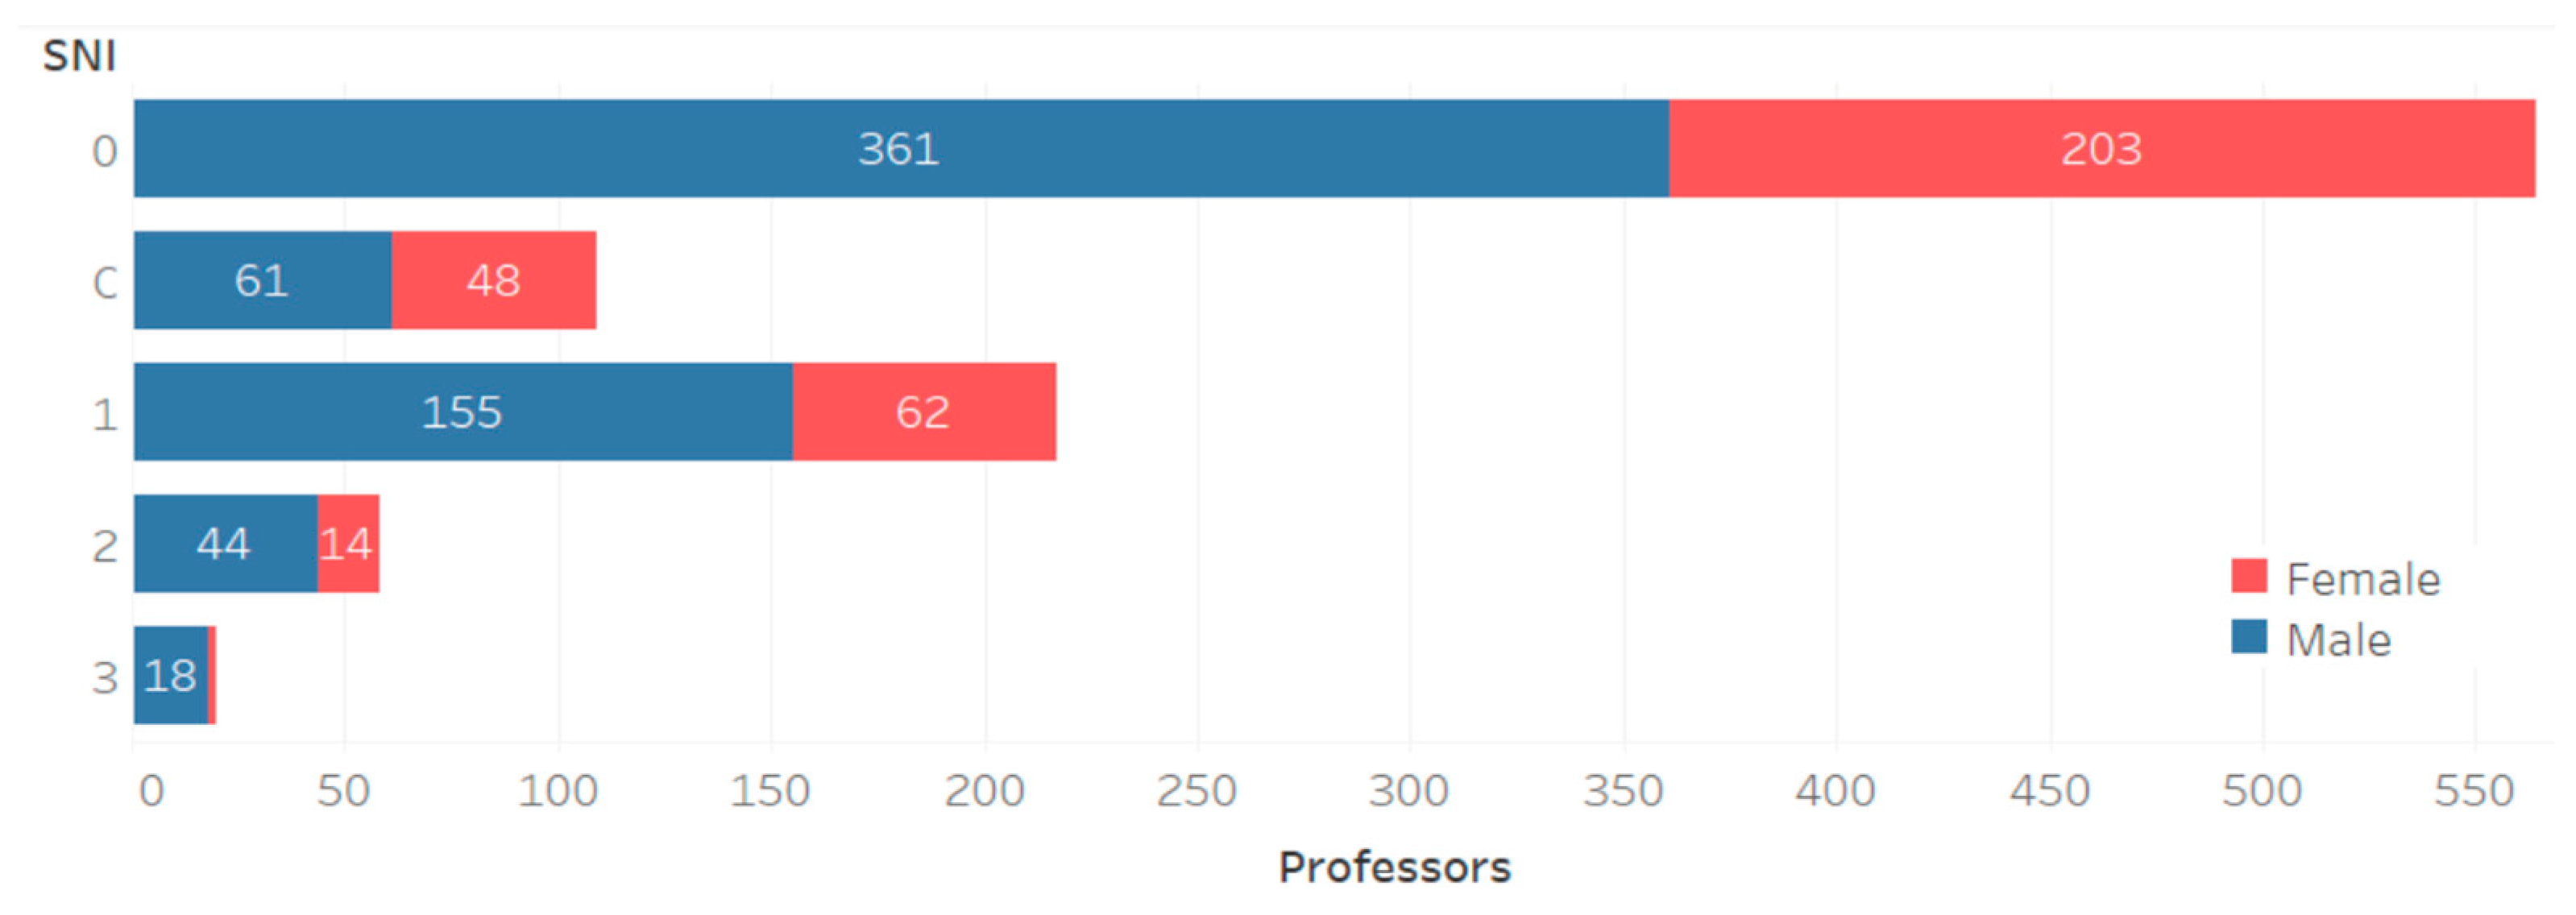
The data used for this research was requested from the Data Hub of the Institute for the Future of Education at Tecnologico de Monterrey. The data set contains information on 785 professors who taught at least one course at Tecnologico de Monterrey (Mexico) between 2014 and 2018, and published at least one Scopus-indexed paper between 2015 and 2019 or were part of the Mexican Researcher System (SNI by its acronym in Spanish), during the period 2014–2018. 51% of these 785 professors were classified by SNI as researchers (at some proficiency level), during at least one year between 2014 and 2018.
Figure 1 shows the distribution of the professors analyzed broken down by gender and researcher proficiency level (SNI) that ranges from 0 (not ascribed to SNI) to 3 (maximum proficiency level).
To analyze the effect of teaching workload on scientific productivity, we accounted for the groups taught by a professor every year during the period 2014–2018 and compared it with his/her scientific production in the following year, i.e., versus the period 2015–2019. The dataset contains the variables shown in
Table 1.
Note that variables represent not only the teaching workload in year Y but also some contextual conditions that could influence the scientific productivity of the professor in the next year (Y + 1). Among the contextual variables is the research proficiency level of the professor (SNI), which comes accompanied by an economic incentive when it is greater than 0.
Additionally, the school is used as a proxy to capture the differences in productivity levels between disciplines. Acronyms represent schools: EIC (Engineering and Sciences), EMCS (Medicine), EGADE (Business), ECSG (Social Sciences and Government), EHE (Humanities and Education), EAAD (Art, Architecture, and Design), and OTHER (not ascribed to a school).
2.2. Data Analysis
We analyzed the collected data using both statistical and regression methods. First, we explored the data to analyze the distribution of variables, validate their normal distribution, and observe the range of values they hold. We also detected and removed outliers that could affect the linear regression.
Next, we inspected correlations between variables to avoid multicollinearity issues in the regression analysis. A correlation matrix and a correlogram were generated for this purpose. Visualizations and simple linear regression were used to explain interactions between variables.
Then we trained several Multiple Linear Regression models to determine which variables significantly affected the professor’s scientific productivity the following year. We evaluated all the variables and kept only those with significance above 95%. The adjusted R2 was used as an indicator of the model’s quality; the closer to 1, the better. We discarded models having multicollinearity, indicated by the parameter condition number with values higher than 2000.
A Multiple Linear Regression model is represented by the equation:
where
y represents the dependent variable,
the independent variables (predictors); the coefficients
(the intercept) and
are learned using an Ordinary Least Squares (OLS) method. The error term
represents the difference between the predicted value (given by the equation) and the actual value, usually called residual.
This linear equation model can predict the number of papers a professor will produce the following year (y). The coefficients of independent variables (X) learned by the regression model indicate the (positive or negative) influence of Xi on the scientific productivity of the professor. The lack of Xi’s significance in the regression model is considered proof of the null influence of the variable in the dependent variable (scientific productivity).
3. Results
This section starts by showing the results of data exploration. Then we use charts to illustrate the conclusions of the statistical analysis. Finally, we present the best regression model generated and discuss the obtained linear model.
3.1. Data Exploration
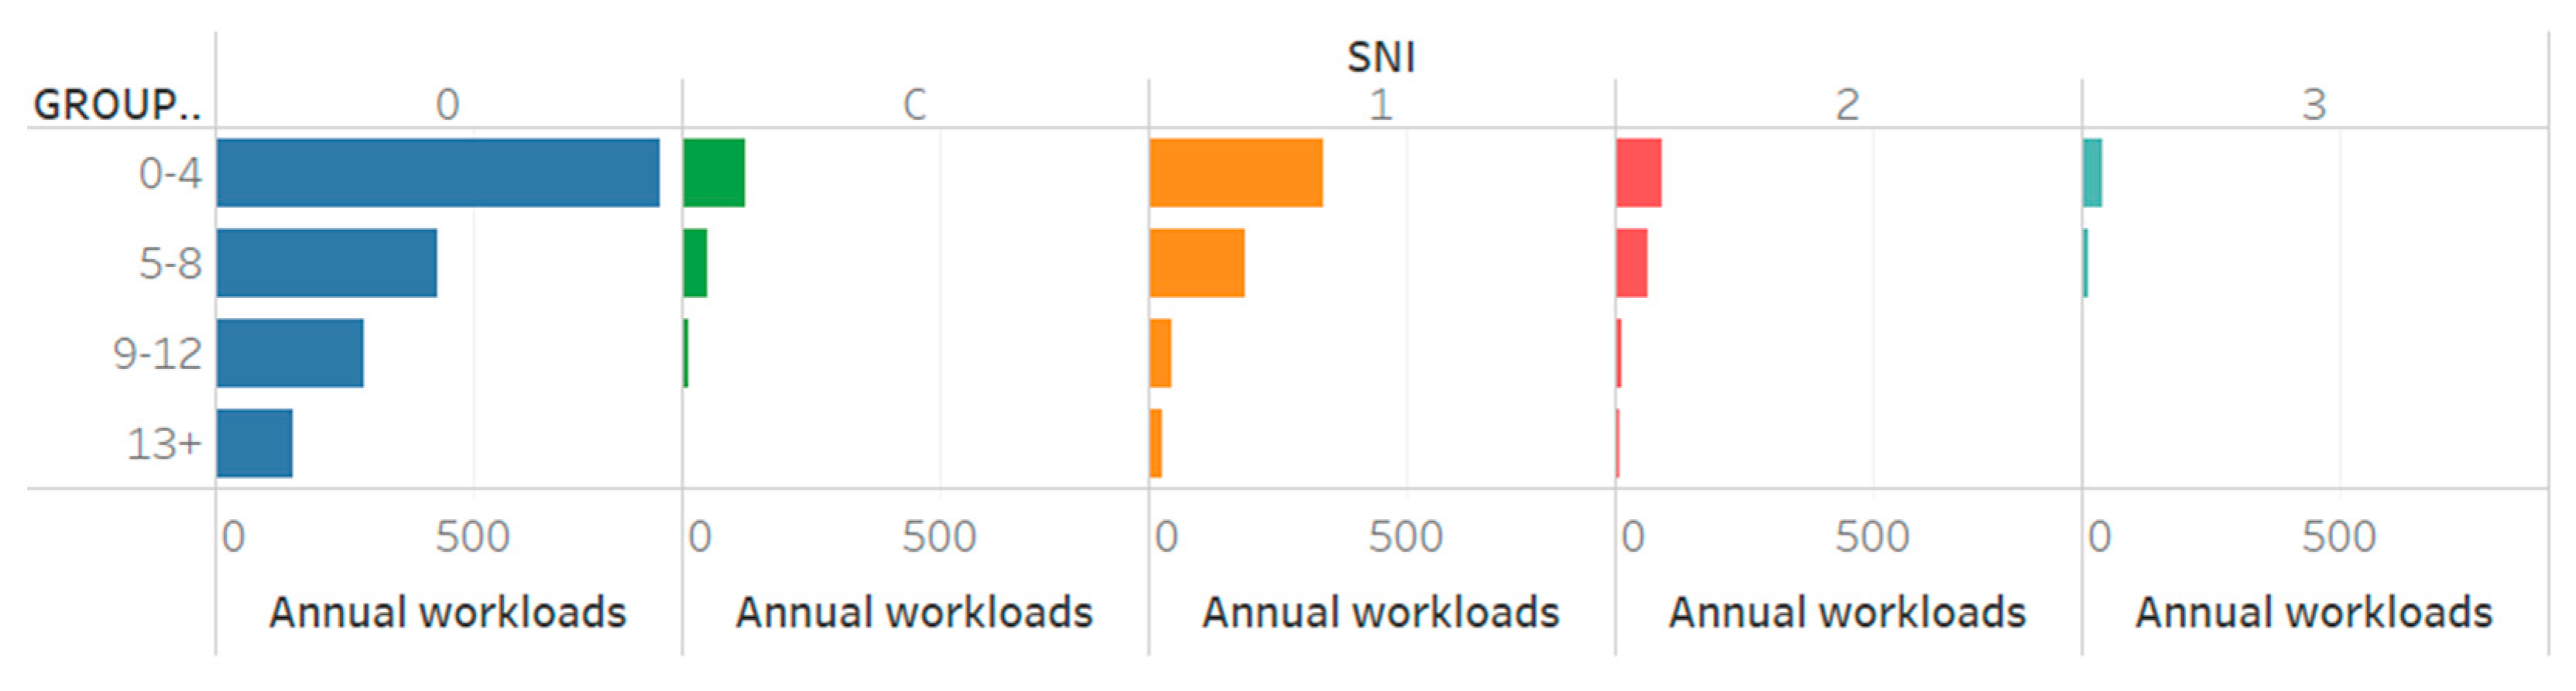
We defined four ranges for groups taught in a year to determine a low, medium, high, and extraordinary teaching workload. We considered less than 5 groups taught in a year as low, 5 and 8 as medium, 9 and 12 as high, and 13 or more as an extraordinary workload. Note that this distribution is independent of whether the professor has a full-time or part-time contract for teaching. Some professors have administrative positions and teach part-time; likewise, some professors are hired just for research positions (e.g., postdocs).
Figure 2 shows the distribution of professors’ annual workloads (i.e., the number of groups taught in a given year) according to the Mexican Researcher System (SNI) accreditation. Note that
Figure 2 shows workloads for the 785 professors over 4 years (2014–2018). The SNI accredited 51% of professors in this sample at some level during 2014–2018. Note that researchers can be promoted or demoted at SNI over time; hence we used the SNI level of the professor valid during the year the workload was considered.
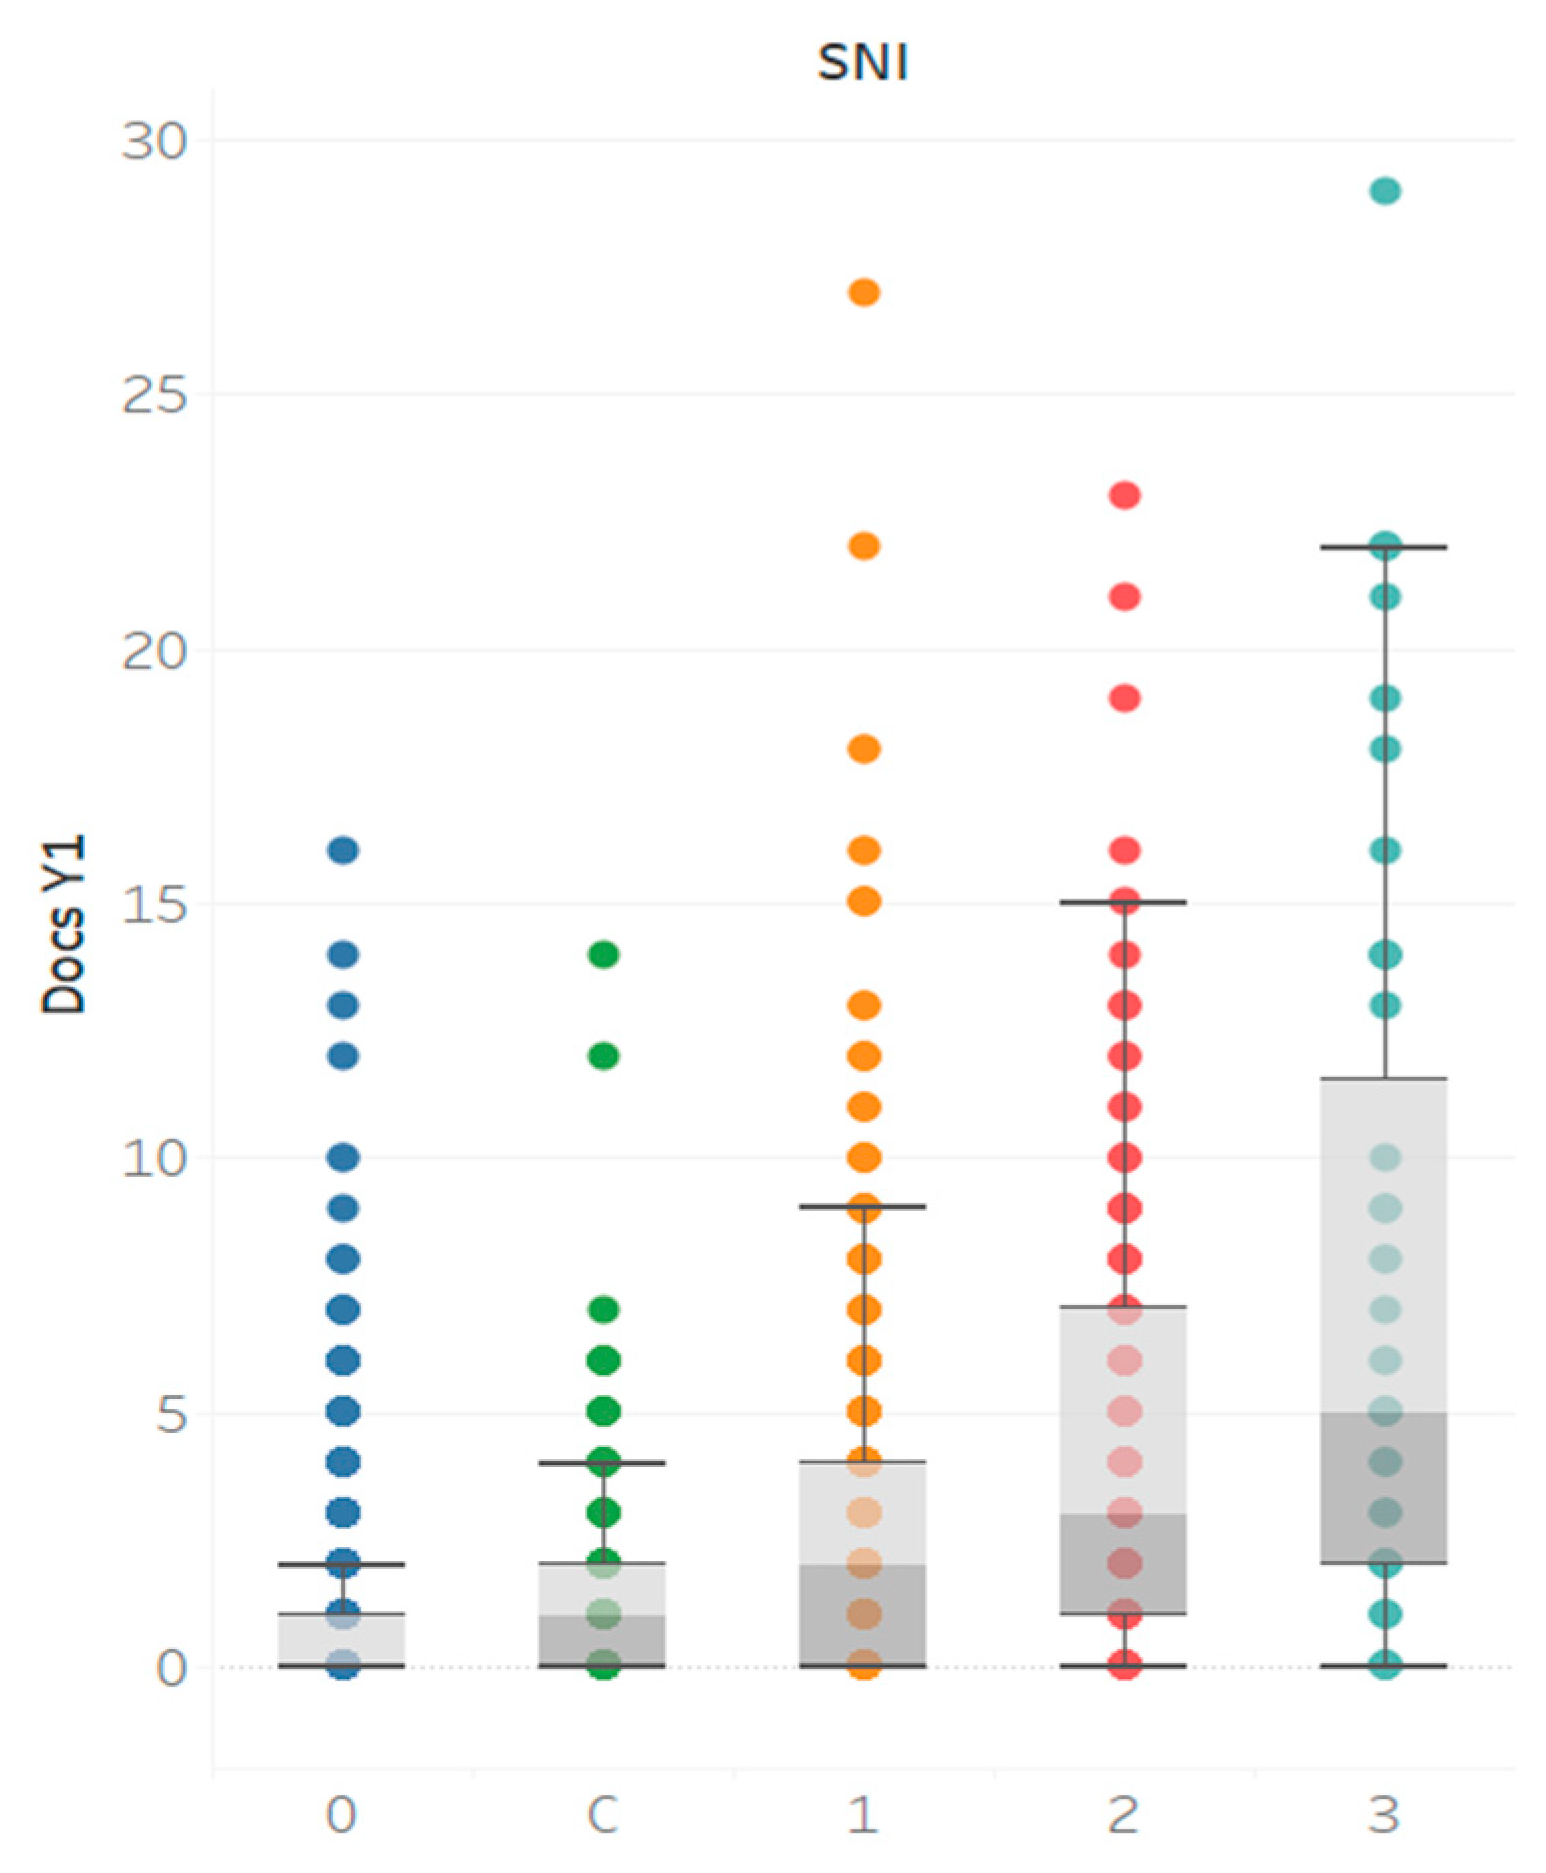
The researcher proficiency level is also associated with differentiated scientific productivity levels, as seen in
Figure 3. The median of the scientific production of a professor not accredited by the SNI is 0 papers per year, whereas the median for a Candidate level (C) is 1. Professors accredited at Level 1 have a median of 2, whereas those at Level 2 have a median of 3, and those certified at the maximum level (Level 3) have a median of 5 papers per year. The boxplots in
Figure 3 also show a growing dispersion in the higher proficiency levels and exhibit outliers beyond the upper whisker. Note that there are outliers in the 5 proficiency levels, including the one for non-SNI professors (level 0).
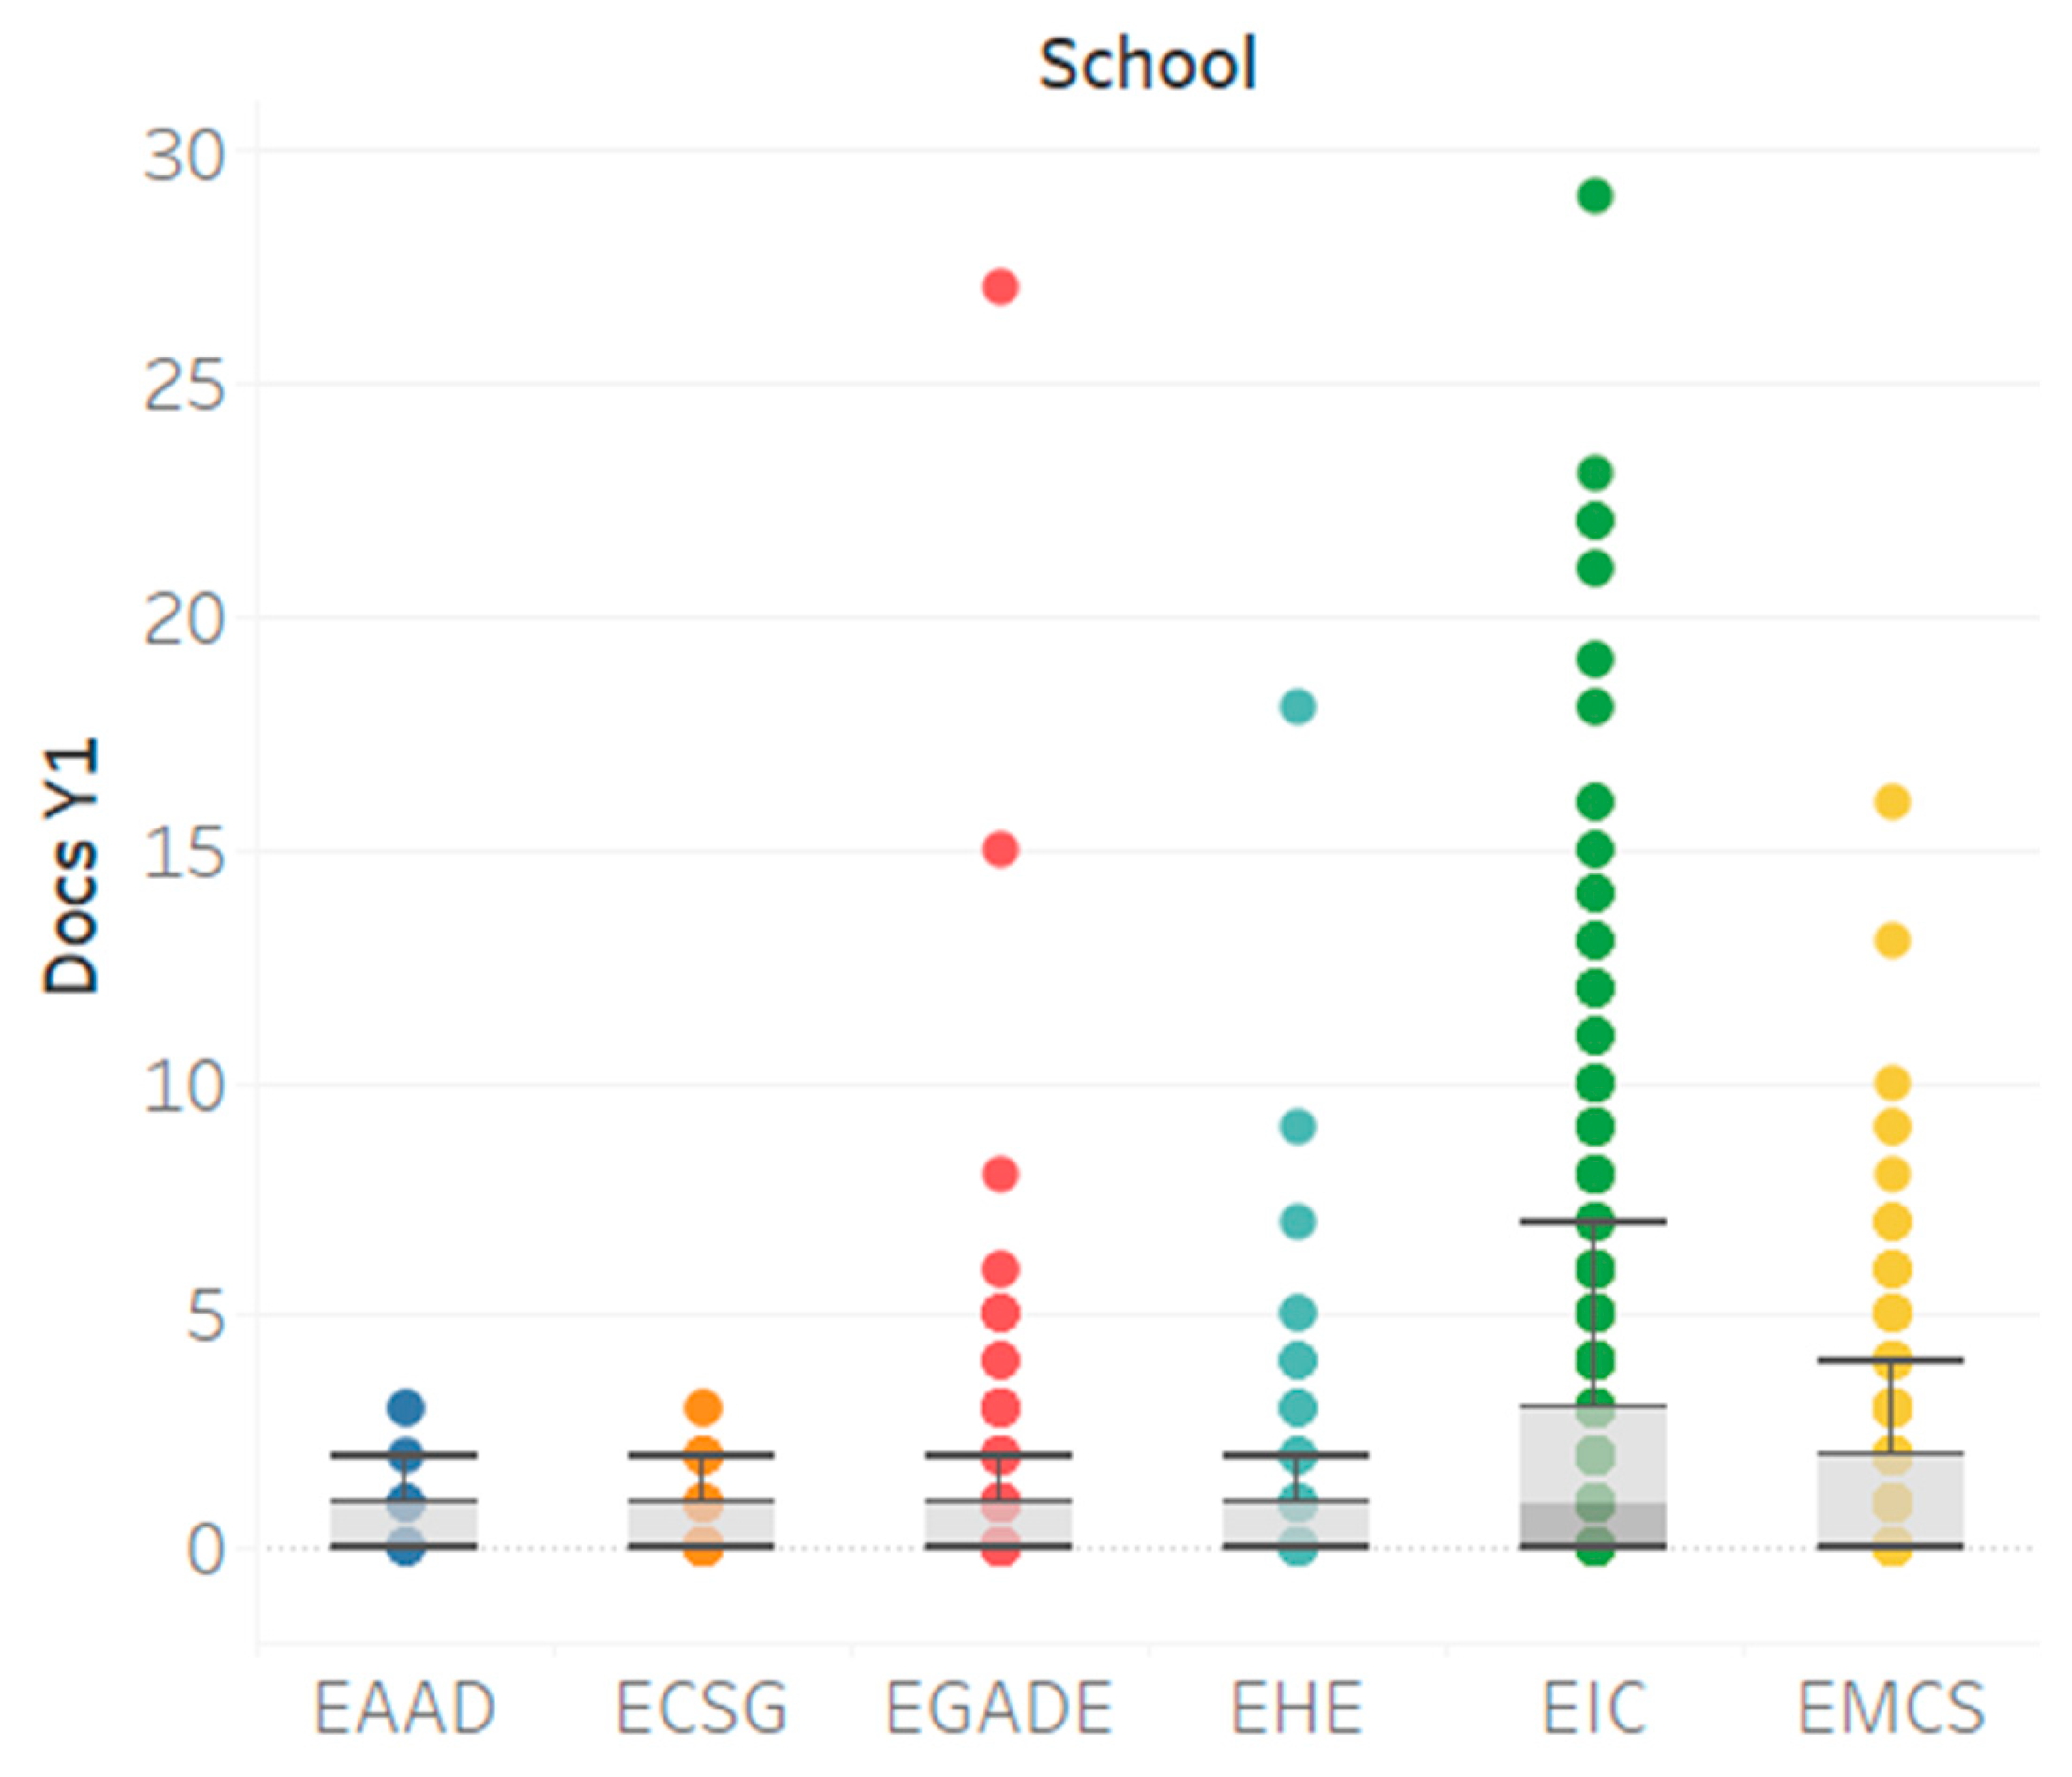
Differences between scientific productivity across disciplines were also captured by the professor’s school (department), as shown in
Figure 4. When all the professors were grouped by school (department), independently of their researcher proficiency level, the median number of papers produced in one year for all schools was 0, except for Engineering and Sciences (EIC), which was 1. Similarly, the upper quartile for most schools was 1, whereas it was 3 for EIC and 2 for Medicine (EMCS).
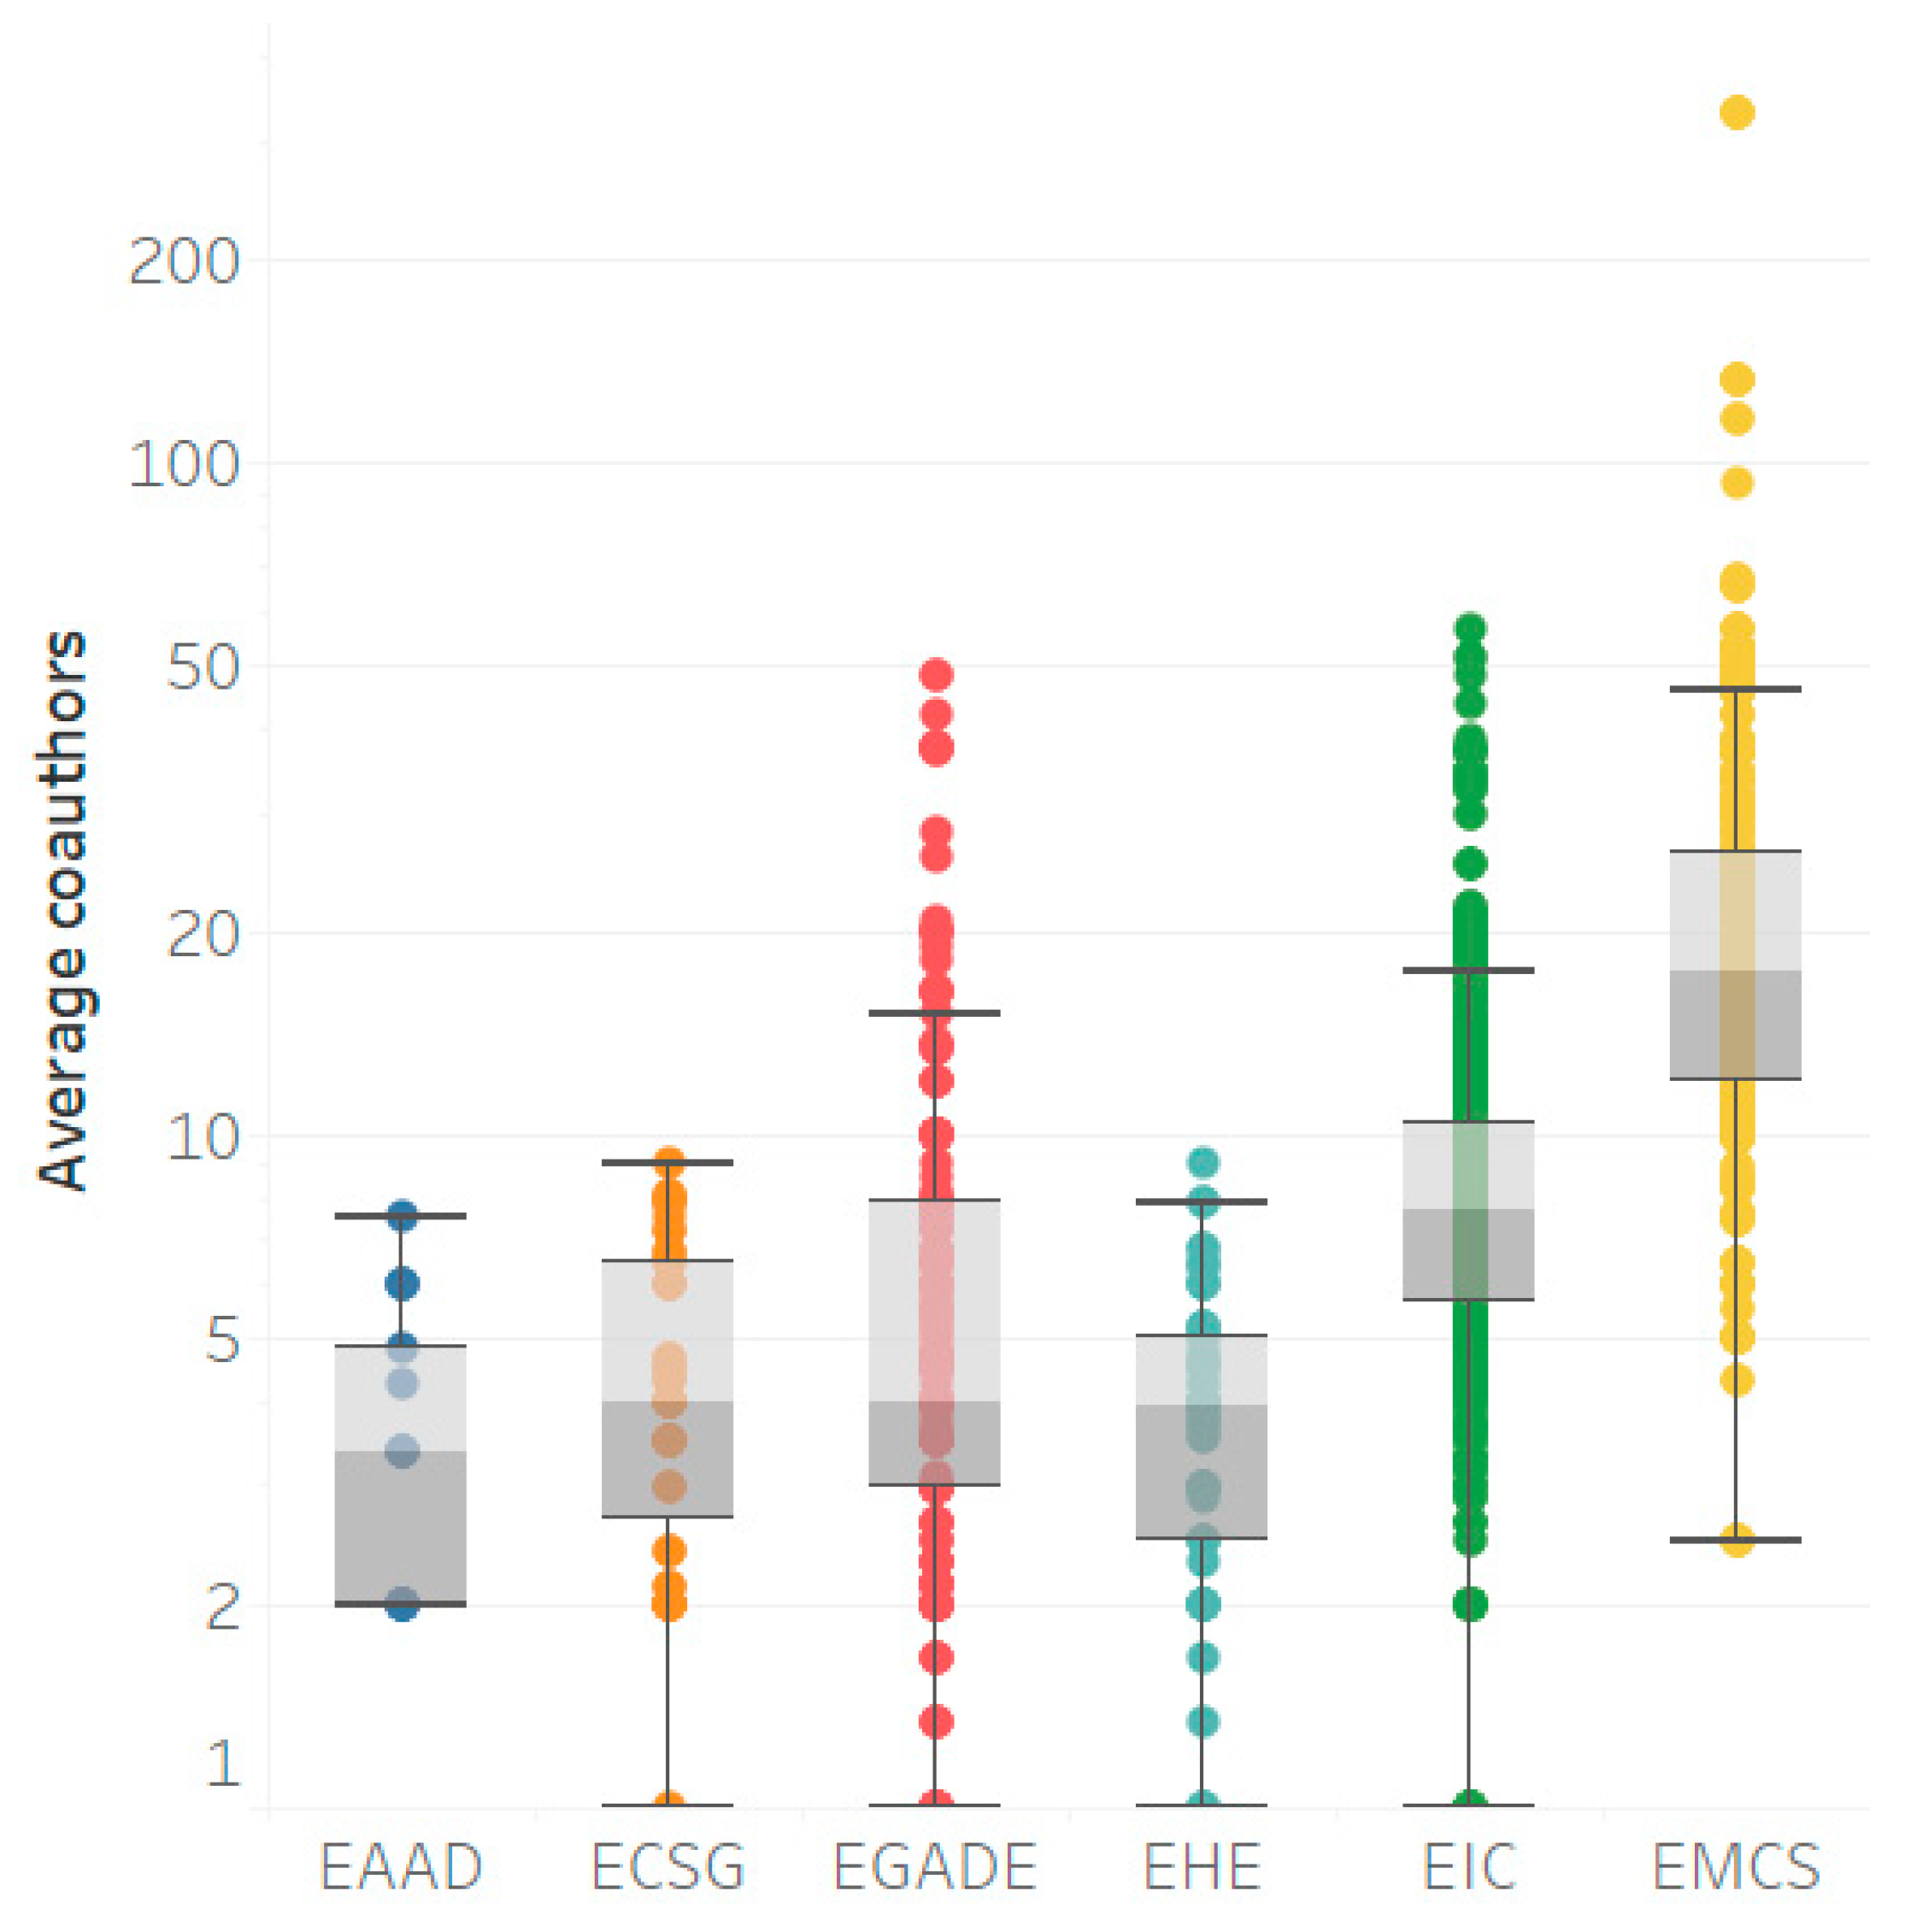
Differences across disciplines are also reflected in publication patterns such as coauthorship.
Figure 5 shows these differences in terms of the average number of coauthors for the publications made by the professors in the sample during the period 2015–2018, broken down by school (department). For the first four schools (EADD, ECSG, EGADE, and EHE) the medians per school range between 2.5 and 3.2, whereas it is 5.0 for Engineering and Sciences (EIC) and 7.0 for Medicine (EMCS).
3.2. Statistical Analysis
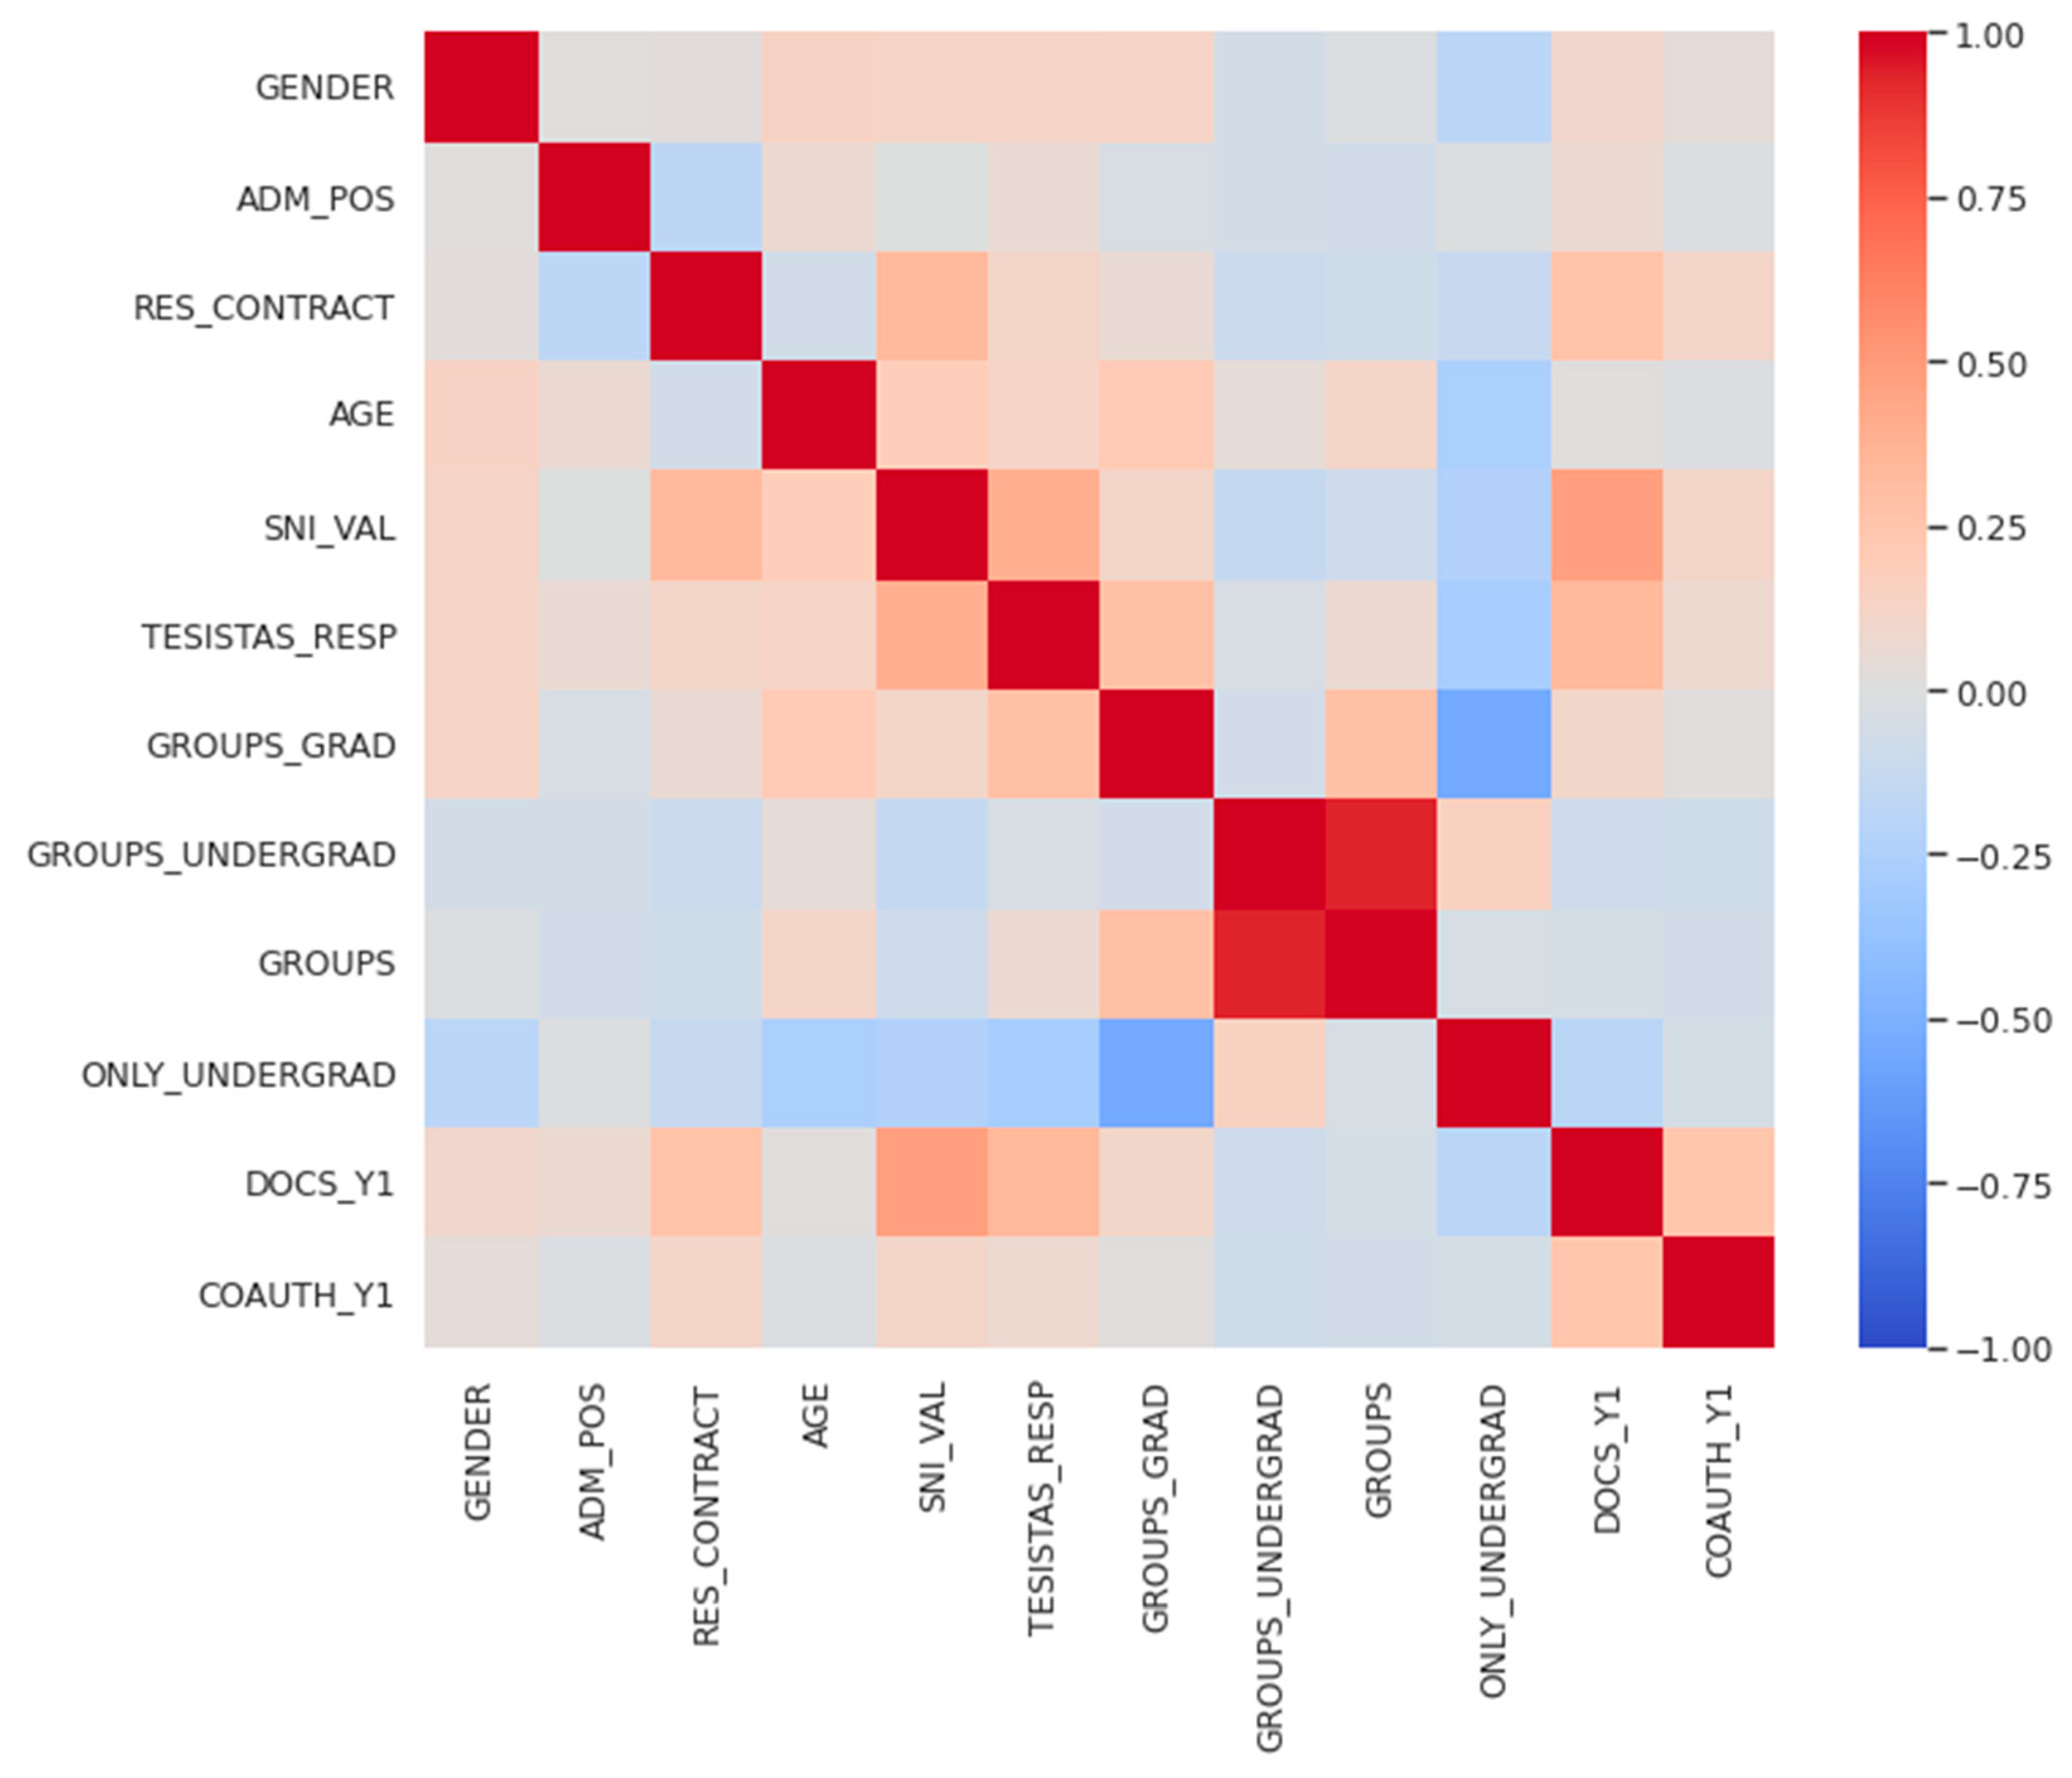
Next, we evaluated the correlation between variables to prevent high correlations that might induce multicollinearity issues in the regression analysis.
Figure 6 shows the correlation matrix of numeric variables in the dataset.
We can only observe a high (inverse) correlation between the number of graduate-level groups taught (GROUPS_GRAD) and the flag that indicates when a professor taught only on the undergraduate level (ONLY_UNDERGRAD). The rest of the correlations are moderated. On the other hand, the variable with the highest correlation with the dependent variable (DOCS_Y1) is the researcher proficiency level (SNI_VAL), followed by the number of thesis students (TESISTAS_RESP) and having a researcher contract (RES_CONTRACT). Teaching only at the undergraduate level (ONLY_UNDERGRAD) is inversely related to scientific productivity. SNI_VAL is also directly related to the number of thesis students and having a researcher contract.
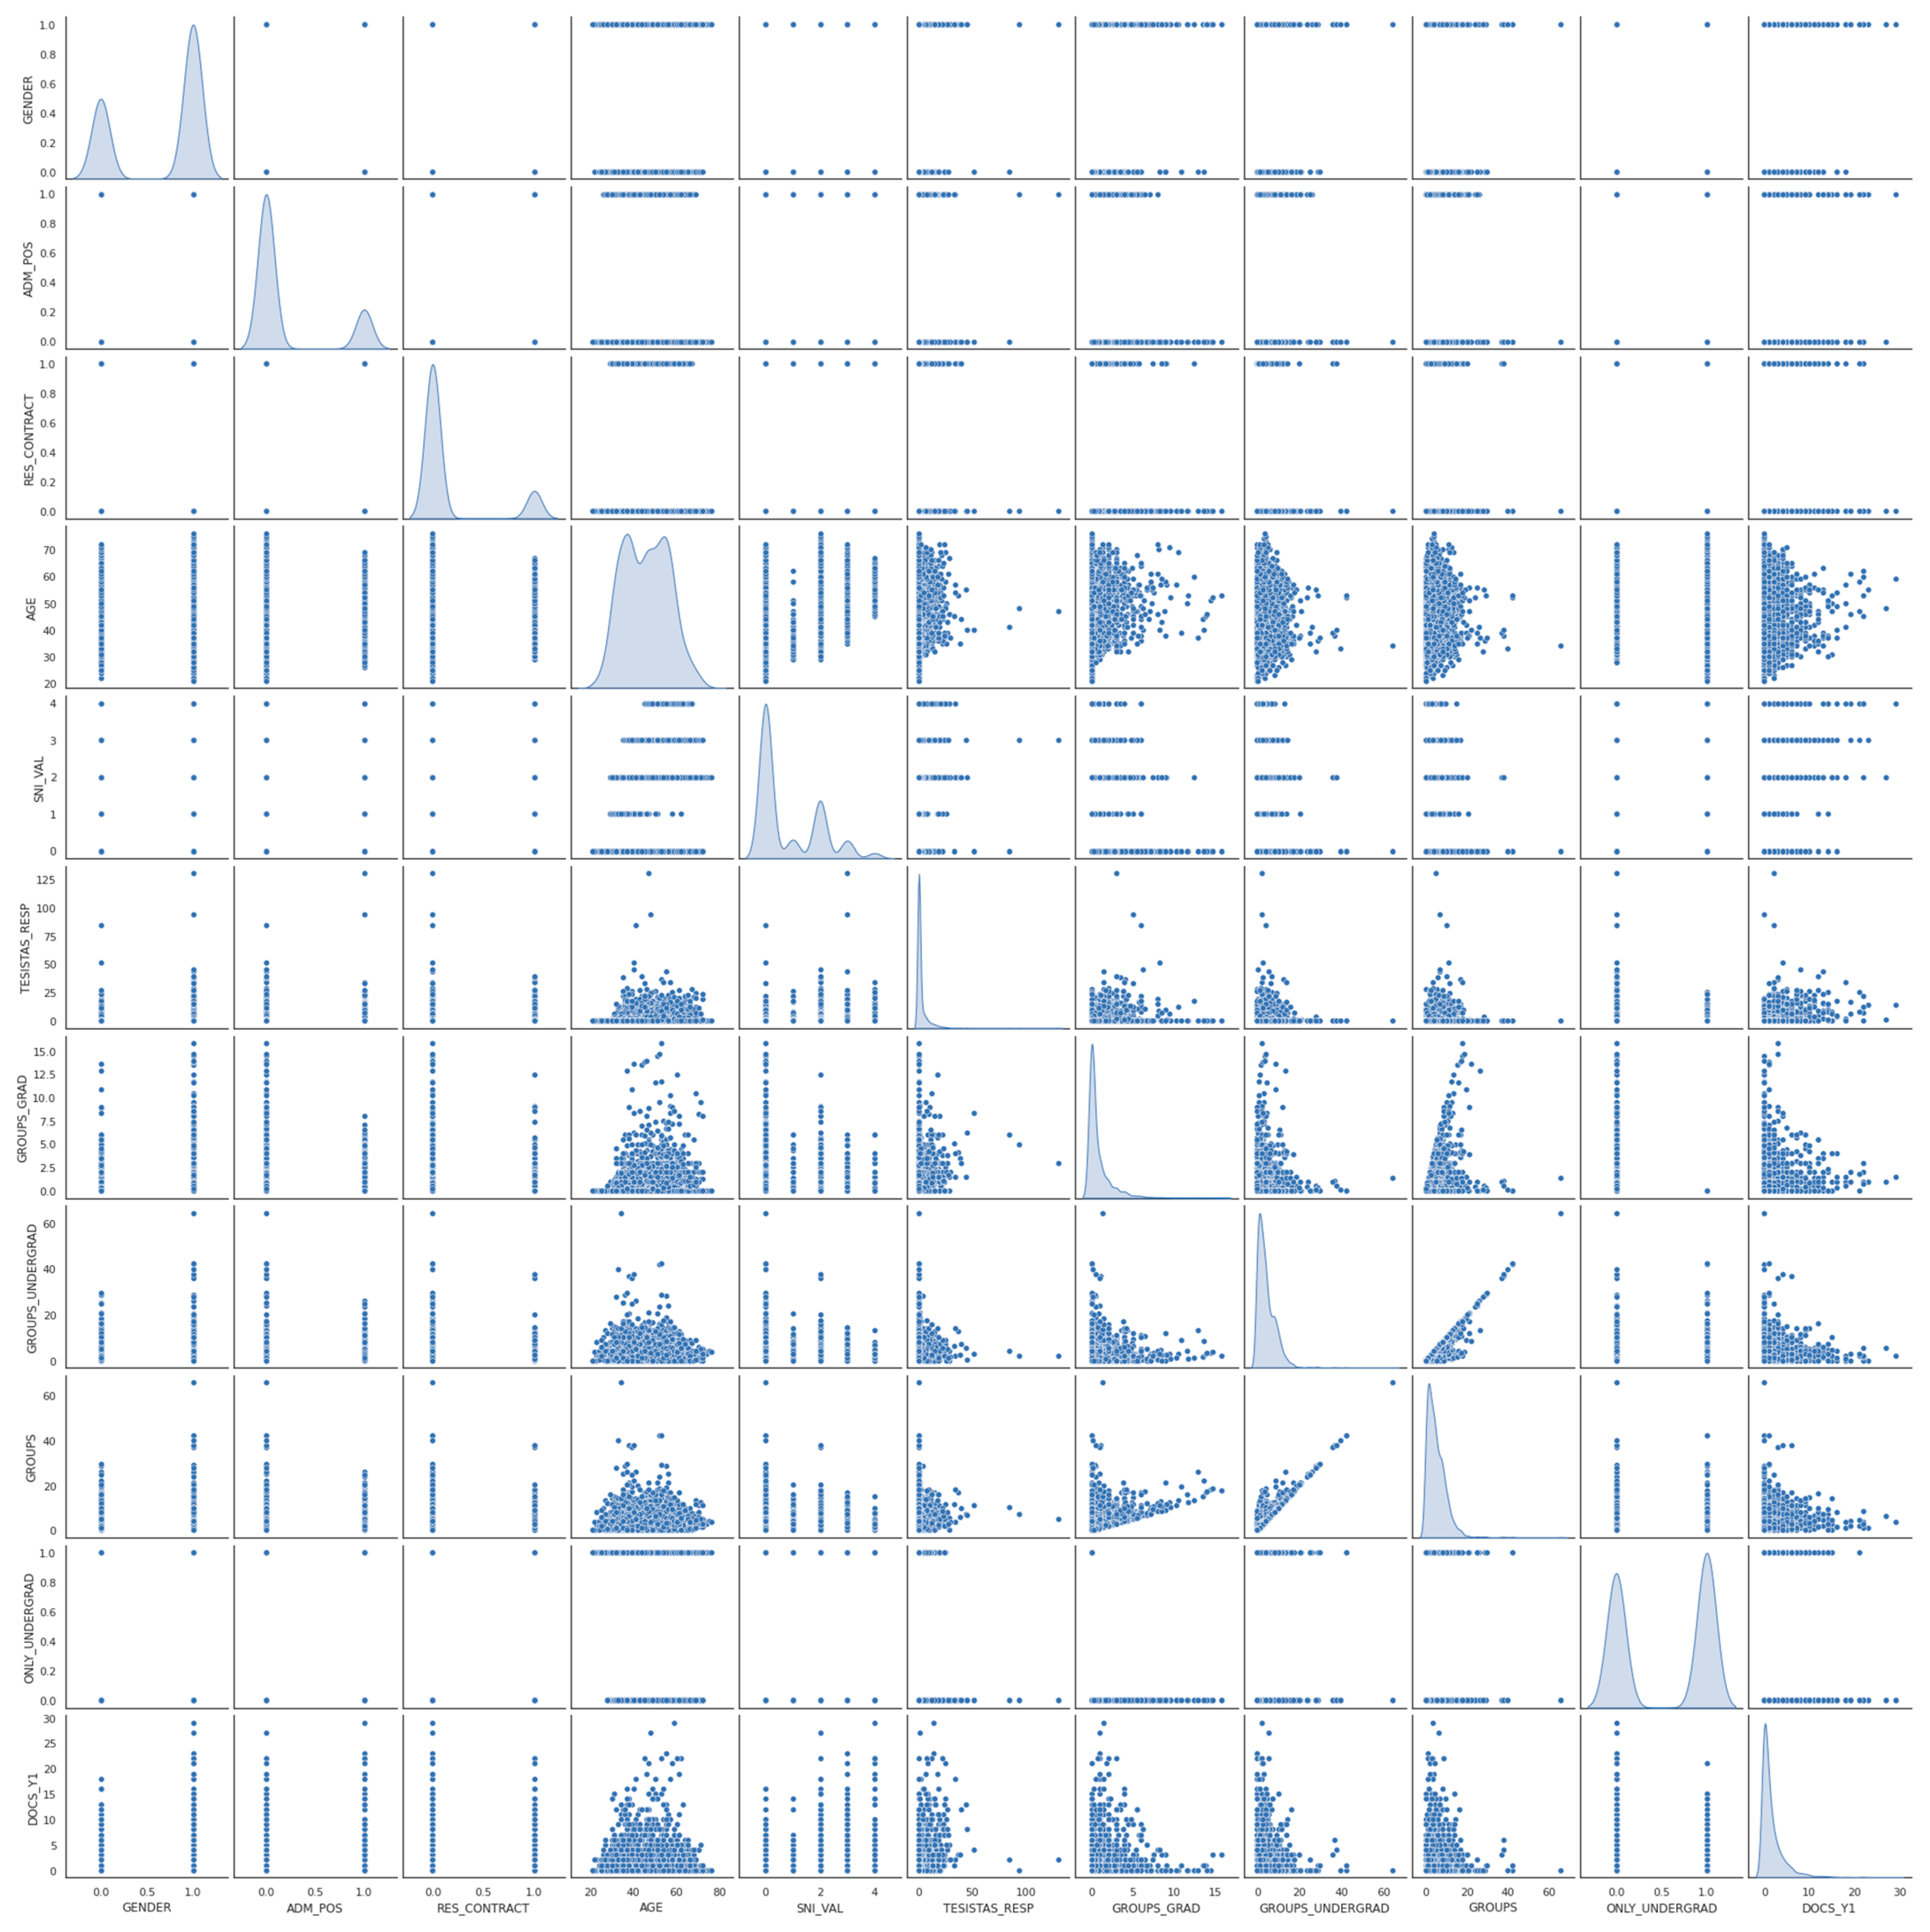
We built a correlogram to observe the correlation pattern between variables (see
Figure 7). The distribution chart for every variable is shown in the diagonal, whereas the cells show a scatter plot between every pair of variables. It can be seen that binary variables (e.g., gender and administrative position) are not highly imbalanced, i.e., there are enough records for the underrepresented class, being “having a researcher contract” as the most critical case. Except for age, all continuous variables have a right-skewed normal distribution. This means there were few records with high values; for instance, few professors published more than 10 papers yearly.
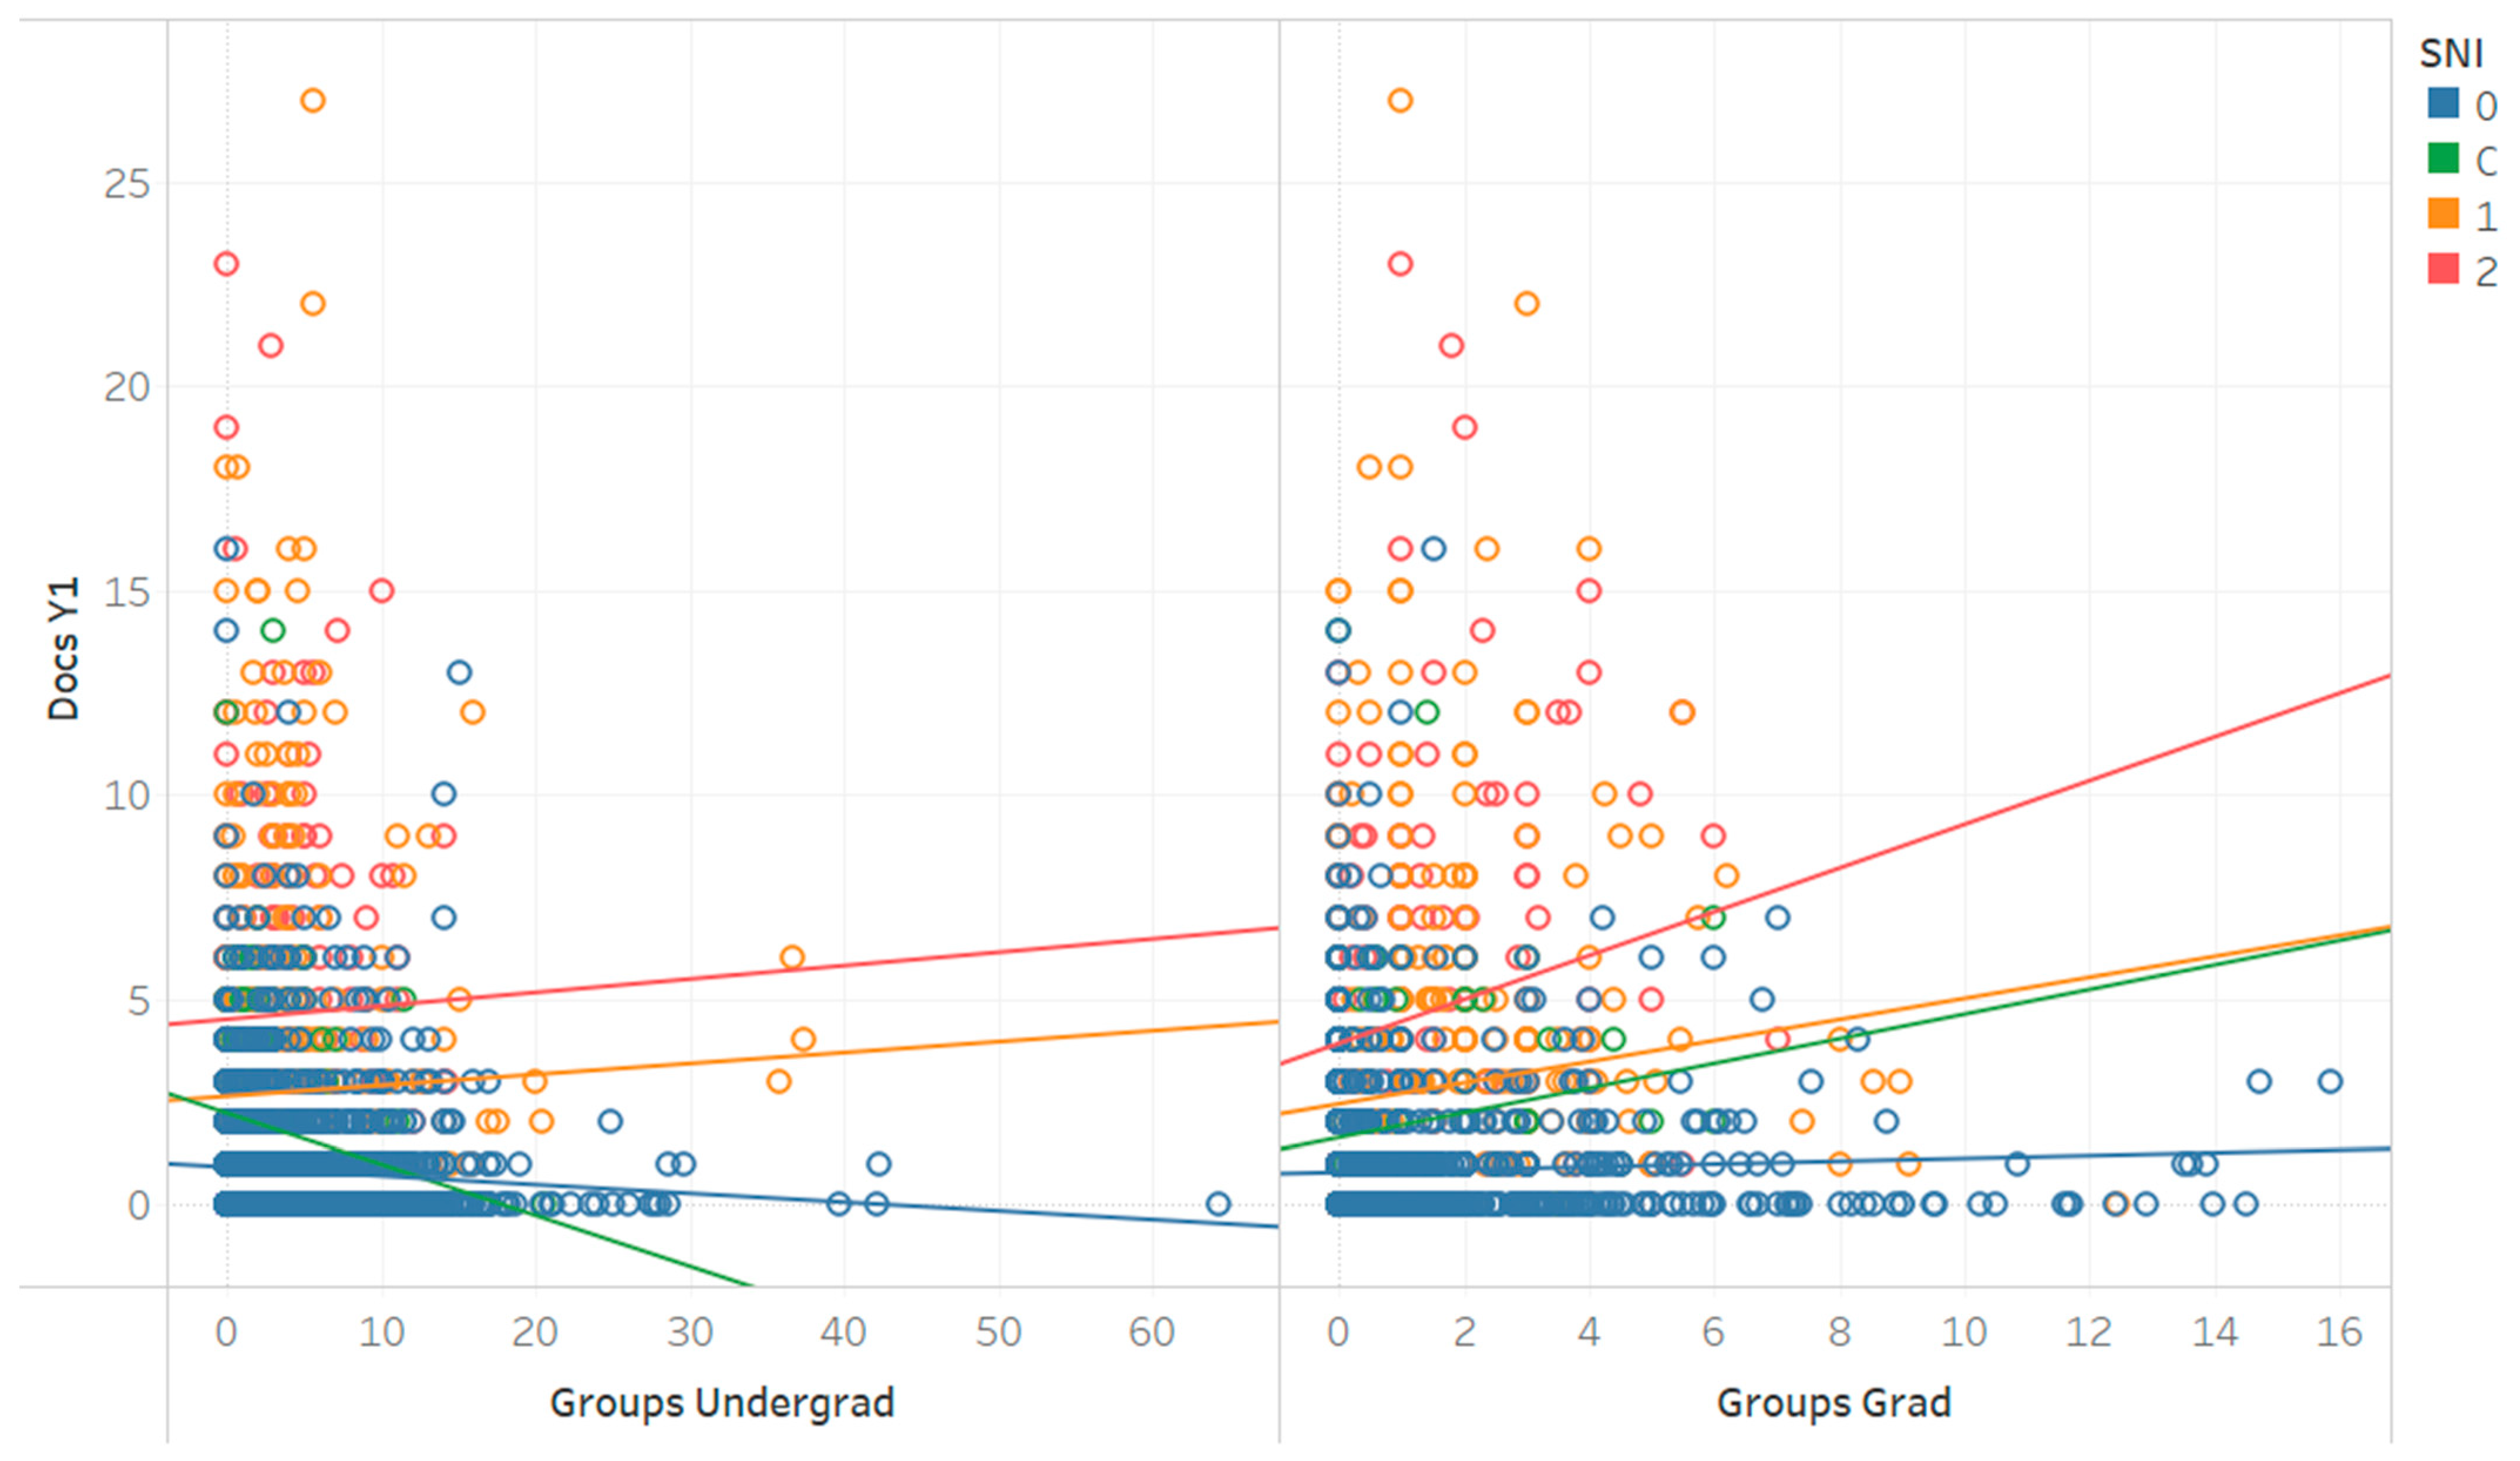
Next, we evaluated how the number of groups taught by professors at the undergraduate and graduate levels affected scientific productivity.
Figure 8 shows a scatter plot contrasting the number of groups taught by a professor at the undergraduate (left) and graduate (right) levels with the number of papers published the following year. Colors are used to distinguish professors’ different researcher proficiency levels, whereas the corresponding trend lines illustrate how the academic workload positively or negatively impacts scientific production. Except for levels 2 and 3 at the undergraduate level, the rest of the trend lines are significant, i.e., supported by a simple linear regression with a
p-value < 0.05.
Trends in
Figure 8 show that teaching at the graduate level (right chart) has a positive impact on scientific productivity for professors accredited at some SNI proficiency level (Candidate to Level 2), but it does not affect non-SNI professors (blue line). On the other hand, teaching at the undergraduate level (left chart) negatively affects productivity for both Candidate researchers (green line) and non-SNI professors (blue line). SNI Level 3 researchers are just a few; hence, their trend has no significance.
3.3. Regression Analysis
Finally, we conducted a multiple linear regression analysis to identify whether the combination of academic workload and other contextual factors would explain the scientific productivity of professors. To this end, we use the Python ScikitLearn packages and trained Ordinary Least Squares (OLS) regression models. We trained two models: one for the whole sample and another for SNI professors only.
3.3.1. Regression Model for all Professors
For the first regression model, we obtained the following equation:
where:
y is the scientific production of the following year (DOCS_Y1);
is the number of thesis students advised by the professor (TESISTAS_RESP);
is 1 when the professor holds a researcher position, and it is 0 otherwise (RES_CONTRACT);
is 1 when the professor holds an administrative position, and it is 0 otherwise (ADM_POS);
is the current researcher proficiency level of the professor (SNI_VAL);
is the professor’s age in years (AGE);
is 1 if the professor belongs to the School of Engineering and Sciences, and it is 0 otherwise (EIC);
is 1 if the professor belongs to the School of Medicine, and it is 0 otherwise (EMCS);
is 1 if the professor belongs to the Business School, and it is 0 otherwise (EGADE);
is 1 if the professor taught only to undergraduate students in that year, and it is 0 if they taught at least one (ONLY_UNDERGRAD).
This regression model was trained with 2429 observations and had an adjusted R2 of 0.491, which means it has high explanatory power (almost 50%); other factors explain the other 50% of scientific production. This model did not present multicollinearity issues (the condition number was 248). All the variables in this model were significant at 95% (p-value < 0.05), meanwhile the intercept () was removed as long as it was not significant.
It is worth mentioning that the three variables related to academic workload (GROUPS, GROUPS_UNDERGRAD, and GROUPS_GRAD) as well as gender (GENDER) and the variables representing the other schools were not significant in this regression model.
3.3.2. Regression Model for SNI Professors
For the second regression model, we obtained the following equation:
Note that this time EGADE () was not significant. The rest of the () has the same meaning as in the previous equation. This regression model was trained with 946 observations and had an adjusted R2 of 0.551, a little higher than the previous model. This model did not present multicollinearity issues (the condition number was 175). All the variables in this model were significant at 95% (p-value < 0.05); meanwhile, the intercept () was removed as long as it was not significant.
Once again, the three variables related to academic workload (GROUPS, GROUPS_UNDERGRAD, and GROUPS_GRAD) as well as gender (GENDER) and the variables representing the other schools were not significant in this regression model.
3.3.3. Regression Model for Non-SNI Professors
For the third regression model, we obtained the following equation:
For non-SNI professors, the variables EGADE () y UNDERGRAND_ONLY () were not significant. SNI_VAL was removed as long as it was 0 in all the records. This regression model was trained with 1483 observations and had an adjusted R2 of 0.322, slightly higher than the previous model. This model did not present multicollinearity issues (the condition number was 223). All the variables in this model were significant at 95% (p-value < 0.05), meanwhile the intercept () was removed as long as it was not significant.
Again, the three variables related to academic workload (GROUPS, GROUPS_UNDERGRAD, and GROUPS_GRAD) and gender (GENDER) and the variables representing the other schools were not significant in this regression model.
3.3.4. Analysis of the Regression Models
Table 2 compares the coefficients obtained in the three regression models. In the first two regression models, the professor’s age and having taught only at the undergraduate level negatively impacted scientific productivity. Nevertheless, the impact was more negative for SNI professors: AGE’s coefficient passed from −0.015 to −0.058, and UNDERGRAD_ONLY’s coefficient doubled (from −0.258 to −0.544). This could be interpreted as when SNI professors teach only at the undergraduate level, they produce half a paper less. In the non-SNI professors model, AGE had a small positive effect (0.003); meanwhile, UNDERGRAD_ONLY became insignificant.
The rest of the factors contributed positively to the scientific production of the professor in the three models or lost significance in the last two models. The current researcher proficiency level (SNI) is the factor that most contributes to the professor’s scientific production, being 1.0 for all professors and 1.829 for SNI professors. This means that, on average, an SNI Candidate produced 1.829 papers in a year, while an SNI Level 3 produced 7.316 (4 × 1.829) papers.
Another factor present in the three regression models is the number of dissertations supervised by the professor (TESISTAS_RESP). Its corresponding coefficient is 0.061 for all professors, it is 0.043 for SNI professors and it is 0.059 for Non-SNI professors. This makes sense as long as dissertations can fuel professors’ scientific productivity.
The second most important factor when we analyzed all the professors is having a researcher position (RES_CONTRACT), followed by having an administrative position (ADM_POS). In contrast, when we analyzed SNI professors only, we observed that the second most important factor was having an administrative position, followed by holding a researcher position, i.e., the order was inverted. In the case of non-SNI professors, RES_CONTRACT was the most important factor for scientific productivity; this can be explained by newly hired (foreign) professors who had not applied to SNI.
Variables representing departments and schools (EIC, EMCS, and EGADE) captured the differences between scientific productivity across disciplines. As can be seen, the most productive school was Engineering and Sciences (EIC), followed by the School of Medicine (EMCS), and then by the Business School (EGADE). The rest of the schools had similar productivity, which is captured by the coefficients of the other factors. EGADE lost significance when we split the sample into SNI and non-SNI professors.
4. Discussion and Conclusions
Universities have changed their functioning and structures due to the demands for international rankings and research policies of each country. This has generated new needs and profiles: generation of financial resources, intensive participation in research networks, and pressure on faculty for scientific productivity, especially concerning publication in high-impact journals, the so-called “publish-or-perish” effect.
Scientific productivity is currently linked to institutional accreditations [
17], positions in international rankings, and patent generation [
18], which function in many cases in Mexico as a measure to encourage faculty to be more productive in research outputs. Thus, it is not surprising that universities encourage the creation of professional profiles based more on research than teaching [
25,
26,
27,
28,
29].
Nevertheless, one of the most frequently asked questions when considering research policies in universities and state institutions is whether the teaching workload is detrimental to the scientific production of university professors. To address this issue, as the main objective, we examined the correlation between the teaching load and the results of the scientific production of 785 professors at a university with 31 campuses in Mexico and 22 extensions in 15 countries.
Contrary to our initial hypothesis (H1), the results showed that the number of groups taught does not significantly influence research productivity. In other words, the teaching load does not impede a good research productivity level. On the other hand, the second hypothesis (H2) was demonstrated since those professors who are accredited by the SNI or have contracts exclusively for research (e.g., postdoctoral fellows) have higher research production than professors with exclusive teaching contracts or administrative positions at the University.
These results align with those of Matthews & Kotzee [
32], who not only value the coexistence between research and teaching in universities but also pointed out that more productive professional profiles are being promoted through publications, which in turn forces them to be more effective in teaching. In other words, university professors currently rely on research as a pillar and support for teaching, as Davis & Graham [
33] and Lapoule & Lynch [
34] have also pointed out.
As a practical implication of this study,
Figure 2 shows how the system used at Tecnologico de Monterrey benefits the most prolific researchers (SNI 3) with fewer teaching hours and fewer groups of classes as a means of extrinsic motivation to improve their research profile quantitatively and qualitatively. Meanwhile, those without scientific production are assigned a higher teaching and administrative load. This follows the prevailing models of the scientific policy of the leading universities in international rankings since there is a duality of exclusive teaching professors (non-tenure track) and lecturer-researchers (tenure-track), which may function as a system of ladders that seeks to increase internal competitiveness.
The findings of this research also show that graduate professors tend to dedicate themselves exclusively to this educational level, either because of their elite professional specialization or because they are research personnel with a high SNI level, which reduces the teaching load at the undergraduate level. Meanwhile, those who only teach at the undergraduate level have the least (or almost no) published research. As shown in
Figure 8, teaching at the undergraduate level harms productivity, both for junior researchers and for professors without SNI. Thus, the data obtained in
Figure 8 make visible this duality between the non-tenure track and tenure track, whose tendency indicates that professors who teach at the postgraduate level have a greater impact on scientific productivity and correlates with teaching staff who accredit their SNI competence (level 2 candidates), as shown in
Table 2, and in accordance with Barra’s [
17] contributions on how scientific productivity is linked to potential institutional accreditation. Of course, it is necessary to relativize scientific production according to the areas of knowledge since, in departments such as Engineering and Science or Medicine, research outputs tend to be greater in quantity than those produced in departments of Humanities or Arts, as shown in
Figure 5, and in accordance with the studies by Pischetola [
6] and Regusa et al. [
1]. This may be due to the difference in the time it takes to conduct research in each area of knowledge, so quantitative differences of this type will always be evident.
The aim of this research was to examine the correlation between teaching workload and the scientific production outputs of university professors. It is clear that the duality of functions and the significant increase in the workload and responsibility of university professors (research, teaching, and administrative management), together with competitiveness, the work climate, the short time off, and, in the case of Mexico, the low recognition and low salaries, could be generating a burnout effect or chronic work stress [
36,
37]. The findings obtained from the variables (gender, school, groups, levels…) in
Table 1 represent not only the teaching workload in the year but also how some contextual conditions could influence the teacher’s scientific productivity in the following year. Results that coincide with those presented by Flores [
11] and Arista & Abbas [
10] on the recognition of contextual factors such as performance expectantly and personal dimensions. Among the contextual variables is the teacher’s level of research competence (SNI), which is accompanied by a financial incentive when it is higher than 0. Although the research by Gul et al. [
41] confirmed that university faculty generally have skills to manage their working hours and switch between their roles, it was also revealed that in the face of an increase in workload, university faculty’s time-management skills decreased.
In this sense, as future lines of research, it is urgent to evaluate in different developing countries whether this increase in workload generates a psychological and personal dimension imbalance and a healthy environment in university faculty. And whether professors with an exclusive research contract have a higher scientific output than those with an exclusive teaching contract or administrative positions in the institution.
Author Contributions
Conceptualization, M.S.R.-M., S.M.-P. and H.G.C.; methodology, H.G.C.; software, H.G.C.; validation, L.M.R.-R.; formal analysis, H.G.C. and L.M.R.-R.; investigation, M.S.R.-M. and S.M.-P.; resources, H.G.C.; data curation, H.G.C. writing—original draft preparation, L.M.R.-R.; writing—review and editing, M.S.R.-M. and L.M.R.-R.; visualization, H.G.C.; supervision, M.S.R.-M.; project administration, L.M.R.-R.; funding acquisition, M.S.R.-M. All authors have read and agreed to the published version of the manuscript.
Funding
The authors would like to thank the financial support from Tecnologico de Monterrey through the “Challenge-Based Research Funding Program 2022”. Project ID # I004—IFE001—C2-T3—T. The authors would also like to acknowledge the Living Lab & Data Hub of the Institute for the Future of Education, Tecnologico de Monterrey, Mexico, for the data used through the call “Fostering the Analysis of Competency-based Higher Education” used in the production of this work. The authors acknowledge the financial and technical support of Writing Lab, Institute for the Future of Education, Tecnologico de Monterrey, Mexico, in the production of this article.
Data Availability Statement
The data presented in this study are available on request from the corresponding author.
Conflicts of Interest
The authors declare no conflict of interest.
References
- Ragusa, A.; Caggiano, V.; Ramos, R.T.; González-Bernal, J.J.; Gentil-Gutiérrez, A.; Bastos, S.A.M.C.; González-Santos, J.; Santamaría-Peláez, M. High Education and University Teaching and Learning Processes: Soft Skills. Int. J. Environ. Res. Public Health 2022, 19, 10699. [Google Scholar] [CrossRef]
- Williams, E.; Tingle, E.; Morhun, J.; Vos, S.; Murray, K.; Gereluk, D.; Russell-Mayhew, S. “Teacher Burnout Is One of My Greatest Fears”: Interrupting a Narrative on Fire. Can. J. Educ. 2022, 45, 428–453. [Google Scholar] [CrossRef]
- Ball, D.L. Reimagining American Education: Possible Futures: Coming to terms with the power of teaching. Phi Delta Kappan 2022, 103, 51–55. [Google Scholar] [CrossRef]
- Ishii, T. Fluctuations in the professionality and professionalism of the teaching profession in Japan: A perspective against the “learnification” of teacher education. Asia-Pac. J. Teach. Educ. 2022, 50, 453–457. [Google Scholar] [CrossRef]
- Yuen, G. Kindergarten Education Scheme in Hong Kong: Policy measures, rhizomatic connections and early childhood teacher education. Child. Soc. 2021, 35, 259–273. [Google Scholar] [CrossRef]
- Pischetola, M. Teaching Novice Teachers to Enhance Learning in the Hybrid University. Postdigital Sci. Educ. 2022, 4, 70–92. [Google Scholar] [CrossRef]
- Carmi, T.; Tamir, E. Three professional ideals: Where should teacher preparation go next? Eur. J. Teach. Educ. 2022, 45, 173–192. [Google Scholar] [CrossRef]
- Suárez-Brito, P.; Baena-Rojas, J.; López-Caudana, E.; Glasserman-Morales, L. Academic Literacy as a Component of Complex Thinking in Higher Education: A Scoping Review. Eur. J. Contemp. Educ. 2022, 11, 931–945. [Google Scholar] [CrossRef]
- Leite, C.; Sousa-Pereira, F. Conditions for socialization with teaching in Portugal: Analysis of the training model and teacher trainers. [Condições de socialização com a docência em Portugal: Análise do modelo de formação e perfil de formadores]. Rev. Electron. Educ. 2022, 26, 1–24. [Google Scholar] [CrossRef]
- Arista, A.; Abbas, B.S. Using the UTAUT2 model to explain teacher acceptance of work performance assessment system. Int. J. Evaluation Res. Educ. 2022, 11, 2200–2208. [Google Scholar] [CrossRef]
- Flores, M.A. Feeling like a student but thinking like a teacher: A study of the development of professional identity in initial teacher education. J. Educ. Teach. 2020, 46, 145–158. [Google Scholar] [CrossRef]
- Koffeman, A. Vulnerability as an obstacle and as a condition for teacher learning: Perceiving pressure as a desirable difficulty. [Discussiebijdrage Onzekerheid als belemmering en als voorwaarde voor het leren van leraren: Op zoek naar druk als desirable difficulty]. Pedagog. Stud. 2020, 97, 444–452. [Google Scholar]
- Sancho-Gil, J.M.; Hernández-Hernández, F. La profesión docente en la era del exceso de información y la falta de sentido. Rev. Educ. Distancia 2018, 56. [Google Scholar] [CrossRef]
- Sanabria-Z, J.; Alfaro-Ponce, B.; Peña, O.I.G.; Terashima-Marín, H.; Ortiz-Bayliss, J.C. Engagement and Social Impact in Tech-Based Citizen Science Initiatives for Achieving the SDGs: A Systematic Literature Review with a Perspective on Complex Thinking. Sustainability 2022, 14, 10978. [Google Scholar] [CrossRef]
- Enakrire, R.T.; Smuts, H. Efficacy of Knowledge and Skills in Teaching and Learning and Research in Higher Education Institution. In International Conference on Knowledge Management in Organizations; Springer: Cham, Switzerland, 2022; pp. 16–24. [Google Scholar] [CrossRef]
- Castro-Ceacero, D.; Ion, G. Changes in the University Research Approach: Challenges for Academics’ Scientific Productivity. High. Educ. Policy 2019, 32, 681–699. [Google Scholar] [CrossRef]
- Barra, A.M. The importance of scientific productivity in the institutional accreditation of Chilean universities. [La importancia de la productividad científica en la acreditación institucional de universidades chilenas]. Form. Univ. 2019, 12, 101–110. [Google Scholar] [CrossRef]
- Yang, X.; You, Y. How the World-Class University Project Affects Scientific Productivity? Evidence from a Survey of Faculty Members in China. High. Educ. Policy 2018, 31, 583–605. [Google Scholar] [CrossRef]
- Buela-Casal, G.; Bermúdez, M.P.; Sierra, J.C.; Quevedo-Blasco, R.; Castro, A. Ranking 2008 of research productivity in Spanish public universities. [Ranking de 2008 en productividad en investigación de las universidades públicas españolas]. Psicothema 2009, 21, 304–312. [Google Scholar]
- Vasiljeva, M.; Ponkratov, V.; Volkova, T.; Khairova, S.; Nikitina, N.; Dudnik, O.; Alimova, M.; Kuznetsov, N.; Elyakova, I. The Development of Scientific Activity in Russian Universities. J. Open Innov. Technol. Mark. Complex. 2020, 6, 110. [Google Scholar] [CrossRef]
- Vicente, J.S.Y.; Tomás, M.R.V.; Acha, D.M.H.; Castillo, F.F.L. Research culture and investigative skills of university teachers in southern lima. [Cultura de investigación y competencias investigativas de docentes universitarios del sur de Lima]. Rev. Venez. Gerenc. 2020, 25, 1159–1179. [Google Scholar] [CrossRef]
- Rodríguez-García, A.M.; Torres, J.M.T.; Rodríguez, J.S. Impact of scientific productivity on digital competence of future teachers: Bibliometric approach on Scopus and Web of Science. [Impacto de la productividad científica sobre competencia digital de los futuros docentes: Aproximación bibliométrica en Scopus y Web of Science]. Rev. Complut. Educ. 2019, 30, 623–646. [Google Scholar] [CrossRef]
- Elton, L. University teaching: A professional model for quality. In Quality Assurance for University Teaching, 1st ed.; Ellis, R., Hogard, E., Eds.; Open University Press: Maidenhead, UK, 2018; pp. 133–148. [Google Scholar]
- Stensaker, B. Academic development as cultural work: Responding to the organizational complexity of modern higher education institutions. Int. J. Acad. Dev. 2018, 23, 274–285. [Google Scholar] [CrossRef]
- Caballero, K.; Bolívar, A. El profesorado universitario como docente: Hacia una identidad profesional que integre docencia e investigación. REDU-Rev. Docencia Univ. 2015, 13, 57–77. [Google Scholar]
- Tesouro, M.; Puiggalí, J. La Relación entre la Docencia y la Investigación Según la Opinión del Profesorado Universitario. Procedia-Soc. Behav. Sci. 2015, 196, 212–218. [Google Scholar] [CrossRef]
- Bolívar, A. Docencia e investigación en la universidad: De una relación problemática a una productiva. Rev. Gestión Innovación Educ. Super. 2017, 2, 11–33. [Google Scholar]
- Harland, T. La Enseñanza Universitaria. Una Guía Introductoria; Morata: Madrid, Spain, 2017. [Google Scholar]
- Bunescu, L.; Stoeber, H. Trends 2018. In Learning and Teaching in the European Higher Education Area; European University Association: Brussels, Belgium, 2018. [Google Scholar]
- Gómez, E.L. Conectando investigación y docencia en la universidad: Teaching Research Nexus. Teoría de la Educación. Rev. Interuniv. 2015, 27, 203–220. [Google Scholar] [CrossRef]
- Miranda, M.D.R.L.; Rojas, N.G.J. La tesis y la formación en investigación: Significados construidos por estudiantes de pedagogía. Cienc. Educ. 2020, 4, 95–113. [Google Scholar] [CrossRef]
- Matthews, A.; Kotzee, B. Bundled or unbundled? A multi-text corpus-assisted discourse analysis of the relationship between teaching and research in UK universities. Br. Educ. Res. J. 2022, 48, 578–597. [Google Scholar] [CrossRef]
- Davis, H.; Graham, C. Navigating a career in tertiary education management in an era of unceasing transformation. J. High. Educ. Policy Manag. 2018, 40, 97–106. [Google Scholar] [CrossRef]
- Lapoule, P.; Lynch, R. The case study method: Exploring the link between teaching and research. J. High. Educ. Policy Manag. 2018, 40, 485–500. [Google Scholar] [CrossRef]
- Cladellas, R.; Badia, M.M. La gestión del tiempo de los profesores universitarios en función de la modalidad educativa: Sus efectos psicosociales. Rev. Española Pedagog. 2010, 246, 297–310. [Google Scholar]
- Castilla-Gutiérrez, S.; Colihuil-Catrileo, R.; Bruneau-Chávez, J.; Lagos-Hernández, R. Carga laboral y efectos en la calidad de vida de docentes universitarios y de enseñanza media. Rev. Chakiñan Cienc. Soc. Humanid. 2021, 15, 166–179. [Google Scholar] [CrossRef]
- Vega, M.M.C.; Neira, G.R.R.; Escobar, P.A.R. Relación entre Satisfacción Laboral, Estrés Laboral y sus Resultados en Trabajadores de una Institución de Beneficencia de la Provincia de Concepción. Cienc. Trab. 2018, 20, 178–186. [Google Scholar] [CrossRef]
- Méndez, R.M.Y.; Asis, E.H.R.; García-Figueroa, M.E.; Montaño, J.L.A. Clima laboral y burnout en profesores universitarios. Rev. Electrónica Interuniv. Form. Profr. 2021, 24, 101–114. [Google Scholar] [CrossRef]
- Agustina, M.; Kristiawan, M.; Tobari, T. The Influence of Principal’s Leadership and School's Climate on The Work Productivity of Vocational Pharmacy Teachers in Indonesia. Int. J. Educ. Rev. 2020, 3, 63–76. [Google Scholar] [CrossRef]
- Adams, R.V.; Blair, E. Impact of Time Management Behaviors on Undergraduate Engineering Students’ Performance. SAGE Open 2019, 9. [Google Scholar] [CrossRef]
- Gul, R.; Tahir, T.; Ishfaq, U.; Batool, T. Impact of Teachers' Workload on their time management skills at University level. Indian J. Econ. Bus. 2021, 20, 819–829. [Google Scholar]
Figure 1.
Distribution of professors by gender and researcher proficiency level (0—No-SNI, C—SNI Candidate, 1—SNI Level 1, 2—SNI Level 2, 3—SNI Level 3).
Figure 1.
Distribution of professors by gender and researcher proficiency level (0—No-SNI, C—SNI Candidate, 1—SNI Level 1, 2—SNI Level 2, 3—SNI Level 3).
Figure 2.
Annual academic workload (taught groups) by researcher proficiency level (SNI) between 2014 and 2018.
Figure 2.
Annual academic workload (taught groups) by researcher proficiency level (SNI) between 2014 and 2018.
Figure 3.
Scientific productivity by researcher proficiency level (SNI). Note: SNI level 0 (Blue), SNI Candidate (Green), SNI level 1 (Orange), SNI level 2 (Red), and SNI level 3 (Aquamarine).
Figure 3.
Scientific productivity by researcher proficiency level (SNI). Note: SNI level 0 (Blue), SNI Candidate (Green), SNI level 1 (Orange), SNI level 2 (Red), and SNI level 3 (Aquamarine).
Figure 4.
Scientific productivity by school (departments). Note: Engineering and Sciences (EIC) (Green), Medicine (EMCS) (Yellow), Business (EGADE) (Red), Humanities and Education (EHE) (Aquamarine), Architecture, Art and Design (EAAD) (Blue), Social Sciences and Government (ECSG) (Orange).
Figure 4.
Scientific productivity by school (departments). Note: Engineering and Sciences (EIC) (Green), Medicine (EMCS) (Yellow), Business (EGADE) (Red), Humanities and Education (EHE) (Aquamarine), Architecture, Art and Design (EAAD) (Blue), Social Sciences and Government (ECSG) (Orange).
Figure 5.
The average number of coauthors for professors in every school (department). Note: Engineering and Sciences (EIC) (Green), Medicine (EMCS) (Yellow), Business (EGADE) (Red), Humanities and Education (EHE) (Aquamarine), Architecture, Art and Design (EAAD) (Blue), Social Sciences and Government (ECSG) (Orange).
Figure 6.
Correlation matrix between independent variables and the dependent variable.
Figure 6.
Correlation matrix between independent variables and the dependent variable.
Figure 7.
Correlogram between independent variables and the dependent variable. Note: Variables listed by row/column are: GENDER, ADM_POS, RES_CONTRACT, AGE, SNI_VAL, TESISTAS_RESP, GROUPS_GRAD, GROUPS_UNDERGRAD, GROUPS, ONLY_UNDERGRAD, and DOCS_Y1.
Figure 7.
Correlogram between independent variables and the dependent variable. Note: Variables listed by row/column are: GENDER, ADM_POS, RES_CONTRACT, AGE, SNI_VAL, TESISTAS_RESP, GROUPS_GRAD, GROUPS_UNDERGRAD, GROUPS, ONLY_UNDERGRAD, and DOCS_Y1.
Figure 8.
The correlation between groups taught at undergraduate and graduate levels on scientific productivity is broken down by researcher proficiency level.
Figure 8.
The correlation between groups taught at undergraduate and graduate levels on scientific productivity is broken down by researcher proficiency level.
Table 1.
Dataset variables and definitions.
Table 1.
Dataset variables and definitions.
| Variable | Definition | Values |
|---|
| GENDER | Indicates whether the professor’s gender is male (1) or female (0) | 0/1 |
| ADM_POS | Indicates if the professor holds an administrative position at the institution during the year (1) or not (0). | 0/1 |
| RES_CONTRACT | Indicates if the professor had a research-only (or primarily) contract during the year (1) or not (0). | 0/1 |
| AGE | The age of the professor at the beginning of the calendar year. | 21–76 |
| SCHOOL | The school where the professor taught more classes that year. | EIC, EMCS, EGADE, ECSG, EHE, EAAD, OTHER |
| SNI_VAL | The researcher proficiency level of the professor in the year. Not being in the researcher systems is encoded as 0, being Candidate as 1, Level 1 as 2, Level 2 as 3, and Level 3 (maximum) as 4. | 0–4 |
| TESISTAS_RESP | The number of theses (undergraduate and graduate) students advised by the professor during the year. Co-advised students are multiplied by a responsibility percentage. | 0–130 |
| GROUPS_GRAD * | The number of groups taught at the graduate level during the year. | 0–15.84 |
| GROUPS_UNDERGRAD * | The number of groups taught at the undergraduate level during the year. | 0–64.26 |
| GROUPS * | The total number of groups taught during the year. | 0–65.61 |
| ONLY_UNDERGRAD | Flag indicating whether the professor taught only to undergraduate students throughout the entire year (1) or attended graduate students as well (0). | 0/1 |
| DOCS_Y1 | The number of Scopus-indexed papers published by the professor in the calendar year after the analyzed workload. | 0–61 |
Table 2.
Coefficients of the two regression models.
Table 2.
Coefficients of the two regression models.
| X | Variable | All Professors | SNI Professors | Non-SNI Professors |
|---|
| 1 | TESISTAS_RESP | 0.061 | 0.043 | 0.059 |
| 2 | RES_CONTRACT | 0.922 | 0.771 | 1.905 |
| 3 | ADM_POS | 0.731 | 1.203 | 0.417 |
| 4 | SNI_VAL | 1.000 | 1.829 | - |
| 5 | AGE | −0.015 | −0.058 | 0.003 |
| 6 | EIC | 1.750 | 2.346 | 0.569 |
| 7 | EMCS | 1.329 | 1.189 | 0.544 |
| 8 | EGADE | 0.520 | - | - |
| 9 | UNDERGRAD_ONLY | −0.258 | −0.544 | - |
| | Adjusted R2 | 0.489 | 0.551 | 0.322 |
| Disclaimer/Publisher’s Note: The statements, opinions and data contained in all publications are solely those of the individual author(s) and contributor(s) and not of MDPI and/or the editor(s). MDPI and/or the editor(s) disclaim responsibility for any injury to people or property resulting from any ideas, methods, instructions or products referred to in the content. |
© 2023 by the authors. Licensee MDPI, Basel, Switzerland. This article is an open access article distributed under the terms and conditions of the Creative Commons Attribution (CC BY) license (https://creativecommons.org/licenses/by/4.0/).


 ,
, 


