
Time-Lapse In Situ 3D Imaging Analysis of Human Enamel Demineralisation Using X-ray Synchrotron Tomography
 and
and 
Abstract
:
1. Introduction
2. Methods
2.1. SEM
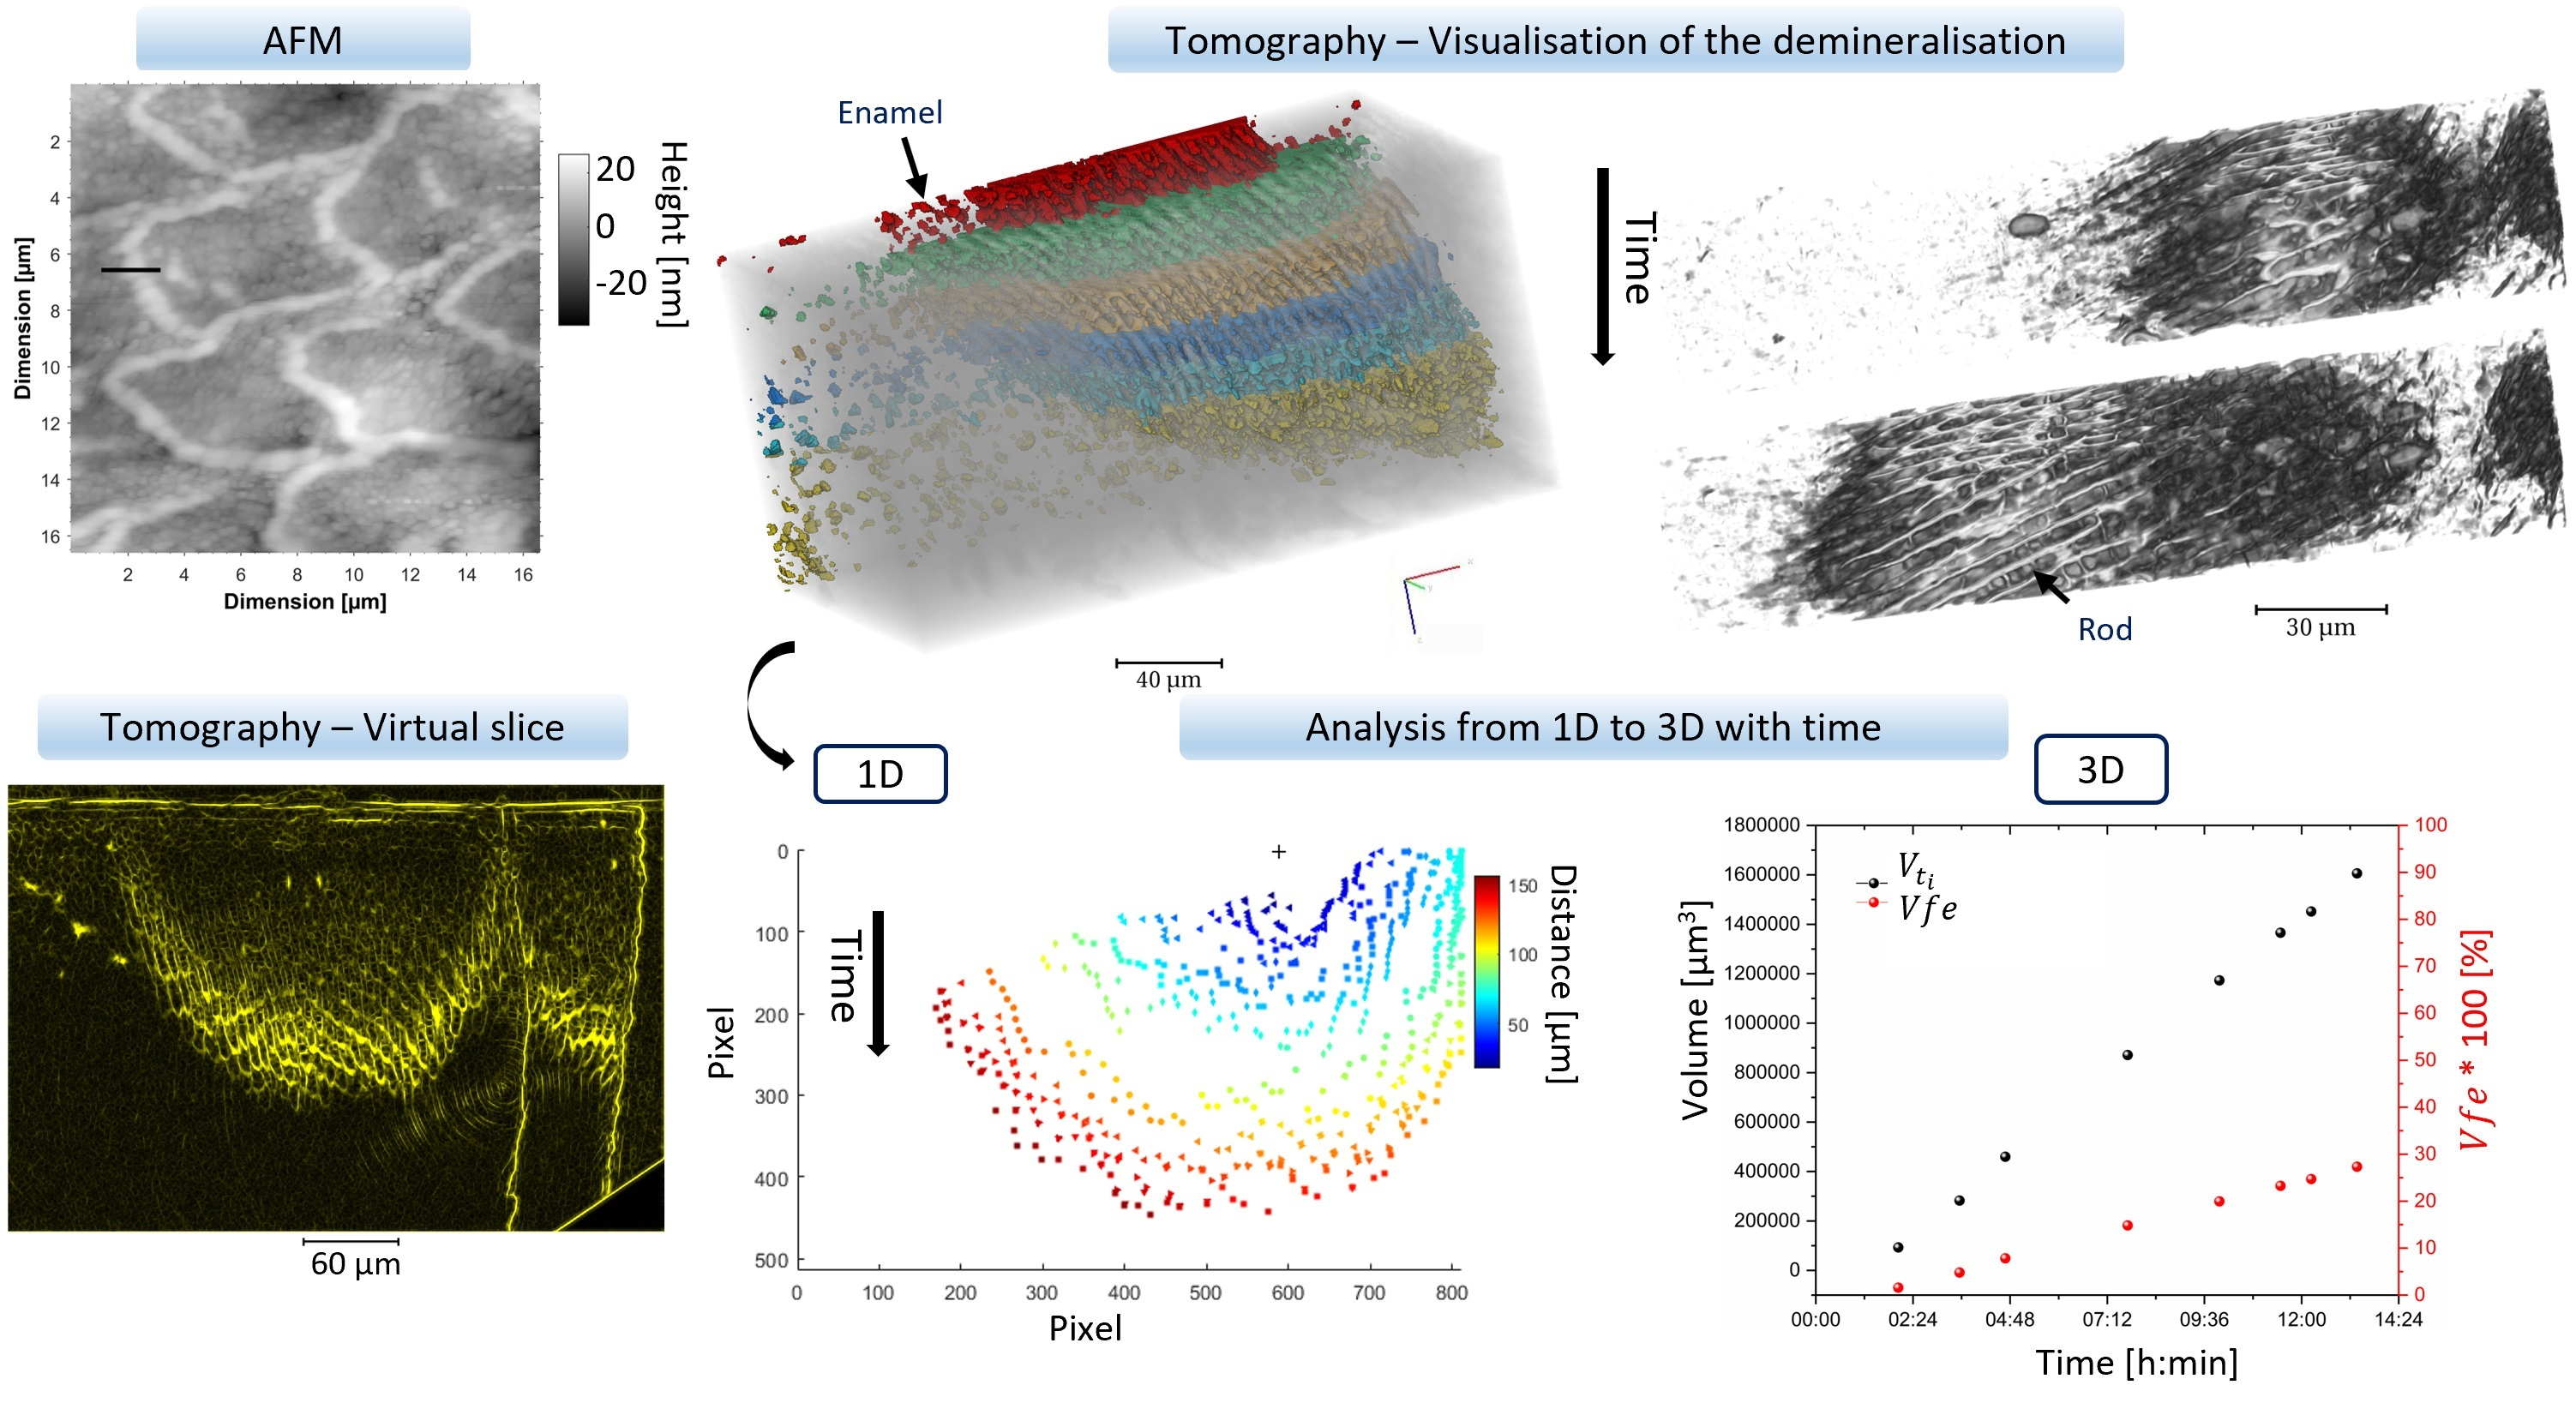
2.2. AFM
2.3. Experimental Setup
2.3.1. Sample Preparation for Tomography Analysis, Optical Profilometry and AFM
2.3.2. Synchrotron Beamline Experiment
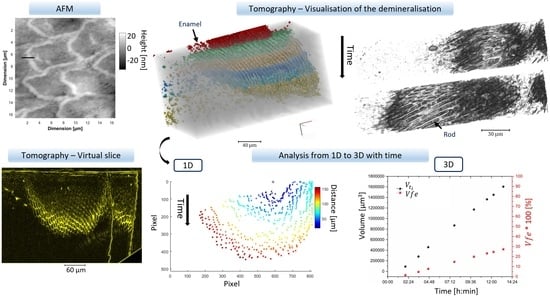
2.3.3. Analysis of the Tomography Data
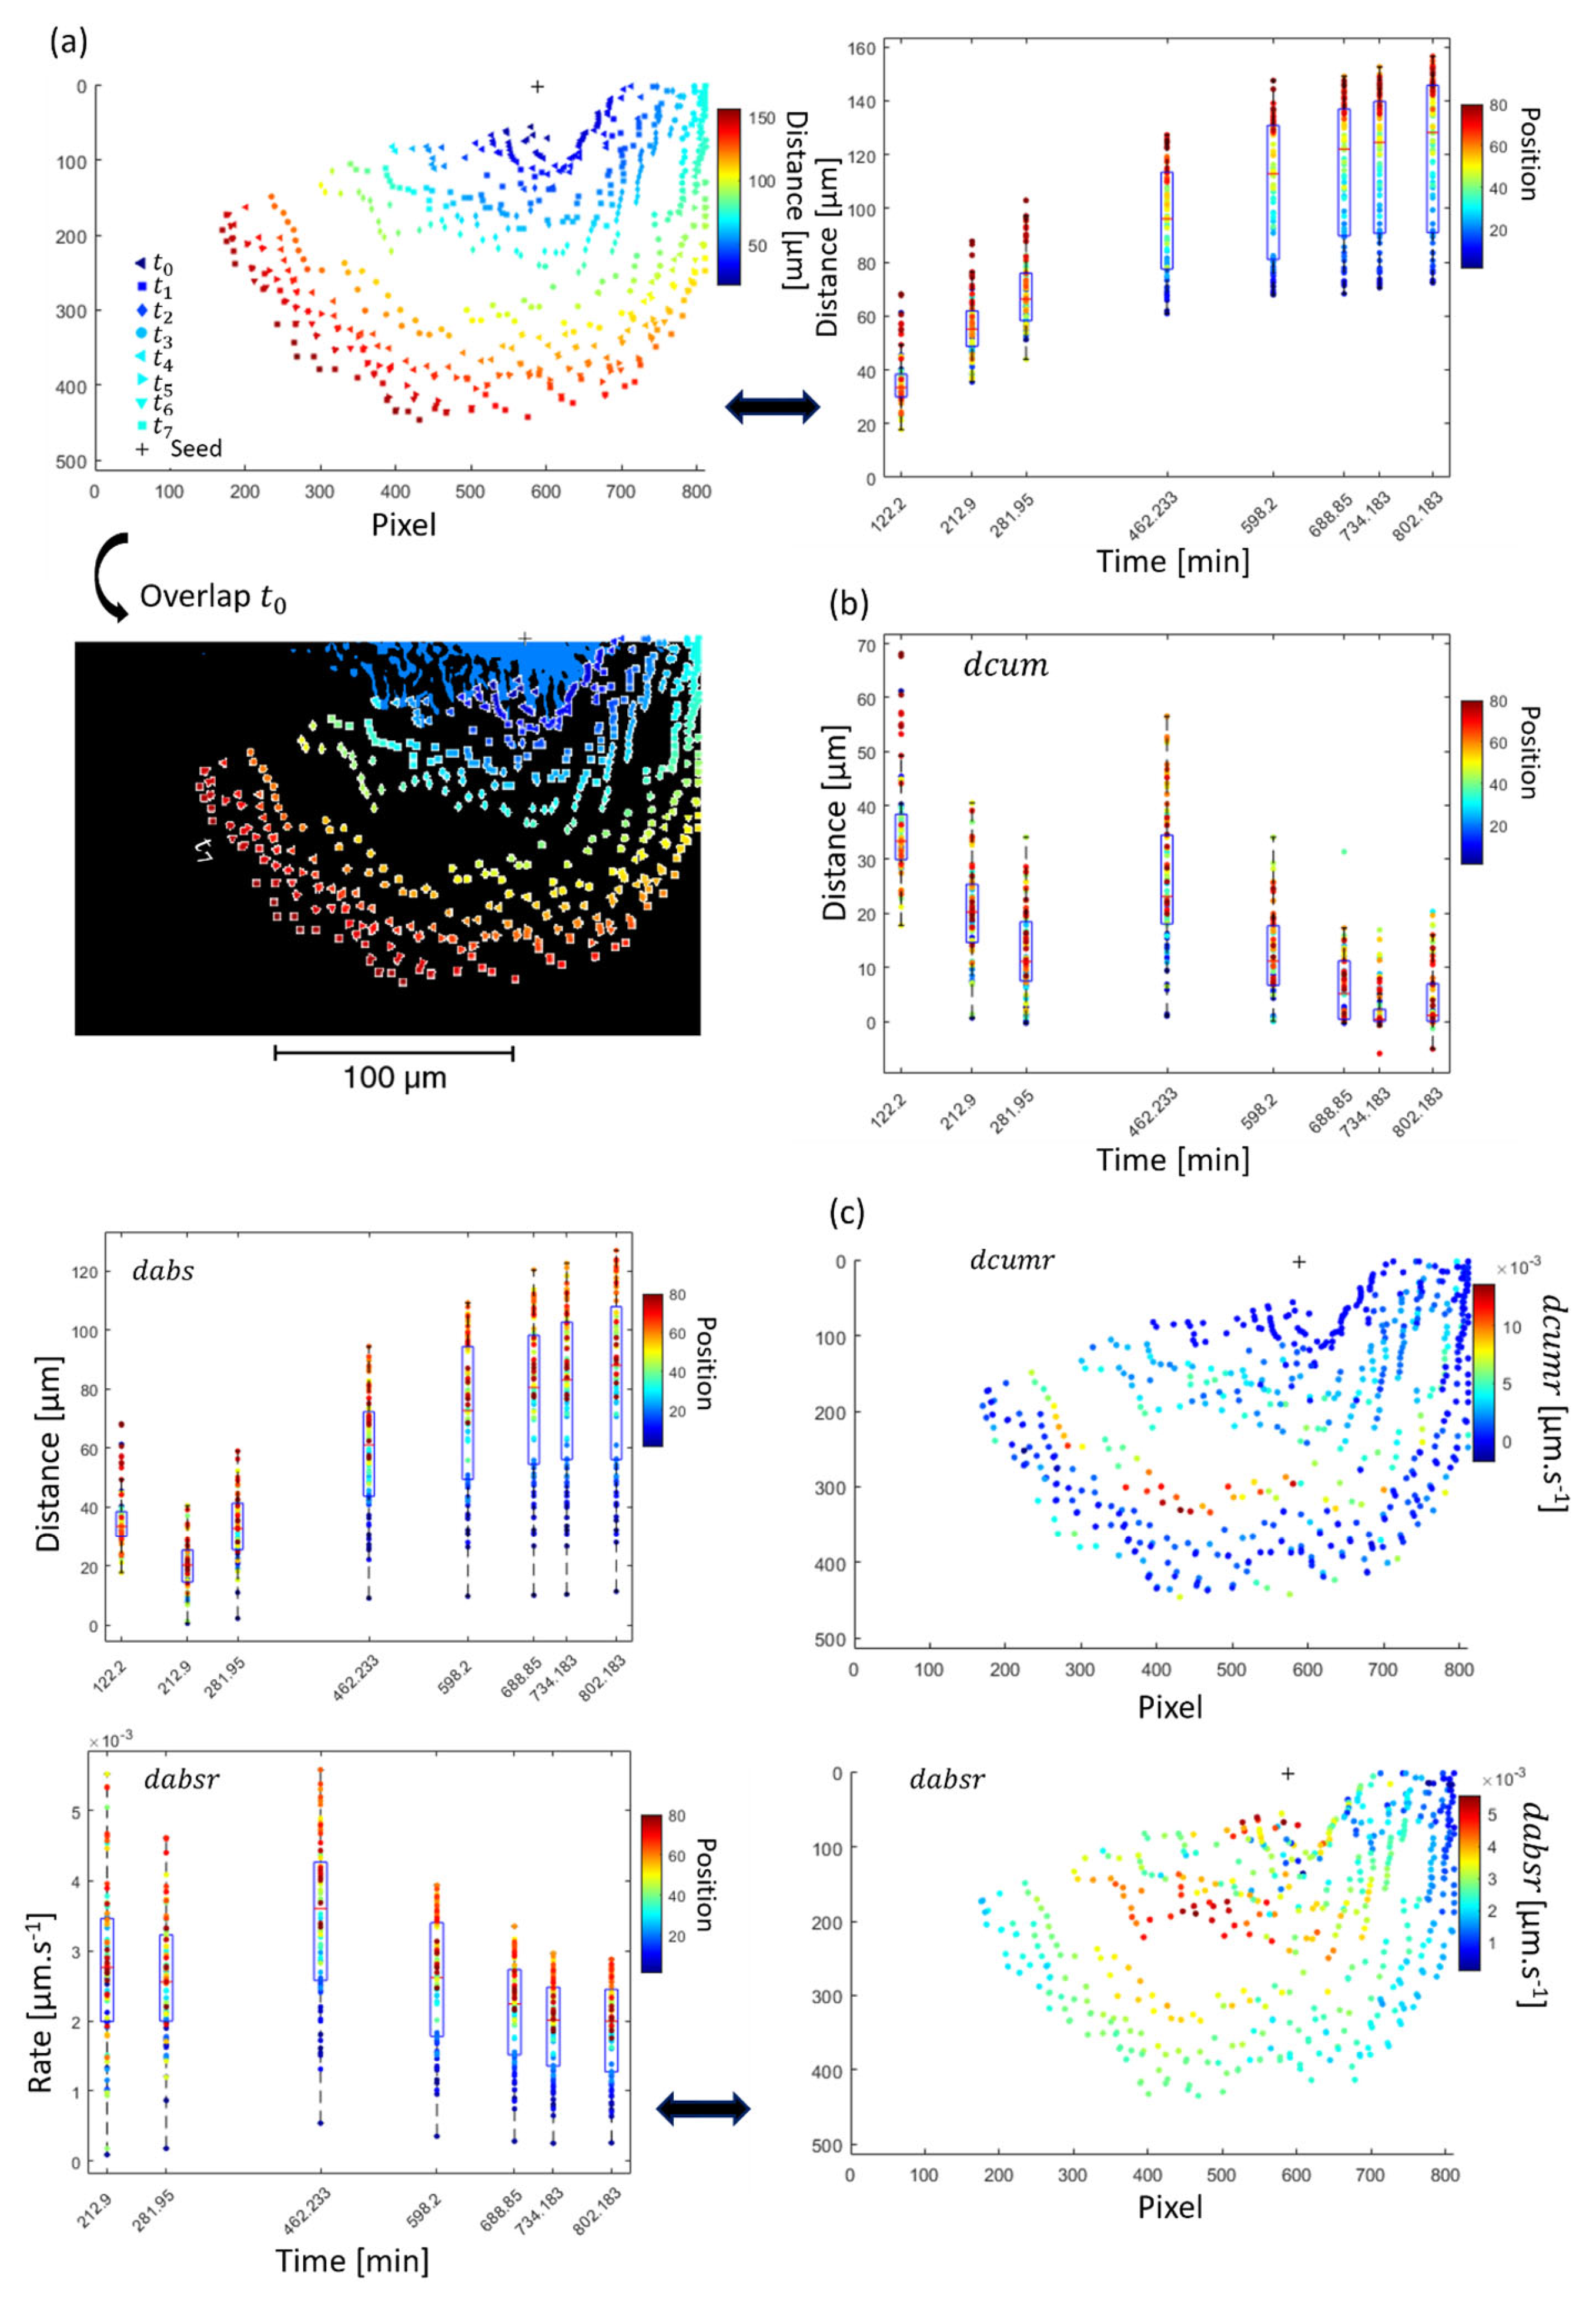
- ‘Radius distance’ is the distance from one point (equivalent to a seed) on the virtual slice to the last segmented data on the same slice at a specific angle. This was computed using Matlab and is detailed in Supplementary Materials Figure S3. This analysis can be conducted either on the reconstructed virtual slice after segmentation or on the projection after segmentation. The total distance at each time point could be determined, and then two other pieces of information on the distances were obtained: the absolute distance at a certain time from a reference dataset, here , and the cumulative distance :Statistics data can be obtained if several points are taken into consideration.Distance difference at each time point analysed :
- The area with the temporal evolution of the surface of the lesion in virtual slices could be identified from 2D information. The total area per plane of the demineralised region referred to as in µm2 was extracted, as well as the ratio of the area at time which was referred to as and the initial area demineralised at , , and was annotated :
- The evolution of the demineralised volume was also studied with visualisation and analysis. These measurements were similar to the area. The ratio of the volume of the demineralised region at time , and the initial demineralised volume at the time reference , , were referred to as :
3. Results—Discussion
3.1. AFM
3.2. Synchrotron Tomography Data
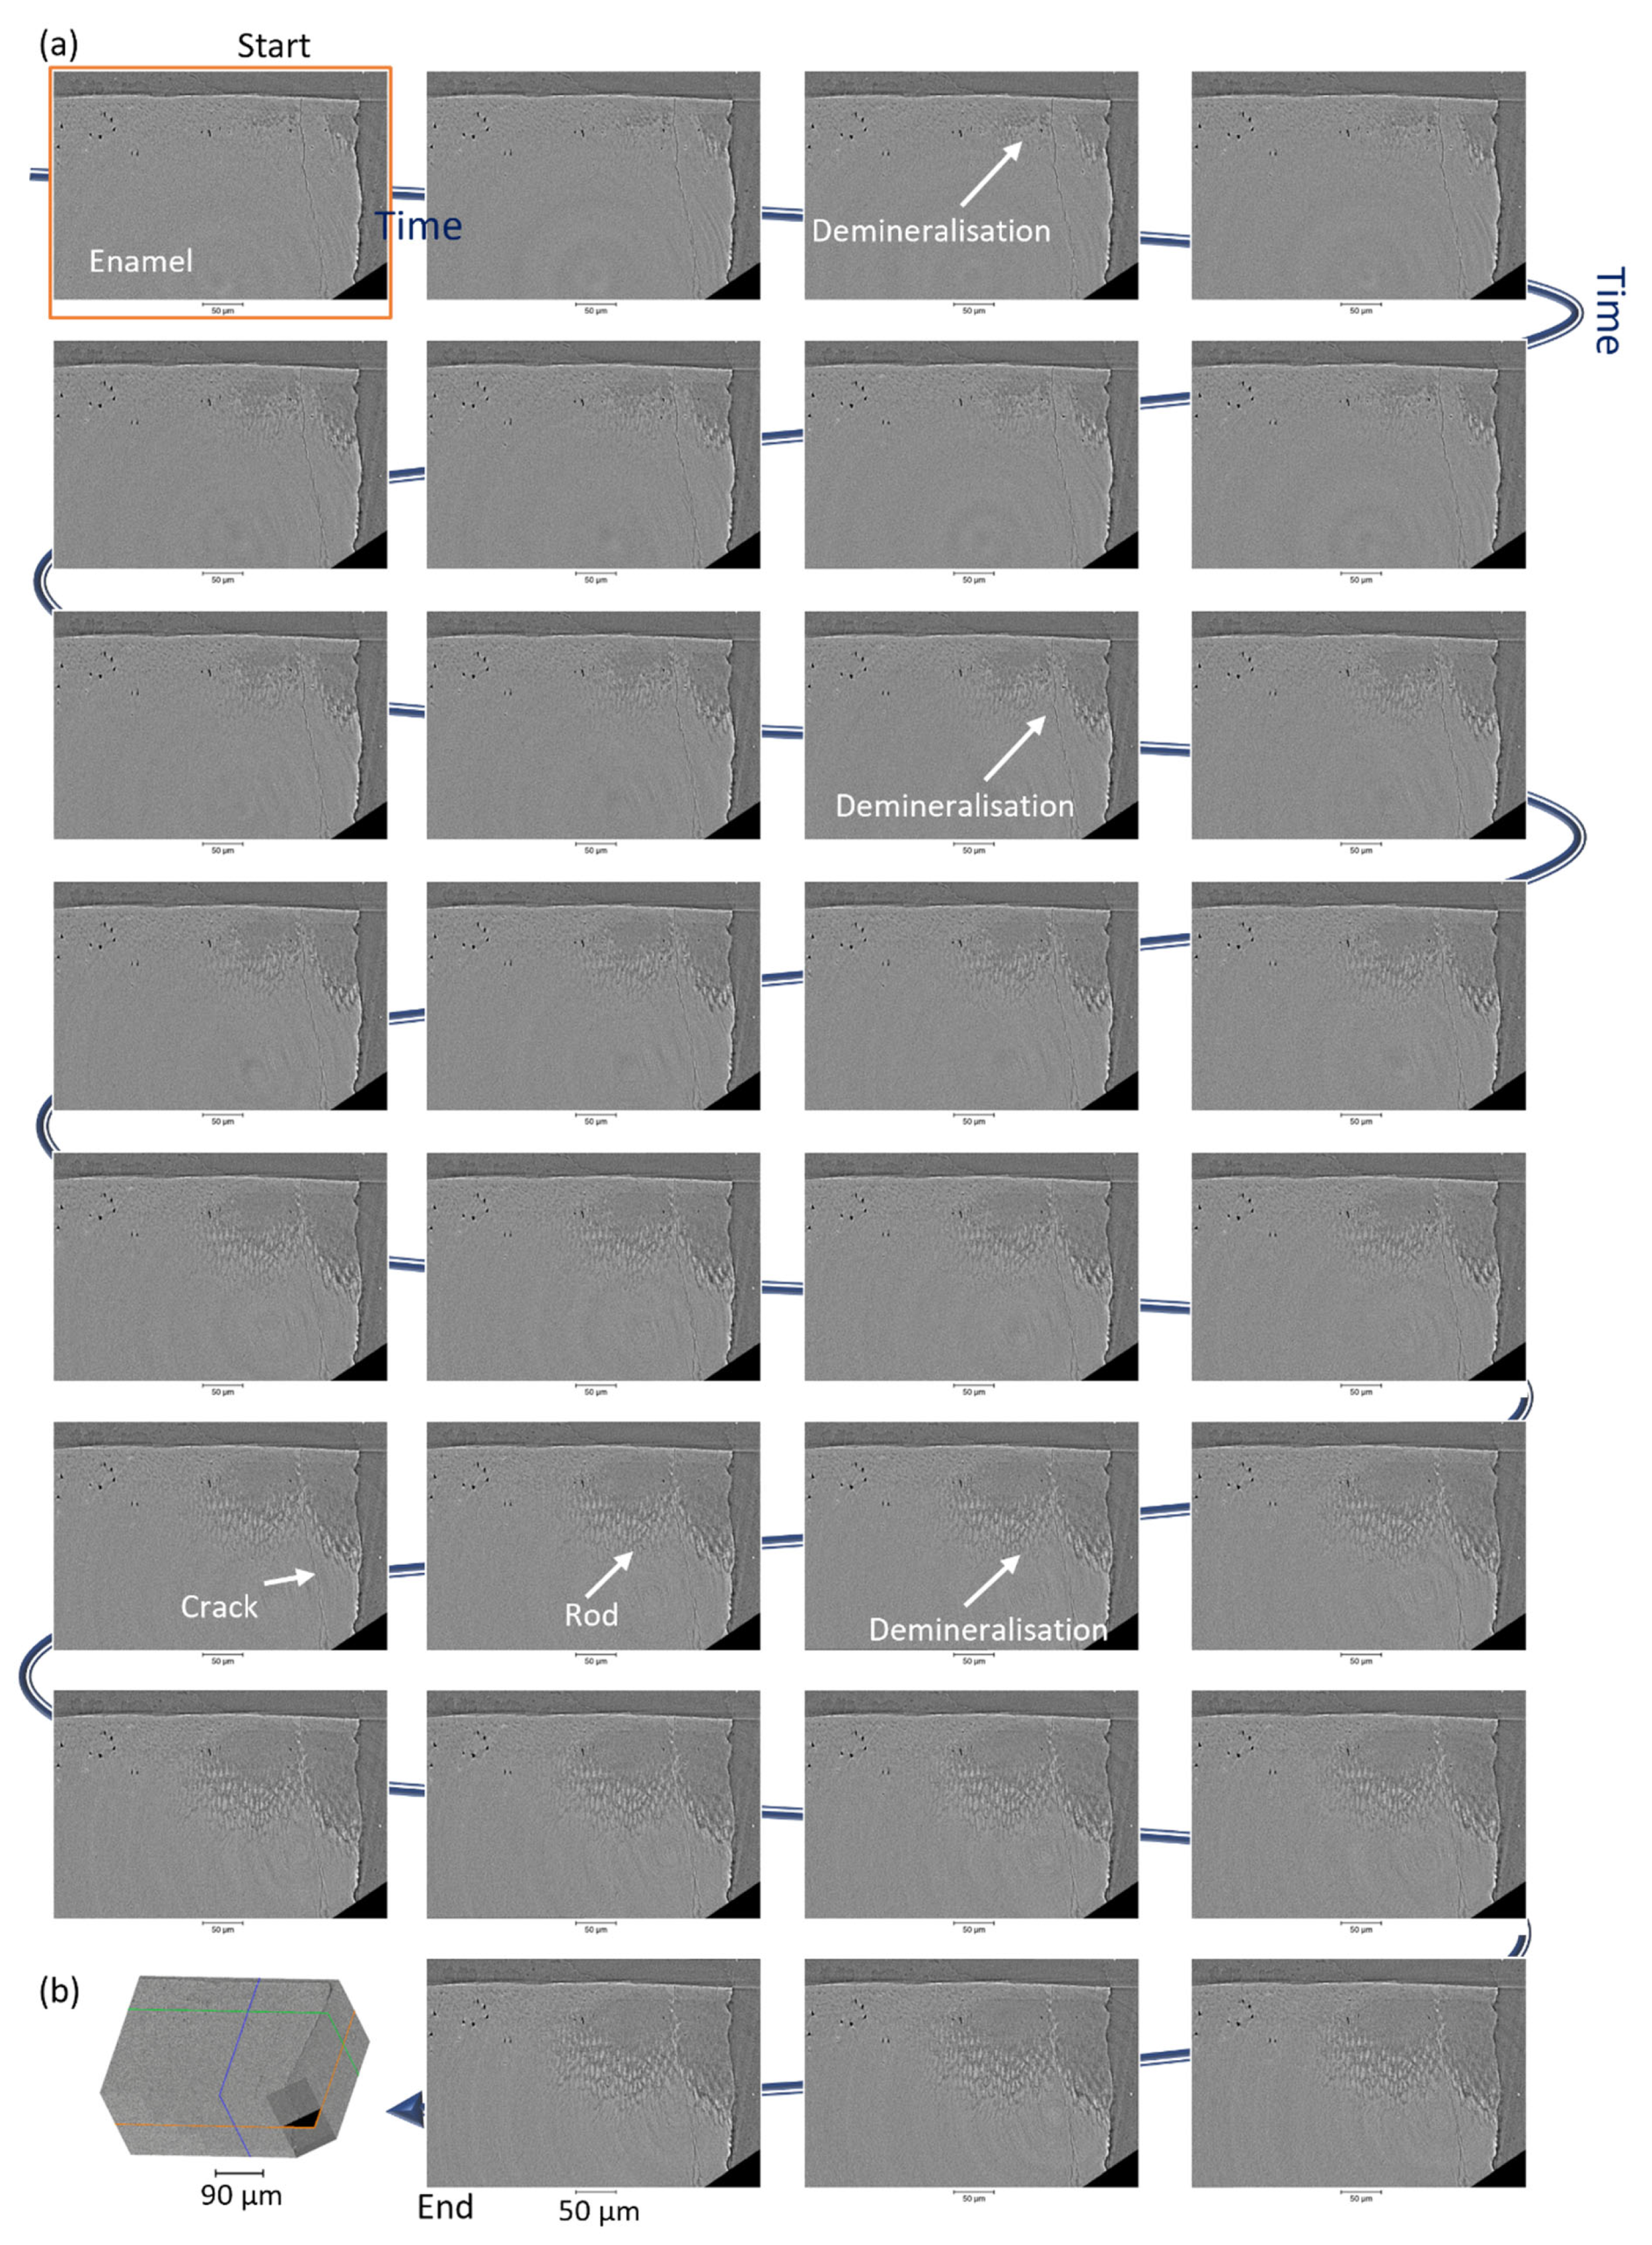
3.2.1. Projection
3.2.2. 2D Analysis of the Tomography Data
3.2.3. 3D Analysis and the Addition of Time
3.3. Area Evolution
3.4. Distance Evolution
4. Conclusions
Supplementary Materials
Author Contributions
Funding
Institutional Review Board Statement
Informed Consent Statement
Data Availability Statement
Acknowledgments
Conflicts of Interest
References
- James, S.L.; Abate, D.; Abate, K.H.; Abay, S.M.; Abbafati, C.; Abbasi, N.; Abbastabar, H.; Abd-Allah, F.; Abdela, J.; Abdelalim, A.; et al. Global, regional, and national incidence, prevalence, and years lived with disability for 354 diseases and injuries for 195 countries and territories, 1990–2017: A systematic analysis for the Global Burden of Disease Study 2017. Lancet 2018, 392, 1789–1858. [Google Scholar] [CrossRef] [PubMed]
- Fejerskov, O.; Kidd, E.A.M.; Nyvad, B.; Baelum, V. Defining the disease: An introduction. In Dental Caries the Disease and Its Clinical Management; Fejerskov, O., Kidd, E.A.M., Eds.; Blackwell Munksgaard: Oxford, UK, 2008; Chapter 1; pp. 3–6. [Google Scholar]
- Forssten, S.D.; Björklund, M.; Ouwehand, A.C. Streptococcus mutans, Caries and Simulation Models. Nutrients 2010, 2, 290–298. [Google Scholar] [CrossRef] [PubMed]
- Hwang, G.; Liu, Y.; Kim, D.; Sun, V.; Aviles-Reyes, A.; Kajfasz, J.K.; Lemos, J.A.; Koo, H. Simultaneous spatiotemporal mapping of in situ pH and bacterial activity within an intact 3D microcolony structure. Sci. Rep. 2016, 6, 32841. [Google Scholar] [CrossRef] [PubMed]
- Marsh, P.D.; Moter, A.; Devine, D.A. Dental plaque biofilms: Communities, conflict and control. Periodontology 2000 2011, 55, 16–35. [Google Scholar] [CrossRef]
- Besnard, C.; Marie, A.; Buček, P.; Sasidharan, S.; Harper, R.A.; Marathe, S.; Wanelik, K.; Landini, G.; Shelton, R.M.; Korsunsky, A.M. Hierarchical 2D to 3D micro/nano-histology of human dental caries lesions using light, X-ray and electron microscopy. Mater. Des. 2022, 220, 110829. Available online: https://www.sciencedirect.com/science/article/pii/S0264127522004518 (accessed on 20 March 2023). [CrossRef]
- Voegel, J.C.; Frank, R.M. Stages in the dissolution of human enamel crystals in dental caries. Calcif. Tissue Int. 1977, 24, 19–27. [Google Scholar] [CrossRef] [PubMed]
- Besnard, C.; Harper, R.A.; Moxham, T.E.J.; James, J.D.; Storm, M.; Salvati, E.; Landini, G.; Shelton, R.M.; Korsunsky, A.M. 3D analysis of enamel demineralisation in human dental caries using high-resolution, large field of view synchrotron X-ray micro-computed tomography. Mater. Today Commun. 2021, 27, 102418. [Google Scholar] [CrossRef]
- Salvati, E.; Besnard, C.; Harper, R.A.; Moxham, T.; Shelton, R.M.; Landini, G.; Korsunsky, A.M. Finite Element Modelling and Experimental Validation of the Enamel Demineralisation Process at the Rod Level. J. Adv. Res. 2021, 29, 167–177. [Google Scholar] [CrossRef]
- Besnard, C.; Harper, R.A.; Salvati, E.; Moxham, T.E.J.; Romano Brandt, L.R.; Landini, G.; Shelton, R.M.; Korsunsky, A.M. Analysis of in vitro demineralised human enamel using multi-scale correlative optical and scanning electron microscopy, and high-resolution synchrotron wide-angle X-ray scattering. Mater. Des. 2021, 206, 109739. [Google Scholar] [CrossRef]
- Besnard, C.; Marie, A.; Sasidharan, S.; Harper, R.A.; Shelton, R.M.; Landini, G.; Korsunsky, A.M. Synchrotron X-ray Studies of the Structural and Functional Hierarchies in Mineralised Human Dental Enamel: A State-of-the-Art Review. Dent. J. 2023, 11, 98. [Google Scholar] [CrossRef]
- Besnard, C.; Marie, A.; Buček, P.; Sasidharan, S.; Harper, R.A.; Marathe, S.; Wanelik, K.; Landini, G.; Shelton, R.M.; Korsunsky, A.M. Movies and dataset for: Hierarchical 2D to 3D micro/nano-histology of human dental caries lesions using light, X-ray and electron microscopy. Mendeley Data 2022, 220, 110829. Available online: https://data.mendeley.com/datasets/3ks3syd2n3 (accessed on 20 March 2023). [CrossRef]
- Featherstone, J.D.B.; Lussi, A. Understanding the Chemistry of Dental Erosion. Monogr. Oral Sci. 2006, 20, 66–76. [Google Scholar] [CrossRef] [PubMed]
- Bonte, E.; Deschamps, N.; Goldberg, M.; Vernois, V. Quantification of Free Water in Human Dental Enamel. J. Dent. Res. 1988, 67, 880–882. [Google Scholar] [CrossRef] [PubMed]
- Daculsi, G.; Menanteau, J.; Kerebel, L.M.; Mitre, D. Length and shape of enamel crystals. Calcif. Tissue Int. 1984, 36, 550–555. [Google Scholar] [CrossRef] [PubMed]
- DeRocher, K.A.; Smeets, P.J.M.; Goodge, B.H.; Zachman, M.J.; Balachandran, P.V.; Stegbauer, L.; Cohen, M.J.; Gordon, L.M.; Rondinelli, J.M.; Kourkoutis, L.F.; et al. Chemical gradients in human enamel crystallites. Nature 2020, 583, 66–71. [Google Scholar] [CrossRef] [PubMed]
- Beniash, E.; Stifler, C.A.; Sun, C.-Y.; Jung, G.S.; Qin, Z.; Buehler, M.J.; Gilbert, P.U.P.A. The hidden structure of human enamel. Nat. Commun. 2019, 10, 4383. [Google Scholar] [CrossRef] [PubMed]
- Besnard, C.; Marie, A.; Sasidharan, S.; Buček, P.; Walker, J.M.; Parker, J.E.; Moxham, T.E.J.; Daurer, B.; Kaulich, B.; Kazemian, M.; et al. Nanoscale correlative X-ray spectroscopy and ptychography of carious dental enamel. Mater. Des. 2022, 224, 111272. [Google Scholar] [CrossRef]
- Risnes, S.; Saeed, M.; Sehic, A. Scanning Electron Microscopy (SEM) Methods for Dental Enamel. In Odontogenesis: Methods and Protocols; Papagerakis, P., Ed.; Springer: New York, NY, USA, 2019; Chapter 27; pp. 293–308. [Google Scholar] [CrossRef]
- Cui, F.-Z.; Ge, J. New observations of the hierarchical structure of human enamel, from nanoscale to microscale. J. Tissue Eng. Regen. Med. 2007, 1, 185–191. [Google Scholar] [CrossRef] [PubMed]
- Kelly, A.M.; Kallistova, A.; Küchler, E.C.; Romanos, H.F.; Lips, A.; Costa, M.C.; Modesto, A.; Vieira, A.R. Measuring the Microscopic Structures of Human Dental Enamel Can Predict Caries Experience. J. Pers. Med. 2020, 10, 5. [Google Scholar] [CrossRef] [PubMed]
- Lynch, C.D.; O’sullivan, V.R.; Dockery, P.; McGillycuddy, C.T.; Sloan, A.J. Hunter-Schreger Band patterns in human tooth enamel. J. Anat. 2010, 217, 106–115. [Google Scholar] [CrossRef] [PubMed]
- Risnes, S. A scanning electron microscope study of the three-dimensional extent of Retzius lines in human dental enamel. Eur. J. Oral Sci. 1985, 93, 145–152. [Google Scholar] [CrossRef] [PubMed]
- Yun, F.; Swain, M.V.; Chen, H.; Cairney, J.; Qu, J.; Sha, G.; Liu, H.; Ringer, S.P.; Han, Y.; Liu, L.; et al. Nanoscale pathways for human tooth decay–Central planar defect, organic-rich precipitate and high-angle grain boundary. Biomaterials 2020, 235, 119748. [Google Scholar] [CrossRef] [PubMed]
- Korsunsky, A.M.; Besnard, C.; Marie, A.; Sasidharan, S.; Harper, R.A.; James, J.D.; Landini, G.; Shelton, R.M.; Marathe, S. Time-resolved operando X-ray micro-computed tomography of the demineralisation of human dental enamel. In Proceedings of the ESRF User Meeting, Grenoble, France, 8–10 February 2021. [Google Scholar]
- Leung, N.; Harper, R.A.; Zhu, B.; Shelton, R.M.; Landini, G.; Sui, T. 4D microstructural changes in dentinal tubules during acid demineralisation. Dent. Mater. 2021, 37, 1714–1723. [Google Scholar] [CrossRef] [PubMed]
- Dawes, C. What is the critical pH and why does a tooth dissolve in acid? J. Can. Dent. Assoc. 2003, 69, 722–724. [Google Scholar] [PubMed]
- Risnes, S.; Li, C. On the method of revealing enamel structure by acid etching. Aspects of optimization and interpretation. Microsc. Res. Tech. 2019, 82, 1668–1680. [Google Scholar] [CrossRef]
- Poggio, C.; Ceci, M.; Beltrami, R.; Lombardini, M.; Colombo, M. Atomic force microscopy study of enamel remineralization. Ann. Stomatol. 2014, 5, 98–102. [Google Scholar]
- Scott, D.B.; Simmelink, J.W.; Nygaard, V. Structural Aspects of Dental Caries. J. Dent. Res. 1974, 53, 165–178. [Google Scholar] [CrossRef] [PubMed]
- Harper, R.A.; Shelton, R.M.; James, J.D.; Salvati, E.; Besnard, C.; Korsunsky, A.M.; Landini, G. Acid-induced demineralisation of human enamel as a function of time and pH observed using X-ray and polarised light imaging. Acta Biomater. 2021, 120, 240–248. [Google Scholar] [CrossRef] [PubMed]
- Li, P.; Oh, C.; Kim, H.; Chen-Glasser, M.; Park, G.; Jetybayeva, A.; Yeom, J.; Kim, H.; Ryu, J.; Hong, S. Nanoscale effects of beverages on enamel surface of human teeth: An atomic force microscopy study. J. Mech. Behav. Biomed. Mater. 2020, 110, 103930. [Google Scholar] [CrossRef]
- Parkinson, C.R.; Shahzad, A.; Rees, G.D. Initial stages of enamel erosion: An in situ atomic force microscopy study. J. Struct. Biol. 2010, 171, 298–302. [Google Scholar] [CrossRef] [PubMed]
- Pyne, A.; Marks, W.; Picco, L.M.; Dunton, P.G.; Ulcinas, A.; Barbour, M.E.; Jones, S.B.; Gimzewski, J.; Miles, M.J. High-speed atomic force microscopy of dental enamel dissolution in citric acid. Arch. Histol. Cytol. 2009, 72, 209–215. [Google Scholar] [CrossRef]
- Wang, L.; Tang, R.; Bonstein, T.; Orme, C.A.; Bush, P.J.; Nancollas, G.H. A New Model for Nanoscale Enamel Dissolution. J. Phys. Chem. B 2005, 109, 999–1005. [Google Scholar] [CrossRef]
- Watari, F. In situ quantitative analysis of etching process of human teeth by atomic force microscopy. J. Electron Microsc. 2005, 54, 299–308. [Google Scholar] [CrossRef] [PubMed]
- Liu, B.H.; Yu, L.-C. In-situ, time-lapse study of extracellular polymeric substance discharge in Streptococcus mutans biofilm. Coll. Surf. B Biointerfaces 2017, 150, 98–105. [Google Scholar] [CrossRef] [PubMed]
- Sui, T.; Salvati, E.; Harper, R.A.; Zhang, H.; Shelton, R.M.; Landini, G.; Korsunsky, A.M. In situ monitoring and analysis of enamel demineralisation using synchrotron X-ray scattering. Acta Biomater. 2018, 77, 333–341. [Google Scholar] [CrossRef] [PubMed]
- Voltolini, M.; Haboub, A.; Dou, S.; Kwon, T.-H.; MacDowell, A.A.; Parkinson, D.Y.; Ajo-Franklin, J. The emerging role of 4D synchrotron X-ray micro-tomography for climate and fossil energy studies: Five experiments showing the present capabilities at beamline 8.3.2 at the Advanced Light Source. J. Synchrotron Radiat. 2017, 24, 1237–1249. [Google Scholar] [CrossRef] [PubMed]
- Ni, X.; Fritz, N.K.; Wardle, B.L. In Situ Testing Using Synchrotron Radiation Computed Tomography in Materials Research. MRS Adv. 2019, 4, 2831–2841. [Google Scholar] [CrossRef]
- Fernández, M.P.; Barber, A.H.; Blunn, G.W.; Tozzi, G. Optimization of digital volume correlation computation in SR-microCT images of trabecular bone and bone-biomaterial systems. J. Microsc. 2018, 272, 213–228. [Google Scholar] [CrossRef]
- Cai, B.; Wang, J.; Kao, A.; Pericleous, K.; Phillion, A.B.; Atwood, R.C.; Lee, P.D. 4D synchrotron X-ray tomographic quantification of the transition from cellular to dendrite growth during directional solidification. Acta Mater. 2016, 117, 160–169. [Google Scholar] [CrossRef]
- Shuai, S.; Guo, E.; Phillion, A.B.; Callaghan, M.D.; Jing, T.; Lee, P.D. Fast synchrotron X-ray tomographic quantification of dendrite evolution during the solidification of Mg Sn alloys. Acta Mater. 2016, 118, 260–269. [Google Scholar] [CrossRef]
- Zhang, Z.; Wang, C.; Koe, B.; Schlepütz, C.M.; Irvine, S.; Mi, J. Synchrotron X-ray imaging and ultrafast tomography in situ study of the fragmentation and growth dynamics of dendritic microstructures in solidification under ultrasound. Acta Mater. 2021, 209, 116796. [Google Scholar] [CrossRef]
- Guo, E.; Zeng, G.; Kazantsev, D.; Rockett, P.; Bent, J.; Kirkland, M.; Van Dalen, G.; Eastwood, D.S.; StJohn, D.; Lee, P.D. Synchrotron X-ray tomographic quantification of microstructural evolution in ice cream–a multi-phase soft solid. RSC Adv. 2017, 7, 15561–15573. [Google Scholar] [CrossRef]
- Polacci, M.; Arzilli, F.; La Spina, G.; Le Gall, N.; Cai, B.; Hartley, M.E.; Di Genova, D.; Vo, N.T.; Nonni, S.; Atwood, R.C.; et al. Crystallisation in basaltic magmas revealed via in situ 4D synchrotron X-ray microtomography. Sci. Rep. 2018, 8, 8377. [Google Scholar] [CrossRef] [PubMed]
- Hao, S.; Daemi, S.R.; Heenan, T.M.M.; Du, W.; Tan, C.; Storm, M.; Rau, C.; Brett, D.J.L.; Shearing, P.R. Tracking lithium penetration in solid electrolytes in 3D by in-situ synchrotron X-ray computed tomography. Nano Energy 2021, 82, 105744. [Google Scholar] [CrossRef]
- Marone, F.; Schlepütz, C.M.; Marti, S.; Fusseis, F.; Velásquez-Parra, A.; Griffa, M.; Jiménez-Martínez, J.; Dobson, K.J.; Stampanoni, M. Time Resolved in situ X-Ray Tomographic Microscopy Unraveling Dynamic Processes in Geologic Systems. Front. Earth Sci. 2020, 7, 346. [Google Scholar] [CrossRef]
- Singh, S.S.; Williams, J.J.; Stannard, T.J.; Xiao, X.; De Carlo, F.; Chawla, N. Measurement of localized corrosion rates at inclusion particles in AA7075 by in situ three dimensional (3D) X-ray synchrotron tomography. Corros. Sci. 2016, 104, 330–335. [Google Scholar] [CrossRef]
- Davis, G. Time-lapse x-ray microtomography for detecting small changes in local mineral concentration. In SPIE Optical Engineering + Applications-Developments in X-ray Tomography XII; Müller, B., Wang, G., Eds.; SPIE: San Diego, CA, USA, 2019. [Google Scholar] [CrossRef]
- Davis, G.R.; Mills, D.; Anderson, P. Real-time observations of tooth demineralization in 3 dimensions using X-ray microtomography. J. Dent. 2018, 69, 88–92. [Google Scholar] [CrossRef]
- Dowker, S.E.P.; Elliott, J.C.; Davis, G.R.; Wassif, H.S. Longitudinal Study of the Three-Dimensional Development of Subsurface Enamel Lesions during in vitro Demineralisation. Caries Res. 2003, 37, 237–245. [Google Scholar] [CrossRef]
- Featherstone, J.D.B.; O’Reilly, M.M.; Shariati, M.; Brugler, S. Enhancement of remineralisation in vitro and in vivo. In Proceedings of the Factors Relating to Demineralisation and Remineralisation of the Teeth: Proceedings of a Workshop October 5–10, 1985; Leach, S.A., Ed.; IRL: Antalya, Turkey, 1985; pp. 23–34. [Google Scholar]
- Featherstone, J.D.B.; Shariati, M.; Brugler, S.; Fu, J.; White, D.J. Effect of an Anticalculus Dentifrice on Lesion Progression under pH Cycling Conditions in vitro. Caries Res. 1988, 22, 337–341. [Google Scholar] [CrossRef]
- Rau, C.; Bodey, A.; Storm, M.; Cipiccia, S.; Marathe, S.; Zdora, M.-C.; Zanette, I.; Wagner, U.; Batey, D.; Shi, S. Micro- and nano-tomography at the DIAMOND beamline I13L imaging and coherence. In SPIE Optical Engineering + Applications-Developments in X-ray Tomography XI.; Müller, B., Wang, G., Eds.; SPIE: San Diego, CA, USA, 2017. [Google Scholar] [CrossRef]
- Rau, C.; Wagner, U.; Pešić, Z.; De Fanis, A. Coherent imaging at the Diamond beamline I13. Phys. Status Solidi (a) 2011, 208, 2522–2525. [Google Scholar] [CrossRef]
- Eisenburger, M.; Addy, M.; Hughes, J.A.; Shellis, R.P. Effect of Time on the Remineralisation of Enamel by Synthetic Saliva after Citric Acid Erosion. Caries Res. 2001, 35, 211–215. [Google Scholar] [CrossRef]
- Scientific, T. User’s Guide Avizo Software 2019; Thermo Fisher Scientific: Waltman, MA, USA, 2019. [Google Scholar]
- Rasband, W.S. ImageJ.; U.S. National Institutes of Health: Bethesda, MD, USA, 2018. Available online: https://imagej.nih.gov/ij/ (accessed on 20 March 2023).
- Schindelin, J.; Arganda-Carreras, I.; Frise, E.; Kaynig, V.; Longair, M.; Pietzsch, T.; Preibisch, S.; Rueden, C.; Saalfeld, S.; Schmid, B.; et al. Fiji: An open-source platform for biological-image analysis. Nat. Methods 2012, 9, 676–682. [Google Scholar] [CrossRef] [PubMed]
- Vitkov, L.; Kastner, M.; Kienberger, F.; Hinterdorfer, P.; Schilcher, K.; Grunert, I.; Dumfahrt, H.; Krautgartner, W.D. Correlations between AFM and SEM Imaging of Acid-Etched Tooth Enamel. Ultrastruct. Pathol. 2008, 32, 1–4. [Google Scholar] [CrossRef]
- Kastner, J.; Heinzl, C. X-ray tomography. In Handbook of Advanced Non-Destructive Evaluation; Ida, N., Meyendorf, N., Eds.; Springer Nature Switzerland AG: Cham, Switzerland, 2018; pp. 1–72. [Google Scholar] [CrossRef]
- Goldberg, M. Enamel softening (dental erosion)-enamel etching-the early enamel carious lesion. In Understanding Dental Caries; Goldberg, M., Ed.; Springer International Publishing: Cham, Switzerland, 2016; Chapter 2–4. [Google Scholar]
- Goldberg, M. Deciduous tooth and dental caries. Ann. Pediatr. Child Health 2017, 5, 1120. [Google Scholar]
- Shahani, A.J.; Xiao, X.; Lauridsen, E.M.; Voorhees, P.W. Characterization of metals in four dimensions. Mater. Res. Lett. 2020, 8, 462–476. [Google Scholar] [CrossRef]
- Shao, C.; Jin, B.; Mu, Z.; Lu, H.; Zhao, Y.; Wu, Z.; Yan, L.; Zhang, Z.; Zhou, Y.; Pan, H.; et al. Repair of tooth enamel by a biomimetic mineralization frontier ensuring epitaxial growth. Sci. Adv. 2019, 5, eaaw9569. [Google Scholar] [CrossRef] [PubMed]


| Technique | pH—Condition | Rate | Measurement | Reference |
|---|---|---|---|---|
| Tomography | 2.2 lactic acid | 0.54–5.58 nm·s−1 (see Figure 7) | Line profile after ~7.7 h | This study |
| Tomography | 2.2 lactic acid | 38.14 × 10¹⁰ nm3·s−1 (see Figure 4) | Volume after ~7 h 40 min | This study |
| SAXS | 2.2 lactic acid | 1.4 nm·s−1 | Line profile | [38] |
| Radiography | 2.2 lactic acid | 3.4 nm·s−1 | Line profile longest distance after 85 h | [31] |
| Tomography | 4 acetic acid | 1.45 × 10¹³ nm3·s−1 | Volume after 6 days | [51] |
| Tomography | 4 acetic acid | 1.5 nm·s−1 | Distance after 6 days | [51] |
| SEM | Remineralisation | 0.015 nm·s−1 | Distance | [66] |
Disclaimer/Publisher’s Note: The statements, opinions and data contained in all publications are solely those of the individual author(s) and contributor(s) and not of MDPI and/or the editor(s). MDPI and/or the editor(s) disclaim responsibility for any injury to people or property resulting from any ideas, methods, instructions or products referred to in the content. |
© 2023 by the authors. Licensee MDPI, Basel, Switzerland. This article is an open access article distributed under the terms and conditions of the Creative Commons Attribution (CC BY) license (https://creativecommons.org/licenses/by/4.0/).
Share and Cite
Besnard, C.; Marie, A.; Sasidharan, S.; Harper, R.A.; Marathe, S.; Moffat, J.; Shelton, R.M.; Landini, G.; Korsunsky, A.M. Time-Lapse In Situ 3D Imaging Analysis of Human Enamel Demineralisation Using X-ray Synchrotron Tomography. Dent. J. 2023, 11, 130. https://doi.org/10.3390/dj11050130
Besnard C, Marie A, Sasidharan S, Harper RA, Marathe S, Moffat J, Shelton RM, Landini G, Korsunsky AM. Time-Lapse In Situ 3D Imaging Analysis of Human Enamel Demineralisation Using X-ray Synchrotron Tomography. Dentistry Journal. 2023; 11(5):130. https://doi.org/10.3390/dj11050130
Chicago/Turabian StyleBesnard, Cyril, Ali Marie, Sisini Sasidharan, Robert A. Harper, Shashidhara Marathe, Jonathan Moffat, Richard M. Shelton, Gabriel Landini, and Alexander M. Korsunsky. 2023. "Time-Lapse In Situ 3D Imaging Analysis of Human Enamel Demineralisation Using X-ray Synchrotron Tomography" Dentistry Journal 11, no. 5: 130. https://doi.org/10.3390/dj11050130