Article

Effect of AST Atmosphere on Pt/C Electrocatalyst Degradation

1
Faculty of Chemistry, Southern Federal University, 7 Zorge St., Rostov-on-Don 344090, Russia
2
Research Institute of Physical Organic Chemistry, Southern Federal University, 194/2 Stachki St., Rostov-on-Don 344090, Russia
*
Author to whom correspondence should be addressed.
Inorganics 2023, 11(6), 237; https://doi.org/10.3390/inorganics11060237
Submission received: 1 May 2023 / Revised: 18 May 2023 / Accepted: 26 May 2023 / Published: 28 May 2023

Abstract

:
The targeted development of novel stress testing protocols as well as the production of highly active and stable catalysts require abandoning a trial-and-error approach and transitioning to identifying the principal degradation mechanisms of electrocatalysts for PEMFCs under various conditions. Methodological aspects of research related to both qualitative and quantitative assessment of the materials’ robustness against degradation and its mechanisms become the key issues. In this study, accelerated stress testing has been conducted in Ar and O2 to identify the influence of the atmosphere on the degradation and durability mechanisms of the Pt/C catalysts. Initial and final parameters after the AST have been studied in detail by transmission electron microscopy and voltammetry using the rotating disk electrode technique. The Ostwald ripening (redeposition) of platinum particles has been established to be the predominant degradation mechanism during the testing in an O2 atmosphere, this being the agglomeration of nanoparticles during the testing in Ar. An ultra-small size and a narrow size distribution of platinum nanoparticles, as well as their uniform spatial distribution over the surface of the carbon support, have been shown to allow both ORR activity to be increased and durability to be enhanced.

Graphical Abstract

1. Introduction

One of the key components of proton-exchange membrane fuel cells (PEMFCs) are the electrocatalysts included in porous catalytic layers [1,2]. The cell reactions, i.e., the hydrogen oxidation at the anode and the oxygen reduction (ORR) at the cathode, proceed on the surface of the catalyst. The higher the rate of these reactions, the better the functional characteristics (the electrochemically active surface area (ESA) and the ORR activity) of the electrocatalyst, hence the greater the power capacity and the longer the operating time of PEMFCs [2]. At the same time, the functional characteristics almost directly depend on the morphology and structure of the catalyst, i.e., the type of carbon support, the composition and size of nanoparticles (NPs), and their size and spatial distributions over the surface of the support. At the same time, during the operation of PEMFCs, the functional characteristics of the catalysts decrease due to their degradation [3].
The degradation of catalysts is associated with changes in their morphology and structure. A series of researchers have managed to identify principal mechanisms of changes in the morphology and structure of the catalyst, leading to a decrease in the catalytic activity, including (1) the Ostwald ripening (redeposition) [4,5,6,7]; (2) the agglomeration of NPs during their migration along the surface of the support [4,8]; (3) the change in the shape of NPs [9,10]; (4) the oxidation of the carbon support causing (5) the detachment of platinum NPs and the loss of their contact with the support [11,12]; (6) the poisoning of the platinum surface caused by the chemisorption of some compounds (e.g., CO or SO2 molecules) [13,14]; and (7) the dissolution of platinum atoms with their penetration deep into the electrolyte [15,16]. Moreover, during the accelerated stress testing (AST) at the upper potential limit (UPL) up to 1.0 V regarding the reversible hydrogen electrode (RHE), the redeposition, often referred to as Ostwald ripening, and agglomeration of NPs have been established to be the most pronounced mechanisms of the catalyst’s degradation [17]. At the same time, with an increase in the UPL of more than 1.0 V up to 1.4–1.6 V (RHE), the corrosion of the carbon support with the subsequent detachment of NPs [17,18] and the dissolution of platinum atoms [19] become the predominant degradation mechanisms.
In recent years, various AST protocols have been developed and actively applied to assess the durability of the catalysts [20,21]. Essentially, they are divided into protocols aimed at studying the catalyst’s durability at the UPL of about 1.0 V (RHE) [22,23,24] and the durability of the carbon support at the UPL of about 1.4–1.6 V (RHE) [25,26,27]. On the one hand, researchers use the AST protocol at the UPL of about 1.0 V (RHE) due to the correspondence of the potential window to the operation of PEMFCs, with the potential increase usually occurring when the device is started. For the same reason, the selection of an AST protocol may depend on the composition and structure of the materials used. For example, if the developed catalyst contains modified or composite supports, the AST protocol at the UPL of about 1.4–1.6 V (RHE) is used. If the support in the catalysts is the same, the AST protocol at the UPL of about 1.0 V (RHE) is used.
Unfortunately, when conducting the AST, a minor role is given to the atmosphere in which the testing is carried out. Nevertheless, the atmosphere, as well as the upper potential limit, may influence the predominance of one degradation mechanism over another [28], which may, in turn, lead to a difference in the durability of the same catalyst studied. The AST protocol recently developed and described in detail by Nagai et al. from the Toyota Research Institute [20] is believed to be of particular interest for testing the catalysts under conditions close to the operation of the membrane-electrode assembly (MEA). In this case, the stress testing is carried out in an oxygen atmosphere, which correlates well with the catalyst’s operation under real operating conditions in PEMFCs. Nevertheless, the question of whether the mechanisms of the catalyst’s degradation change during the transition from an inert atmosphere to an oxygen atmosphere is still unclear.
This research is aimed at studying in detail the effect of inert and oxygen atmospheres on the degradation processes of the Pt/C electrocatalysts by transmission electron microscopy (TEM) and voltammetry. Platinum–carbon materials with high morphological performance have been used as research objects. A feature of one of the samples is the narrow size dispersion of NPs as well as the uniformity of their spatial distribution over the surface of the support. A commonly used commercial analog has been chosen as the reference sample.
The feature of this study is assessing the morphological characteristics of the catalysts that influence changes in the materials during the AST. The question of what is necessary and paramount for predicting the parameters that provide the enhanced durability of the platinum–carbon electrocatalysts is addressed in this study.

2. Results and Discussion

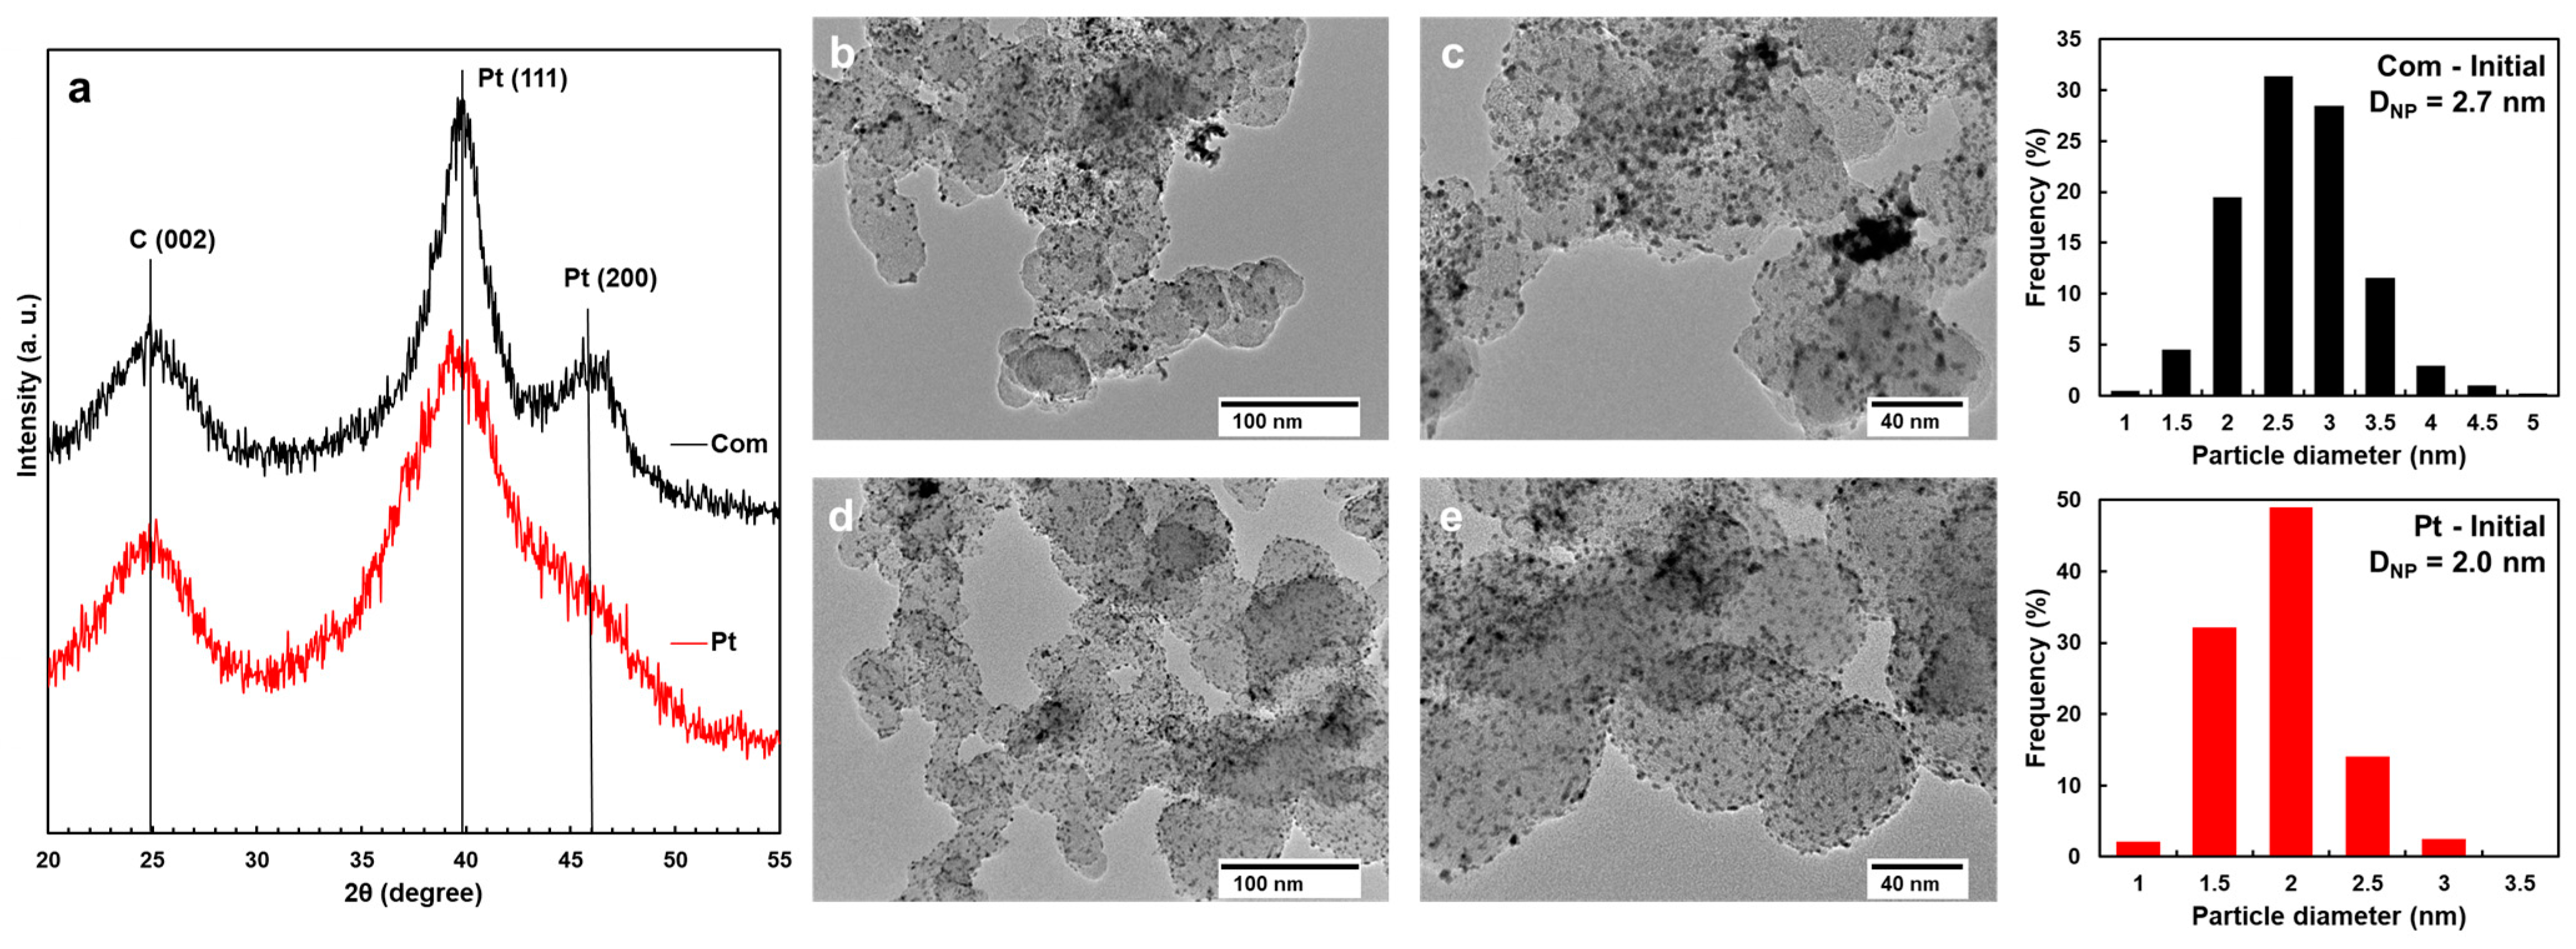
2.1. Initial Morphology, Structure, and Electrochemical Parameters of Pt/C Catalysts

To study the influence of the atmosphere (Ar or O2) of the AST, the wide-spread commercial catalyst HiSPEC 3000 with a 20% platinum loading, hereinafter referred to as Com, and the home-built Pt/C catalyst synthesized using the patented technology (patent No. RU2775979C1), hereinafter referred to as Pt, have been used.
According to the results of the thermogravimetric analysis, the mass fraction of platinum in the Pt sample is about 20% (Table 1). The average crystallite size of platinum calculated from the X-ray diffraction patterns presented in Figure 1 using the Scherrer equation (see Section 3.2.2, X-ray examination) for the commercial Com material has proven to be 1.2 nm larger than for the synthesized Pt sample (Table 1). The structure of platinum NPs in both catalysts corresponds to a face-centered cubic (FCC) structure.
The average size of NPs has been calculated, and the uniformity of their distribution over the surface of the carbon support has been estimated from TEM micrographs of the Pt/C materials studied (Figure 1b–e). The average size of NPs for the commercial Com catalyst is 2.7 nm, with a size distribution from 1 to 5 nm. At the same time, micrographs of randomly selected surface sections show the presence of a substantial number of large agglomerates larger than 10 nm. The synthesized Pt material is characterized by an average NP size of about 2.0 nm and a narrow size distribution from 1 to 3.5 nm, as well as a smaller number of agglomerates compared to the Com sample (Figure 1d,e).
Additionally, calculations using the simplified geometric model have been carried out to identify the specific number of NPs and the average inter-particle distance [29,30]. The calculation has shown that the Pt material is characterized by a greater number of NPs on the surface of the carbon support with an area of 1 m2 and a smaller inter-particle distance than the commercial Com analog (Table 1). This result indicates a more uniform distribution of NPs and a higher content of catalytically active centers of electrochemical transformations compared to the commercial Com sample. It is to be expected that the ESA and ORR mass activity values of the Pt material would be higher than those of the Com sample.
The ESA and ORR activities of the Pt and Com materials have been estimated by voltammetry. Cyclic voltammetry (CV) has been used to obtain the cyclic voltammograms (CVs) typical for Pt/C materials. The ESA values have been calculated from the charge amount consumed for the adsorption and desorption of hydrogen on the surface of platinum NPs in the hydrogen region (the potential range of 0.04–0.35 V (RHE)). In qualitative terms, it can be seen that the ESA of the Pt material is higher than that of the Com sample due to the fact that currents in the hydrogen region in CVs are higher, with currents in the double-layer region (the potential range of 0.35–0.55 V (RHE)) coinciding (Figure 2a,d and Figure S1). The calculated ESA values of the Pt material are 30 m2gPt−1 higher than those of the commercial Com analog, which correlates well with the average size of NPs and their specific number N (Table 1).
The ORR activity has been evaluated by linear sweep voltammetry (LSV) in the electrolyte of perchloric acid saturated with O2. The position of potentiodynamic curves and the Koutetsky–Levich dependence indicate a greater catalytic activity of the Pt sample compared to the Com analog (Figure 2b,c,e,f and Figure S1). The ORR mass activity values derived from the Koutetsky–Levich dependence have proven to be about 326 A gPt−1 and 257 A gPt−1 (Table 1) for the Pt and Com samples, respectively. A higher ORR activity of the Pt material is associated with a smaller size of NPs as well as their narrow size and uniform spatial distributions over the surface of the carbon support compared to the commercial Com analog (Table 1, Figure 1).

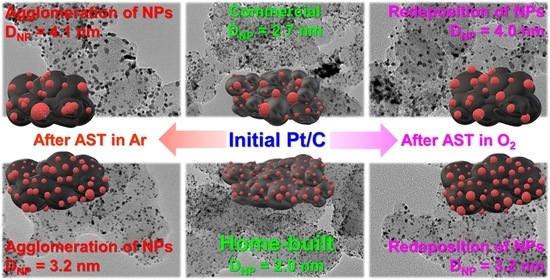
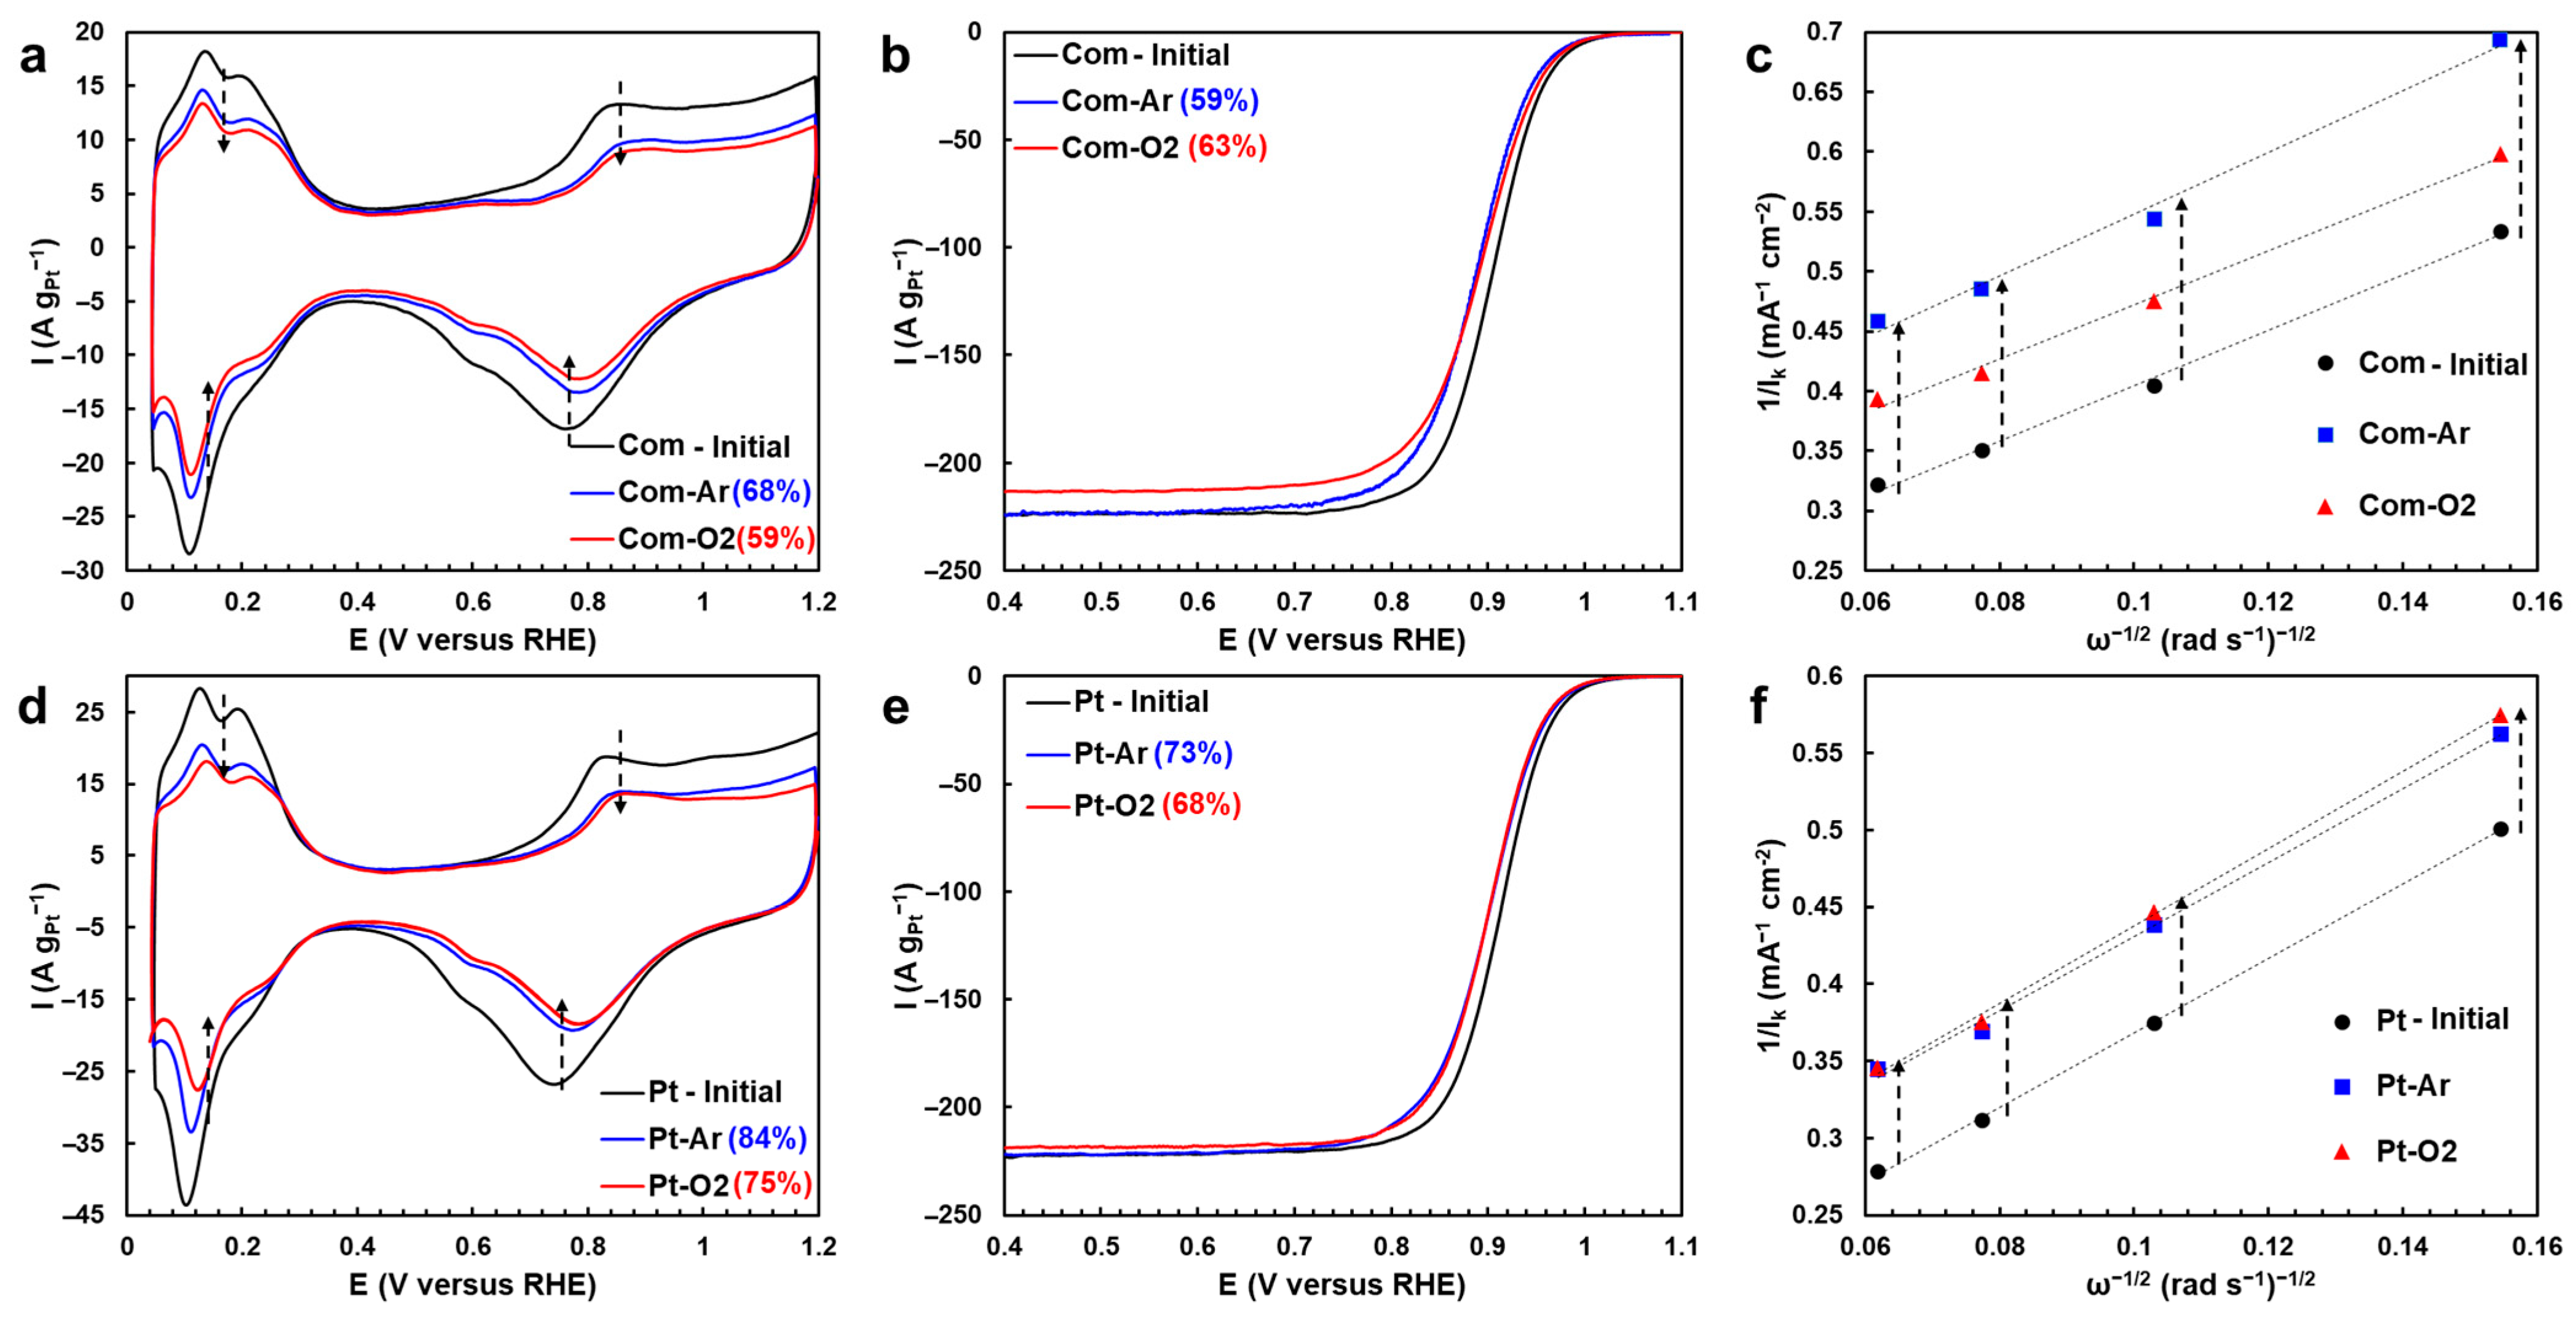
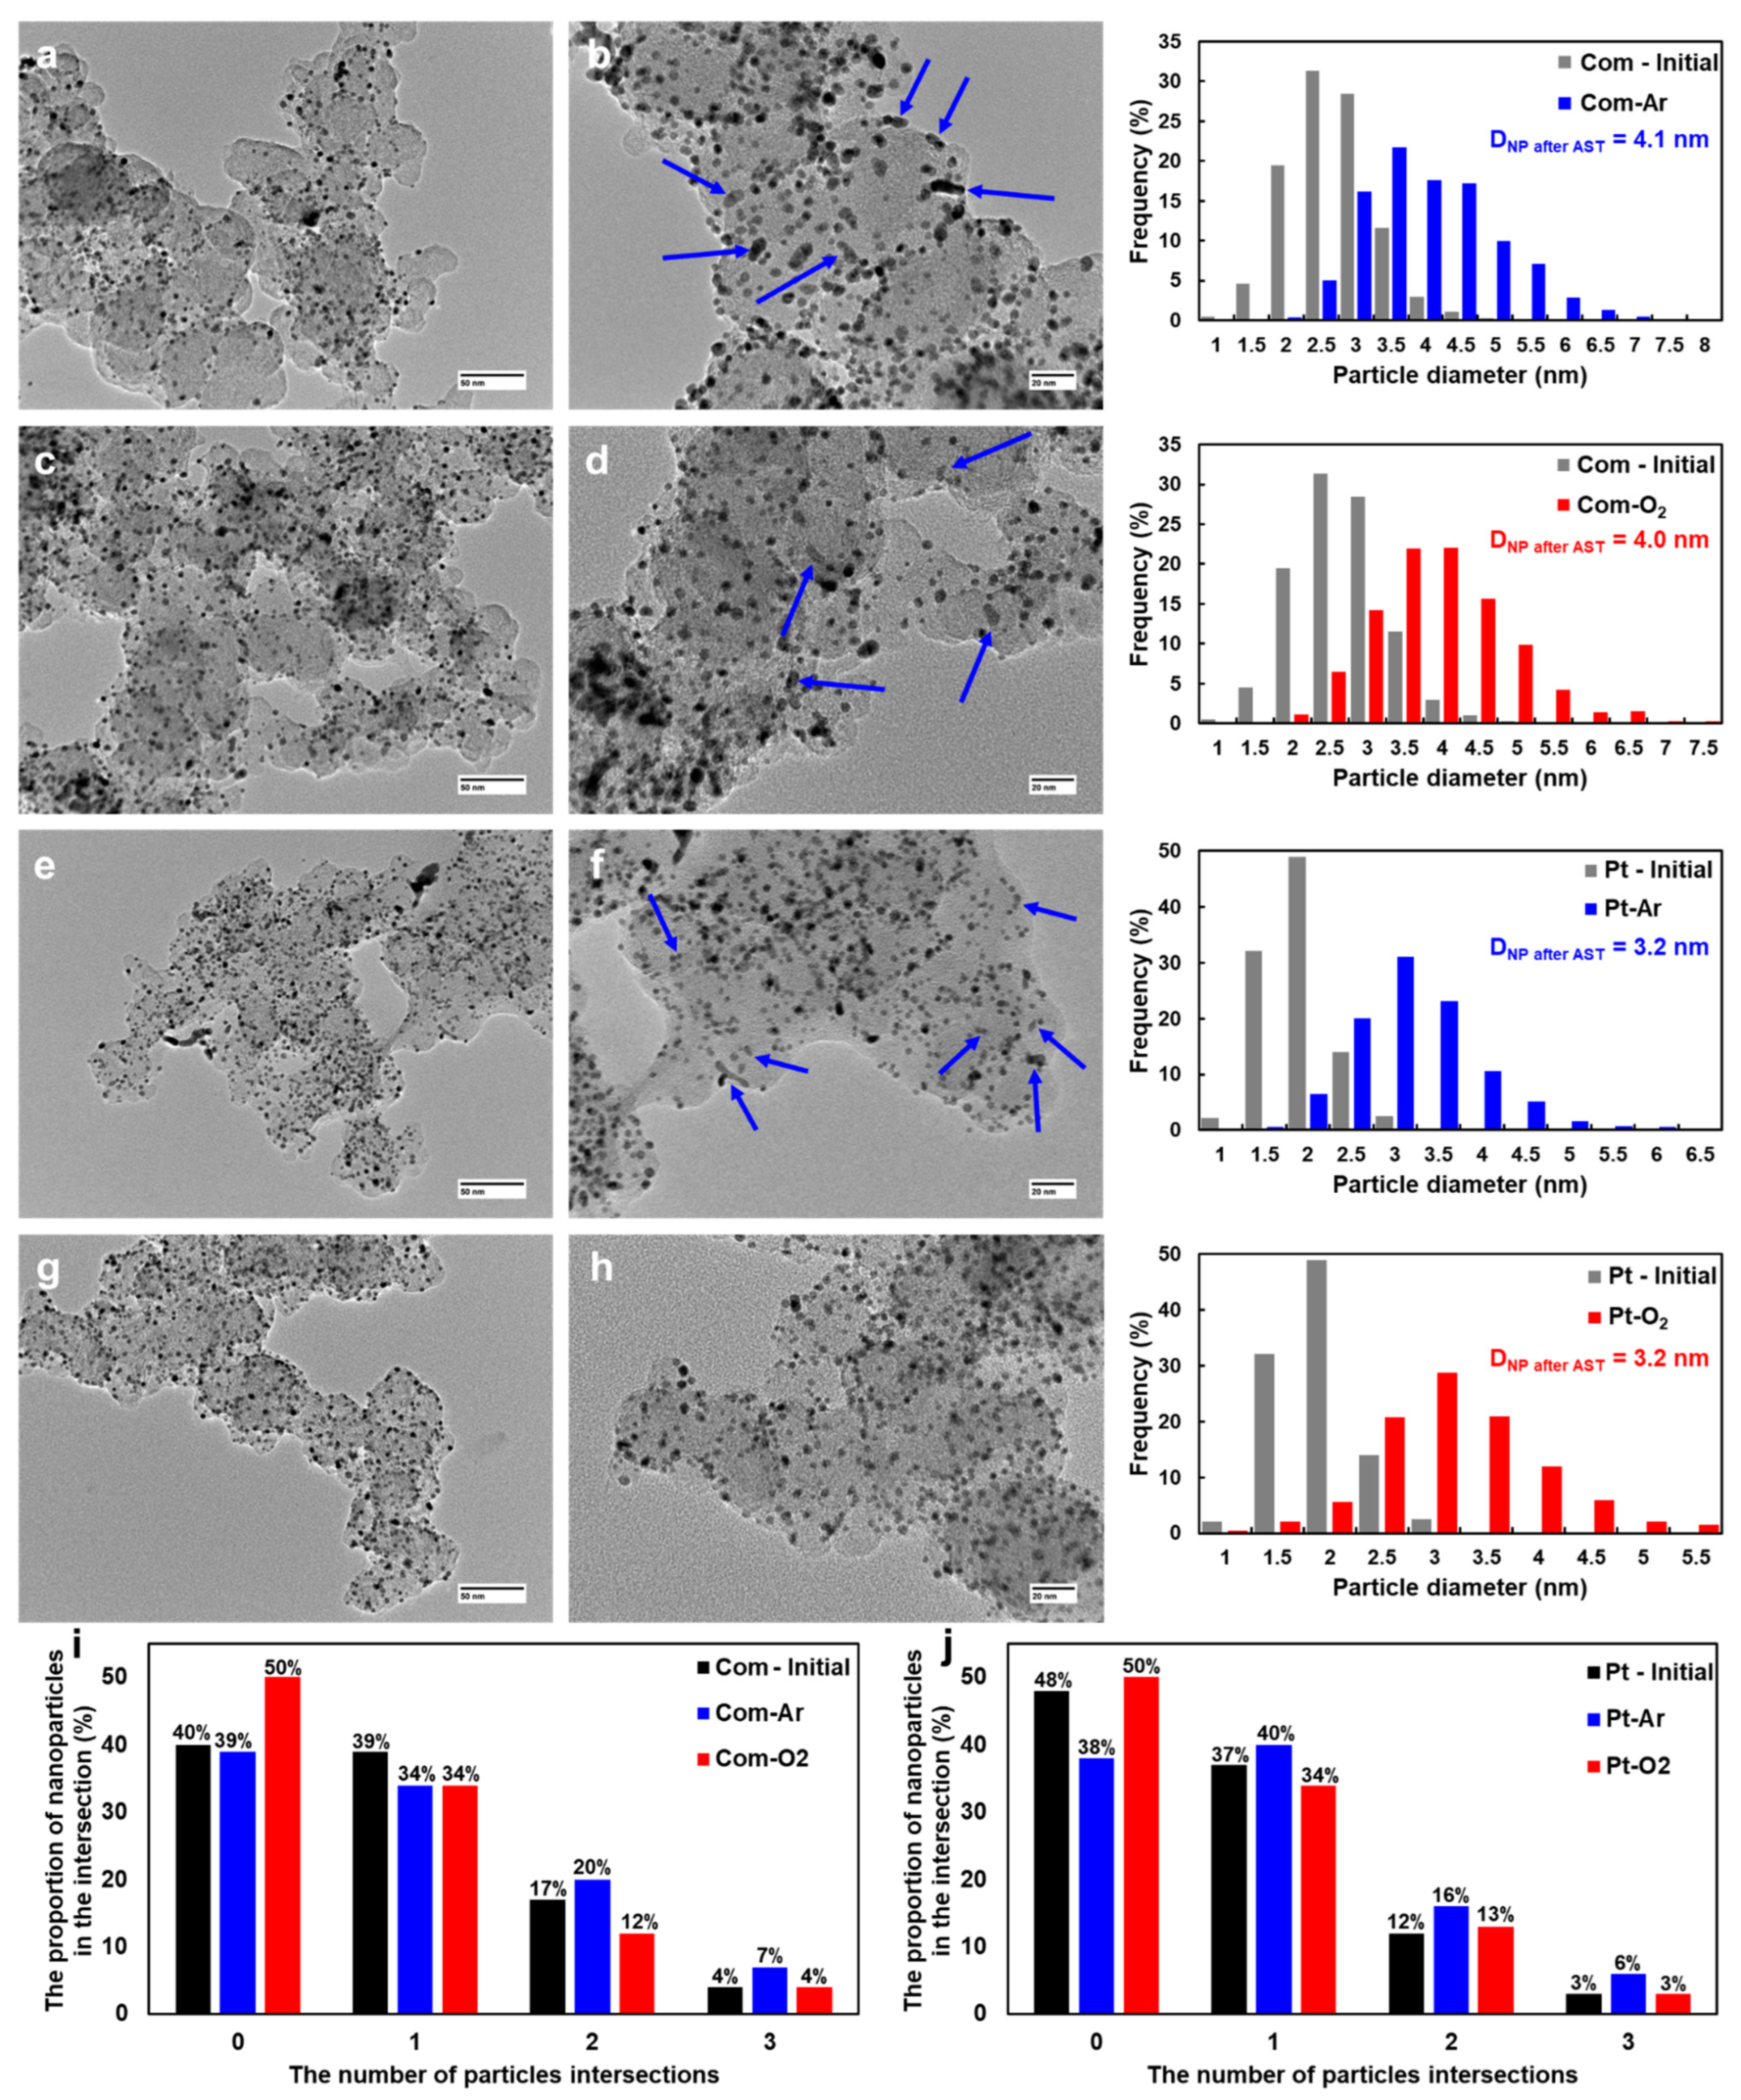
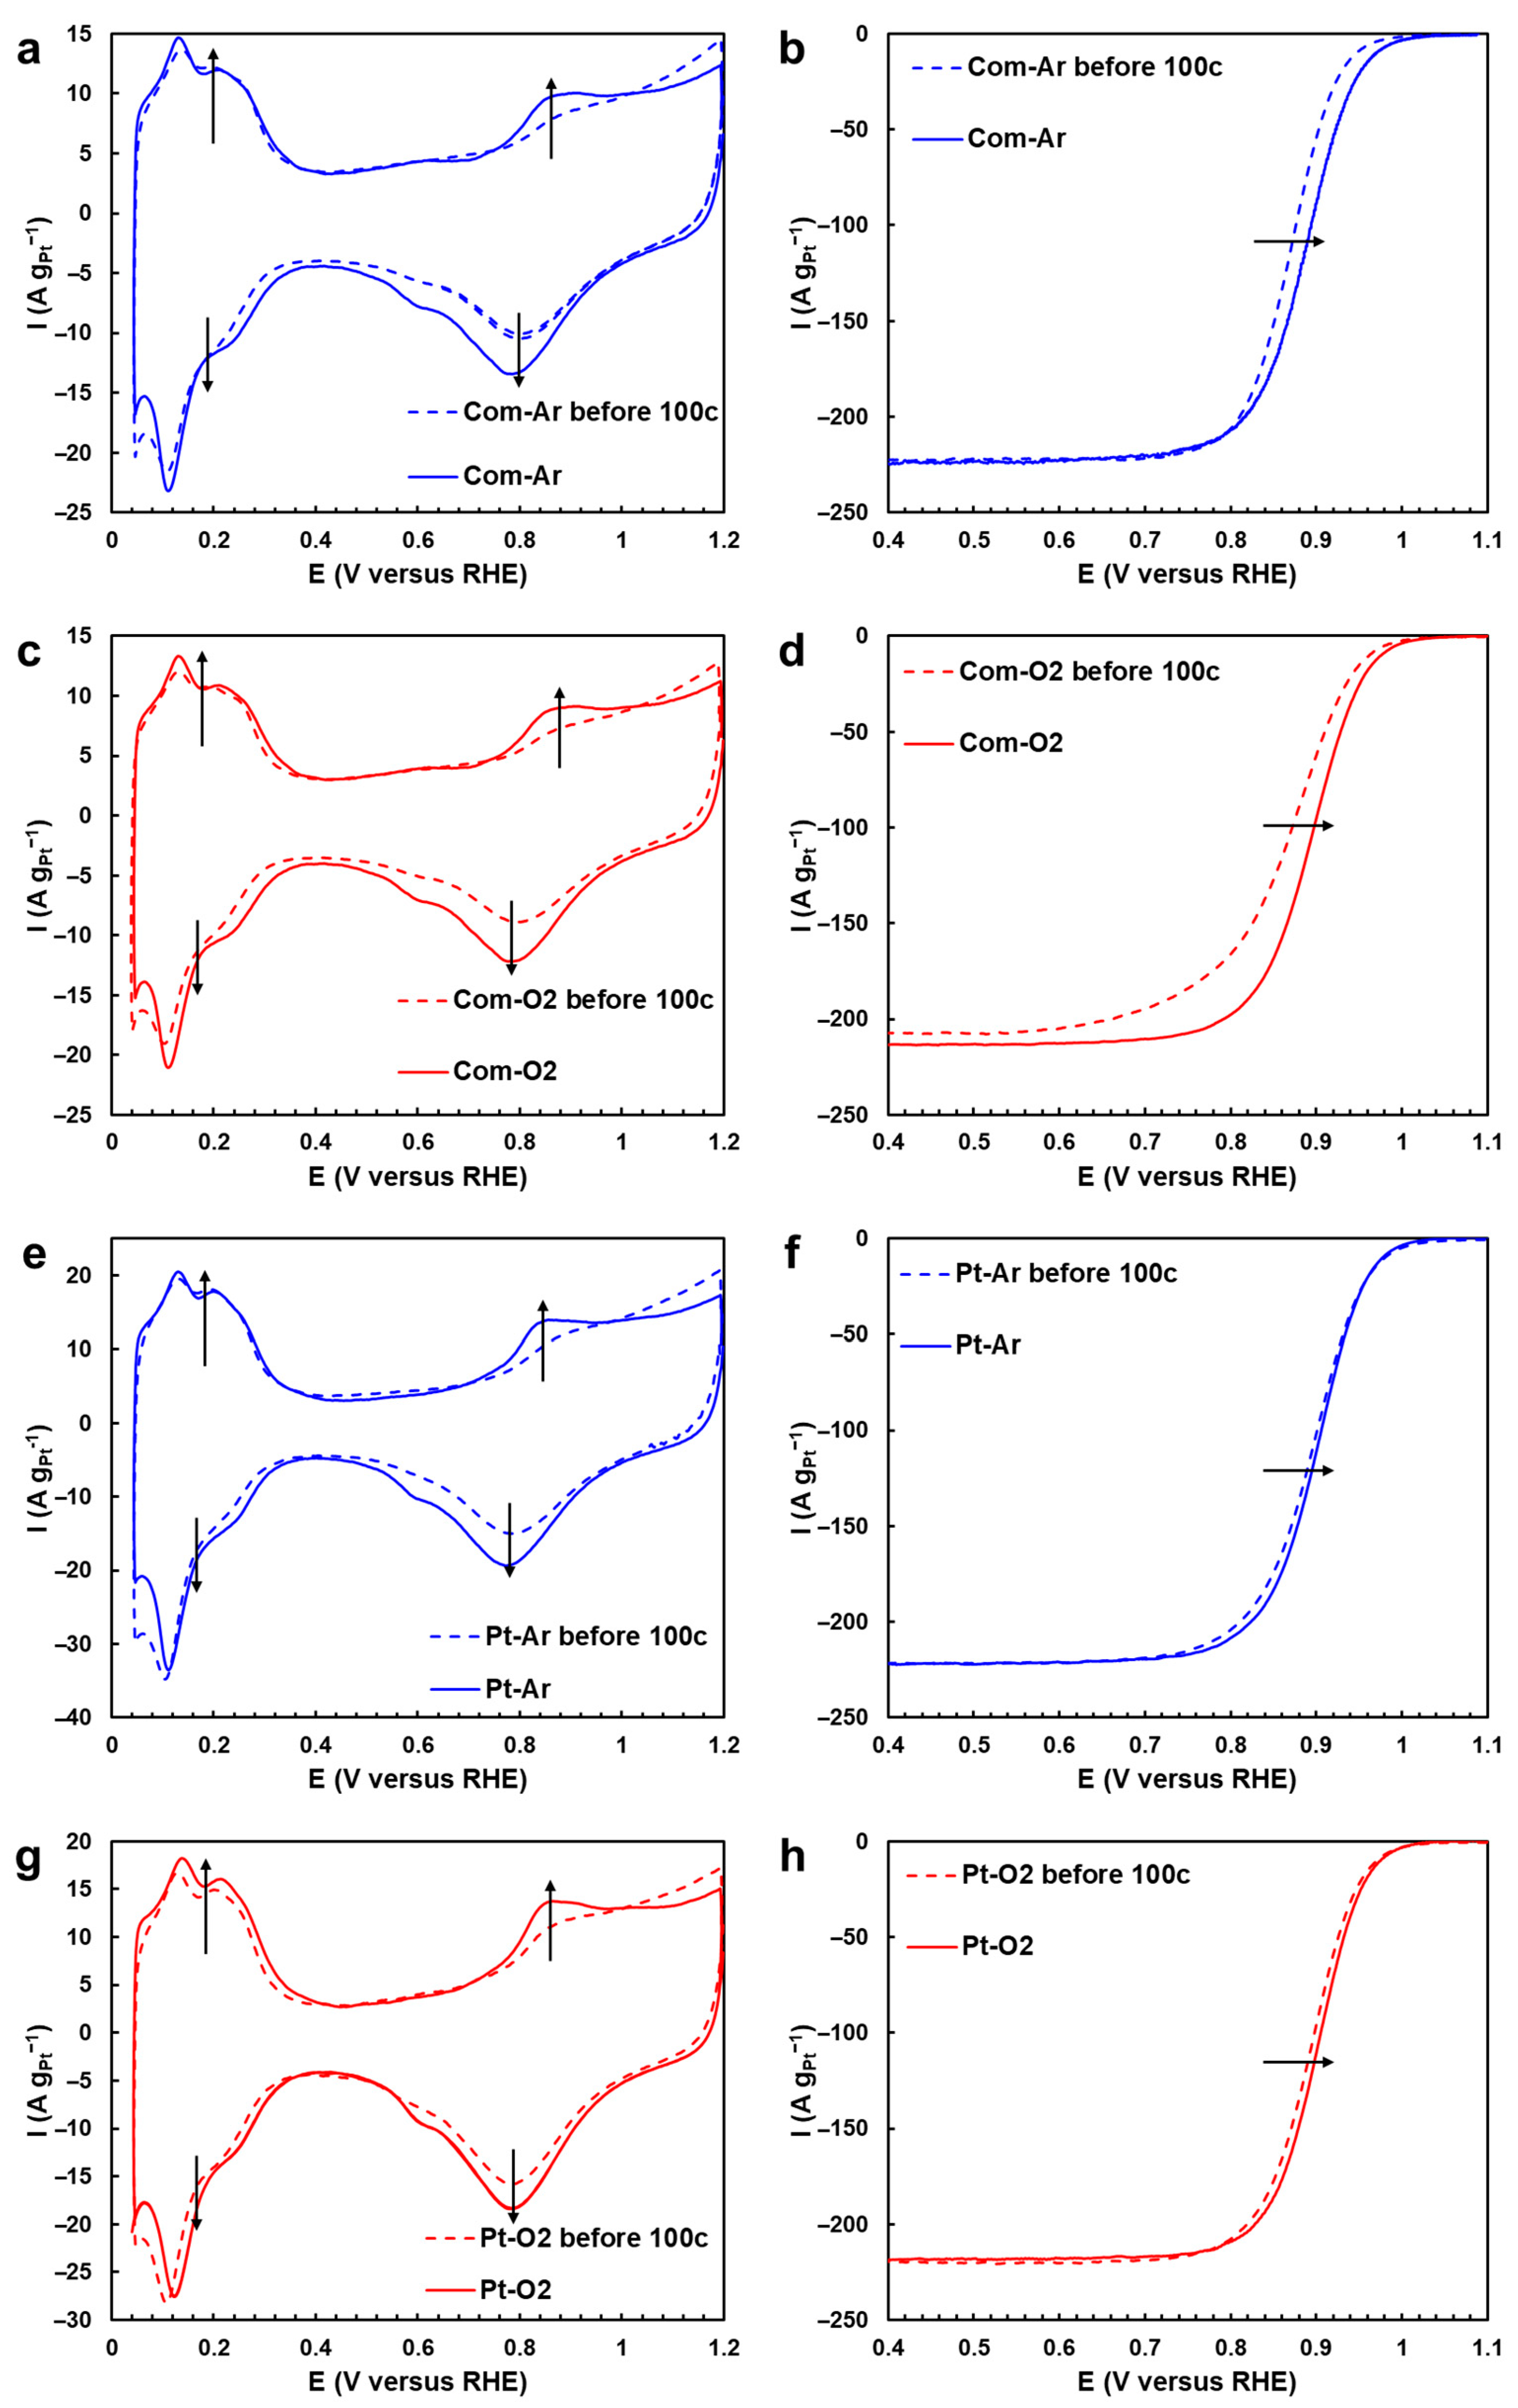
2.2. Changes in Morphology, Structure, and Electrochemical Parameters of Pt/C Samples after AST in Ar and O2

To assess the durability of the Pt/C materials and the influence of the atmosphere (Ar or O2), the AST protocol has been used, consisting of the potential hold of the potentials of 0.4 and 1.0 V (RHE) with a setting time of 3 s for 10,000 cycles [20].
After the AST, the catalytic layers consisting of the materials studied were removed from the end face of the rotating disk electrode (RDE) and examined by the TEM method. An additional TEM study has shown that all the materials are characterized by an increase in the average size of NPs, a broadening of the size dispersion, and the presence of a large number of agglomerates (Figure 3a–h). At the same time, a uniform distribution of platinum NPs over the surface of the carbon support is preserved in the Pt sample. The average size of NPs after the AST increases by 1.2 nm in the Pt sample regardless of the atmosphere used and by 1.4 and 1.3 nm in the Com sample in Ar and O2 atmospheres, respectively (Table 2). Regardless of the AST atmosphere, less than 10% of the NPs smaller than 2.5 nm are preserved in the Com sample, compared to about 25% in the Pt sample. At the same time, both materials are characterized by an increase in the “tail” in histograms of the size distribution towards larger sizes of NPs, indicating active processes of agglomeration and redeposition (Ostwald ripening) [5,10]. It is noteworthy that in order to separate the contribution of the agglomeration and Ostwald ripening to the overall degradation process, the authors [5,10] suggest comparing the proportion values of the NPs with a decreased size. For example, during Ostwald ripening (redeposition), the presence of particles smaller than their original size should be observed. The presence of these particles could not be confirmed by TEM micrographs. It should also be noted that Ostwald ripening is a directed process of the redeposition of platinum atoms from smaller particles to larger ones [31,32]. If most NPs have an equal size, the Ostwald ripening process is inhibited [33,34].
The histograms of the size distribution demonstrate an increase in the tail towards larger sizes of NPs for the Com material up to 8 and 7.5 nm in Ar and O2, respectively, this being up to 6.5 and 5.5 nm for the Pt sample (Figure 3, histograms of the size distribution). The difference in the “shift” towards larger sizes of NPs in various AST atmospheres may indicate the predominance of the agglomeration of NPs during the AST in an Ar atmosphere compared to the AST in O2. A series of studies also point out that during the agglomeration of particles, TEM micrographs demonstrate the presence of the “coalesced” NPs forming a bridge (necking) between two particles [5,10]. Similar coalesced particles have been found in micrographs for Com-Ar, Com-O2, and Pt-Ar (Figure 3b,d,f; the examples are indicated with blue arrows). At the same time, the number of these necking particles in the Com sample after the AST in O2 is less than after the AST in Ar, which also indicates the predominance of the agglomeration of NPs in this testing mode.
To assess the change in the spatial distribution of platinum NPs over the surface of the carbon support, the previously developed method of “accounting for proportions of overlapping particles” has been used [29]. This method consists of the quantitative identification of proportions of individual particles and those having intersections with one, two, or three “neighboring” particles. Figure 3i,j demonstrates histograms of the particle distribution by the number of intersections. It can be seen that the Pt material initially exhibits a more uniform distribution of NPs compared to the commercial Com analog due to a higher proportion of individual (without any intersections with their neighbors) NPs (Figure 3j). After the AST in Ar, the proportion of individual NPs decreases, whereas the proportion of the NPs that have intersections with one, two, or three neighbors increases to close values for the Pt and Com samples.
The change in NPs’ intersections after the AST in O2 is the same for both samples studied. An increase in the proportion of individual NPs is observed. The results obtained indicate the predominance of various degradation mechanisms in Ar and O2 atmospheres. An increase in the proportion of overlapping particles and a simultaneous decrease in the proportion of individual NPs in an Ar atmosphere indicate the pronounced agglomeration of NPs. It is noteworthy that the Pt-Ar sample is characterized by a 10% decrease in the proportion of individual particles, with proportions of overlapping particles steadily increasing by about 3% each. This material appears to be characterized by the primary agglomeration of individual particles. On the contrary, for the commercial Com analog, proportions of individual particles and those having one intersection decrease to a minor extent, with proportions of the particles with two and three intersections increasing.
The results of accounting for particles’ intersections after the AST in O2 for both the samples studied are almost identical, i.e., an increase in the proportion of individual particles with a simultaneous decrease in the proportion of overlapping ones, which indicates an active process of the redeposition of NPs. At the same time, for Com-O2, the proportion of individual particles increases by 10%, while the proportions of the NPs that have intersections with one and two neighboring particles decrease by 5%. This may in turn testify to the ongoing agglomeration process with the coalescence of two overlapping particles into one [5,35]. At the same time, the Pt sample is characterized by a slight change in the proportions of overlapping particles. This indicates the higher durability of the Pt catalyst during the AST in O2 compared to the Com material.
The calculation of the specific number of NPs and the average inter-particle distance after the AST has shown that the catalysts are characterized by a decrease in the number of NPs and an increase in the inter-particle distance compared to the initial data (Table 1 and Table 2). A decrease in the number of NPs is associated with both the processes of agglomeration and Ostwald ripening (redeposition) and the loss of NPs due to their detachment from the support caused by the oxidation of the carbon support during the AST. It is worth noting that regardless of the testing atmosphere, a larger number of particles per 1 m2 of the support surface are preserved in the Pt catalyst, while the average inter-particle distance is greater in the Pt catalyst than in the Com material after the identical stress testing.
After the stress testing, the residual values of the ESA and the ORR catalytic activity of the Pt/C catalysts have been evaluated (Figure 2). Notably, after the AST, regardless of the testing atmosphere, the catalysts require the refreshing of their surfaces [36]. After the stress testing, platinum NPs may be in an oxidized (PtOx) state, while their surface may also be contaminated with CO molecules formed during the oxidation of the carbon support [36]. For the refreshing of the catalytic layer, the electrolyte has been replaced with a freshly prepared one, and 100 rapid potential sweep cycles have been performed similarly to the activation stage (see 2.3.2 ESA determination). Figure 4 demonstrates typical CVs and potentiodynamic ORR curves before 100 cycles (dotted line) and after 100 cycles (solid line). After the refreshing stage, it can be seen that currents in the hydrogen and oxygen regions in CVs increase (Figure 4a,c,e,g; the examples are indicated with black arrows), while ORR curves demonstrate a shift to the high-potential region (Figure 4b,d,f,h; the examples are indicated with black arrows). Before 100 cycles of the refreshing stage, the Com catalyst after the AST in Ar and O2 exhibited ESA values of about 52 and 43 m2 gPt−1, respectively, with these values further increasing by about 4 m2 gPt−1 (Table 2). Meanwhile, the ESA values for the Pt-Ar and Pt-O2 catalysts have increased by 5 ± 1 m2 gPt−1 after the refreshing stage (Table 2). Similarly, after 100 cycles of the refreshing stage, the residual ORR mass activity increases by 75 ± 5 A gPt−1 for the Com material and by 40 ± 2 A gPt−1 for the Pt sample. To ensure reproducibility and increase the accuracy of the AST results, the refreshing stage needs to be conducted after each testing mode.
After the AST, regardless of the testing atmosphere, the ESA and ORR catalytic activity values decrease for both catalysts (Figure 2). Notably, the ESA decreases to a greater extent (by about 9 m2 gPt−1) after the AST in O2 compared to the AST in Ar (Table 2). At the same time, the nature of a decrease in the ORR mass activity after the AST in various atmospheres is different for both samples. For the Com material, after the AST in O2, the mass activity is preserved to a greater extent (by 11 A gPt−1) than after the AST in Ar (Table 2). On the contrary, for the Pt material, the Imass value is preserved to a greater extent (by 16 A gPt−1) after the AST in Ar than after the AST in O2 (Table 2). Nevertheless, the difference in the Imass value after the AST may be insignificant due to the error margin (see Section 3., Materials and Methods). The decrease in electrochemical parameters is primarily due to morphological changes in the samples, i.e., an increase in the average size of NPs, a broadening of the size dispersion, and a decrease in the number of NPs.
Regardless of the AST conditions, the home-built Pt/C catalyst is characterized by higher residual electrochemical characteristics and greater durability than the commercial Com analog (Table 2). This also correlates well with the results obtained by Sharma et al. [34] and Xu et al. [33]. A narrow size distribution and a uniform spatial distribution of platinum NPs over the surface of the carbon support appear to allow both increasing the catalytic activity and compensating for the smaller size of the NPs of the Pt sample compared to the commercial analog.

3. Materials and Methods

Vulcan XC-72 (Cabot Corporation, Boston, MA, USA) was used as the carbon support. H2PtCl6·6H2O (mass fraction of platinum 37.6%, extra-pure grade, Aurat), formaldehyde (37.2%, JSC Vekton), ethylene glycol (top grade, not less than 99.8%, Rehacor LLC, Boston, MA, USA), sodium hydroxide (Rehacor LLC, Boston, MA, USA), perchloric acid (60%, Sigma-Aldrich, St. Louis, MI, USA), and perfluorinated resin (Nafion DE1020, 10% aqueous dispersions, Poly-com) were also used in the experiment.

3.1. Preparation of Pt/C Catalysts

The Pt/C material [37] was obtained under UV irradiation at 80 °C in the aqueous organic medium containing the Vulcan XC-72 carbon support in the amount necessary to obtain 1 g of the product, the aqueous solution of H2PtCl6*6H2O in the amount necessary to obtain a 20% platinum loading in the product, ethylene glycol, and the aqueous solution of 1 M NaOH (to achieve the system pH equal to 12). The formaldehyde solution was used as the reducing agent.

3.2. Composition and Structural and Morphological Characteristics of Pt/C Catalysts

3.2.1. Thermogravimetry

The platinum mass fraction in the electrocatalyst was determined by gravimetry from the mass of the unburned residue. The error margin was ±1%.

3.2.2. X-ray Examination

The X-ray powder diffraction (XRD) method was used to study the structural characteristics of the Pt/C catalysts. The average crystallite size was calculated using the Scherrer formula, as described in [29]. The error margin was ±8%.

3.2.3. Transmission Electron Microscopy

The size of platinum NPs as well as the features of their size and spatial distributions were studied by high-resolution transmission electron microscopy (HRTEM). A detailed description of this procedure is presented in the Supplementary Materials (SM). Based on the results of the size determination, histograms of the platinum NPs’ size distribution in the catalysts were plotted. The error margin was ±0.2 nm.

3.3. Study of Electrochemical Characteristics

The catalysts’ electrochemical performance in a standard thermostated three-electrode cell was studied by cyclic voltammetry at 23 °C and constant room humidity of 40% using the VersaSTAT 3 potentiostat. It is essential that studies of different materials be performed under the same conditions [38]. A silver-chloride electrode was used as the reference electrode, whereas a platinum wire was used as the auxiliary one. All potentials were considered in this work regarding the RHE. A solution of 0.1 M HClO4 was used as the electrolyte [39].

3.3.1. Preparation of Catalytic Suspension

During the preparation of the catalytic suspension (catalytic “inks”), the sample weight was calculated, considering that the platinum weight should be 20 μg cmPt−2 when 8 μL of the catalytic suspension were successively applied to the electrode [40]. The Nafion polymer 1% aqueous emulsion and deionized water were then added with the introduction of isopropanol. The suspension was dispersed with ultrasound. An 8 μL aliquot of the inks was sampled with a pipette tip with constant stirring and applied to the end face of the polished and degreased glass–carbon disk with an area of 0.19625 cm2. The electrode was dried in air at a rotation speed of 700 rpm.

3.3.2. ESA Determination

Before electrochemical measurements, the electrode had been electrochemically activated by setting 100 current–voltage cycles in the potential range from 0.04 to 1.2 V at a scanning rate of 200 mV s−1 in a solution of 0.1 M HClO4 in an argon atmosphere [29]. Two CVs were recorded in the potential range from 0.04 to 1.2 V and from 0.04 to 1.0 V, respectively, at a scanning rate of 20 mV s−1. The ESA was further calculated depending on the charge amount consumed for the adsorption/desorption of hydrogen (see the SM) [29,41]. The error margin was ±10%.

3.3.3. ORR Activity Determination

The electrolyte was saturated with oxygen for 1 h to determine the ORR activity of the catalysts. Voltammograms were then measured in the potential range from 0.02 to 1.1 V with a linear potential sweep at a rate of 20 mV s−1. The RDE rotation speeds were 400, 900, 1600, and 2500 rpm. The kinetic current at the potential of 0.90 V was calculated according to Koutetsky–Levich plots (Figure S1c) [42]. The ORR performance of the catalysts was estimated according to the value of the mass (Imass) activity. The error margin was ±10 %.

3.4. AST Protocols

The catalysts’ durability was studied within two protocols of the AST. These are the AST protocols in Ar (Com-Ar and Pt-Ar) or O2 (Com-O2 and Pt-O2) atmospheres on the stationary electrode in the potential range from 0.4 to 1.0 V, with the setting time equal to 3 s at the end potentials during 10,000 cycles. After 10,000 cycles, two CVs were recorded in the potential range from 0.04 to 1.2 V at a scanning rate of 20 mV s−1 for the ESA value to be further calculated. Next, voltammograms were measured in the potential range from 0.1 to 1.1 V with a linear potential sweep at a rate of 20 mV s−1. The RDE rotation speeds were 400, 900, 1600, and 2500 rpm. Further, Imass was calculated.
The relative stability was assessed by changing the ESA values (1):
Relative Stability = ESAafter AST × 100/ESA0, %
where ESAafter AST is the electrochemically active surface area of the material after 10,000 cycles of stress testing,
ESA0 is the initial electrochemically active surface area of the material.
The calculation of the change in the Imass values was conducted similarly.

4. Conclusions

As a result of a detailed study of the morphology and electrochemical characteristics of the catalysts before and after the AST, the agglomeration of NPs has been established to be the predominant degradation mechanism during the testing in an Ar atmosphere, with the redeposition of platinum during the testing in O2. Moreover, for materials with a nonuniform particle distribution, these degradation mechanisms may prevail equally.
The home-built Pt catalyst is characterized by higher initial and residual electrochemical characteristics after the AST in Ar and O2 than the commercial Com analog. The change in morphological parameters of the Pt catalyst after the AST in Ar and O2 is less pronounced compared to those of the commercial Com analog. The study carried out is believed to indicate that the durability of the Pt/C catalysts is primarily influenced by structural and morphological characteristics compared to the AST conditions. Obtaining the equally sized and uniformly distributed ultra-small platinum NPs over the surface of the support may be one of the most relevant methods to increase the catalysts’ durability. The proposed method to obtain the materials with equally sized and uniformly distributed over the support surface ultra-small platinum NPs can be used to obtain the materials with various platinum loadings to achieve the desired one for use in PEMFCs.
The final refreshing of the surface has been shown to be an important stage of the AST to determine the true values of the ESA and the ORR activity of the catalysts, without considering the influence of impurities present on the surface of the catalysts during the stress testing.
To identify trends in the production of highly stable catalysts for PEMFCs, it is necessary to analyze changes in morphological and electrochemical parameters of the materials with different sizes of NPs, various size dispersions and spatial distributions of platinum particles over the surface of the carbon support, and different mass fractions of platinum after the AST by the facile combined methods proposed for the collection of statistical data.

Supplementary Materials

The following supporting information can be downloaded at: https://www.mdpi.com/article/10.3390/inorganics11060237/s1, Figure S1: The cyclic voltammograms (a) of the Pt (red color) and Com (black color) samples. The potential sweep rate is 20 mV s–1. The second cycle. The electrolyte is the 0.1 M HClO4 solution saturated with Ar at atmospheric pressure. The potentiodynamic polarization curves of the ORR (b) for the Pt (red color) and Com (black color) samples. The RDE rotation speed is 1,600 rpm. 0.1 M HClO4. O2 atmosphere. The dependence of 1/Ik on the RDE rotation speed in the Koutetsky–Levich coordinates (c) where Ik is the current on the disk electrode with the area of 0.19625 cm2.

Author Contributions

Conceptualization, K.P. and A.A.; methodology, A.A.; software, I.P.; validation, K.P., S.B. and A.A.; formal analysis, K.P.; investigation, A.A.; resources, E.M.; data curation, E.M.; writing—original draft preparation, K.P.; writing—review and editing, A.A.; visualization, K.P.; supervision, K.P.; project administration, A.A.; funding acquisition, A.A. All authors have read and agreed to the published version of the manuscript.

Funding

This study conducted at the Southern Federal University was financially supported by the Russian Science Foundation (grant No. 21-79-00258, https://rscf.ru/project/21-79-00258/, accessed on 17 May 2023).

Institutional Review Board Statement

Not applicable.

Informed Consent Statement

Not applicable.

Data Availability Statement

Not applicable.

Acknowledgments

The authors are grateful to Maltsev, A.V. for the support in translation and editing processes and the assistance in communication with the editorial board. The authors are grateful to the Shared Use Center “High-Resolution Transmission Electron Microscopy” (SFedU) for conducting the TEM and EDX studies.

Conflicts of Interest

The authors declare no conflict of interest.

References

  1. Uchida, M. PEFC catalyst layers: Effect of support microstructure on both distributions of Pt and ionomer and cell performance and durability. Curr. Opin. Electrochem. 2020, 21, 209–218. [Google Scholar] [CrossRef]
  2. Wang, F.C.; Peng, C.H. The development of an exchangeable PEMFC power module for electric vehicles. Int. J. Hydrogen Energy 2014, 39, 3855–3867. [Google Scholar] [CrossRef]
  3. He, W.; Xiang, Y.; Xin, M.; Qiu, L.; Dong, W.; Zhao, W.; Diao, Y.; Zheng, A.; Xu, G. Investigation of multiple commercial electrocatalysts and electrocatalyst degradation for fuel cells in real vehicles. RSC Adv. 2022, 12, 32374–32382. [Google Scholar] [CrossRef] [PubMed]
  4. Yu, K.; Groom, D.J.; Wang, X.; Yang, Z.; Gummalla, M.; Ball, S.C.; Myers, D.J.; Ferreira, P.J. Degradation Mechanisms of Platinum Nanoparticle Catalysts in Proton Exchange Membrane Fuel Cells: The Role of Particle Size. Chem. Mater. 2014, 26, 5540–5548. [Google Scholar] [CrossRef]
  5. Shao-Horn, Y.; Ferreira, P.; la O’, G.; Morgan, D.; Gasteiger, H.A.; Makharia, R. Coarsening of Pt Nanoparticles in Proton Exchange Membrane Fuel Cells upon Potential Cycling. ECS Trans. 2006, 1, 185–195. [Google Scholar] [CrossRef]
  6. Ferreira, P.J.; la O’, G.J.; Shao-Horn, Y.; Morgan, D.; Makharia, R.; Kocha, S.; Gasteiger, H.A. Instability of Pt∕C Electrocatalysts in Proton Exchange Membrane Fuel Cells: A Mechanistic Investigation. J. Electrochem. Soc. 2005, 152, A2256–A2271. [Google Scholar] [CrossRef] [Green Version]
  7. Marcu, A.; Toth, G.; Kundu, S.; Colmenares, L.; Behm, R. Ex situ testing method to characterize cathode catalysts degradation under simulated start-up/shut-down conditions—A contribution to polymer electrolyte membrane fuel cell benchmarking. J. Power Sources 2012, 215, 266–273. [Google Scholar] [CrossRef]
  8. Peng, J.; Tao, P.; Song, C.; Shang, W.; Deng, T.; Wu, J. Structural evolution of Pt-based oxygen reduction reaction electrocatalysts. Chin. J. Catal. 2021, 43, 47–58. [Google Scholar] [CrossRef]
  9. Arán-Ais, R.M.; Yu, Y.; Hovden, R.; Solla-Gullón, J.; Herrero, E.; Feliu, J.M.; Abruña, H.D. Identical Location Transmission Electron Microscopy Imaging of Site-Selective Pt Nanocatalysts: Electrochemical Activation and Surface Disordering. J. Am. Chem. Soc. 2015, 137, 14992–14998. [Google Scholar] [CrossRef] [PubMed] [Green Version]
  10. Meier, J.C.; Galeano, C.; Katsounaros, I.; Topalov, A.A.; Kostka, A.; Schüth, F.; Mayrhofer, K.J.J. Degradation Mechanisms of Pt/C Fuel Cell Catalysts under Simulated Start–Stop Conditions. ACS Catal. 2012, 2, 832–843. [Google Scholar] [CrossRef]
  11. Angel, G.M.A.; Mansor, N.; Jervis, R.; Rana, Z.; Gibbs, C.; Seel, A.; Kilpatrick, A.F.R.; Shearing, P.R.; Howard, C.A.; Brett, D.J.L.; et al. Realising the electrochemical stability of graphene: Scalable synthesis of an ultra-durable platinum catalyst for the oxygen reduction reaction. Nanoscale 2020, 12, 16113–16122. [Google Scholar] [CrossRef]
  12. Spasov, D.D.; Ivanova, N.A.; Pushkarev, A.S.; Pushkareva, I.V.; Presnyakova, N.N.; Chumakov, R.G.; Presnyakov, M.Y.; Grigoriev, S.A.; Fateev, V.N. On the Influence of Composition and Structure of Carbon-Supported Pt-SnO2 Hetero-Clusters onto Their Electrocatalytic Activity and Durability in PEMFC. Catalysts 2019, 9, 803. [Google Scholar] [CrossRef] [Green Version]
  13. Reshetenko, T.V.; Bethune, K.; Rubio, M.A.; Rocheleau, R. Study of low concentration CO poisoning of Pt anode in a proton exchange membrane fuel cell using spatial electrochemical impedance spectroscopy. J. Power Sources 2014, 269, 344–362. [Google Scholar] [CrossRef]
  14. Reshetenko, T.V. Impacts of operating conditions on the recovery of proton exchange membrane fuel cells exposed to sulfur dioxide in an air stream. J. Power Sources 2023, 559, 232676. [Google Scholar] [CrossRef]
  15. Cherevko, S.; Keeley, G.P.; Geiger, S.; Zeradjanin, A.R.; Hodnik, N.; Kulyk, N.; Mayrhofer, K.J.J. Dissolution of Platinum in the Operational Range of Fuel Cells. Chemelectrochem 2015, 2, 1471–1478. [Google Scholar] [CrossRef] [Green Version]
  16. Pavlišič, A.; Jovanovič, P.; Šelih, V.S.; Šala, M.; Hodnik, N.; Gaberšček, M. Platinum Dissolution and Redeposition from Pt/C Fuel Cell Electrocatalyst at Potential Cycling. J. Electrochem. Soc. 2018, 165, F3161–F3165. [Google Scholar] [CrossRef]
  17. Zhang, J.; Yuan, Y.; Gao, L.; Zeng, G.; Li, M.; Huang, H. Stabilizing Pt-Based Electrocatalysts for Oxygen Reduction Reaction: Fundamental Understanding and Design Strategies. Adv. Mater. 2021, 33, e2006494. [Google Scholar] [CrossRef] [PubMed]
  18. Speder, J.; Zana, A.; Spanos, I.; Kirkensgaard, J.J.; Mortensen, K.; Arenz, M. On the influence of the Pt to carbon ratio on the degradation of high surface area carbon supported PEM fuel cell electrocatalysts. Electrochem. Commun. 2013, 34, 153–156. [Google Scholar] [CrossRef]
  19. Jovanovič, P.; Pavlišič, A.; Šelih, V.S.; Šala, M.; Hodnik, N.; Bele, M.; Hočevar, S.; Gaberšček, M. New Insight into Platinum Dissolution from Nanoparticulate Platinum-Based Electrocatalysts Using Highly Sensitive In Situ Concentration Measurements. Chemcatchem 2014, 6, 449–453. [Google Scholar] [CrossRef]
  20. Nagai, T.; Jahn, C.; Jia, H. Improved Accelerated Stress Tests for ORR Catalysts Using a Rotating Disk Electrode. J. Electrochem. Soc. 2019, 166, F3111–F3115. [Google Scholar] [CrossRef]
  21. Bhattacharya, D.; Wang, K.; Wu, G.-P.; Arges, C. Extended-Surface Thin Film Platinum Electrocatalysts with Tunable Nanostructured Morphologies. ChemRxiv 2023. [Google Scholar] [CrossRef]
  22. Yano, H.; Watanabe, M.; Iiyama, A.; Uchida, H. Particle-size effect of Pt cathode catalysts on durability in fuel cells. Nano Energy 2016, 29, 323–333. [Google Scholar] [CrossRef]
  23. Liu, D.; Gao, S.; Xu, J.; Zhang, X.; Yang, Z.; Yang, T.; Wang, B.; Yang, S.; Liang, C.; Kong, C. Boron induced strong metal-support interaction for high sintering resistance of Pt-based catalysts toward oxygen reduction reaction. Appl. Surf. Sci. 2022, 604, 154466. [Google Scholar] [CrossRef]
  24. Takimoto, D.; Toma, S.; Suda, Y.; Shirokura, T.; Tokura, Y.; Fukuda, K.; Matsumoto, M.; Imai, H.; Sugimoto, W. Platinum nanosheets synthesized via topotactic reduction of single-layer platinum oxide nanosheets for electrocatalysis. Nat. Commun. 2023, 14, 1–9. [Google Scholar] [CrossRef]
  25. Cheng, T.; Tan, X.; Chen, L.; Zhao, X.; Kotegawa, F.; Huang, J.; Liu, Y.; Jiang, H.; Harada, M.; Wang, Y. A Robust Electrocatalyst for Oxygen Reduction Reaction Assembled with Pt Nanoclusters and a Melem-Modified Carbon Support. Energy Technol. 2022, 10, 2200680. [Google Scholar] [CrossRef]
  26. Rotating Disk-Electrode Aqueous Electrolyte Accelerated Stress Tests for PGM Electrocatalyst/Support Durability Evaluation DOE Durability Working Group 10/4/2011 2011. Available online: https://www.energy.gov/eere/fuelcells/articles/rotating-disk-electrode-aqueous-electrolyte-accelerated-stress-tests-pgm (accessed on 29 January 2023).
  27. Hodnik, N.; Jozinović, B.; Zorko, M.; Gaberšček, M. Stability of Commercial Pt/C Low Temperature Fuel Cell Catalyst: Electro-chemical IL-SEM Study. Acta Chim. Slov. 2014, 61, 280–283. [Google Scholar]
  28. Zhao, Z.; Dubau, L.; Maillard, F. Evidences of the migration of Pt crystallites on high surface area carbon supports in the presence of reducing molecules. J. Power Sources 2012, 217, 449–458. [Google Scholar] [CrossRef]
  29. Paperzh, K.O.; Alekseenko, A.A.; Volochaev, V.A.; Pankov, I.V.; Safronenko, O.A.; Guterman, V.E. Stability and activity of platinum nanoparticles in the oxygen electroreduction reaction: Is size or uniformity of primary importance? Beilstein J. Nanotechnol. 2021, 12, 593–606. [Google Scholar] [CrossRef]
  30. Paperzh, K.; Alekseenko, A.; Danilenko, M.; Pankov, I.; Guterman, V.E. Advanced Methods of Controlling the Morphology, Activity, and Durability of Pt/C Electrocatalysts. ACS Appl. Energy Mater. 2022, 5, 9530–9541. [Google Scholar] [CrossRef]
  31. Yamashita, Y.; Miyahara, R.; Sakamoto, K. Emulsion and Emulsification Technology. Cosmet. Sci. Technol. Theor. Princ. Appl. 2017, 489–506. [Google Scholar]
  32. Arenz, M.; Quinson, J. Degradation of Metal Clusters and Nanoparticles Under Electrochemical Control. Encycl. Interfacial Chem. Surf. Sci. Electrochem. 2018, 434–441. [Google Scholar] [CrossRef]
  33. Xu, S.; Kim, Y.; Park, J.; Higgins, D.; Shen, S.-J.; Schindler, P.; Thian, D.; Provine, J.; Torgersen, J.; Graf, T.; et al. Extending the limits of Pt/C catalysts with passivation-gas-incorporated atomic layer deposition. Nat. Catal. 2018, 1, 624–630. [Google Scholar] [CrossRef]
  34. Sharma, R.; Gyergyek, S.; Chamier, J.; Morgen, P.; Andersen, S.M. Pt/C Electrocatalyst Durability Enhancement by Inhibition of Pt Nanoparticle Growth Through Microwave Pretreatment of Carbon Support. Chemelectrochem 2021, 8, 1183–1195. [Google Scholar] [CrossRef]
  35. Shokhen, V.; Strandberg, L.; Skoglundh, M.; Wickman, B. Impact of Accelerated Stress Tests on the Cathodic Catalytic Layer in a Proton Exchange Membrane (PEM) Fuel Cell Studied by Identical Location Scanning Electron Microscopy. ACS Appl. Energy Mater. 2022, 5, 11200–11212. [Google Scholar] [CrossRef]
  36. Zhang, Y.; Chen, S.; Wang, Y.; Ding, W.; Wu, R.; Li, L.; Qi, X.; Wei, Z. Study of the degradation mechanisms of carbon-supported platinum fuel cells catalyst via different accelerated stress test. J. Power Sources 2015, 273, 62–69. [Google Scholar] [CrossRef]
  37. Paperzh, K.; Alekseenko, A.; Safronenko, O.; Nikulin, A.; Pankov, I.; Guterman, V. UV radiation effect on the microstructure and performance of electrocatalysts based on small Pt nanoparticles synthesized in the liquid phase. Colloid Interface Sci. Commun. 2021, 45, 100517. [Google Scholar] [CrossRef]
  38. Đukić, T.; Moriau, L.J.; Pavko, L.; Kostelec, M.; Prokop, M.; Ruiz-Zepeda, F.; Šala, M.; Dražić, G.; Gatalo, M.; Hodnik, N. Understanding the Crucial Significance of the Temperature and Potential Window on the Stability of Carbon Supported Pt-Alloy Nanoparticles as Oxygen Reduction Reaction Electrocatalysts. ACS Catal. 2021, 12, 101–115. [Google Scholar] [CrossRef]
  39. Sui, S.; Wang, X.; Zhou, X.; Su, Y.; Riffat, S.; Liu, C.-J. A comprehensive review of Pt electrocatalysts for the oxygen reduction reaction: Nanostructure, activity, mechanism and carbon support in PEM fuel cells. J. Mater. Chem. A 2016, 5, 1808–1825. [Google Scholar] [CrossRef]
  40. Paperzh, K.O.; Pavlets, A.S.; Alekseenko, A.A.; Pankov, I.V.; Guterman, V.E. The integrated study of the morphology and the electrochemical behavior of Pt-based ORR electrocatalysts during the stress testing. Int. J. Hydrogen Energy 2023. [Google Scholar] [CrossRef]
  41. Logeshwaran, N.; Panneerselvam, I.R.; Ramakrishnan, S.; Kumar, R.S.; Kim, A.R.; Wang, Y.; Yoo, D.J. Quasihexagonal Platinum Nanodendrites Decorated over CoS2-N-Doped Reduced Graphene Oxide for Electro-Oxidation of C1-, C2-, and C3-Type Alcohols. Adv. Sci. 2022, 9, 2105344. [Google Scholar] [CrossRef]
  42. Shinozaki, K.; Zack, J.W.; Richards, R.; Pivovar, B.S.; Kocha, S.S. Oxygen Reduction Reaction Measurements on Platinum Electrocatalysts Utilizing Rotating Disk Electrode Technique: I. Impact of Impurities, Measurement Protocols and Applied Corrections. J. Electrochem. Soc. 2015, 162, F1144–F1158. [Google Scholar] [CrossRef]
Figure 1. X-ray diffraction patterns for the Pt/C samples (a). TEM micrographs of surface sections for Com (b,c) and Pt (d,e) as well as histograms of the platinum NPs’ size distribution for the corresponding materials.
Inorganics 11 00237 g001
Figure 2. Cyclic voltammograms of the Pt (a) and Com (d) samples at the initial point (black color), after the AST in Ar (blue color), and after the AST in O2 (red color). The potential sweep rate is 20 mV s−1. The second cycle. The electrolyte is a 0.1 M HClO4 solution saturated with Ar at atmospheric pressure. Potentiodynamic polarization curves of the ORR at the initial point (black color), after the AST in Ar (blue color), and after the AST in O2 (red color) for the Pt (b) and Com (e) samples. The RDE rotation speed is 1600 rpm. 0.1 M HClO4. O2 atmosphere. Next to designations, the numbers in parentheses are percentage values of the preservation of residual electrochemical parameters relative to initial ones (relative stability). The dependence of 1/Ik on the RDE rotation speed in Koutetsky–Levich coordinates (c,f), where Ik is the current on the disk electrode with an area of 0.19625 cm2.
Inorganics 11 00237 g002
Figure 3. Micrographs of the Com (ad) and Pt (eh) samples. Micrographs of the samples after the AST in Ar (a,b,e,f) and after the AST in O2 (c,d,g,h) and histograms of the NPs’ size distribution in the corresponding materials. The distribution in the samples after the AST in Ar is highlighted in blue, the distribution in the samples after the AST in O2 is colorized in red, and the initial distribution in the samples is of a desaturated color. Histograms of the NPs’ distribution by the number of intersections with their neighbors at the initial point and after the AST (i,j). The proportion of NPs: at the initial point (black color), after the AST in Ar (blue color), and after the AST in O2 (red color) for the Pt/C samples.
Inorganics 11 00237 g003
Figure 4. Cyclic voltammograms (a,c,e,g) and potentiodynamic ORR curves (b,d,f,h) after the stress testing in Ar (a,b,e,f) and O2 (c,d,g,h) before (dotted line) and after (solid line) 100 cycles of the refreshing.
Inorganics 11 00237 g004
Table 1. Composition and structural–morphological and electrochemical characteristics of the Pt/C samples.
Sampleω(Pt), %DAv, nm
(XRD)
DNP, nm
(TEM)
Specific Number of NPs,
N, 1015 m−2
Average Inter-Particle
Distance, ʎ, nm
ESA, m2 gPt−1Imass, A gPt−1
Com202.52.74.512.282257
Pt201.32.011.17.5112326
Table 2. Structural and electrochemical parameters of the Pt/C catalyst after the AST.
Initial/after AST ProtocolsDNP, nmESAafter AST, m2 gPt−1Imassafter AST, A gPt−1Specific Number of NPs,
N, 1015 m−2 *
Average Inter-Particle
Distance, ʎ, nm *
Com-Ar4.1561521.323.7
Com-O24.0481631.422.8
Pt-Ar3.2842392.716.0
Pt-O23.2752232.716.0
* When calculating N and ʎ after the AST, it has been assumed that the Pt content in the samples should not change.
Disclaimer/Publisher’s Note: The statements, opinions and data contained in all publications are solely those of the individual author(s) and contributor(s) and not of MDPI and/or the editor(s). MDPI and/or the editor(s) disclaim responsibility for any injury to people or property resulting from any ideas, methods, instructions or products referred to in the content.

