Article

A Tridentate Cu(II) Complex with a 2-(4′-Aminophenyl)Benzothiazole Derivative: Crystal Structure and Biological Evaluation for Anticancer Activity

by
Barbara Mavroidi
1,2,*,
Marina Sagnou
2,†,
Eleftherios Halevas
2,†,
George Mitrikas
3,
Fotis Kapiris
4,
Penelope Bouziotis
4,
Antonios G. Hatzidimitriou
5,
Maria Pelecanou
2 and
Constantinos Methenitis
1,*
1
Inorganic Chemistry Laboratory, Department of Chemistry, National and Kapodistrian University of Athens, Panepistimiopolis Zografou, 15771 Athens, Greece
2
Institute of Biosciences & Applications, National Centre for Scientific Research “Demokritos”, 15310 Athens, Greece
3
Institute of Nanoscience and Nanotechnology, National Centre for Scientific Research “Demokritos”, 15310 Athens, Greece
4
Institute of Nuclear & Radiological Sciences & Technology, Energy & Safety, National Centre for Scientific Research “Demokritos”, 15310 Athens, Greece
5
Inorganic Chemistry Laboratory, Department of Chemistry, Aristotle University of Thessaloniki, 54124 Thessaloniki, Greece
*
Authors to whom correspondence should be addressed.
These authors contributed equally to this work.
Inorganics 2023, 11(3), 132; https://doi.org/10.3390/inorganics11030132
Submission received: 1 March 2023 / Revised: 13 March 2023 / Accepted: 16 March 2023 / Published: 20 March 2023
(This article belongs to the Special Issue Bioactivity of Transition Metal-Based Complexes)

Abstract

:
Herein, the synthesis, structural characterization and in vitro biological evaluation of a novel Cu(II) complex with the 2-(4-aminophenyl)benzothiazole pharmacophore conjugated with the (2-pyridinyl)methylamino chelating moiety is reported for the first time. A full characterization of the Cu(II) complex was conducted by X-ray crystallography, EPR, IR, elemental and MS analysis, and its binding to CT-DNA was investigated by UV-vis spectroscopy, ethidium bromide competition studies, circular dichroism, viscometry and thermal denaturation. The data clearly indicate that the Cu(II) complex interacts with CT-DNA via intercalation, registering a difference compared to previously reported Pt(II) and Pd(II) analogues. To evaluate the anticancer activity of the complex, a series of in vitro experiments against breast, glioblastoma, prostate and lung cancer cell lines along with healthy fibroblasts were implemented. Cytotoxicity, cellular uptake, intracellular ROS production, cell cycle and apoptosis analysis revealed an increased anticancer activity towards breast cancer cells that is accompanied by an induction in intracellular ROS levels and a significant G2/M arrest followed by apoptosis.

1. Introduction

The use of copper for medical purposes has been known since ancient times, especially in the sterilization of wounds and drinking water [1,2]. In more recent years, copper complexes have been explored as highly effective metallodrugs against viruses [3], inflammation [4] and various microbes [5]. Until recently, Cu-salicylate was available for external use in humans as a topical anti-inflammatory gel, while a Cu(II)–indomethacin coordination compound is currently used in Australia, New Zealand and some other countries as a veterinary anti-inflammatory drug [6,7,8].
Cu(II) complexes have emerged as an attractive chemotype against cancer due to their capacity to affect malignant cells more than normal, a property partially attributed to the fact that copper is an endogenous metal [8]. The reduced general nephro- and neurotoxicity [9,10] and myelosuppression [11] compared to clinically used platinum based drugs advocates a role for copper complexes as nontoxic substitutes for platinum agents. The anticancer activity of Cu(II) complexes is associated in the literature with various mechanistic pathways, such as reactive oxygen and nitrogen species-induced oxidative damage and cellular death, telomerase and topoisomerase inhibition, DNA binding and degradation, cell cycle intervention and alterations in death effector proteins [12,13,14,15,16,17]. In many cases, the anticancer activity is unique to the copper complex and is absent in the organic ligand, suggesting a definite role for the metal core or the metal–ligand entity [18]. It should be noted that complexes of Cu(II) with 4,7-dimethyl-1,10-phenanthroline and either glycine (CasII-gly) or acetylacetone (CasIII-Ea) (Supplementary Information Figure S1, compounds 1 and 2, respectively) have entered phase I clinical trials against cervical cancer and against acute myeloid leukemia and colon cancer, respectively [19]. Moreover, N-malonyl-bis(N-metil-N-tiobenzoyl Hidrazide) known as elesclomol, and its copper complex Cu(II)–elesclomol (Supplementary Information Figure S1, compound 3), have also entered clinical trials for various types of cancer including melanoma, ovarian and metastatic prostate [20]. Lately, complexes of casiopeinas with copper have been undergoing clinical trials against several cancer cell lines and xenotransplanted tumors, illustrating the overall promise that copper complexes offer in anticancer treatment [21].
Within this framework and utilizing our long experience with the anticancer 2-(4′-aminophenyl)benzothiazole pharmacophore [22,23], we report herein the synthesis, crystallographic characterization and in vitro biological evaluation of a copper complex Cu-1 (Figure 1) with ligand L1 (Figure 1) in which the 2-(4-aminophenyl)benzothiazole pharmacophore is conjugated with the (2-pyridinyl)methylamino chelating moiety. Complex Cu-1 was fully characterized through X-ray crystallography and its anticancer activity was extensively evaluated via DNA interaction studies, cytotoxicity and cell uptake studies in breast (MCF-7 and MDA-MB-231), glioblastoma (U-87 MG), prostate (PC-3) lung cancer cell lines (A-549) and healthy fibroblasts (DSF) combined with intracellular ROS production, cell cycle and apoptosis analysis. The results from the in vitro biological evaluation reveal noteworthy anticancer properties with no significant cytotoxicity towards healthy cells that, combined with their significant interaction with DNA, render it a strong candidate for further evaluation as anticancer agent.

2. Results and Discussion
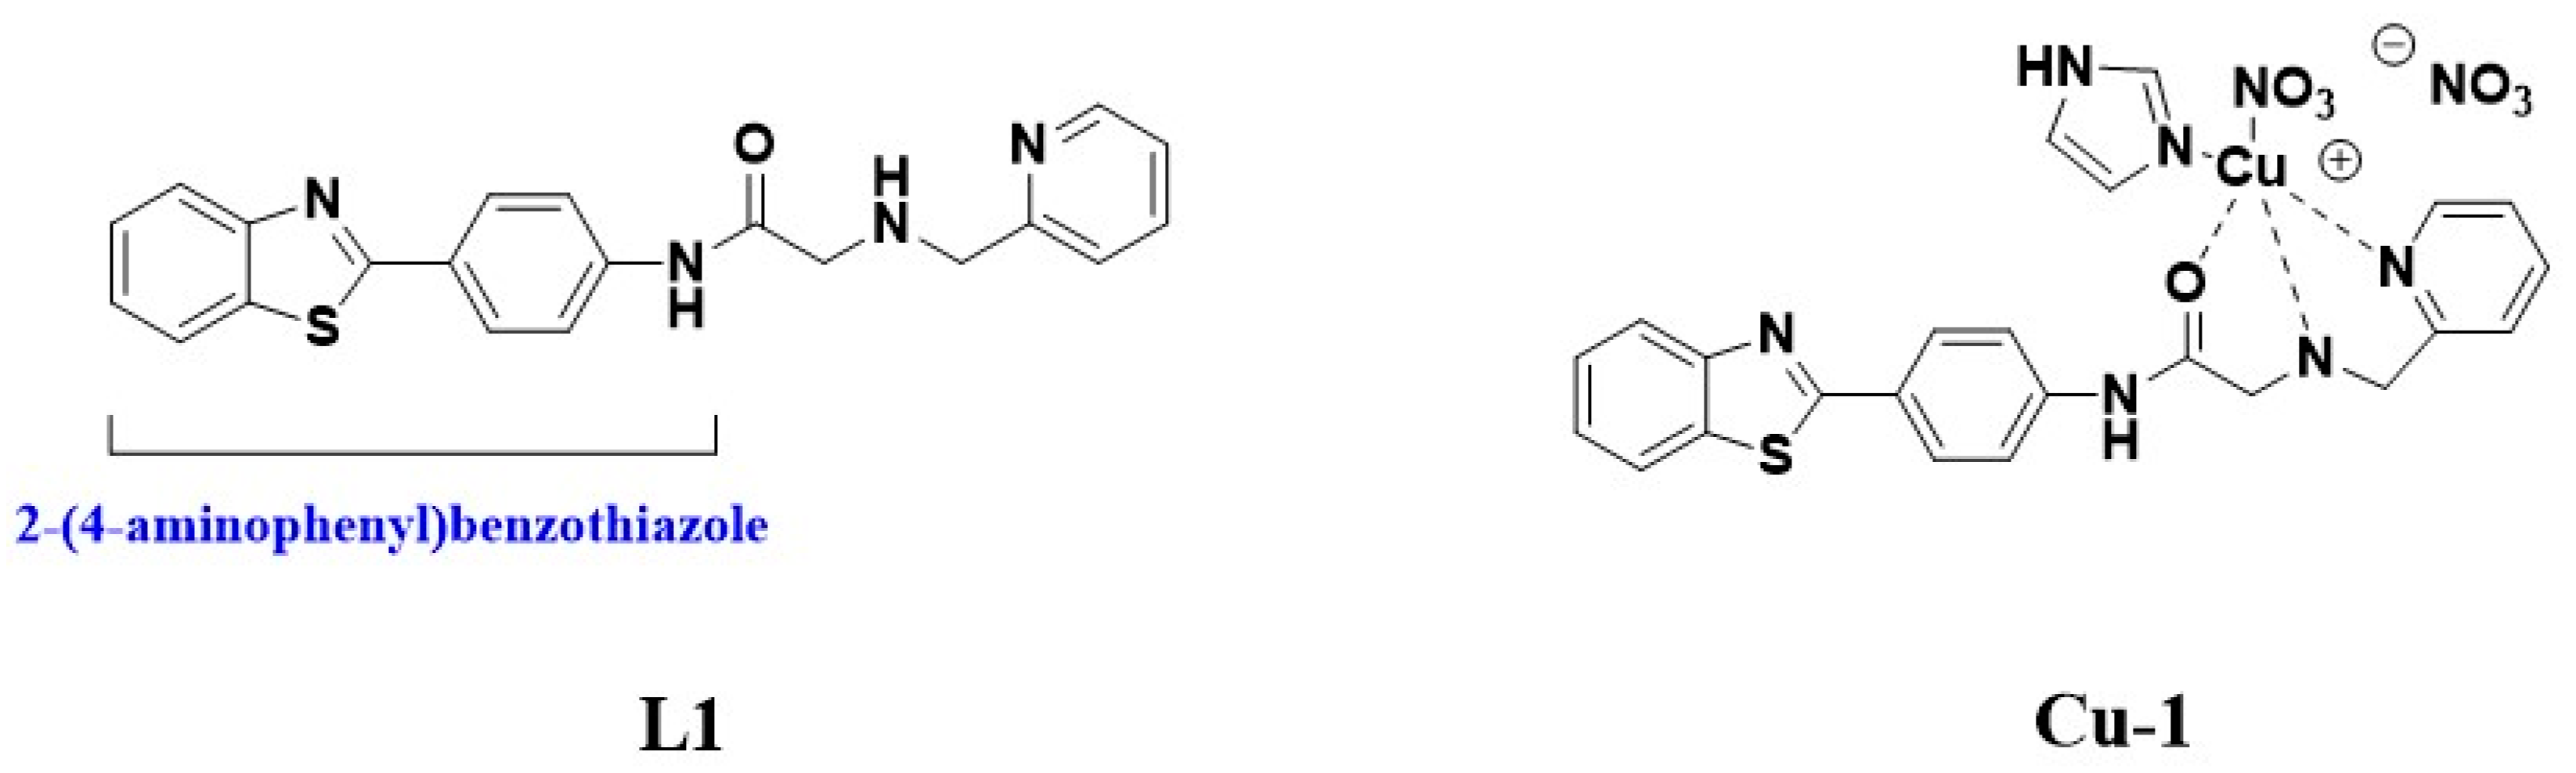
2.1. Synthesis

The ligand was designed following the conjugated approach where the pharmacophore 2-(4′-aminophenyl)benzothiazole is joined to a (2-pyridinyl)methylamino chelating moiety (Figure 1, ligand L1). Pyridyl-methylamine, widely known as picolyl amine, is among ligands that have been explored to stabilize the Cu(II) coordination sphere [24]. In our previous investigations this ligand was used to afford complexes with Pt(II) and Pd(II) [22]. The employment of the neutral system of imidazole as a coligand was crucial for the stabilization of the Cu(II) coordination sphere.
Various reaction conditions for the preparation of the heteroleptic complex Cu-1 were investigated thoroughly including reaction solvation system, pH, temperature, reagent stoichiometry and finally isolation and crystallization conditions. Methanol was found to be the optimum reaction solvent. The stoichiometric reaction describing the preparation of Cu-1 is shown below:
n   C u ( N O 3 ) 2 · 3 H 2 O + n   C 21 H 18 N 4 O S + n   C 3 H 4 N 2 M e O H [ C u ( C 21 H 18 N 4 O S ) ( C 3 H 4 N 2 ) ( N O 3 ) ] n · n ( N O 3 ) + 3 n   H 2 O + n   M e O H
Diethyl ether was used as the precipitating agent for the reaction mixture. Bluish crystals emerged in the reaction mixture, the structure of which was positively confirmed using X-ray crystallography, elemental analysis, FT-IR and EPR spectroscopy. The crystalline material is air-stable, soluble in DMSO, DMF, MeOH and acetonitrile, and insoluble in dichloromethane, acetone and H2O at ambient temperature.

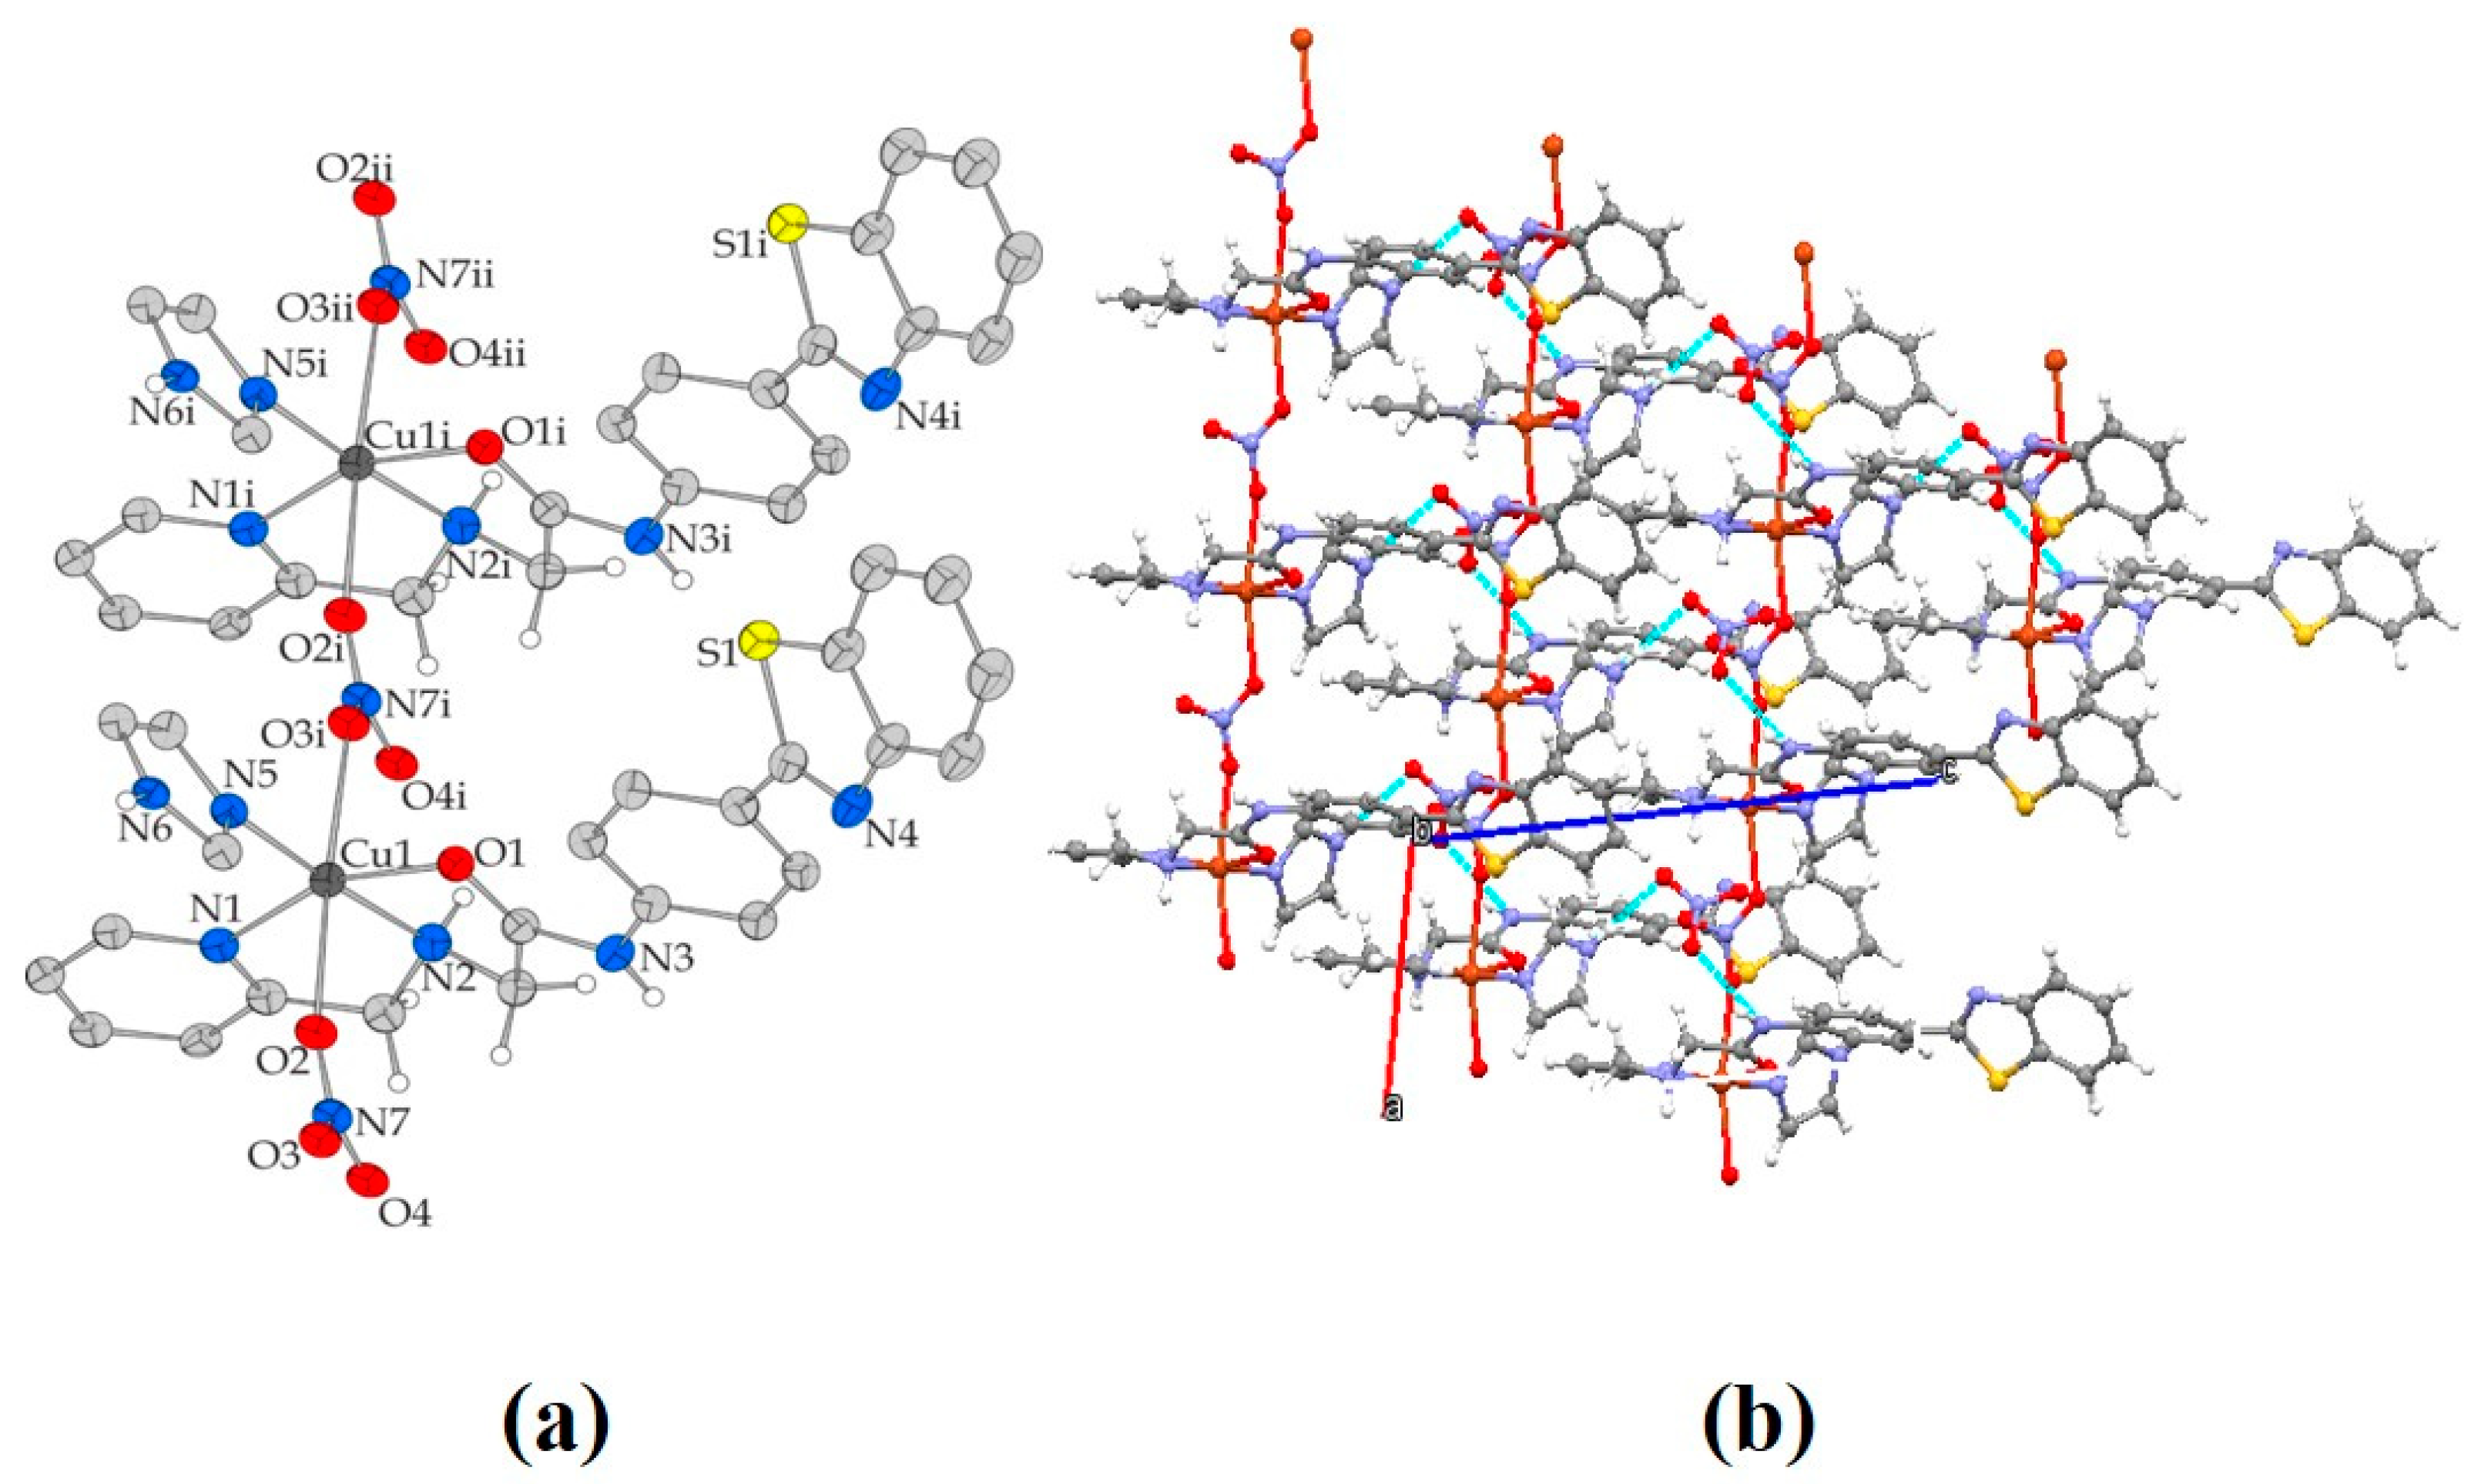
2.2. Description of the Structure
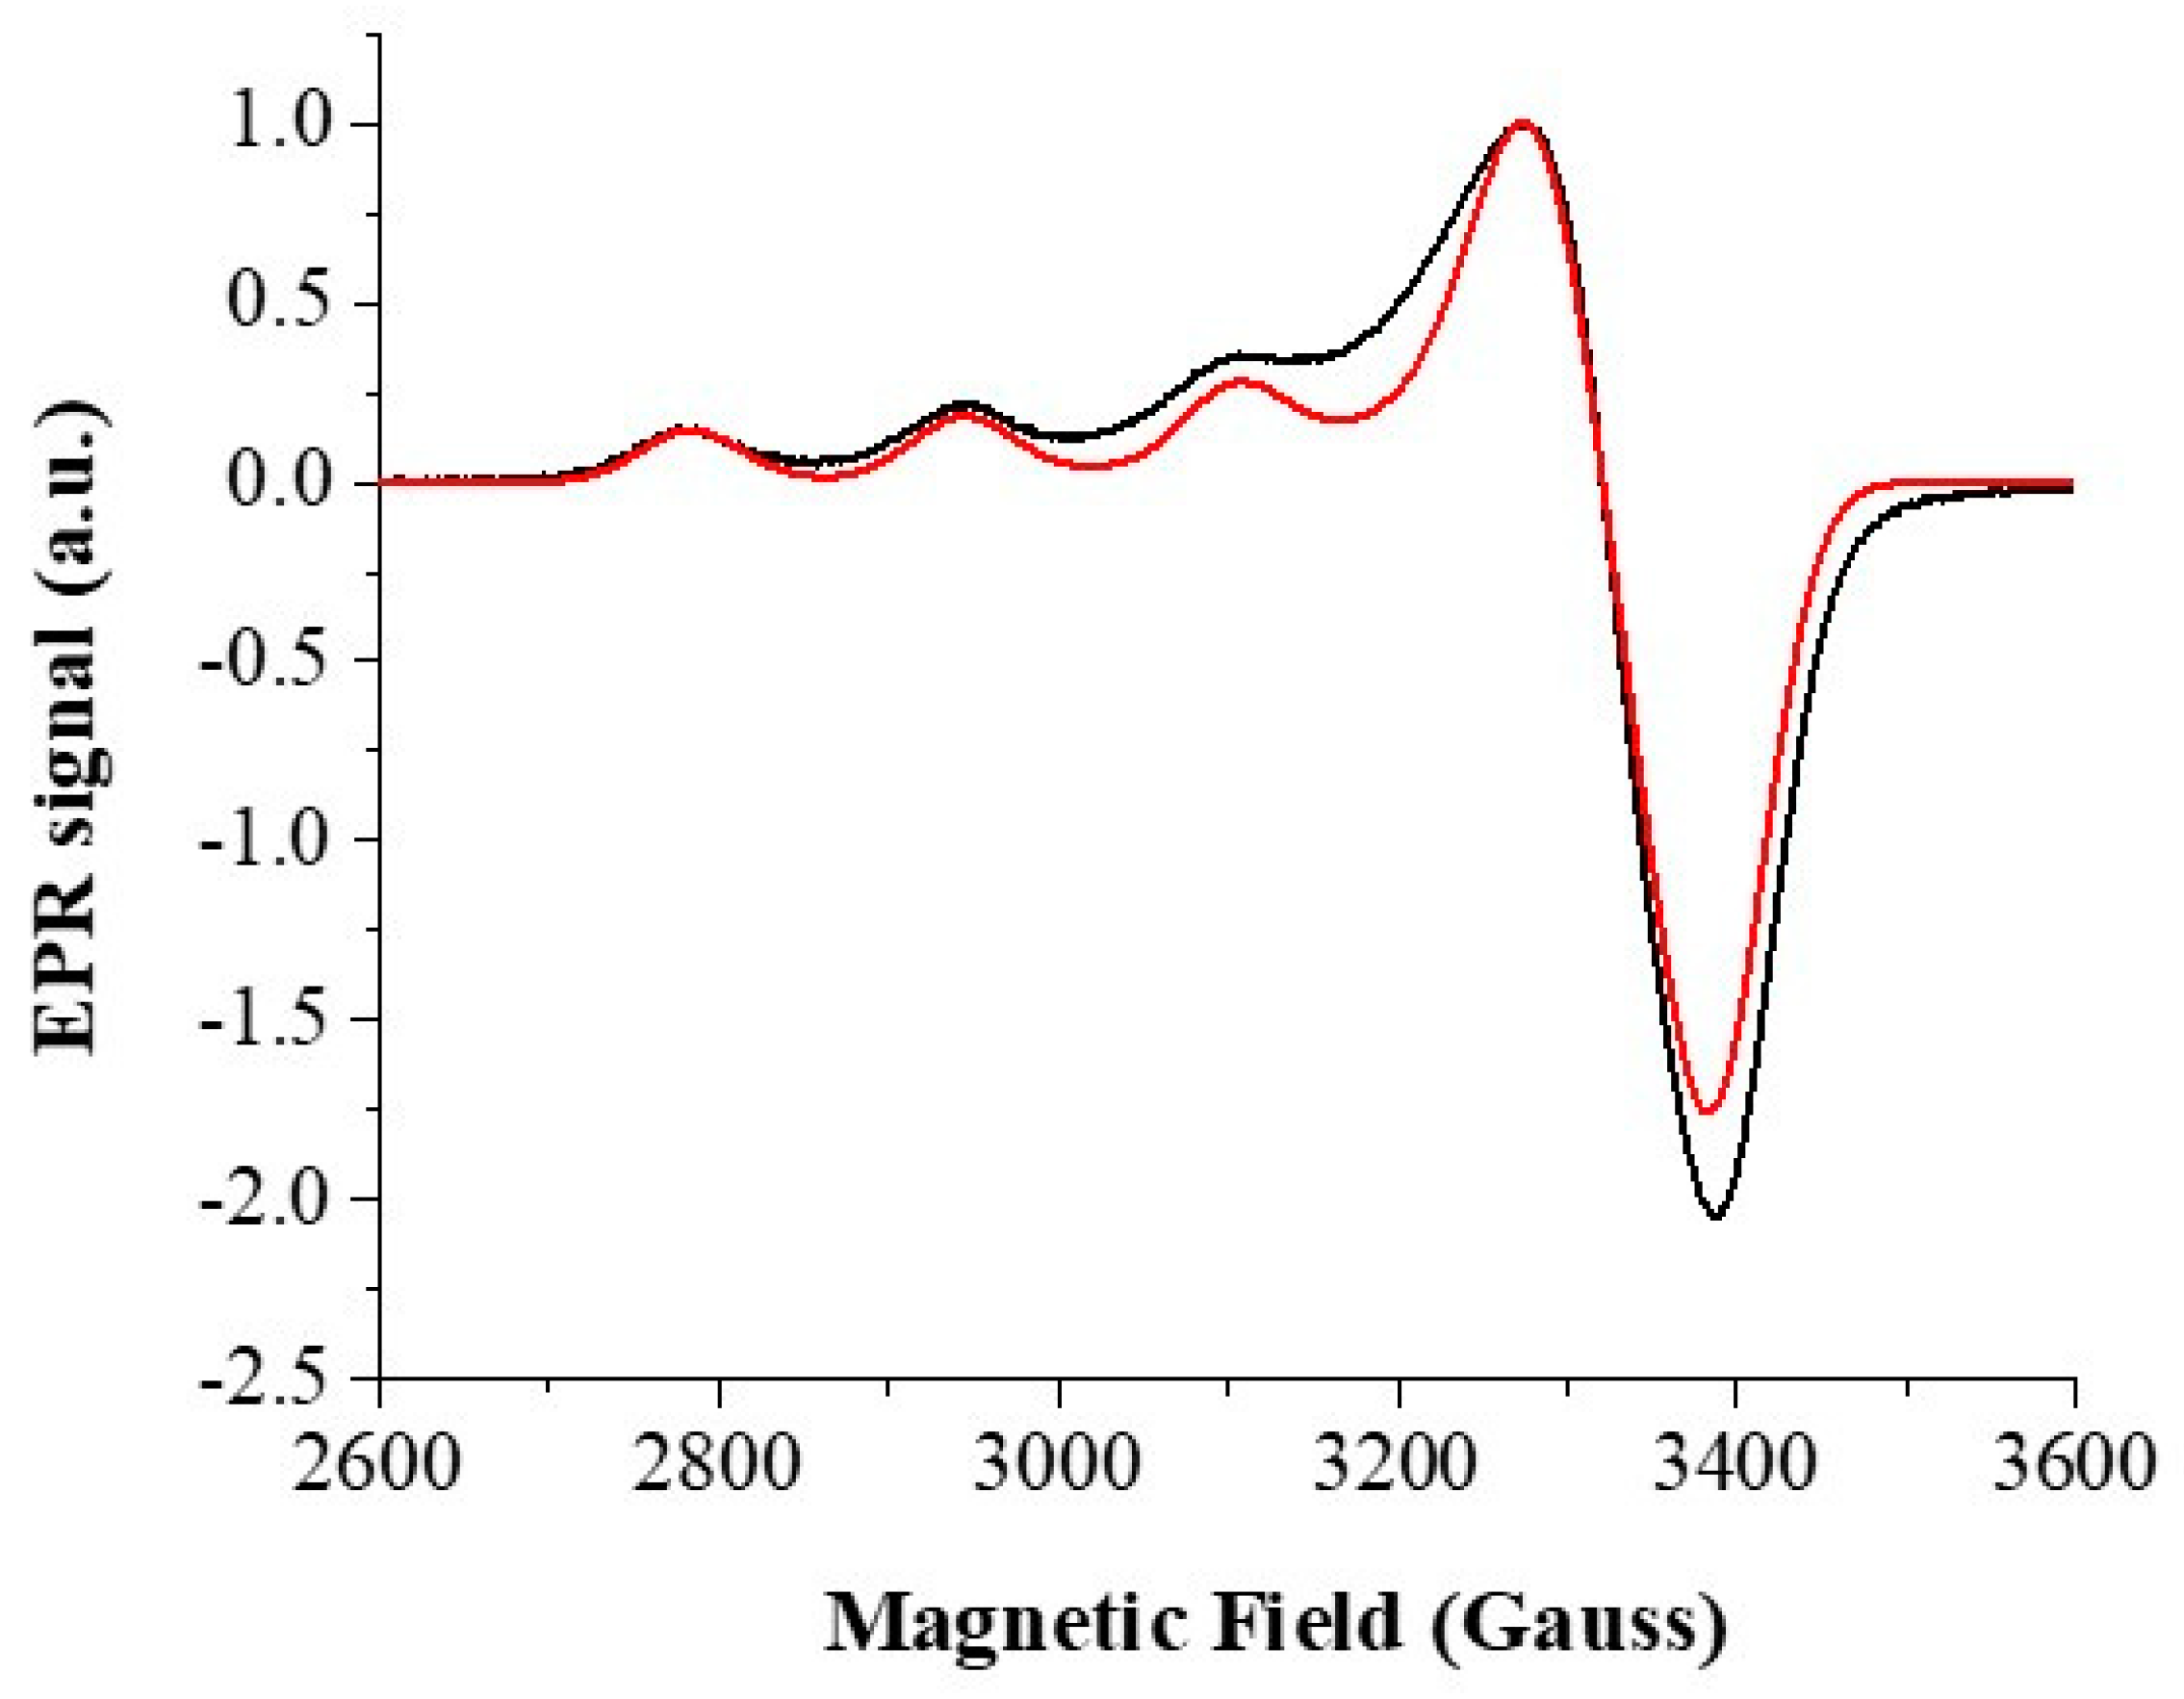
A discrete solid-state lattice is depicted by the X-ray crystal structure of Cu-1. Figure 2a shows an illustration of the structure of Cu-1; specific interatomic angles and distances are given in Table 1 and Table 2. The structure of complex Cu-1 is one dimensional polymeric forming chains that lie parallel to the crystallographic a-axis. Cu-1 crystallizes in the monoclinic space group P21/n and four monomers can be found in the unit cell. The asymmetric unit of the crystal contains one nitrate (NO3) counterion and one monocationic [Cu(C21H18N4OS)(C3H4N2)(NO3)]+ complex monomer. In the molecular structure of Cu-1, Cu(II) is coordinated with the nitrogen atom of one imidazole molecule and one neutral N,N,O-donor ligand in a tridentate chelating mode through the carbonyl oxygen atom of the amide moiety, the pyridine nitrogen, and the nitrogen atom of the intermediate secondary amine. The coordinated nitrate ion is acting as a bidentate bridging ligand, coordinating through two of the three oxygen atoms to the Cu(II) centers of the title asymmetric unit and a neighboring monomer. Cu(II) ion exhibits a coordination number six and the geometry around it can be described as disordered octahedral with O(1), O(2), N(1) and O(3) forming the equatorial plane, and N(2) and N(5) (most axial vector) occupying the axial positions. The Cu-N (ligand and imidazole) and Cu-O bond distances have values between 1.966(2)–2.021(2) Å and 2.0421(18)–2.494(2) Å, respectively. The observed distances are close to bond lengths reported in the literature for heteroleptic Cu(II) complexes [25,26]. In the lattice of Cu-1, intermolecular hydrogen-bonding interactions were found to emerge between all amine hydrogen atoms and the oxygen atoms of the nitrate groups, giving extra stability to the system (Figure 2b, Supplementary Information Table S1).

2.3. EPR Analysis

The frozen-solution X-band EPR spectrum of the Cu-1 together with its simulation is shown in Figure 3. The spectrum revealed features that are typical for Cu(II) complexes with a d x 2 y 2 ground state, i.e., axially symmetric g tensor (gx = gy = g, gz = g||) with g < g||. The lack of resolution at the low field transitions does not allow the observation of 14N superhyperfine splittings that would be expected as a result of the hyperfine interaction between the unpaired electron and the directly coordinated nitrogen atoms. However, the estimated spin Hamiltonian parameters g = [gx, gy, gz] = [2.065, 2.065, 2.271] ± 0.005 and |A| = 30 ± 10 MHz, |A||| = 510 ± 10 MHz show that the A|| and g|| correlation is in line with the unpaired electron being in the d x 2 y 2 orbital and the equatorial coordination mode of “3N1O” [27,28].

2.4. DNA Binding Studies

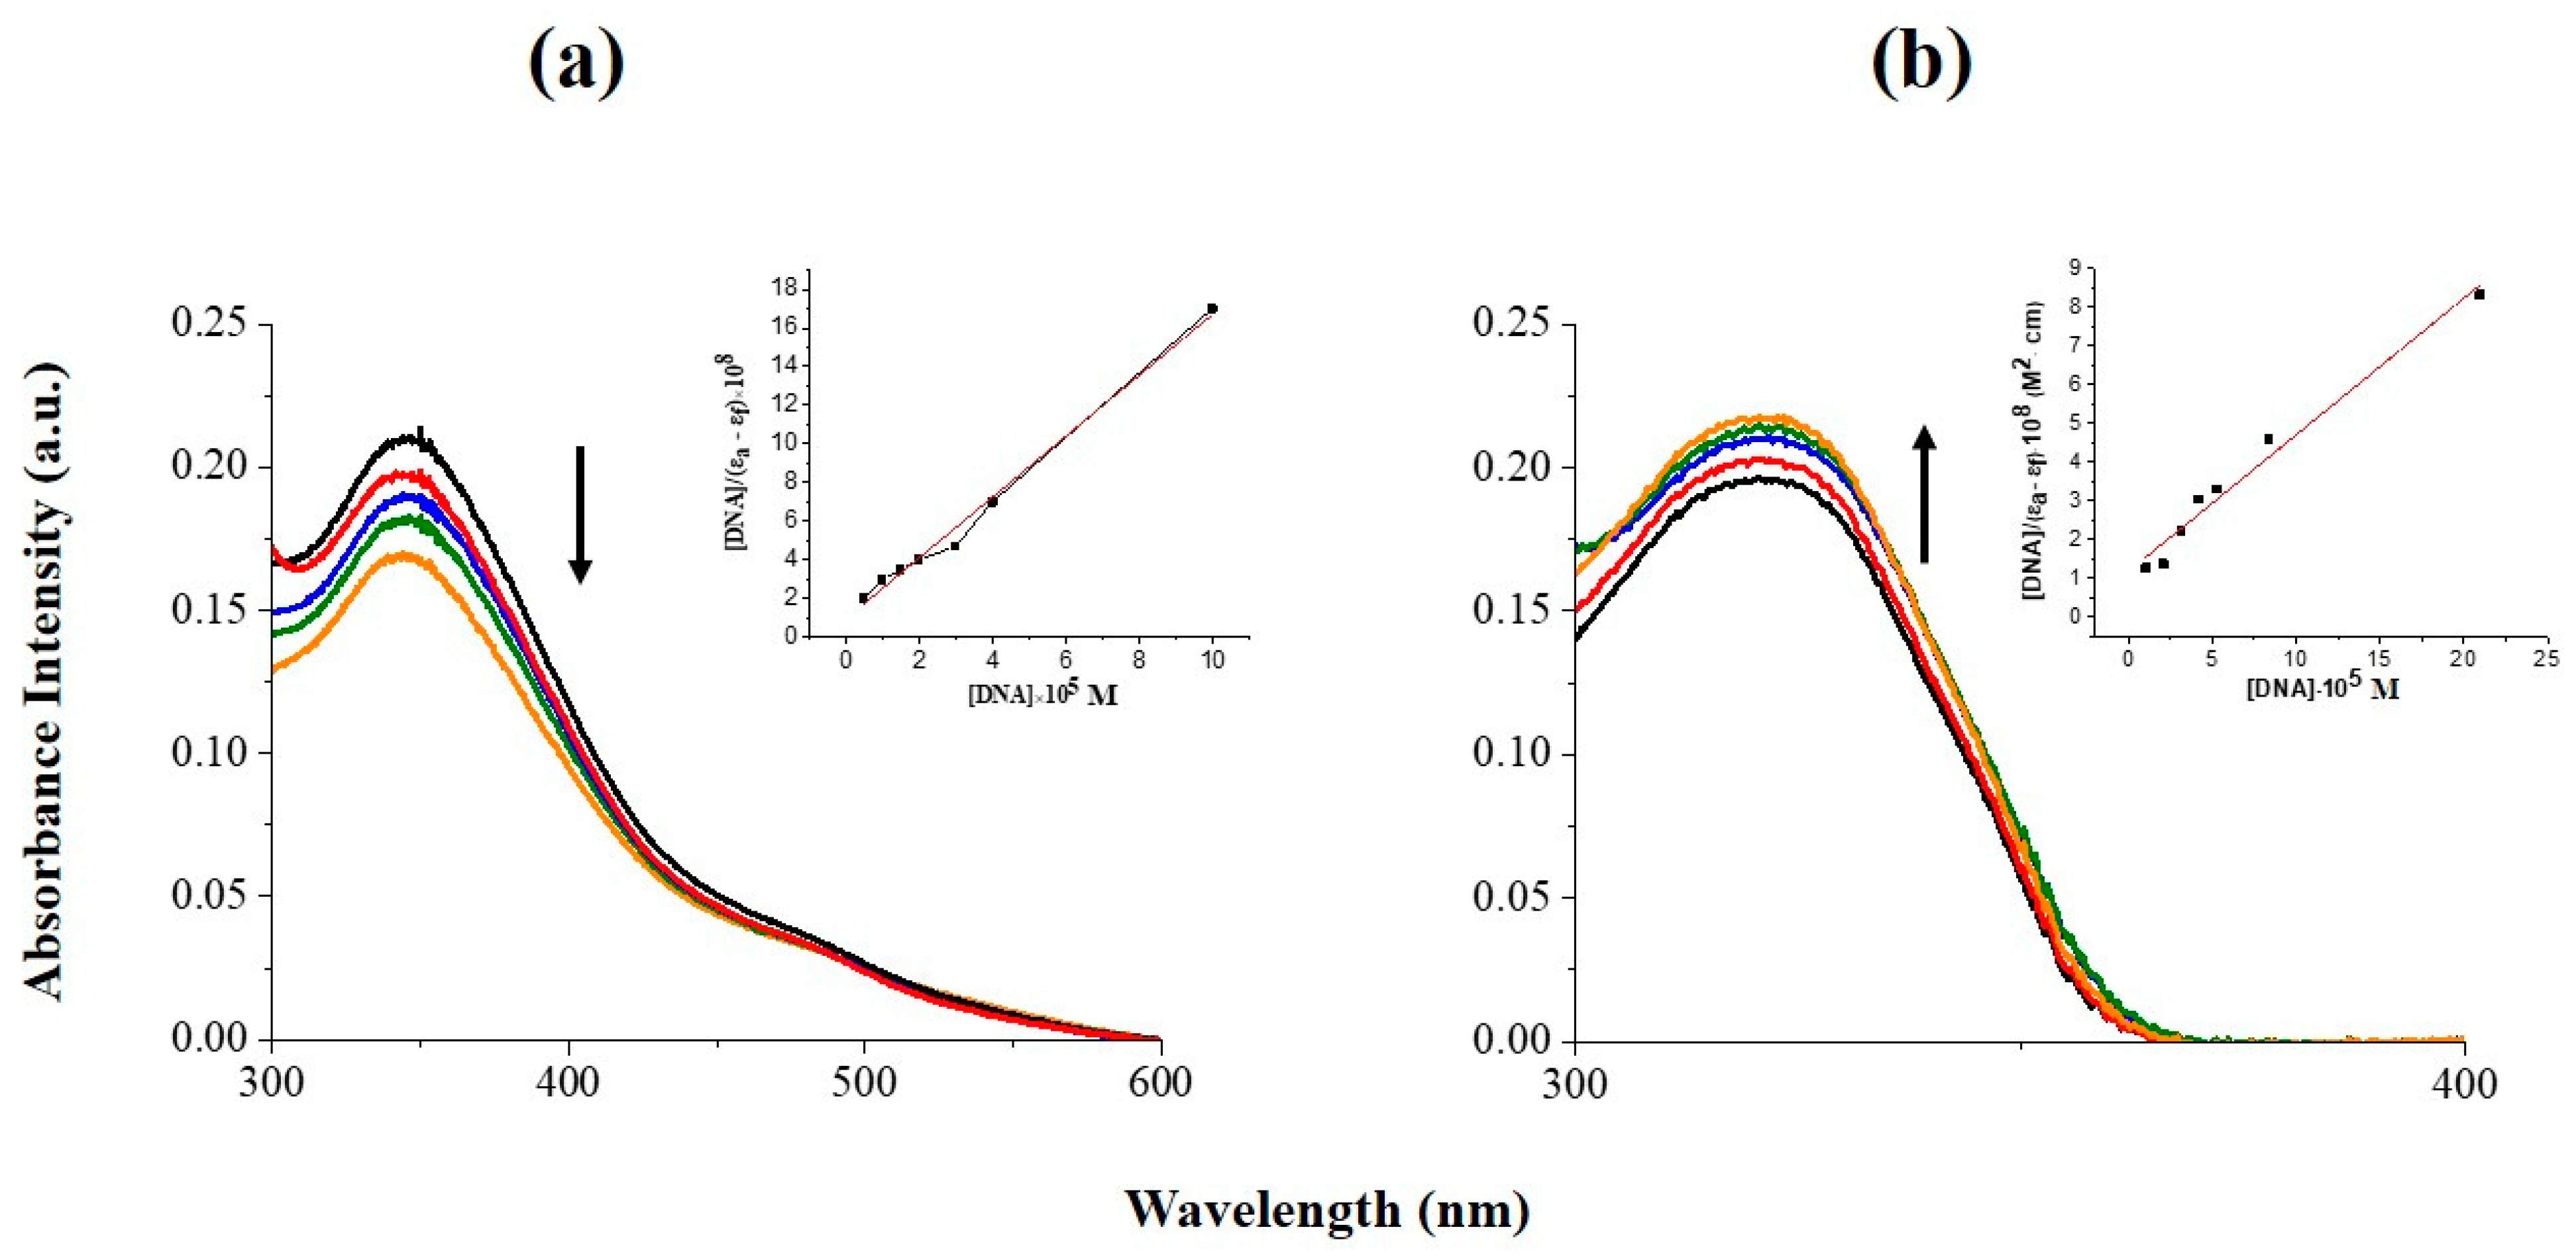
2.4.1. Absorption Titration Studies

In order to determine the mode and the extent of the interaction of complex Cu-1 with CT-DNA, UV-vis electronic absorption spectra were recorded upon increasing the concentration of CT-DNA in the 300–600 nm wavelength region by monitoring the intensity changes in the intraligand π–π* transition band at 338 nm of the phenylbenzothiazole moiety [29]. As it is evident from Figure 4a, a progressive decrease of the intensity of the band at 338 nm was observed upon the addition of DNA, with no indication of shift of the absorption maximum. The displayed hypochromism reached 29% for the higher ratio, R = 10. Hypochromism is a common characteristic of intercalation of a molecule into DNA base pairs, due to the strong stacking interaction between the aromatic chromophore and the base pairs [22]. Furthermore, to quantitatively determine the DNA binding affinity of complex Cu-1, the intrinsic binding constant with DNA, Kb, was obtained by fitting the spectroscopic titration data at 338 nm to Equation (1) (Figure 4, inset plot). The value of Kb was to be equal to 2.67 ± 0.75 × 10⁶ M−1, a value that is in accordance with the ones reported for classical intercalators bound to CT-DNA that have binding constants within the range of 106–107 M−1 [30]. As previously shown [22], the addition of DNA in the presence of ligand L1 (Figure 4b) induced hyperchromism and bathochromism whereas the calculated Kb was two orders of magnitude lower (~104 M−1). Hence, it is clear that a different mode of interaction with CT-DNA takes place with the copper complex under study that binds more strongly than ligand L1. Thus, the obtained data in our case are consistent with the intercalation of the complex Cu-1 into the double helix of DNA. Our results are comparable with [31,32] or superior to [30,33] those of copper complexes reported to interact with DNA via intercalative mode with Kb values ranging from 104 to 106 M−1.

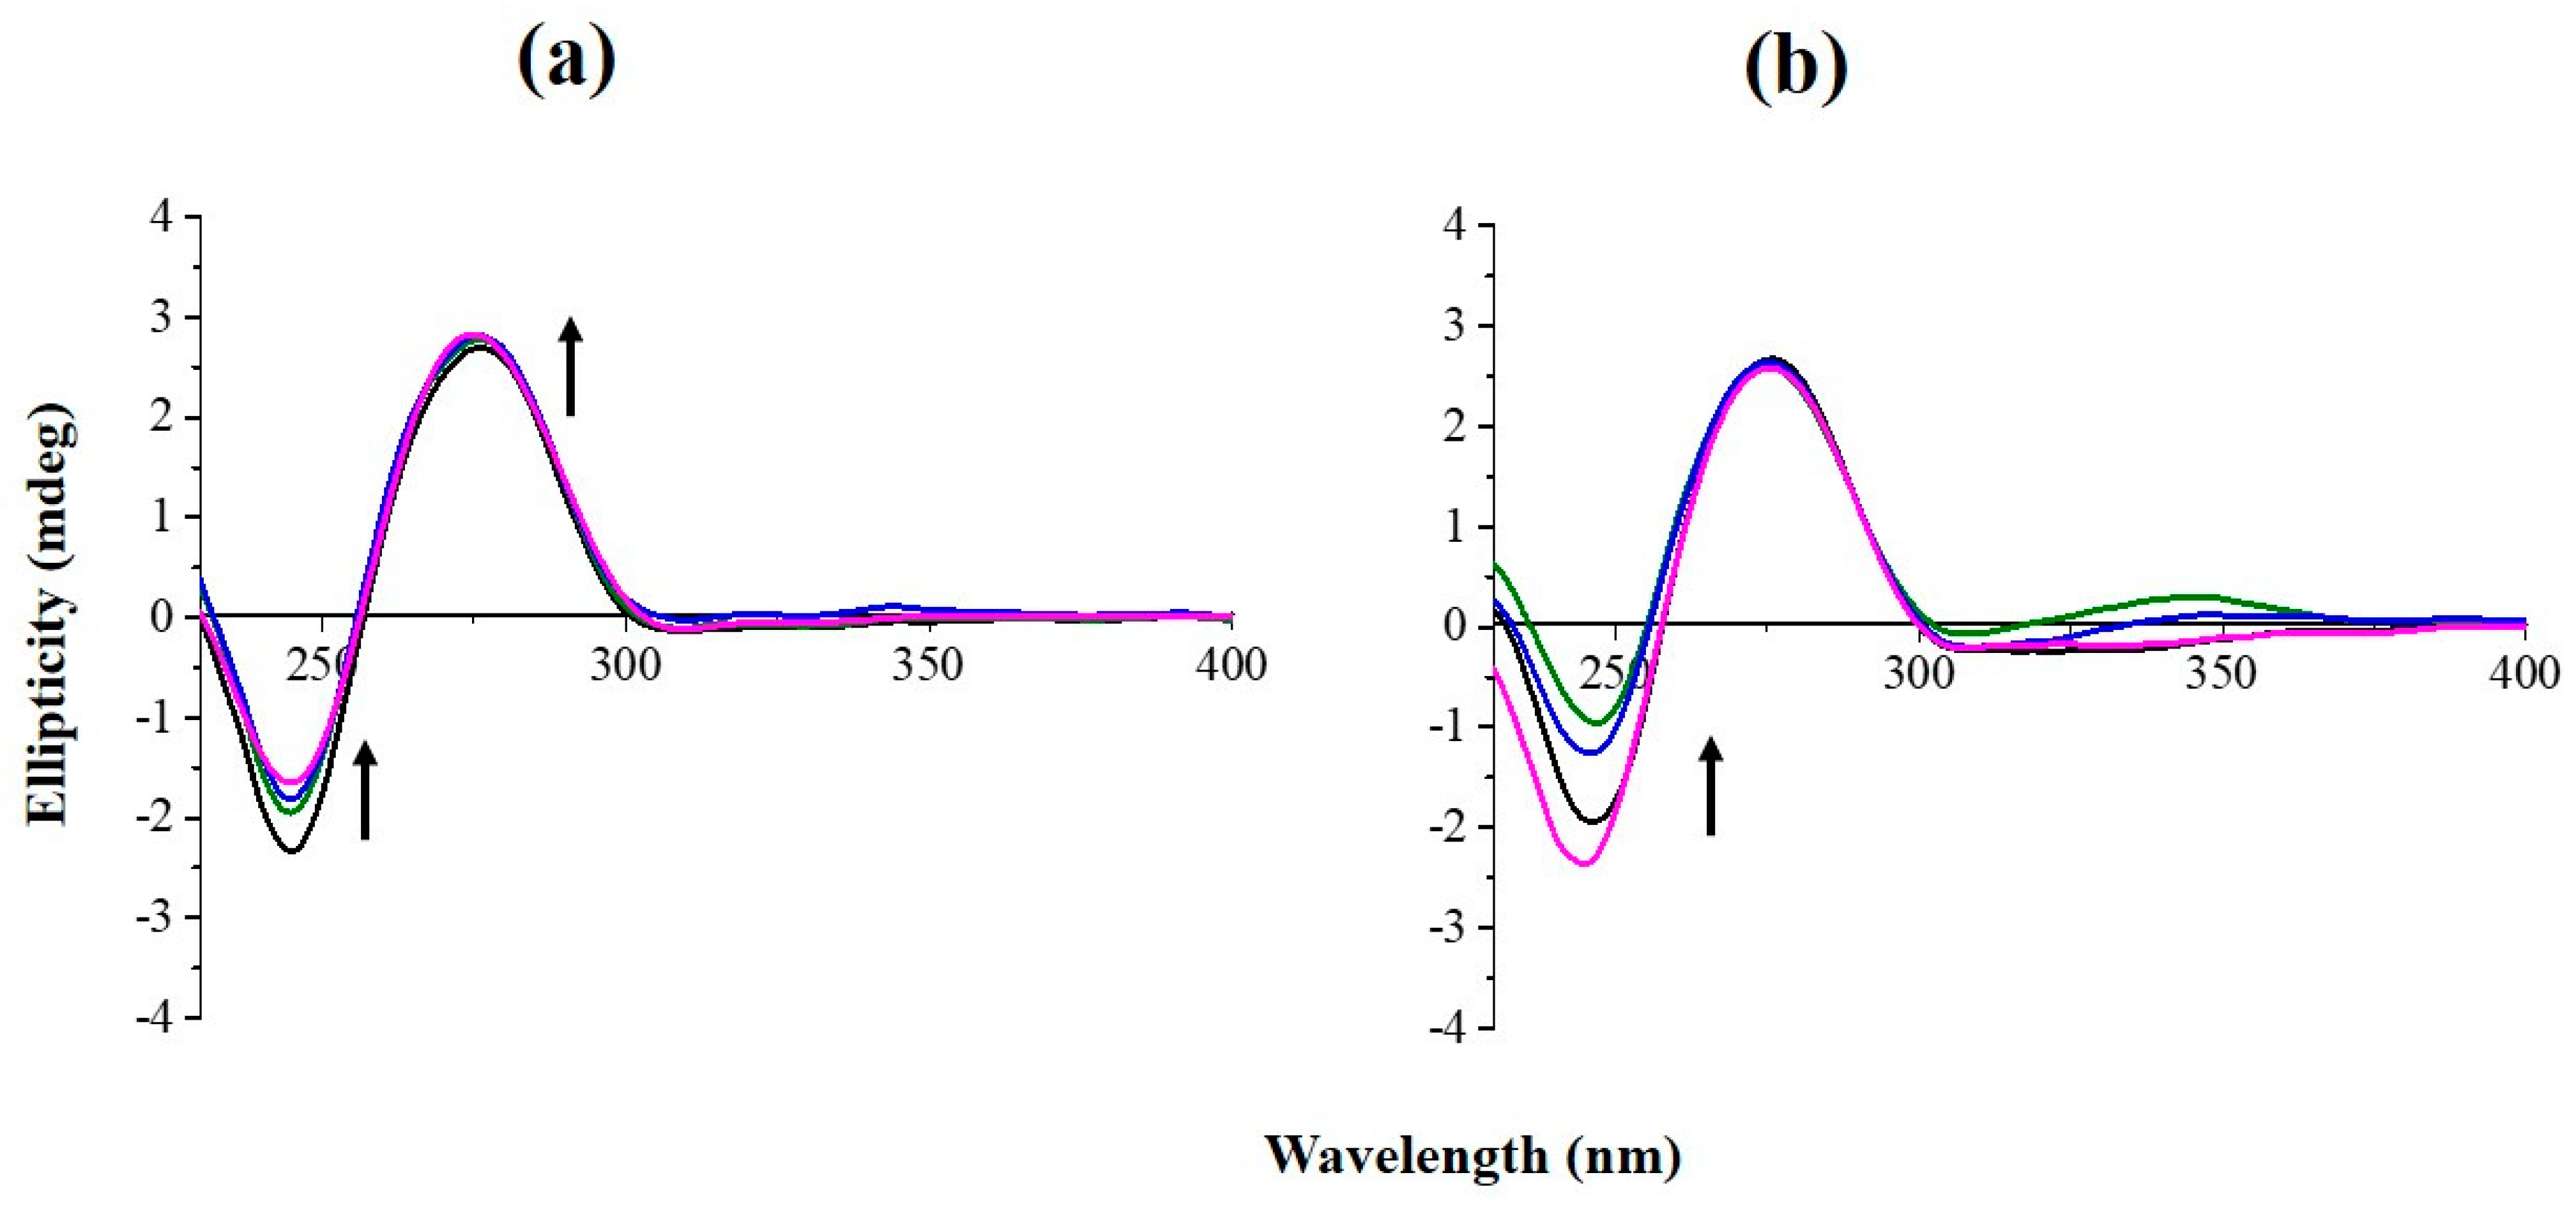
2.4.2. Circular Dichroism

Circular dichroism (CD) spectroscopy was employed to monitor the conformational changes that CT-DNA undergoes upon incubation with Cu-1 and the results are summarized in Figure 5a. It should be noted that complex Cu-1 displayed no significant CD signal in solution. As expected, the B-form of DNA is adopted under the experimental conditions used, which is evidenced by the positive peak around 275 nm, attributed to the stacking of the DNA base pairs in the double helical construct and a negative peak around 245 nm, which is a feature associated with the right-handed helicity of the polynucleotides [34] (Figure 5, black line).
The addition of Cu-1 did not affect the presence of either the positive or negative peaks, even at the highest concentration of the complex, suggesting that the B-form of DNA is not disturbed [35]. However, intensity changes of both negative and positive bands of the CT-DNA CD spectrum were observed dose-dependently and without any wavelength shift. More specifically, the intensity of the negative band decreased compared to the untreated DNA by 30%, whereas the corresponding increase of the positive band was only of the magnitude of 10%, at the highest ratio of R = 0.5 (Figure 5a). These observations are supportive for the intercalative mode of binding of the complex Cu-1, where the Cu-1 molecules stack in between the base pairs of DNA, thus leading to the enhancement in the positive band [36,37,38]. Interestingly, complex Cu-1 did not cause any induced circular dichroism (ICD), in compliance with the fact that classical intercalators usually exhibit weak or no ICD signals [39,40]. The CD observations for Cu-1 differed significantly to the those caused by L1 (Figure 5b), where dissimilar CD spectral patterns accompanied by an ICD band were recorded, observations usually detected in the case of electrostatic interactions and/or groove binding mode of interaction with DNA.

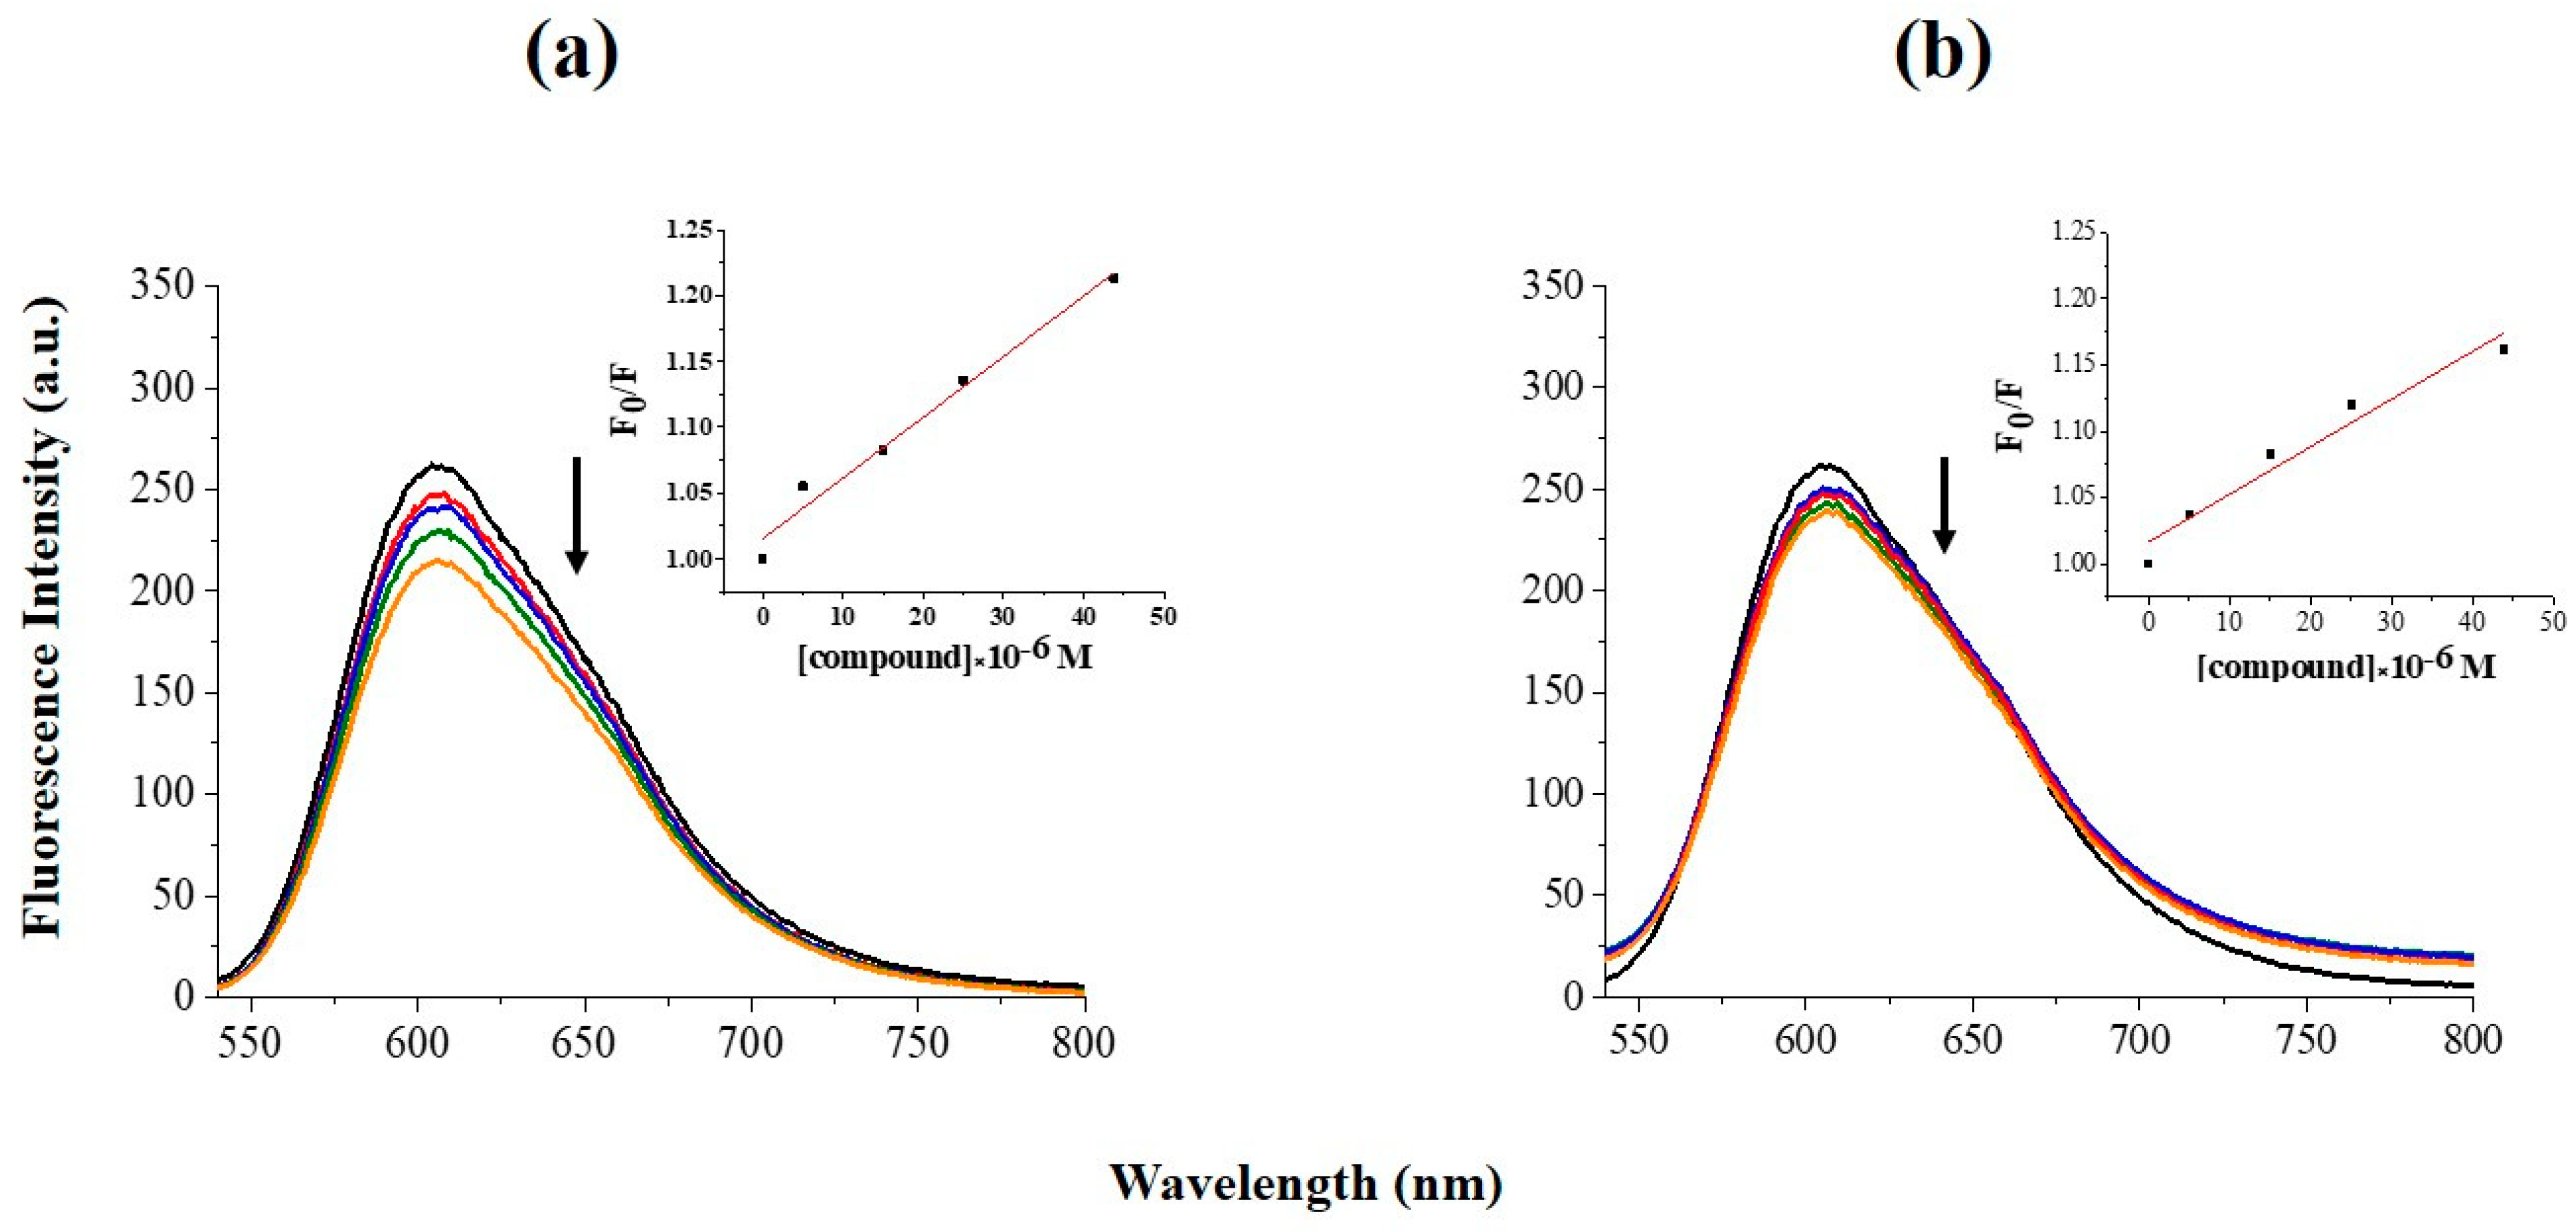
2.4.3. Ethidium Bromide Competitive Studies

Ethidium bromide (EtBr) can serve as a very helpful DNA structural probe, and causes significant increase in fluorescence intensity upon DNA intercalation. However, this enhancement of the fluorescence can be decreased in the presence of another agent, which has the ability to compete and replace the bound EtBr or disturb the secondary DNA structure [41,42]. Consequently, the fluorescence curves shown in Figure 6 can be used to investigate whether there are any changes in the emission intensity of EtBr in the presence of various concentrations of either Cu-1 or L1.
Upon addition of Cu-1 to the EtBr-DNA equilibrium system, a significant reduction in fluorescence intensity of the band at 606 nm was observed (Figure 6a), reaching the value of 33% of the initial fluorescence intensity. Furthermore, the results from the plots perfectly fit into the linear Stern–Volmer equation with KSV value being 9.98 ± 0.19 × 10³ M−1. This value is in accordance with the one recorded for other intercalator copper complexes that effectively replace the EtBr from EtBr-DNA equilibrium complex [43]. Similar experiments using ligand L1 (Figure 6b) showed only a small reduction of the DNA-induced EtBr emission intensity of the order of 9.8% (KSV = 3.60 ± 0.11 × 10³ M−1), which suggests that Cu-1 is much more effective in displacing EtBr.

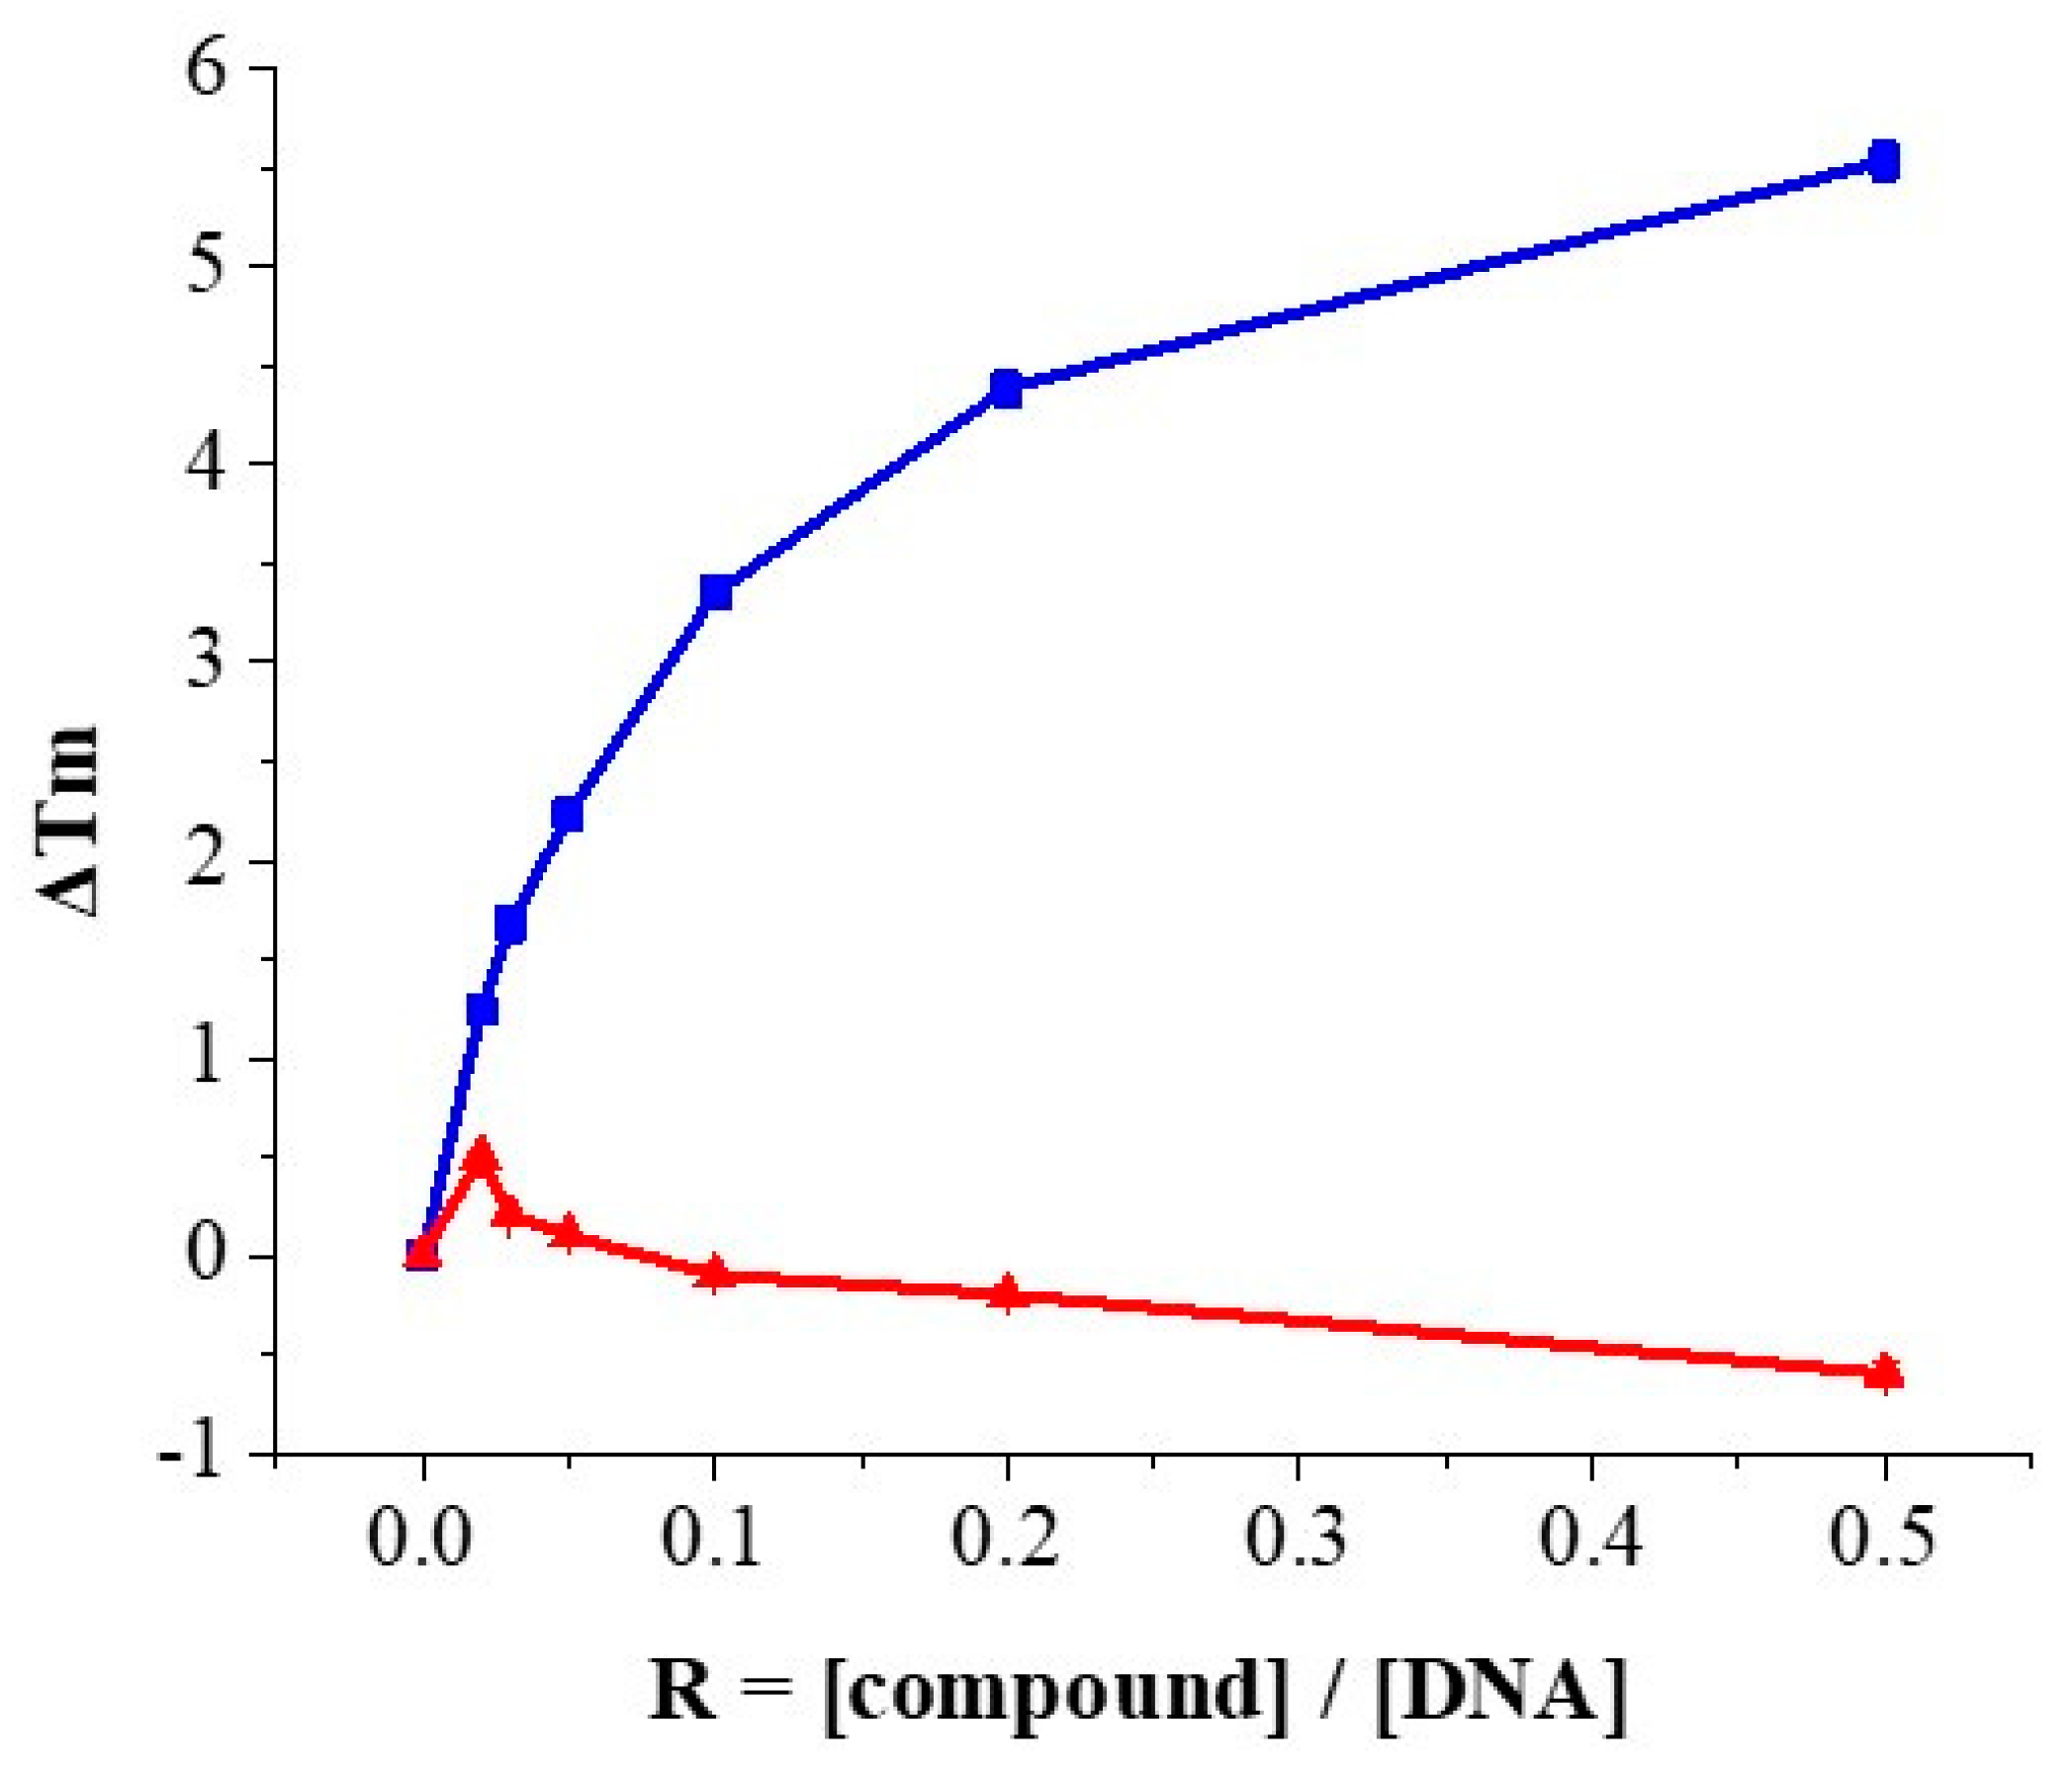
2.4.4. Thermal Denaturation Studies

Thermal denaturation of DNA is the process of separation of double-stranded (ds)-DNA into two single strands upon increasing the temperature of the DNA solution. There is a specific temperature under a given set of experimental conditions at which half of the DNA molecule remains in double helical form and the other half in a random coil state, widely known as the melting temperature (Tm) of the DNA [44]. Many drugs, organic molecules and metal complexes that interact with DNA have been shown to alter DNA Tm to various extents depending on their mode of interaction [22]. The magnitude of ΔTm (the difference in Tm of a DNA molecule in the absence and presence of bound compounds) can provide experimental information about the mode of interaction [44]. Consequently, to further investigate the degree and the mode of Cu-1-DNA binding, the melting temperature of CT-DNA in the presence and absence of different concentrations of either Cu-1 or L1 was monitored. Figure 7 presents the ΔTm values obtained in the presence of different concentrations of compounds plotted against the compound/DNA ratios (R) employed. Under our experimental conditions, the Tm of untreated CT-DNA was found to be equal to 69.88 ± 0.51 °C, in good agreement with various reported literature values [45,46,47]. As can been seen in Figure 7, the ΔTm of CT-DNA gradually increased upon addition of Cu-1 reaching a value of 5.54 ± 0.05 °C at the highest complex concentration (R = 0.5) (Figure 7, blue line). The presence of L1 in the CT-DNA solution slightly affected the Tm values and no significant alterations were recorded (Figure 7, red line).
According to the literature, DNA double helix is stabilized upon intercalation of natural or synthetic compounds, as a result of stacking interactions stabilization, accompanied by a considerable increase in the DNA melting temperature [48]. Classical intercalators, such as EtBr, result in sharp increase of the CT-DNA Tm, ranging from +4 °C to +14 °C in a dose-dependent manner until all the intercalating sites are saturated [49]. Thus, in our case, the observed increase in the Tm of CT-DNA strongly supports intercalation of metal complex into double-helix DNA. Similar increases in CT-DNA Tm was also reported for some bipyridine-Cu(II) complexes [48,50] and copper (II) complexes of 2-aminobenzothiazole Schiff bases with β-ketoanilides [32] that were attributed to an intercalative mode of DNA binding. Finally, the intercalative mode of DNA binding of the copper(II) complex of 6-hydroxychromone-3carbaldehyde-(3′-hydroxy) benzoylhydrazine was clearly suggested by the increase in Tm value by 5.6 °C, which was also confirmed by computational docking simulation studies of the copper(II) complex with DNA [51]. In this study, docking into the CT-DNA of the Cu(II) complex, revealed that the planar structure of the complex successfully intercalated between the base pairs of DNA, forming π–π* interactions with the adjacent nucleotide moieties, something that may also reasonably be postulated in this case.

2.4.5. Viscometry

Changes in DNA length dramatically affect its hydrodynamic properties, making viscosity measurements a very sensitive, critical and authentic test for elucidating the binding mode of small molecules to nucleic acids in solution [52]. A graphical representation of the viscosity measurements of DNA solutions after treatment with either Cu-1 or L1 is shown in Figure 8. It can be clearly seen that increasing concentrations of Cu-1 resulted in a noticeable viscosity increase of the CT-DNA solution (Figure 8, blue line). Based on previous studies [52], the axial length of DNA increases and becomes more rigid when a molecule intercalates. Both factors increase the frictional coefficient and hence the viscosity of DNA in solution. The recorded increase of the viscosity of the CT-DNA in the presence of Cu-1 is similar to the ones observed in the literature for Cu(II) complexes of benzothiazole Schiff bases that found to strongly bind to calf thymus DNA by an intercalation mode [33]. Therefore, the viscosity studies support the intercalative mode of Cu-1–DNA interaction as already established through absorption titration, thermal denaturation, fluorescence EtBr displacement assay and CD studies. On the contrary, the addition of L1 causes a sharp drop in the viscosity of the DNA solution to nearly 50% of its initial value, even at very low ligand concentration (Figure 8, red line). This drop reached a plateau after the addition of only a small amount of L1, at approximately R = 0.033, after which viscosity remains unchanged regardless of the further addition of compound.
Taken together, the DNA binding studies of complex Cu-1 revealed a completely different mode of interaction with CT-DNA, i.e., classical intercalation, compared to ligand L1. Based on the extensive analysis done in our previous communication [22], the mode of DNA binding of L1 is via a combined mode of action involving both groove binding and nonclassical intercalation. It is of interest that in the case of the corresponding Pt(II) and Pd(II) complexes of L1, formation of covalent bonds in the minor groove takes place as well [22], demonstrating once again the dissimilar manner of DNA interaction in the case of complex Cu-1. The differences may be attributed to the different coordination mode of ligand L1 to Cu(II) compared to Pt(II) and Pd(II) complexes in which L1 acted as bidentate ligand through coordination of the amine and pyridine nitrogens, resulting overall in a more flexible structure. In the case of Cu-1, ligand L1 acts as tridentate ligand with coordination taking place through the carbonyl oxygen of the amide, the pyridine nitrogen, and the secondary amine nitrogen, limiting the mobility of the phenylbenzothiazole structure and resulting in a more rigid structure. This may be the reason for such a distinct difference between complex Cu-1, compared to ligand L1 and the corresponding Pt(II) and Pd(II) complexes, which exhibited much less intercalative character [22,53,54,55,56].

2.5. Biological Evaluation

2.5.1. In Vitro Cytotoxicity

The cytotoxic profile of the new copper complex was evaluated by means of the MTT assay against a diverse panel of cancer cell lines, namely, MCF-7 and the MDA-MB-231 breast cancer, U-87 MG glioblastoma, PC-3 prostate and A-549 lung cancer cell lines along with the healthy fibroblasts DSF. The latter will serve as a comparative control for the assessment of the specificity of the complex against cancer cells. It is worth mentioning that the MCF-7 breast cancer cell line is very sensitive to 2-(4′-aminophenyl)benzothiazole, whereas MDA-MB-231 breast cancer cell line is less sensitive to 2-(4′-aminophenyl)benzothiazole moiety with much higher IC50 value [23,57,58]. Cisplatin was used as a positive control as it is one of the most widely clinically used anticancer metallodrugs. Table 3 summarizes the cytotoxicity IC50 values obtained for Cu-1, L1 and cisplatin in the above mentioned cancer cell lines. Moreover, indicative dose–response curves are provided in Supplementary Information Figure S5. The cytotoxicity of copper nitrate was also evaluated in order to assess the toxicity of copper and nitrate ions in the specific cells. Cu-1 exhibited IC50 values ranging between 2.2 and 39.7 μM, which render it a highly potent compound. It is noteworthy that the activity of Cu-1 in the breast cancer cells was superior (MCF-7) or equal (MDA-MB-231) to that of cisplatin. Furthermore, much lower cytotoxicity was exhibited in the DSF healthy fibroblasts (IC50 value of 132.2 μM). L1 and Cu(NO3)2·3H2O did not affect cell survival significantly and exhibited IC50 values > 330 μM and >228.8 μM, respectively. Interestingly, the highest cytotoxic activity was observed in the MCF-7 breast cancer cell line (IC50 value of 2.2 μM), which is in agreement with our initial design, suggesting that Cu-1 retains the selectivity of 2-(4′-aminophenyl)benzothiazole against the MCF-7 cells. In our previous communication, an increased cytotoxic activity of the corresponding Pt(II) and Pd(II) complexes against similar breast cancer cell lines was also observed; however, in this study, complexation with copper induced a more profound cytotoxicity with IC50 values being 10 to 35 fold higher for MCF-7- and 9-fold higher for MDA-MB-231 cells, under the same experimental conditions [22].
The MCF-7 cells that displayed the higher sensitivity to Cu-1 were, therefore, selected for further investigation on cell uptake, intracellular ROS levels, cell cycle effects and apoptosis, aiming at further understanding the mode of anticancer activity.

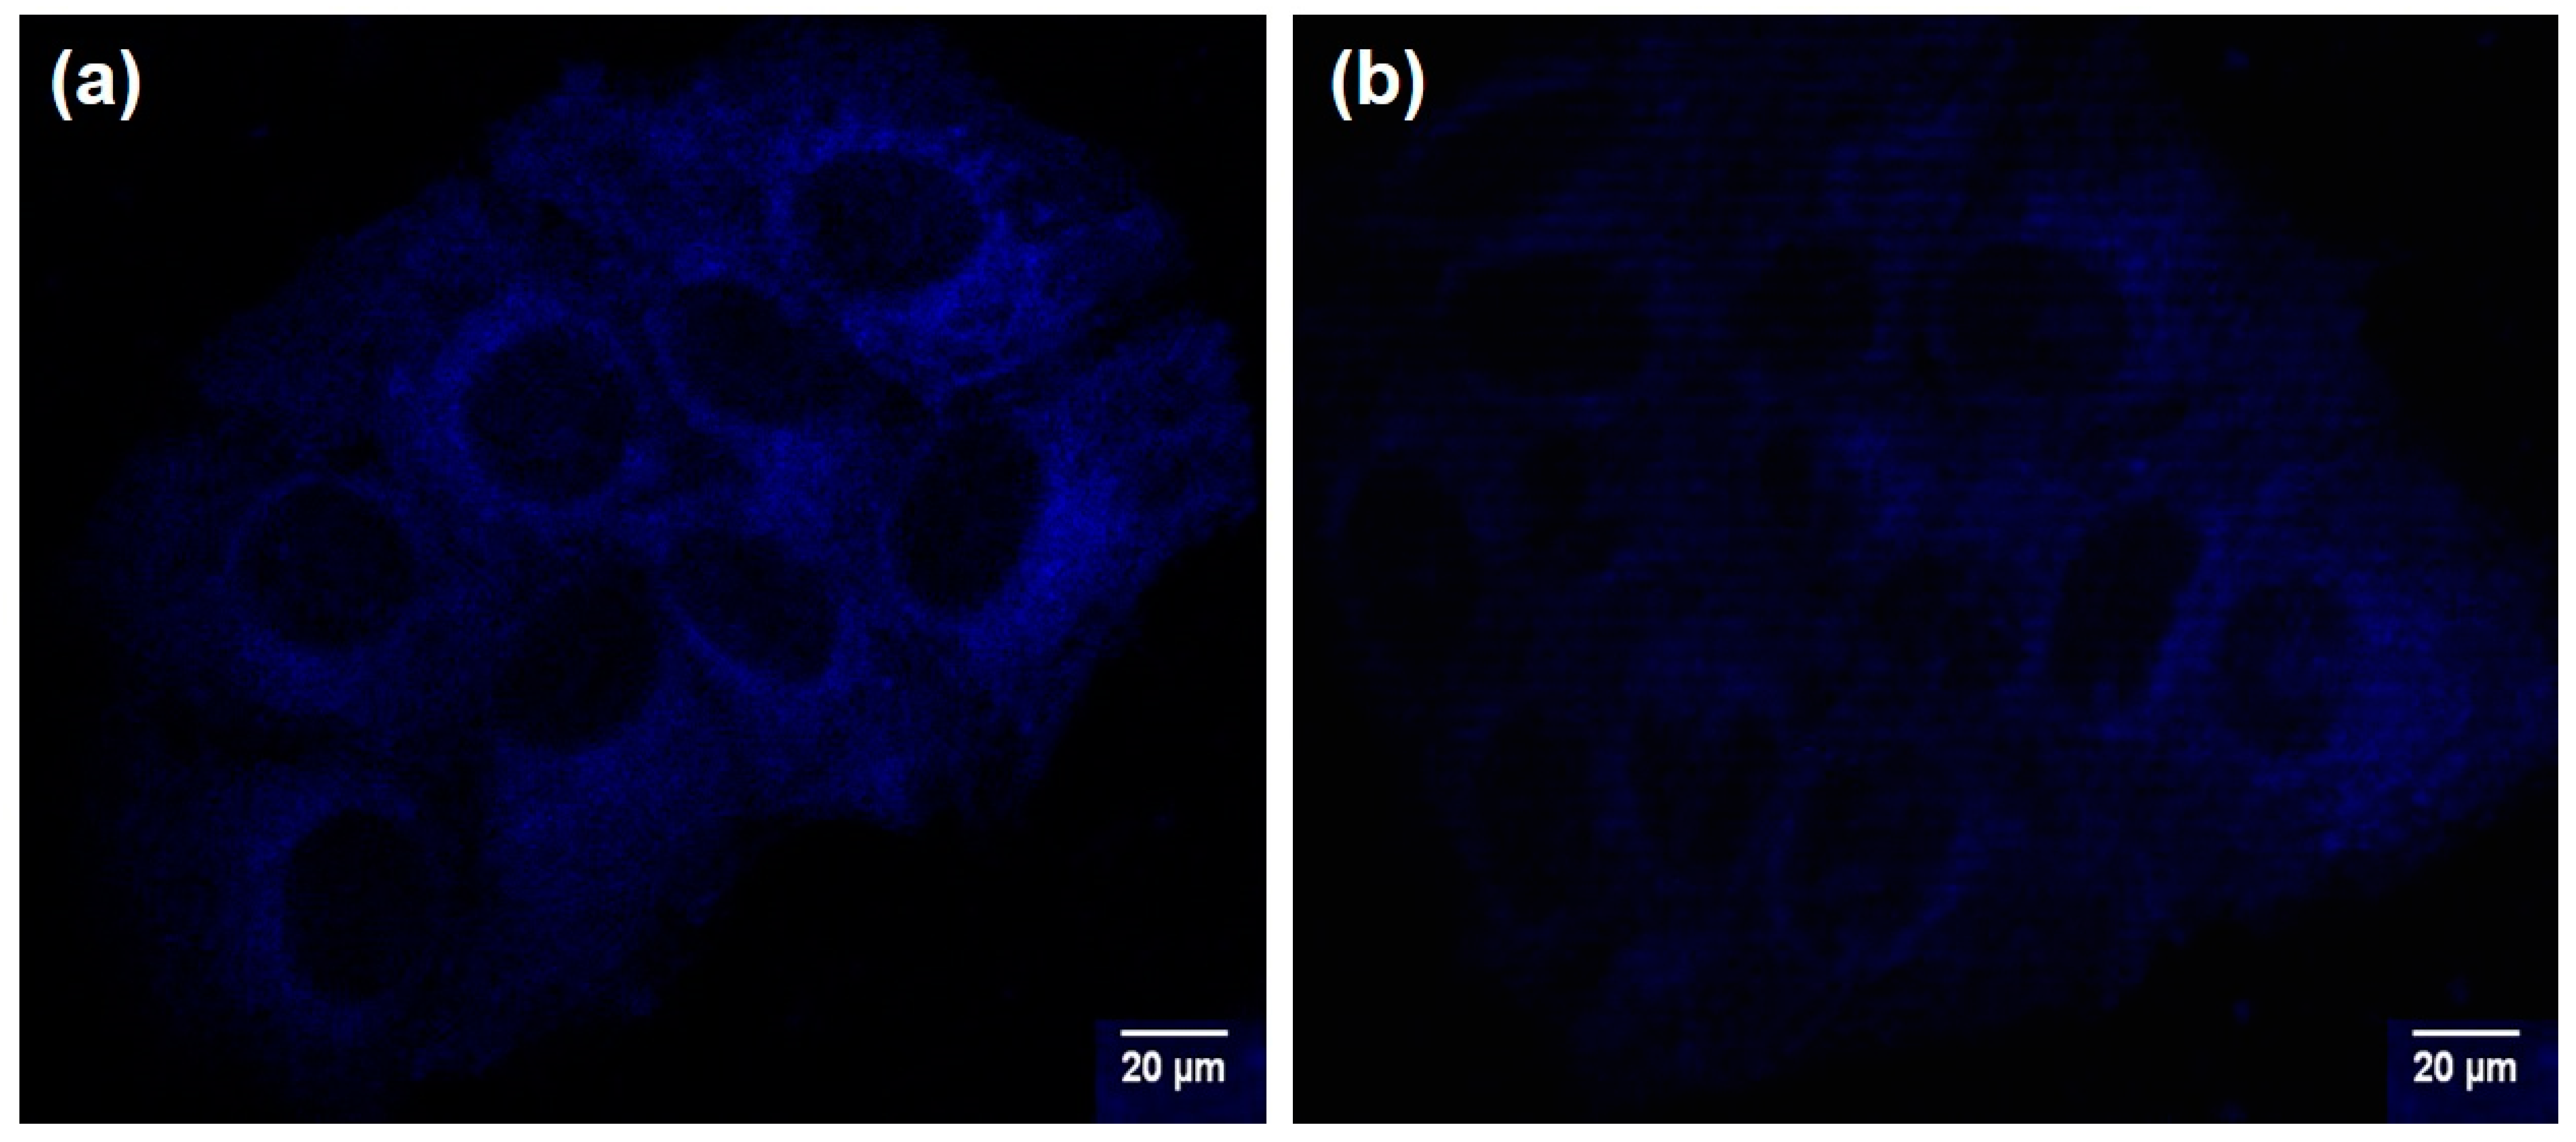
2.5.2. Cellular Uptake

Cell uptake and localization of a compound is strongly related to its biological activity [59]. Fluorescence confocal microscopy is among the most popular methods to follow the fate of a fluorescent compound at a cellular level. Thankfully, the 2-(4′-aminophenyl)benzothiazole pharmacophoric moiety of Cu-1 retains its fluorescent properties and the cellular uptake of either the complex or the ligand can be evaluated [23]. Representative images of MCF-7 cells after a 24 h incubation with either the complex Cu-1 (5 μM) or the ligand L1 (5 μM) are presented in Figure 9.
The fluorescence of the cells treated with L1 is very weak presumably due to the limited entrance of the ligand into the cells. On the contrary, complex Cu-1 is highly and uniformly taken up by the MCF-7 cells with the fluorescence signal being present mainly in the cytoplasm and to a much lesser extent in the nucleus. This increased intracellular fluorescence may only be attributed to the higher internalization of Cu-1 as the solution fluorescent properties of the ligand are not significantly affected by the complexation of copper (Supplementary Information Figure S4). Our results suggest that complexation of copper to the pharmacophoric ligand results in increased uptake, a property that may well contribute to increased potency against the MCF-7 cells.

2.5.3. Intracellular ROS Levels

Cu(II) complexes can be easily transformed to Cu(I), and this redox interplay has been suggested to contribute into the Cu(II)-induced DNA damage due to the generated reactive oxygen species (ROS), such as singlet oxygen (1O2), superoxide anion radical (O2•−), hydroxyl radical (OH), etc. [38,60]. More specifically, copper has been used as a metal center in metallodrugs containing intercalating ligands due to its ability to catalytically generate reactive oxygen species (ROS), such as hydroxyl radicals (OH) [61]. Driven by this knowledge, the generation of intracellular ROS in MCF-7 cells after treatment with either Cu-1 or L1 was assessed through DCFH-DA assay. The DCF fluorescence related to the presence of ROS in the cells treated with Cu-1, L1 and Cu(NO3)2·3H2O is shown in Figure 10. The fluorescence intensity measured for the untreated cells was found to be very similar to that of the cells treated with L1, between 15 and 20%. ROS production was higher, reaching the value of 31%, when Cu(NO3)2·3H2O was added into the cell culture, demonstrating the ability of copper to participate in redox reactions and radical generation as long as it is in solution and can penetrate the cells [62]. However, the presence of complex Cu-1 in the MCF-7 cells induced an increase in intracellular ROS production of 65%, which is twice as much as the Cu(NO3)2 effect. In a similar approach [61], specific Cu(II) complexes found to have comparable to Cu-1 IC50 values; moreover, the recorded biological activity was ascribed to the synergistic effect of ROS generation with the intercalation ability into the DNA minor grooves and blocking DNA replication.

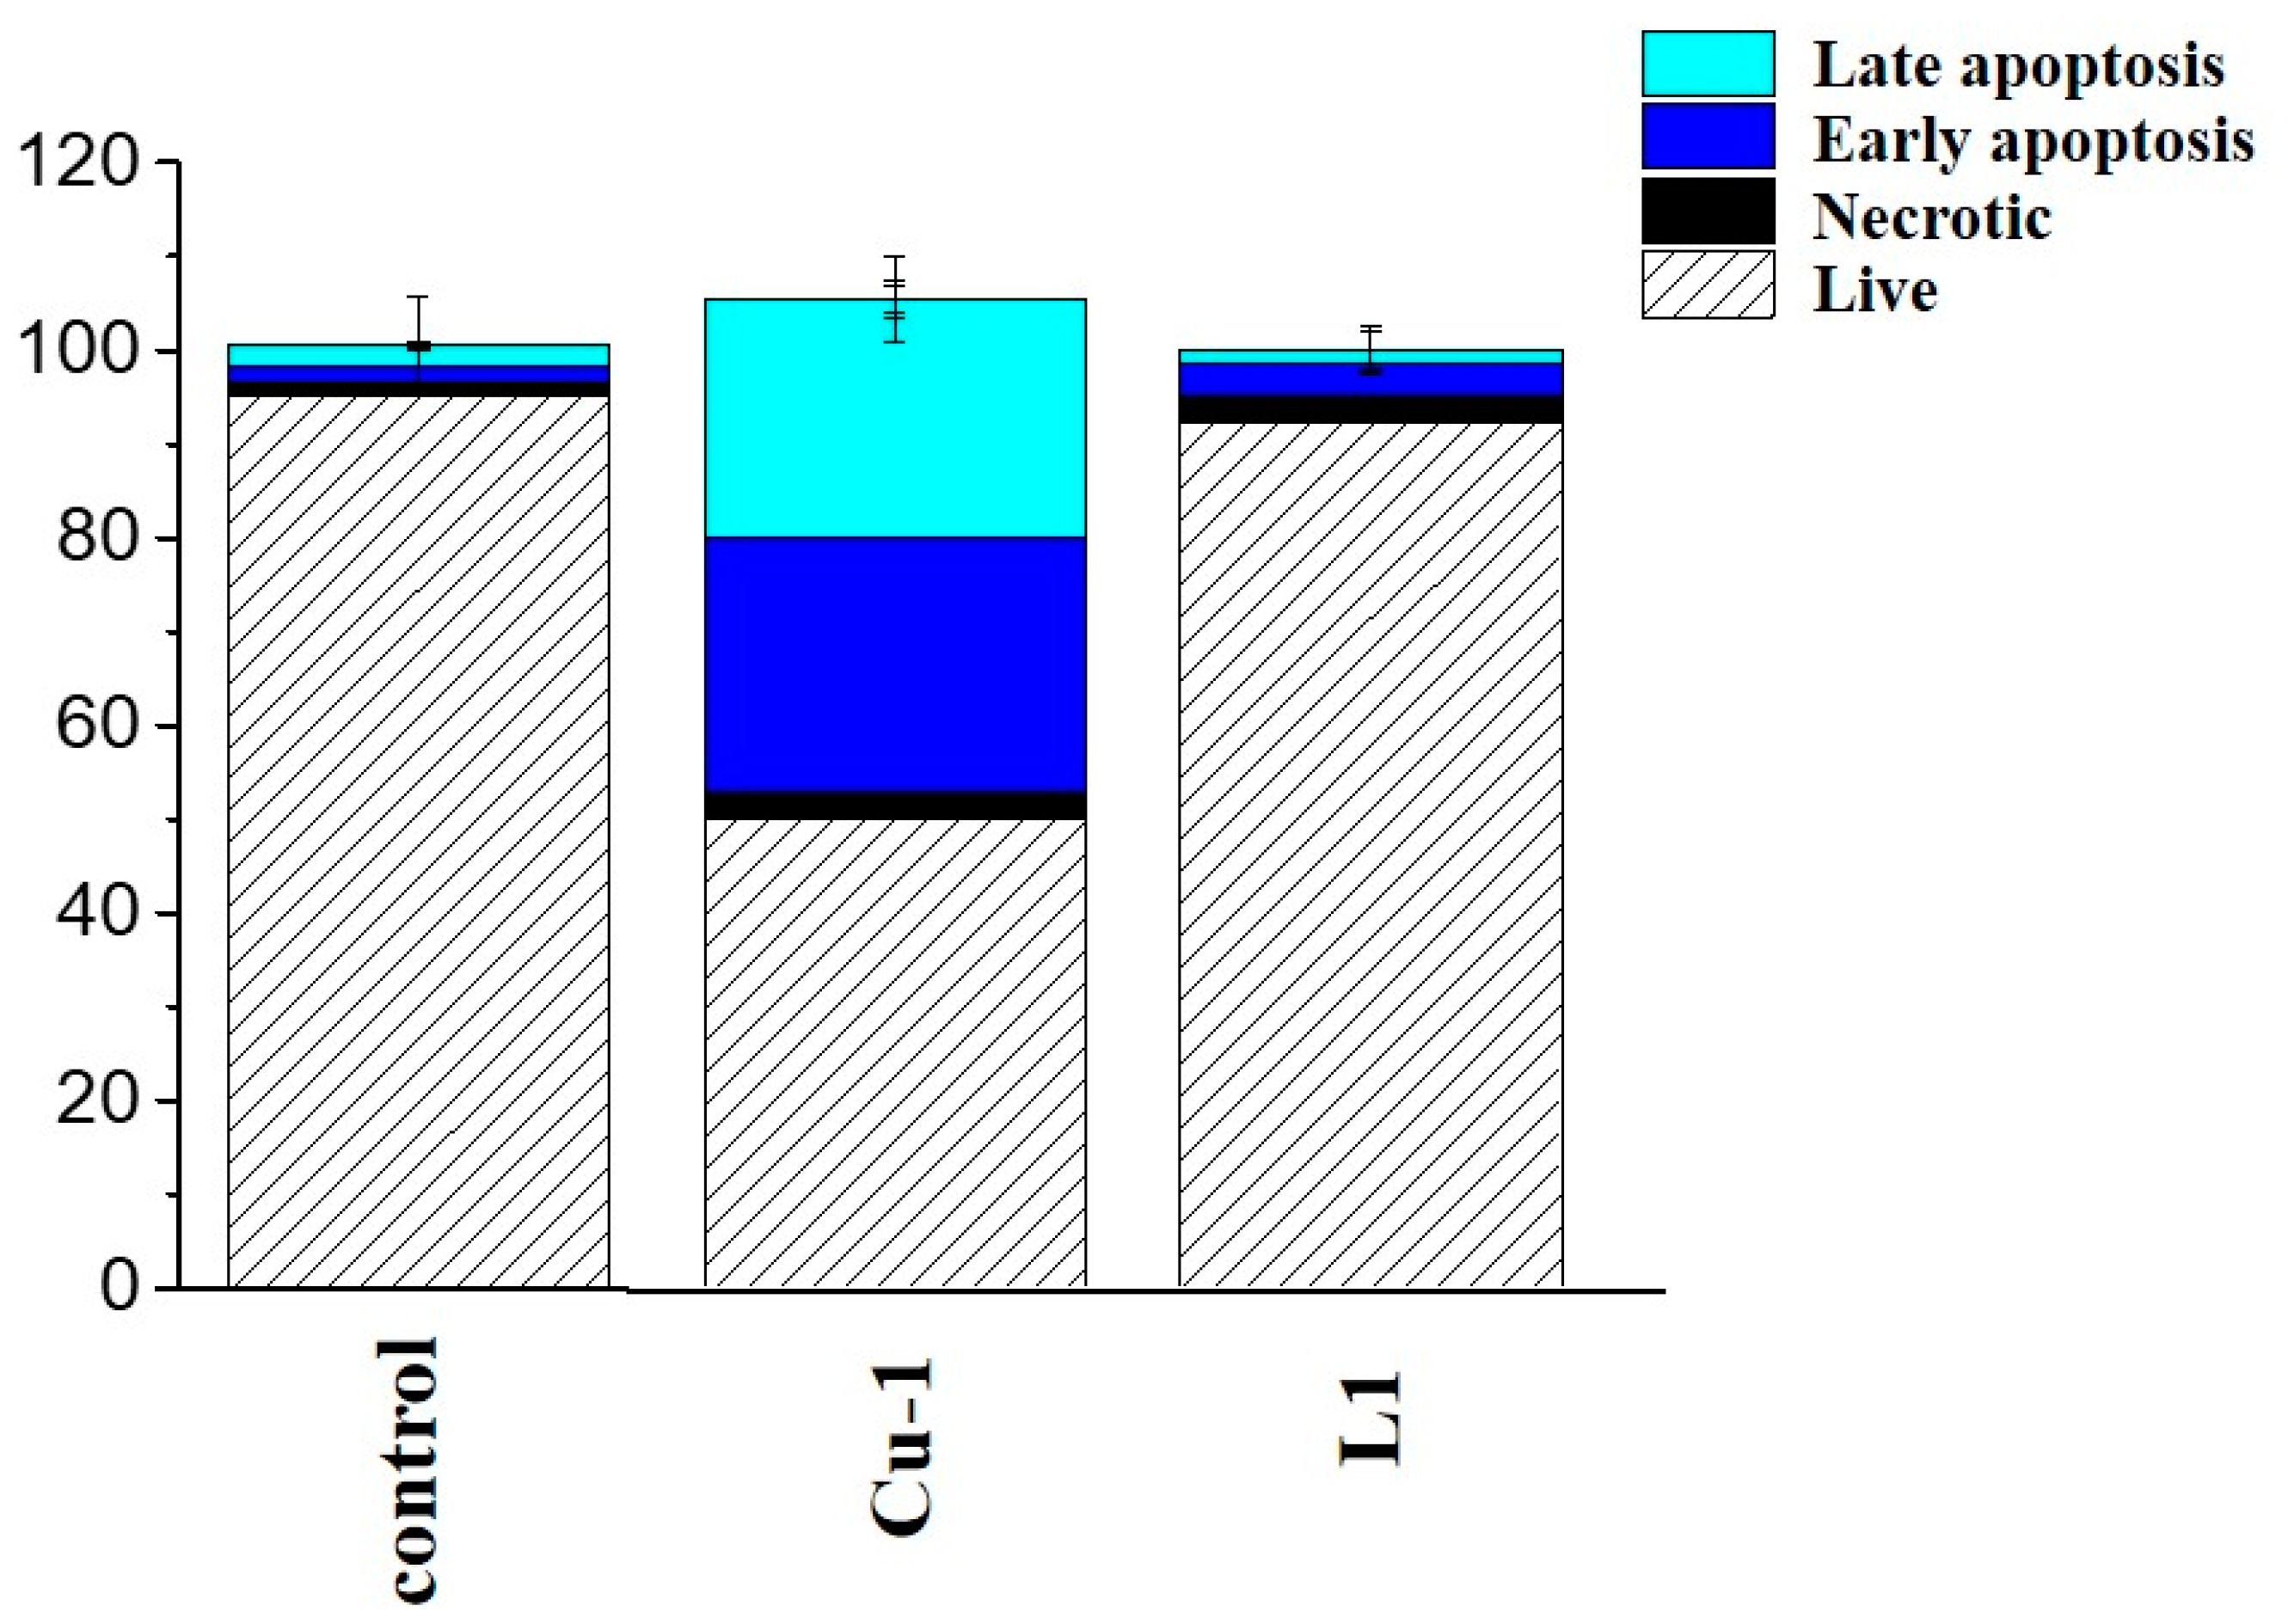
2.5.4. Cell Cycle Analysis and Apoptosis Assessment

In an attempt to evaluate whether Cu-1 cytotoxicity was associated with disturbance of the cell cycle progression, cell cycle distribution of Cu-1-treated MCF-7 cells was assessed by flow cytometry. As is summarized in Table 4 (see also Supplementary Information Figure S6), complex Cu-1 resulted in almost doubling the number of cells in the G2/M phase of the cell cycle relative to the control, from 24.08 to 40.78%. A noticeable reduction in the distribution of cells in the S phase of the cell cycle, dropping to 6.52%, was also witnessed. In the case of L1, no particular deviation from the control values of the cell cycle distribution was observed (Table 4).
The cytotoxicity, ROS generation and cell cycle modification results strongly support the ability of Cu-1 to induce cell death. It is, however, equally important to examine the type of cell death, and in particular to investigate if apoptotic events occur. The flow cytometry evaluation of annexin V–FITC/PI-stained cells enabled us to distinguish between the viable cells (annexin V negative (−)–PI negative (−)), apoptotic cells (annexin V positive (+)–PI negative (−)), late apoptotic cells/secondary necrotic cells (annexin V+/PI+), and necrotic cells (annexin V−/PI+). Quantification of living, early/late apoptotic and necrotic cells is presented in Figure 11 and Supplementary Information Figure S7, where the flow cytometric analysis diagrams can be seen. After exposure of MCF-7 cells to L1 no cells undergoing apoptosis/necrosis were detected and the corresponding values were similar to the ones obtained for the control group (Figure 11). This was not the case with Cu-1 where the amount of both early and late apoptotic MCF-7 cells increased significantly, reaching a total apoptotic population of 52.6% of the control, with no particular change in the percentage of necrotic cells. The difference in apoptosis induction between the Cu-1 and L1 may be correlated with the difference in cytotoxic activity.
Overall, the enhanced anticancer activity after copper complexation represented by the in vitro biological study of this work compares favorably to other copper complexes in the literature. Previous studies have shown that casiopeinas, which are already undergoing clinical tests, also act through oxidative mechanisms causing related cell damage and death [21]. Previously reported copper(II) complexes with thiosemicarbazone-derived Schiff bases and 2-amino-5-methylthiazole ligands have also exhibited similar cellular effects [63,64]. The induction of oxidative stress and subsequent DNA damage has been among the most notable molecular mechanisms reported in the literature associated with G2/M cell phase arrest and ultimately cellular apoptosis [15,65,66].
In conclusion, complex Cu-1 is considered a very promising agent, as it displays strong anticancer activity, especially against the MCF-7 breast cancer line. This activity may be associated with its intercalative DNA interaction, high cell uptake, ample ROS generation and induction of apoptosis. The study of the cellular mechanistic pathways in cancer cell lines that are sensitive to 2-(4′-aminophenyl)benzothiazole is already in progress to evaluate the potential use of the complex Cu-1 as an anticancer agent.

3. Experimental

3.1. Materials and Methods

All important information regarding materials and equipment used are provided in Supplementary Information.

3.2. Synthesis and Characterization

The 2-(4′-aminophenyl)benzothiazolyl L1 was synthesized and characterized according to the procedure previously reported by our group [22,23].

3.3. Synthesis of Complex Cu-1

Methanolic solutions of Cu(NO3)2·3H2O (0.33 mmol, 0.09 g in 5 mL MeOH) and L1 (0.33 mmol, 0.125 g in 5 mL MeOH) were mixed under continuous stirring and reflux at 60 °C. To the resulting turquoise clear solution, imidazole (0.67 mmol, 0.05 g) was added under continuous stirring. No color change was observed after the addition of imidazole and the solution was allowed to cool down to ambient temperature. Subsequently, diethyl ether was added and the reaction vessel was stored at 4 °C. Forty days later, bluish crystals formed which were isolated via filtration and subsequent drying in vacuo. Yield: 0.09 g (38%). IR (KBr, cm−1): v(N-H)pyridine = 3149, v(C=C)pyridine = 1621, 1598, v(C=O)amide I = 1619, v(N-H)pyridine = 1597, 1552, v(C-H)benzothiazole = 1486, v(C-C)benzothiazole = 1456, 1434, v(M-N) = 470, 501, v(M-O) = 516. UV-vis (DMSO): λ (nm) = 338, ε338 nm (M−1cm−1) = 40,000. Anal. Calcd. for Cu-1, [Cu(C21H18N4OS)(C3H4N2)(NO3)]n·n(NO3) (C24H22N8O7SCu, Mr 630.10): C, 45.75; H, 3.52; N, 17.78%; S, 5.09%. Found: C, 45.73; H, 3.48; N, 17.75%; S, 5.07%. HR-ESI-MS (positive mode), calcd. for [Cu(C21H18N4OS)(NO3)]+ m/z = 499.0375, found m/z = 499.0345 (Supplementary Information Figures S2–S4). The stability of the complex Cu-1 in DMSO was confirmed by means of UV-vis spectroscopy (Supplementary Information Figure S4A) where no wavelength shift or intensity changes of the characteristic band centered at 338 nm were observed for a period of >7 days.

3.4. X-ray Crystal Structure Determination

X-ray quality crystals of Cu-1 were grown from a mixture of MeOH-diethyl ether. Both crystals were mounted on a Bruker Kappa APEX 2 diffractometer, equipped with a triumph monochromator, using Mo Kα radiation (λ = 0.71073 Å) at room temperature. 132 high θ reflections for Cu-1 were used for the determination of cell dimensions. Intensity data were recorded using φ and ω–scans. All crystals presented no decay during the data collection. The Bruker SAINT Software package has been employed for data integration of the frames collected [67]. SADABS program was used for data processing (numerical absorption correction based on dimensions) [68]. The structure was solved by the SUPERFLIP package [69]. CRYSTALS program package version 14.61 build 6236 was used for the final refinement and all subsequent remaining calculations using full-matrix least-squares methods on F2 [70]. Molecular illustrations were drawn with use of the CAMERON graphics package [71]. All non-hydrogen atoms were anisotropically refined. Hydrogen atoms were located from difference Fourier maps and refined at idealized positions riding on the parent atoms with isotropic displacement parameters Uiso(H) = 1.2Ueq(C) or 1.5Ueq(methyl,-NH hydrogens) and at distances C--H 0.95 Å, N--H 0.86 Å. Crystallographic details for complex Cu-1 are summarized in Table 1 and Table 2. Further details on the crystallographic studies are provided in Supplementary Information Table S1 and in the form of a .cif file.

3.5. DNA Binding Studies

In all DNA experiments, plain solution of either Cu-1 or Cu(NO3)2·3H2O with buffer or DNA were similarly evaluated for comparison purposes.

3.5.1. Absorption Titration Studies

UV-vis titration studies were performed in PBS (final DMSO content = 1%), by keeping the concentration of complexes constant (10−5 M) while varying the DNA concentration (0–10−4) to achieve ratios R = [DNA]/[compound] of 0.0, 0.01, 0.02, 0.2, 0.5, 1.0, 2.0, 10.0. The intrinsic binding constant Kb was calculated from the absorption spectral titration data by employing Equation (1) [72]:
D N A ε a ε f = D N A ε b ε f + 1 K b · ( ε b ε f )
where [DNA] is the concentration of DNA in base pairs, εa is the molar absorption coefficient of the observed absorption band at the given DNA concentration, εf is the molar absorption coefficient of the free complex in solution, and εb is the molar absorption coefficient of the compound when fully bound to DNA. A plot of [DNA]/(εaεf) versus [DNA] gave a slope 1/Kb·(εbεf). The analysis was done using Origin Lab 9.0.

3.5.2. Thermal Denaturation Studies

DNA melting experiments were carried out by monitoring the absorbance of DNA at 258 nm in the temperature range of 25.0–95.0 °C. The melting temperature (Tm) of DNA was defined as the midpoint of the optically detected transition. The thermal melting experiments were performed in triplicate in PBS (final DMSO content = 1%) by keeping a constant amount of DNA (5 × 10⁻⁵ M) while varying the concentration of compound (0–2.50 × 10⁻⁵ M) to achieve ratios R = [compound]/[DNA] of 0.0, 0.01, 0.02, 0.033, 0.05, 0.1, 0.2, 0.33, 0.5.

3.5.3. Circular Dichroism

Circular dichroism (CD) spectra of CT-DNA were recorded in the range 180–600 nm at 25 °C. Experiments were performed in PBS (final DMSO content = 2%). DNA concentration remained constant (5 × 10⁻⁵ M) while varying the concentration of compound (0–2.5 × 10⁻⁵ M) to achieve ratios R = [compound]/[DNA] of 0.0, 0.01, 0.02, 0.033, 0.05, 0.1, 0.2, 0.33, 0.5.

3.5.4. Competitive Binding Experiments in the Presence of Ethidium Bromide

A solution containing CT-DNA (2.50 × 10⁻⁵ M) and EtBr (6.25 × 10⁻⁶ M) was prepared in Na2HPO4–K2HPO4 buffer solution (pH 7.0). The CT–DNA-EtBr solutions were coincubated for 24 h. Experiments were performed in PBS (final DMSO content = 2%). Constant DNA and EtBr concentrations were treated with increasing concentrations of compounds (0–2.20 × 10⁻⁵ M) to achieve ratios R = [compound]/[DNA] of 0, 0.1, 0.2, 0.3, 0.4, 0.5, 0.625, 0.875. For the calculation of the Stern–Volmer constants (KSV), Equation (2) was used:
F o F = 1 + K s v · [ c o m p o u n d ]
where Fo and F are the emission intensities in the absence and the presence of the samples, respectively. The concentration of the compound was plotted against the ratio Fo/F; the KSV value was equal to the slope [73,74].

3.5.5. Viscosity Studies

Experiments were carried out in PBS (final DMSO content = 2%) by keeping the DNA concentration constant (5 × 10⁻⁵ M) while varying the concentration of compound (0–2.5 × 10⁻⁵ M) to achieve ratios R = [compound]/[DNA] of 0, 0.01, 0.02, 0.033, 0.05, 0.1, 0.2, 0.33, 0.5. The intrinsic viscosity η was calculated according to the relation η = (t − t0)/t0, where t0 is the flow time for the buffer and t is the observed flow time for DNA in the presence or absence of the complexes. Data are presented as (η/ηo)1/3 versus R where η and ηo are the intrinsic viscosities in the presence or absence of the compounds. For the low DNA concentrations used in these experiments, the intrinsic viscosity η is proportional to the difference in the flow times for the buffer with and without DNA, resulting in the following Equation (3):
L L o = n n o 1 / 3 = t t o t D N A t o 1 / 3
where L and Lo are the DNA lengths and η and η0 are the intrinsic viscosities with and without the compound. The tDNA, to and t are the flow times of the buffer, the plain DNA and the DNA–compound solution, respectively [22].

3.6. In Vitro Investigation

3.6.1. MTT Viability Assay

The MTT colorimetric assay was used to evaluate the in vitro cytotoxicity of Cu-1 against the desired cell lines following a published procedure [75]. The cells were grown overnight after they were seeded in 96-well plates (3 × 10³ cells per well in 100 μL culture medium) at 37 °C in a 5% CO2 incubator. Various concentrations of ligand, complex, copper nitrate or cisplatin (10−3–10−8 M) were added in the cells and remained for 72 h and the final DMSO content never exceeded 0.2%. After the removal of the medium at the endo of the incubation time, the MTT solution (100 μL, 1 mg·mL−1) was added. The 4 h incubation, was followed by aspiration of the solution and the resulting formazan crystals were solubilized in DMSO (100 μL). Finally, the absorbance was recorded at 540 nm (Tecan well plate reader). The results were expressed as % cell viability = (mean optical density (OD) of treated cells/mean OD of untreated cells) × 100. The IC50 values (the concentration required to reduce cell viability by 50%) were calculated from the dose–response curves using the GraphPad Prism 5.0 software.

3.6.2. Cellular Uptake by Confocal Microscopy

Cells were grown overnight on glass base dishes (1 × 10⁵ cells per dish) [22,75]. Nontoxic concentration of the compounds was used (5 μΜ) for a 24 h incubation and the specimens were examined under a multiphoton confocal microscope. The complex was stable under the DMEM culture medium conditions during the 72 h incubation time, as evidenced by UV-vis studies.

3.6.3. ROS Generation Detection Assay

The DCFDA assay was used to determine the abundance of intracellular reactive oxygen species (ROS) [75,76]. After incubation with either Cu-1 and L1 and Cu(NO3)2·3H2O (at IC50 concentration) for 72 h, DCFH-DA was added to the cells (10 μM in serum-free medium) at 37 °C for 30 min. The DCF fluorescence intensity was recorded with a fluorescence microplate reader (excitation wavelength of 488 nm and an emission wavelength of 525 nm). ROS levels are presented as arbitrary fluorescence units (AFU). Untreated cells served as controls.

3.6.4. Cell Cycle Analysis

MCF-7 cells were treated with either Cu-1 and L1 at their IC50 concentrations or at the corresponding amount of DMSO as control, for 72 h [75]. The mixture of the trypsinized cells with the supernatant was centrifuged for 10 min at 1000 rpm and at 4 °C. The precipitated cells were then resuspended in PBS, and a second centrifugation followed. Finally, the cells were fixed in 50% ethanol in PBS. A propidium iodide (PI) solution which contained RNase was used for nuclei staining to analyze the DNA content using a FACS flow cytometer.

3.6.5. Annexin V–PI Apoptosis Assay

MCF-7 cells were treated with the IC50 values of the Cu-1 and L1 or the corresponding DMSO amount as control, for 72 h [75]. After trypsinization, cells were resuspended in PBS and centrifuged for 5 min at 1000 rpm and the pellet mixed with PBS and 5 μL of annexin V–FITC, and then 4 μL of 0.1 mg/mL PI solution was added. The mixture was incubated for 15 min in the dark and the cells were then subjected to FACS flow cytometry.

3.6.6. Statistical Analysis

At least three independent experiments for each study were performed, and the data are presented as means ± standard deviation (SD) using the GraphPad Prism 6.0 software.

Supplementary Materials

The following supporting information can be downloaded at: https://www.mdpi.com/article/10.3390/inorganics11030132/s1, Figure S1: The structures of highly promising anticancer Cu complexes, Figure S2: ESI-MS spectrum of complex Cu-1, Figure S3: IR spectrum of complex Cu-1, Figure S4: Absorbance (250–500 nm) and Fluorescence spectra (350–550 nm, after excitation at 340 nm) of complex Cu-1 (50 μM) in DMSO, Figure S5: Indicative dose–response curves for MCF-7 and DSF cells cultured with Cu-1, L1, Cu(NO3)2·3H2O and cisplatin for 72 h, Figure S6: Representative histograms showing cell cycle arrest following treatment with DMSO, Cu-1 and L1 in MCF-7 cells, Figure S7: Representative dot plots from flow cytometric analysis of the annexin V–FITC/PI assay in MCF-7 cells after treatment with either DMSO or the IC50 concentration of Cu-1 and L1 for 72 h. Table S1: Hydrogen bonds in complex Cu-1. CCDC 2233056 (Cu-1) contains the supplementary crystallographic data for this paper. These data can be obtained free of charge via www.ccdc.cam.ac.uk/conts/retrieving.html (or from the Cambridge Crystallographic Data Centre, 12 Union Road, Cambridge CB21EZ; Fax: (+44) 1223-336-033; or [email protected]).

Author Contributions

Conceptualization, C.M., B.M., M.S. and M.P.; investigation and data analysis, B.M., M.S., E.H., F.K., M.P. and C.M.; crystallographic data, A.G.H. and E.H.; EPR analysis, G.M.; writing—original draft preparation, B.M., E.H., C.M., M.S. and M.P.; review and editing, B.M., M.S., E.H., G.M., F.K., P.B., A.G.H., M.P. and C.M.; resources, B.M., E.H., P.B., M.P. and C.M.; supervision, C.M. and M.P. All authors have read and agreed to the published version of the manuscript.

Funding

Barbara Mavroidi gratefully acknowledges the financial support by Stavros Niarchos Foundation (SNF) through implementation of the program of Industrial Fellowships at NCSR Demokritos and the State Scholarships Foundation (IKΥ) through the implementation of the program Reinforcement of Postdoctoral Researchers-2nd Cycle (MIS-5033021) European Social Fund (ESF)-Operational Programme Human Resources Development, Education and Lifelong Learning. Eleftherios Halevas also acknowledges the financial support by the Foundation for Education and European Culture (IPEP) founded by Nicos and Lydia Tricha.

Institutional Review Board Statement

Not applicable.

Informed Consent Statement

Not applicable.

Data Availability Statement

All data are included in this article.

Conflicts of Interest

The authors declare no conflict of interest.

References

  1. Dollwet, H.H.A.; Sorenson, J.R.J. Historic uses of copper compounds in medicine. In Trace Elements in Medicine; The Humana Press Inc.: Totowa, NJ, USA, 1985; pp. 80–87. [Google Scholar]
  2. Brewer, G.J. Copper in medicine. Curr. Opin. Chem. Biol. 2003, 7, 207–212. [Google Scholar] [CrossRef] [PubMed]
  3. Lebon, F.; Boggetto, N.; Ledecq, M.; Durant, F.; Benatallah, Z.; Sicsic, S.; Lapouyade, R.; Kahn, O.; Mouithys-Mickalad, A.; Deby-Dupont, G.; et al. Metal-organic compounds: A new approach for drug discovery. N1-(4-methyl-2-pyridyl)-2,3,6-trimethoxybenzamide copper(II) complex as an inhibitor of human immunodeficiency virus 1 protease. Biochem. Pharmacol. 2002, 63, 1863–1873. [Google Scholar] [CrossRef] [PubMed]
  4. Roch-Arveiller, M.; Huy, D.P.; Maman, L.; Giroud, J.P.; Sorenson, J.R. Non-steroidal anti-inflammatory drug-copper complex modulation of polymorphonuclear leukocyte migration. Biochem. Pharmacol. 1990, 39, 569–574. [Google Scholar] [CrossRef]
  5. Iqbal, M.S.; Khurshid, S.J.; Iqbal, M.Z. Antibacterial activity of copper-amino acid complexes. J. Pak. Med. Assoc. 1990, 40, 221–222. [Google Scholar]
  6. Weder, J.E.; Hambley, T.W.; Kennedy, B.J.; Lay, P.A.; MacLachlan, D.; Bramley, R.; Delfs, C.D.; Murray, K.S.; Moubaraki, B.; Warwick, B.; et al. Anti-Inflammatory Dinuclear Copper(II) Complexes with Indomethacin. Synthesis, Magnetism and EPR Spectroscopy. Crystal Structure of the N,N-Dimethylformamide Adduct. Inorg. Chem. 1999, 38, 1736–1744. [Google Scholar] [CrossRef] [PubMed]
  7. Szymanski, P.; Fraczek, T.; Markowicz, M.; Mikiciuk-Olasik, E. Development of copper based drugs, radiopharmaceuticals and medical materials. Biometals 2012, 25, 1089–1112. [Google Scholar] [CrossRef] [PubMed] [Green Version]
  8. Gaal, A.; Orgovan, G.; Mihucz, V.G.; Pape, I.; Ingerle, D.; Streli, C.; Szoboszlai, N. Metal transport capabilities of anticancer copper chelators. J. Trace Elem. Med. Biol. 2018, 47, 79–88. [Google Scholar] [CrossRef]
  9. Volarevic, V.; Djokovic, B.; Jankovic, M.G.; Harrell, C.R.; Fellabaum, C.; Djonov, V.; Arsenijevic, N. Molecular mechanisms of cisplatin-induced nephrotoxicity: A balance on the knife edge between renoprotection and tumor toxicity. J. Biomed. Sci. 2019, 26, 25. [Google Scholar] [CrossRef] [Green Version]
  10. McWhinney, S.R.; Goldberg, R.M.; McLeod, H.L. Platinum neurotoxicity pharmacogenetics. Mol. Cancer Ther. 2009, 8, 10–16. [Google Scholar] [CrossRef] [Green Version]
  11. Wheate, N.J.; Walker, S.; Craig, G.E.; Oun, R. The status of platinum anticancer drugs in the clinic and in clinical trials. Dalton Trans. 2010, 39, 8113–8127. [Google Scholar] [CrossRef] [Green Version]
  12. Qin, Q.P.; Meng, T.; Tan, M.X.; Liu, Y.C.; Luo, X.J.; Zou, B.Q.; Liang, H. Synthesis, crystal structure and biological evaluation of a new dasatinib copper(II) complex as telomerase inhibitor. Eur. J. Med. Chem. 2018, 143, 1597–1603. [Google Scholar] [CrossRef]
  13. Molinaro, C.; Martoriati, A.; Pelinski, L.; Cailliau, K. Copper Complexes as Anticancer Agents Targeting Topoisomerases I and II. Cancers 2020, 12, 2863. [Google Scholar] [CrossRef]
  14. Fatfat, M.; Merhi, R.A.; Rahal, O.; Stoyanovsky, D.A.; Zaki, A.; Haidar, H.; Kagan, V.E.; Gali-Muhtasib, H.; Machaca, K. Copper chelation selectively kills colon cancer cells through redox cycling and generation of reactive oxygen species. BMC Cancer 2014, 14, 527. [Google Scholar] [CrossRef] [PubMed] [Green Version]
  15. Sangeetha, S.; Murali, M. Non-covalent DNA binding, protein interaction, DNA cleavage and cytotoxicity of [Cu(quamol)Cl].H(2)O. Int. J. Biol. Macromol. 2018, 107, 2501–2511. [Google Scholar] [CrossRef] [PubMed]
  16. Marzano, C.; Pellei, M.; Tisato, F.; Santini, C. Copper complexes as anticancer agents. Anticancer Agents Med. Chem. 2009, 9, 185–211. [Google Scholar] [CrossRef] [PubMed]
  17. Han, Y.; Shen, T.; Jiang, W.; Xia, Q.; Liu, C. DNA cleavage mediated by copper superoxide dismutase via two pathways. J. Inorg. Biochem. 2007, 101, 214–224. [Google Scholar] [CrossRef]
  18. Bruijnincx, P.C.; Sadler, P.J. New trends for metal complexes with anticancer activity. Curr. Opin. Chem. Biol. 2008, 12, 197–206. [Google Scholar] [CrossRef] [Green Version]
  19. Chavez-Gonzalez, A.; Centeno-Llanos, S.; Moreno-Lorenzana, D.; Sandoval-Esquivel, M.A.; Aviles-Vazquez, S.; Bravo-Gomez, M.E.; Ruiz-Azuara, L.; Ayala-Sanchez, M.; Torres-Martinez, H.; Mayani, H. Casiopeina III-Ea, a copper-containing small molecule, inhibits the in vitro growth of primitive hematopoietic cells from chronic myeloid leukemia. Leuk. Res. 2017, 52, 8–19. [Google Scholar] [CrossRef]
  20. Lucaciu, R.L.; Hangan, A.C.; Sevastre, B.; Oprean, L.S. Metallo-Drugs in Cancer Therapy: Past, Present and Future. Molecules 2022, 27, 6485. [Google Scholar] [CrossRef]
  21. Alemon-Medina, R.; Brena-Valle, M.; Munoz-Sanchez, J.L.; Gracia-Mora, M.I.; Ruiz-Azuara, L. Induction of oxidative damage by copper-based antineoplastic drugs (Casiopeinas). Cancer Chemother. Pharmacol. 2007, 60, 219–228. [Google Scholar] [CrossRef]
  22. Mavroidi, B.; Sagnou, M.; Stamatakis, K.; Paravatou-Petsotas, M.; Pelecanou, M.; Methenitis, C. Palladium(II) and platinum(II) complexes of derivatives of 2-(4′-aminophenyl)benzothiazole as potential anticancer agents. Inorg. Chim. Acta 2016, 444, 63–75. [Google Scholar] [CrossRef]
  23. Tzanopoulou, S.; Sagnou, M.; Paravatou-Petsotas, M.; Gourni, E.; Loudos, G.; Xanthopoulos, S.; Lafkas, D.; Kiaris, H.; Varvarigou, A.; Pirmettis, I.C.; et al. Evaluation of Re and (99m)Tc complexes of 2-(4′-aminophenyl)benzothiazole as potential breast cancer radiopharmaceuticals. J. Med. Chem. 2010, 53, 4633–4641. [Google Scholar] [CrossRef]
  24. Jakusch, T.; Hassoon, A.A.; Kiss, T. Characterization of copper(II) specific pyridine containing ligands: Potential metallophores for Alzheimer’s disease therapy. J. Inorg. Biochem. 2022, 228, 111692. [Google Scholar] [CrossRef]
  25. Halevas, E.; Pekou, A.; Papi, R.; Mavroidi, B.; Hatzidimitriou, A.G.; Zahariou, G.; Litsardakis, G.; Sagnou, M.; Pelecanou, M.; Pantazaki, A.A. Synthesis, physicochemical characterization and biological properties of two novel Cu(II) complexes based on natural products curcumin and quercetin. J. Inorg. Biochem. 2020, 208, 111083. [Google Scholar] [CrossRef]
  26. Halevas, E.; Mitrakas, A.; Mavroidi, B.; Athanasiou, D.; Gkika, P.; Antoniou, K.; Samaras, G.; Lialiaris, E.; Hatzidimitriou, A.; Pantazaki, A.; et al. Structurally characterized copper-chrysin complexes display genotoxic and cytotoxic activity in human cells. Inorg. Chim. Acta 2021, 515, 120062. [Google Scholar] [CrossRef]
  27. Stoll, S.; Schweiger, A. EasySpin, a comprehensive software package for spectral simulation and analysis in EPR. J. Magn. Reason. 2006, 178, 42–55. [Google Scholar] [CrossRef]
  28. Peisach, J.; Blumberg, W.E. Structural implications derived from the analysis of electron paramagnetic resonance spectra of natural and artificial copper proteins. Arch. Biochem. Biophys. 1974, 165, 691–708. [Google Scholar] [CrossRef] [PubMed]
  29. Reichmann, M.E.; Rice, S.A.; Thomas, C.A.; Doty, P. A Further Examination of the Molecular Weight and Size of Desoxypentose Nucleic Acid. J. Am. Chem. Soc. 1954, 76, 3047–3053. [Google Scholar] [CrossRef]
  30. Sunita, M.; Padmaja, M.; Anupama, B.; Kumari, C.G. Synthesis, characterization, DNA binding and cleavage studies of mixed-ligand Cu(II) complexes of 2,6-bis(benzimidazol-2-yl)pyridine. J. Fluoresc. 2012, 22, 1003–1012. [Google Scholar] [CrossRef]
  31. Joseph, J.; Janaki, G.B. Copper complexes bearing 2-aminobenzothiazole derivatives as potential antioxidant: Synthesis, characterization. J. Photochem. Photobiol. B 2016, 162, 86–92. [Google Scholar] [CrossRef]
  32. Joseph, J.; Boomadevi Janaki, G.; Nagashri, K.; Joseyphus, R.S. Antimicrobial, antioxidant and SOD activities of copper(II) complexes derived from 2-aminobenzothiazole derivatives. J. Coord. Chem. 2016, 70, 242–260. [Google Scholar] [CrossRef]
  33. Vamsikrishna, N.; Kumar, M.P.; Tejaswi, S.; Rambabu, A.; Shivaraj. DNA Binding, Cleavage and Antibacterial Activity of Mononuclear Cu(II), Ni(II) and Co(II) Complexes Derived from Novel Benzothiazole Schiff Bases. J. Fluoresc. 2016, 26, 1317–1329. [Google Scholar] [CrossRef]
  34. Mallam, A.L.; Sidote, D.J.; Lambowitz, A.M. Molecular insights into RNA and DNA helicase evolution from the determinants of specificity for a DEAD-box RNA helicase. eLife 2014, 3, e04630. [Google Scholar] [CrossRef] [PubMed]
  35. Kuwabara, M.; Yoon, C.; Goyne, T.; Thederahn, T.; Sigman, D.S. Nuclease activity of 1, 10-phenanthroline-copper ion: Reaction with CGCGAATTCGCG and its complexes with netropsin and EcoRI. Biochemistry 1986, 25, 7401–7408. [Google Scholar] [CrossRef] [PubMed]
  36. Pakravan, P.; Masoudian, S. Study on the Interaction between Isatin-beta-Thiosemicarbazone and Calf Thymus DNA by Spectroscopic Techniques. Iran. J. Pharm. Res. 2015, 14, 111–123. [Google Scholar]
  37. Loganathan, R.; Ramakrishnan, S.; Suresh, E.; Palaniandavar, M.; Riyasdeen, A.; Akbarsha, M.A. Mixed ligand mu-phenoxo-bridged dinuclear copper(II) complexes with diimine co-ligands: Efficient chemical nuclease and protease activities and cytotoxicity. Dalton Trans. 2014, 43, 6177–6194. [Google Scholar] [CrossRef] [PubMed]
  38. Li, G.Y.; Du, K.J.; Wang, J.Q.; Liang, J.W.; Kou, J.F.; Hou, X.J.; Ji, L.N.; Chao, H. Synthesis, crystal structure, DNA interaction and anticancer activity of tridentate copper(II) complexes. J. Inorg. Biochem. 2013, 119, 43–53. [Google Scholar] [CrossRef] [PubMed]
  39. Lyng, R.; Rodger, A.; Norden, B. The CD of ligand-DNA systems. 2. Poly(dA-dT) B-DNA. Biopolymers 1992, 32, 1201–1214. [Google Scholar] [CrossRef] [PubMed]
  40. Lyng, R.; Rodger, A.; Norden, B. The CD of ligand-DNA systems. I. Poly(dG-dC) B-DNA. Biopolymers 1991, 31, 1709–1720. [Google Scholar] [CrossRef] [PubMed]
  41. LePecq, J.B.; Paoletti, C. A fluorescent complex between ethidium bromide and nucleic acids. Physical-chemical characterization. J. Mol. Biol. 1967, 27, 87–106. [Google Scholar] [CrossRef]
  42. Gaugain, B.; Barbet, J.; Capelle, N.; Roques, B.P.; Le Pecq, J.B. DNA Bifunctional intercalators. 2. Fluorescence properties and DNA binding interaction of an ethidium homodimer and an acridine ethidium heterodimer. Biochemistry 1978, 17, 5078–5088. [Google Scholar] [CrossRef]
  43. Banerjee, A.; Singh, J.; Dasgupta, D. Fluorescence spectroscopic and calorimetry based approaches to characterize the mode of interaction of small molecules with DNA. J. Fluoresc. 2013, 23, 745–752. [Google Scholar] [CrossRef]
  44. Mergny, J.L.; Lacroix, L. Analysis of thermal melting curves. Oligonucleotides 2003, 13, 515–537. [Google Scholar] [CrossRef]
  45. Matiadis, D.; Mavroidi, B.; Panagiotopoulou, A.; Methenitis, C.; Pelecanou, M.; Sagnou, M. (E)-1-(4-Ethoxycarbonylphenyl)-5-(3,4-dimethoxyphenyl)-3-(3,4-dimethoxystyryl)-2-pyrazoline: Synthesis, Characterization, DNA-Interaction and Evaluation of Activity Against Drug-Resistant Cell Lines. Molbank 2020, 2020, M1114. [Google Scholar] [CrossRef] [Green Version]
  46. Bravo-Anaya, L.M.; Rinaudo, M.; Martinez, F.A.S. Conformation and Rheological Properties of Calf-Thymus DNA in Solution. Polymers 2016, 8, 51. [Google Scholar] [CrossRef] [Green Version]
  47. Saraswathi, S.K.; Karunakaran, V.; Maiti, K.K.; Joseph, J. DNA Condensation Triggered by the Synergistic Self-Assembly of Tetraphenylethylene-Viologen Aggregates and CT-DNA. Front. Chem. 2021, 9, 716771. [Google Scholar] [CrossRef]
  48. Shokohi-Pour, Z.; Chiniforoshan, H.; Momtazi-Borojeni, A.A.; Notash, B. A novel Schiff base derived from the gabapentin drug and copper (II) complex: Synthesis, characterization, interaction with DNA/protein and cytotoxic activity. J. Photochem. Photobiol. B 2016, 162, 34–44. [Google Scholar] [CrossRef] [Green Version]
  49. Fox, K.R. Evaluation of Drug–Nucleic Acid Interactions by Thermal Melting Curves. In Drug-DNA Interaction Protocols; Humana Press: Totowa, NJ, USA, 1997; Volume 90. [Google Scholar]
  50. He, J.; Hu, P.; Wang, Y.J.; Tong, M.L.; Sun, H.; Mao, Z.W.; Ji, L.N. Double-strand DNA cleavage by copper complexes of 2,2′-dipyridyl with guanidinium/ammonium pendants. Dalton Trans. 2008, 24, 3207–3214. [Google Scholar] [CrossRef] [PubMed]
  51. Gomez-Machuca, H.; Quiroga-Campano, C.; Zapata-Torres, G.; Jullian, C. Influence of DMbetaCD on the Interaction of Copper(II) Complex of 6-Hydroxychromone-3-carbaldehyde-3-hydroxybenzoylhydrazine with ctDNA. ACS Omega 2020, 5, 6928–6936. [Google Scholar] [CrossRef] [Green Version]
  52. Lerman, L.S. Structural considerations in the interaction of DNA and acridines. J. Mol. Biol. 1961, 3, 18–30. [Google Scholar] [CrossRef] [PubMed]
  53. Liu, G.D.; Liao, J.P.; Huang, S.S.; Shen, G.L.; Yu, R.Q. Fluorescence spectral study of interaction of water-soluble metal complexes of Schiff-base and DNA. Anal. Sci. 2001, 17, 1031–1036. [Google Scholar] [CrossRef] [Green Version]
  54. Goodwin, K.D.; Lewis, M.A.; Long, E.C.; Georgiadis, M.M. Crystal structure of DNA-bound Co(III) bleomycin B2: Insights on intercalation and minor groove binding. Proc. Natl. Acad. Sci. USA 2008, 105, 5052–5056. [Google Scholar] [CrossRef] [Green Version]
  55. Chen, Z.; Wu, Y.; Zhang, Q.; Zhang, Y. Biological properties of a benzothiazole-based mononuclear platinum(II) complex as a potential anticancer agent. J. Coord. Chem. 2020, 73, 1817–1832. [Google Scholar] [CrossRef]
  56. Racané, L.; Stojković, R.; Tralić-Kulenović, V.; Cerić, H.; Đaković, M.; Ester, K.; Mišir Krpan, A.; Radić Stojković, M. Interactions with polynucleotides and antitumor activity of amidino and imidazolinyl substituted 2-phenylbenzothiazole mesylates. Eur J. Med. Chem. 2014, 30, 4935. [Google Scholar] [CrossRef]
  57. Bradshaw, T.D.; Wrigley, S.; Shi, D.F.; Schultz, R.J.; Paull, K.D.; Stevens, M.F. 2-(4-Aminophenyl)benzothiazoles: Novel agents with selective profiles of in vitro anti-tumour activity. Br. J. Cancer 1998, 77, 745–752. [Google Scholar] [CrossRef] [PubMed]
  58. Bradshaw, T.D.; Stevens, M.F.; Westwell, A.D. The discovery of the potent and selective antitumour agent 2-(4-amino-3-methylphenyl)benzothiazole (DF 203) and related compounds. Curr. Med. Chem. 2001, 8, 203–210. [Google Scholar] [CrossRef] [PubMed]
  59. Shi, Y.; Cai, M.; Zhou, L.; Wang, H. The structure and function of cell membranes studied by atomic force microscopy. Semin. Cell Dev. Biol. 2018, 73, 31–44. [Google Scholar] [CrossRef] [PubMed]
  60. Kwon, J.H.; Park, H.J.; Chitrapriya, N.; Cho, T.S.; Kim, S.; Kim, J.; Hwang, I.H.; Kim, C.; Kim, S.K. DNA cleavage induced by [Cu(L)x(NO3)2] (L = 2,2′-dipyridylamine, 2,2′-bipyridine, dipicolylamine, x = 1 or 2): Effect of the ligand structure. J. Inorg. Biochem. 2014, 131, 79–86. [Google Scholar] [CrossRef] [PubMed]
  61. Romo, A.I.B.; Carepo, M.P.; Levin, P.; Nascimento, O.R.; Diaz, D.E.; Rodriguez-Lopez, J.; Leon, I.E.; Bezerra, L.F.; Lemus, L.; Diogenes, I.C.N. Synergy of DNA intercalation and catalytic activity of a copper complex towards improved polymerase inhibition and cancer cell cytotoxicity. Dalton Trans. 2021, 50, 11931–11940. [Google Scholar] [CrossRef]
  62. Husain, N.; Mahmood, R. Copper(II) generates ROS and RNS, impairs antioxidant system and damages membrane and DNA in human blood cells. Environ. Sci. Pollut. Res. Int. 2019, 26, 20654–20668. [Google Scholar] [CrossRef] [PubMed]
  63. Hricovini, M.; Mazur, M.; Sirbu, A.; Palamarciuc, O.; Arion, V.B.; Brezova, V. Copper(II) Thiosemicarbazone Complexes and Their Proligands upon UVA Irradiation: An EPR and Spectrophotometric Steady-State Study. Molecules 2018, 23, 721. [Google Scholar] [CrossRef] [PubMed] [Green Version]
  64. Bolos, C.A.; Papazisis, K.T.; Kortsaris, A.H.; Voyatzi, S.; Zambouli, D.; Kyriakidis, D.A. Antiproliferative activity of mixed-ligand dien-Cu(II) complexes with thiazole, thiazoline and imidazole derivatives. J. Inorg. Biochem. 2002, 88, 25–36. [Google Scholar] [CrossRef]
  65. Leon, I.E.; Cadavid-Vargas, J.F.; Tiscornia, I.; Porro, V.; Castelli, S.; Katkar, P.; Desideri, A.; Bollati-Fogolin, M.; Etcheverry, S.B. Oxidovanadium(IV) complexes with chrysin and silibinin: Anticancer activity and mechanisms of action in a human colon adenocarcinoma model. J. Biol. Inorg. Chem. 2015, 20, 1175–1191. [Google Scholar] [CrossRef] [PubMed]
  66. Molinaro, C.; Wambang, N.; Bousquet, T.; Vercoutter-Edouart, A.S.; Pelinski, L.; Cailliau, K.; Martoriati, A. A Novel Copper(II) Indenoisoquinoline Complex Inhibits Topoisomerase I, Induces G2 Phase Arrest, and Autophagy in Three Adenocarcinomas. Front. Oncol. 2022, 12, 837373. [Google Scholar] [CrossRef]
  67. Bruker Analytical X-ray Systems. Apex2, User Manual, M86-E01078, 2nd ed.; Bruker Analytical X-ray Systems: Madison, WI, USA, 2006. [Google Scholar]
  68. Sheldrick, G.M. Siemens Industrial Automation. SADABS: Area-Detector Absorption Correction; Bruker AXS Inc.: Madison, WI, USA, 1996. [Google Scholar]
  69. Betteridge, P.W.C.; Carruthers, J.R.; Cooper, R.I.; Prout, K.; Watkin, D.J. Software for guided crystal structure analysis. J. Appl. Cryst. 2003, 36, 1487. [Google Scholar] [CrossRef]
  70. Palatinus, L.C.; Chapuis, G. SUPERFLIP—A Computer Program for the Solution of Crystal Structures by Charge Flipping in Arbitrary Dimensions. J. Appl. Crystallogr. 2007, 40, 786–790. [Google Scholar] [CrossRef] [Green Version]
  71. Watkin, D.J.; Prout, C.K.; Pearce, L.J. CAMERON; Chemical Crystallography Laboratory: Oxford, UK, 1996. [Google Scholar]
  72. McGhee, J.D.; von Hippel, P.H. Theoretical aspects of DNA-protein interactions: Co-operative and non-co-operative binding of large ligands to a one-dimensional homogeneous lattice. J. Mol. Biol. 1974, 86, 469–489. [Google Scholar] [CrossRef]
  73. Zeng, Z.F.; Huang, Q.P.; Cai, J.H.; Zheng, G.J.; Huang, Q.C.; Liu, Z.L.; Chen, Z.L.; Wei, Y.H. Synthesis, Characterization, DNA/HSA Interactions, and Anticancer Activity of Two Novel Copper(II) Complexes with 4-Chloro-3-Nitrobenzoic Acid Ligand. Molecules 2021, 26, 4028. [Google Scholar] [CrossRef] [PubMed]
  74. Devi, C.S.; Thulasiram, B.; Satyanarayana, S.; Nagababu, P. Analytical Techniques Used to Detect DNA Binding Modes of Ruthenium(II) Complexes with Extended Phenanthroline Ring. J. Fluoresc. 2017, 27, 2119–2130. [Google Scholar] [CrossRef] [PubMed]
  75. Mavroidi, B.; Kaminari, A.; Makrypidi, K.; Shegani, A.; Bouziotis, P.; Pirmettis, I.; Papadopoulos, M.; Sagnou, M.; Pelecanou, M. Biological evaluation of complexes of cyclopentadienyl M(CO)(3)(+) (M = Re, (99m)Tc) with high blood-brain barrier penetration potential as brain cancer agents. Investig. New Drugs 2022, 40, 497–505. [Google Scholar] [CrossRef]
  76. Halevas, E.; Mavroidi, B.; Antonoglou, O.; Hatzidimitriou, A.; Sagnou, M.; Pantazaki, A.A.; Litsardakis, G.; Pelecanou, M. Structurally characterized gallium-chrysin complexes with anticancer potential. Dalton Trans. 2020, 49, 2734–2746. [Google Scholar] [CrossRef] [PubMed]
Figure 1. The structures of the 2-(4-aminophenyl)benzothiazole-bearing ligand (L1) of this work and its corresponding Cu(II) complex (Cu-1).
Inorganics 11 00132 g001
Figure 2. (a) The molecular structure of complex Cu-1 indicating the polymeric chain formation. Counterions and aromatic hydrogen atoms have been omitted for clarity. Thermal ellipsoids were drawn with 40% probability; (b) hydrogen-bonding interactions (in blue dotted lines) in complex Cu-1.
Inorganics 11 00132 g002
Figure 3. X-band EPR spectrum of complex Cu-1 in frozen DMSO solution (T = 120 K). Black line: experimental; red line: simulation. Experimental conditions: mw frequency, 9.612 GHz; mw power incident to the cavity, 200 µW; modulation frequency, 100 kHz; modulation amplitude, 0.13 mT.
Inorganics 11 00132 g003
Figure 4. Absorption spectra of Cu-1 (a) and L1 (b) (10−5 M) in the absence and presence of increasing amounts of DNA (0–10−4) M. Indicative ratios R = [DNA]/[compound] are shown: R = 0 (black line), R = 0.01 (red line), R = 0.5 (blue line), R = 2 (green line), R = 10 (orange line). Inset: Plots of [DNA]/(εa − εf) × 108 vs. [DNA] × 105.
Inorganics 11 00132 g004
Figure 5. Circular dichroism spectra of DNA (5 × 10⁻⁵ M) with increasing amounts of Cu-1 (a) and L1 (b) (0–2.5 × 10⁻⁵ M). Indicative ratios R = [compound]/[DNA] are shown: R = 0 (black line), R = 0.05 (green line), R = 0.2 (blue line), R = 0.5 (magenta line).
Inorganics 11 00132 g005
Figure 6. Fluorescence titration spectra of EtBr–CT-DNA complex with (a) complex Cu-1 and (b) ligand L1; [DNA] = 2.50 × 10⁻⁵ M, [EtBr] = 6.25 × 10⁻⁶ M. Arrow shows change in intensity with increasing concentration of compounds (0.00–2.20 × 10⁻⁵ M). Inset: Plot of F0/F vs. [compound] × 10−6 M.
Inorganics 11 00132 g006
Figure 7. Thermal denaturation data of CT-DNA (5 × 10⁻⁵ M) upon addition of Cu-1 (blue line) and L1 (red line) (0–2.5 × 10⁻⁵ M) with ratios R = [compound]/[DNA] ranging from 0 to 0.5.
Inorganics 11 00132 g007
Figure 8. Effects of increasing amounts on the relative viscosity of CT-DNA (5 × 10⁻⁵ M) upon addition of Cu-1 (blue line) and L1 (red line) (0–2.5 × 10⁻⁵ M) with ratios R = [compound]/[DNA] ranging from 0 to 0.5.
Inorganics 11 00132 g008
Figure 9. Consecutive (along the z axis) confocal microscopy images of MCF-7 cells after 24 h incubation with (a) Cu-1 and (b) L1 at a concentration of 5 μM using DAPI filter. The bar corresponds to 20 μm.
Inorganics 11 00132 g009
Figure 10. DCF fluorescence intensity of cells after treatment with Cu-1, the corresponding L1 and Cu(NO3)2·3H2O as a measure of the reactive oxygen species produced. Values represent the mean ± SD of three independent experiments and the significance level was set as ** p < 0.01 and *** p < 0.001 compared to control (untreated cells).
Inorganics 11 00132 g010
Figure 11. Quantification histograms representing the populations of living, early/late apoptotic and necrotic MCF-7 cells after treatment with Cu-1 and the ligand L1. Values represent the mean ± standard deviation (SD) of cell population obtained in two independent experiments.
Inorganics 11 00132 g011
Table 1. Summary of crystal, intensity collection and refinement data for [Cu(C21H18N4OS)(C3H4N2)(NO3)]n · n(NO3) (Cu-1).
Crystal Data
Chemical formula sum(C24H22CuN8O7S)n
Chemical formula moiety(C24H22CuN7O4S)n · n(NO3)
Mrn (630.10)
Crystal system
Space group
Monoclinic
P21/n
Temperature (K)295
a (Å)
b (Å)
c (Å)
6.831 (5)
27.223 (14)
14.531 (9)
β (°)102.309 (15)
V3)2640 (3)
Z4
Radiation typeMo Kα
µ (mm−1)0.97
Crystal size (mm)0.11 × 0.09 × 0.06
Data collection
DiffractometerBruker Kappa Apex2
Absorption correctionNumerical
Tmin, Tmax0.92, 0.94
No. of reflections
measured
independent
observed [I > 2.0σ(I)]
23,579
5055
4225
Rint0.018
(sin θ/λ)max−1)0.619
Refinement
R[F2 > 2σ(F2)]
wR(F2)
S
0.040
0.057
1.00
No. of reflections4225
No. of parameters370
H-atom treatmentH-atom parameters constrained
Δρmax, Δρmin (e Å−3)0.33–0.34
Table 2. Bond lengths [Å] and angles [deg] for [Cu(C21H18N4OS)(C3H4N2)(NO3)]n · n(NO3) (Cu-1).
Bond Lengths (Å)
Cu1—O3 i2.311 (2)
Cu1—O12.0421 (18)
Cu1—O22.494 (2)
Cu1—N12.021 (2)
Cu1—N21.966 (2)
Cu1—N52.009 (2)
Angles (°)
O3 i—Cu1—O193.32 (8)
O3 i—Cu1—O2168.08 (6)
O1—Cu1—O277.26 (8)
O3 i—Cu1—N1103.05 (8)
O1—Cu1—N1160.14 (8)
O2—Cu1—N187.70 (8)
O3 i—Cu1—N293.53 (9)
O1—Cu1—N284.22 (9)
O2—Cu1—N292.77 (9)
N1—Cu1—N283.62 (9)
O3 i—Cu1—N584.75 (9)
O1—Cu1—N592.37 (8)
O2—Cu1—N588.32 (9)
N1—Cu1—N5100.17 (9)
N2—Cu1—N5176.10 (8)
Cu1—O2—N7159.60 (17)
Cu1 ii—O3—N7129.17 (16)
i Symmetry codes: x + 1, y, z; ii Symmetry codes: x−1, y, z.
Table 3. Cytotoxicity of complex Cu-1, L1, Cu(NO3)2·3H2O and cisplatin against a panel of cancer cell lines and one healthy cell line after 72 h treatment *.
IC50 (μΜ)
MCF-7MDA-MB-231U-87 MGPC-3A-549DSF
Cu-12.2 ± 0.18.9 ± 1.525.2 ± 2.935.1 ± 2.439.7 ± 3.7132.2 ± 6.7
L1331.6 ± 5.9398.2 ± 6.8354.7 ± 7.9405.2 ± 7.1428.9 ± 8.8736.2 ± 6.8
Cu(NO3)2·3H2O228.8 ± 6.1292.1 ± 7.8301.5 ± 8.1299.8 ± 4.2325.1 ± 4.9367.7 ± 9.8
cisplatin7.0 ± 0.210.8 ± 0.95.6 ± 0.915.2 ± 2.18.9 ± 1.758.8 ± 7.9
* Values represent the mean ± SD of IC50 values (μM) obtained in at least three independent experiments.
Table 4. Cell cycle phase distribution after exposure of MCF-7 for 72 h with Cu-1 and L1 (%) *.
G0/G1SG2/M
Cu-158.64 ± 3.016.52 ± 0.3440.78 ± 1.01
L158.73 ± 3.2916.91 ± 2.6825.71 ± 1.09
control59.71 ± 3.2316.24 ± 2.4524.08 ± 3.51
* Values represent the mean ± SD of two independent experiments.
Disclaimer/Publisher’s Note: The statements, opinions and data contained in all publications are solely those of the individual author(s) and contributor(s) and not of MDPI and/or the editor(s). MDPI and/or the editor(s) disclaim responsibility for any injury to people or property resulting from any ideas, methods, instructions or products referred to in the content.

