
Exploring the Emergent Redox Chemistry of Pd(II) Nodes with Pendant Ferrocenes: From Precursors, through Building Blocks, to Self-Assemblies
 , , , and
Abstract
:
1. Introduction
2. Results and Discussion
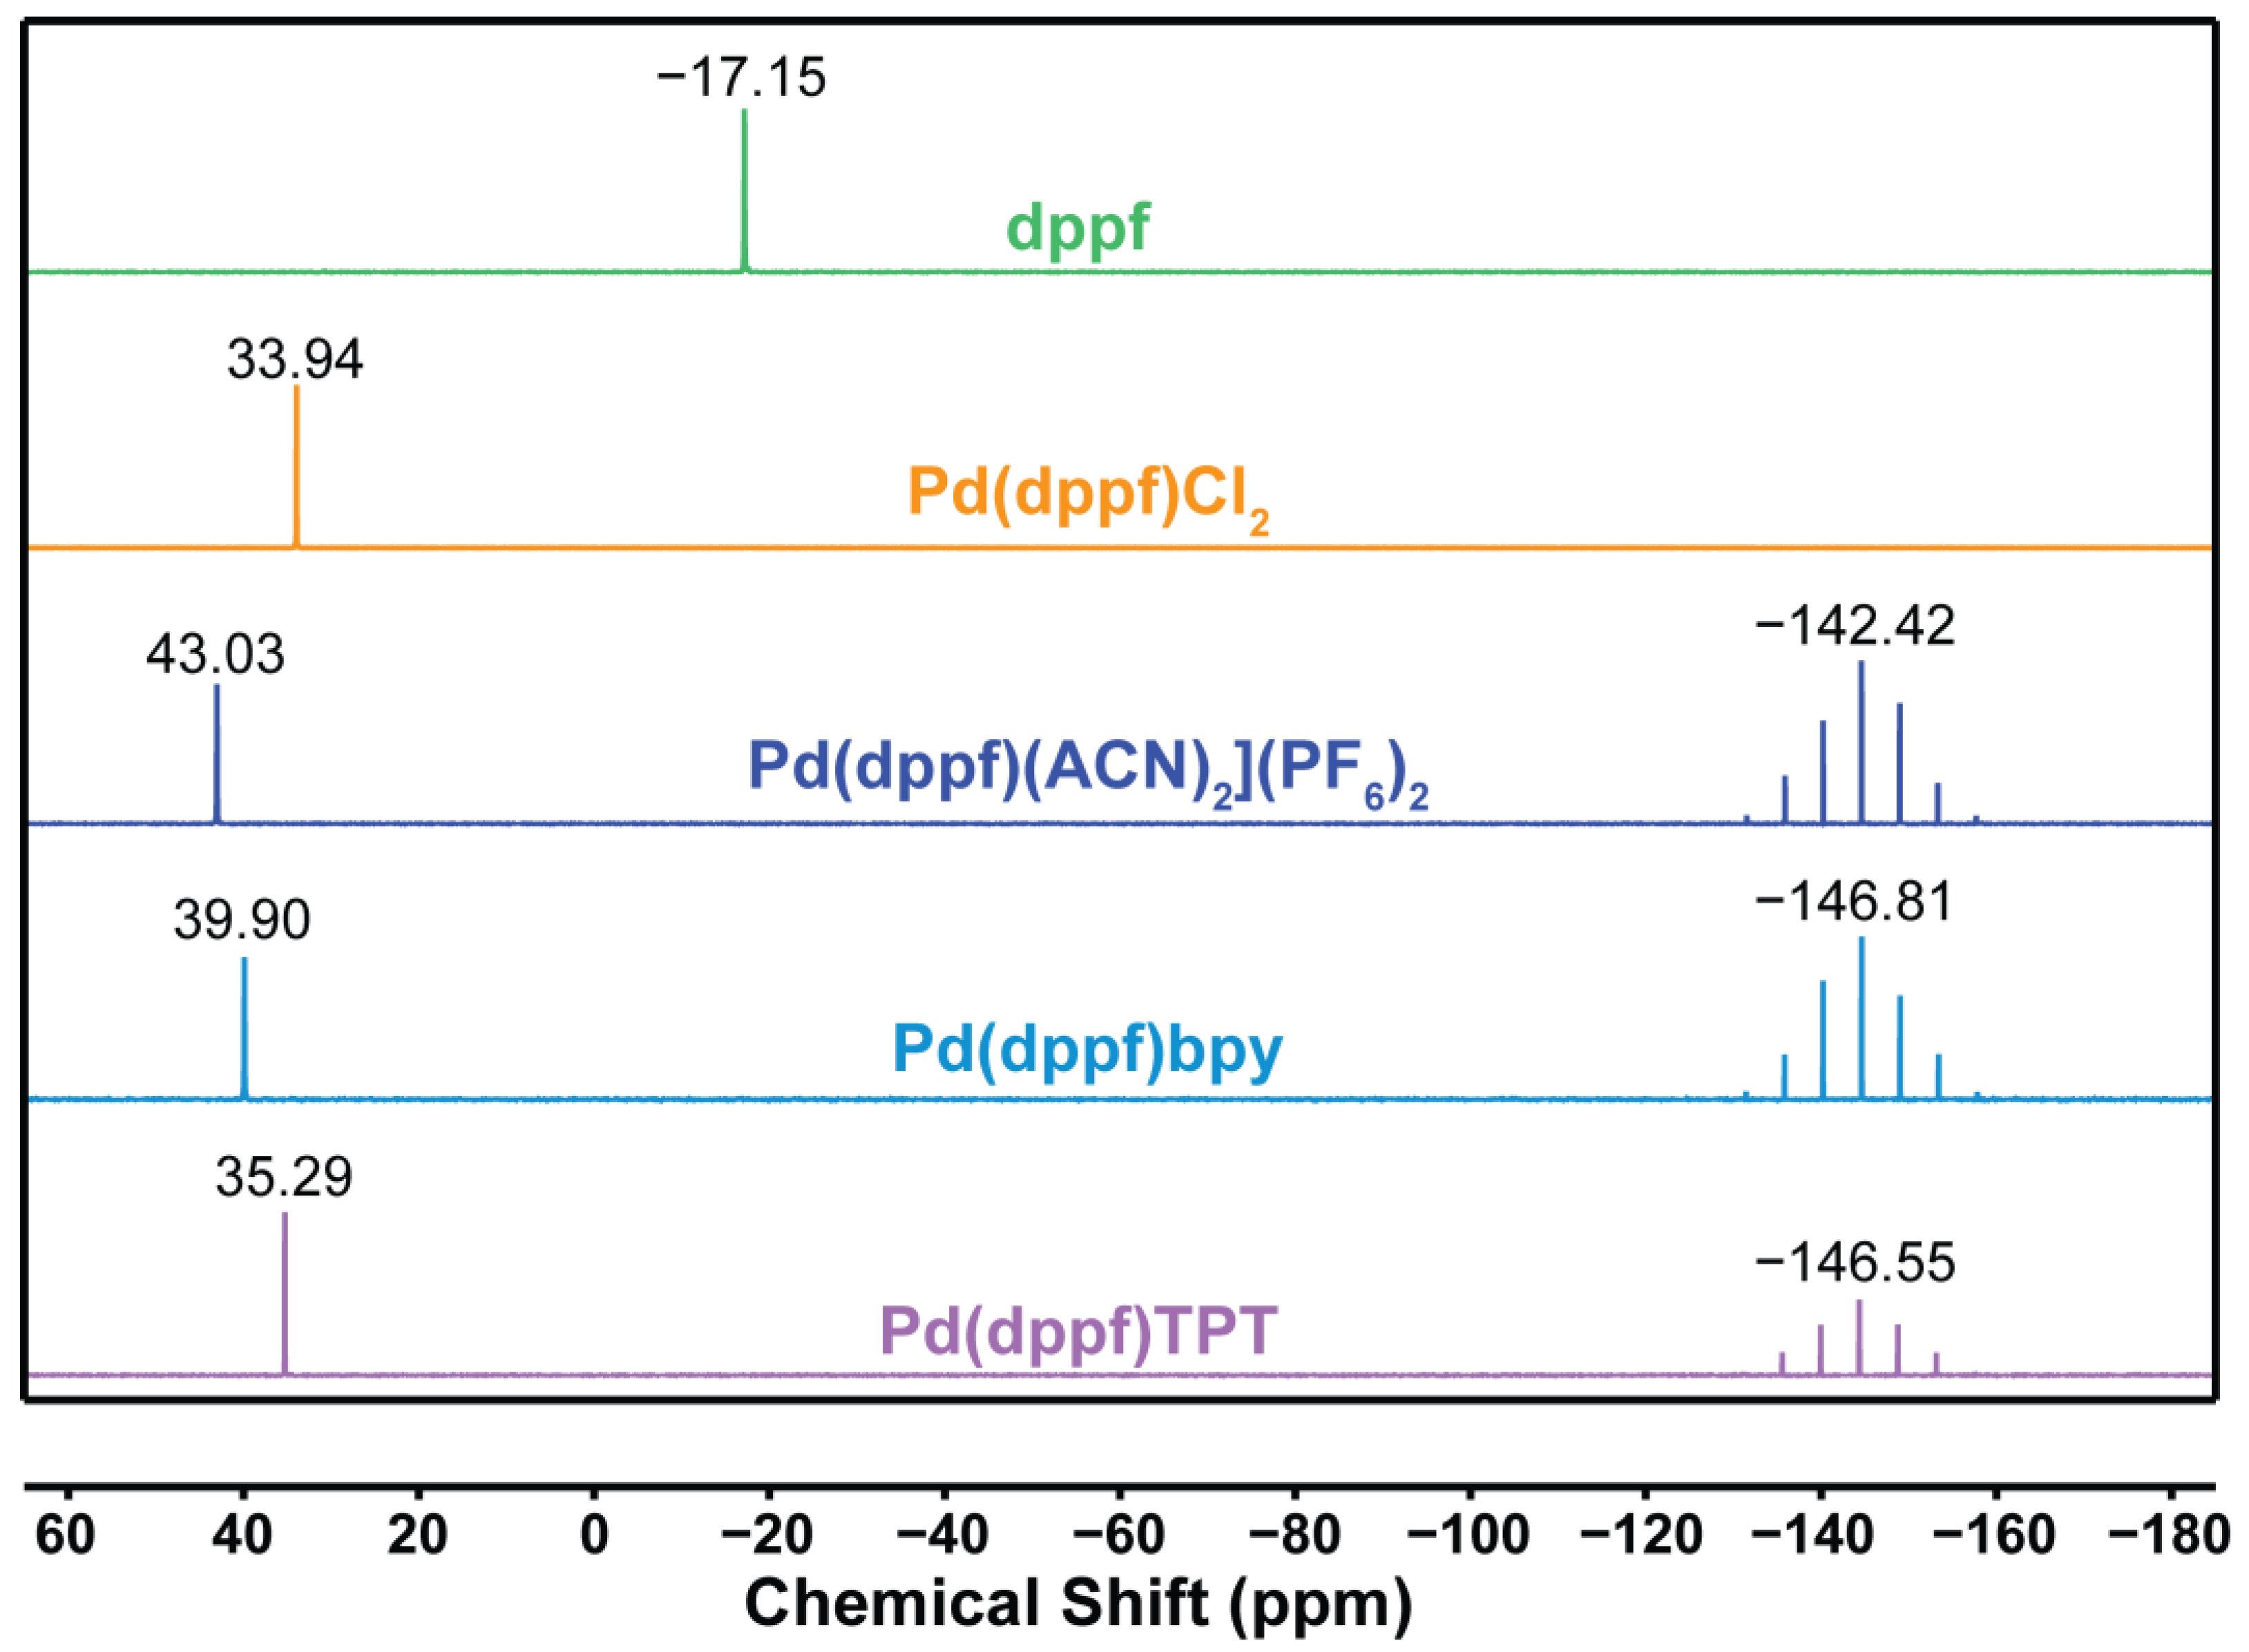
2.1. Synthesis and Spectroscopic Characterization
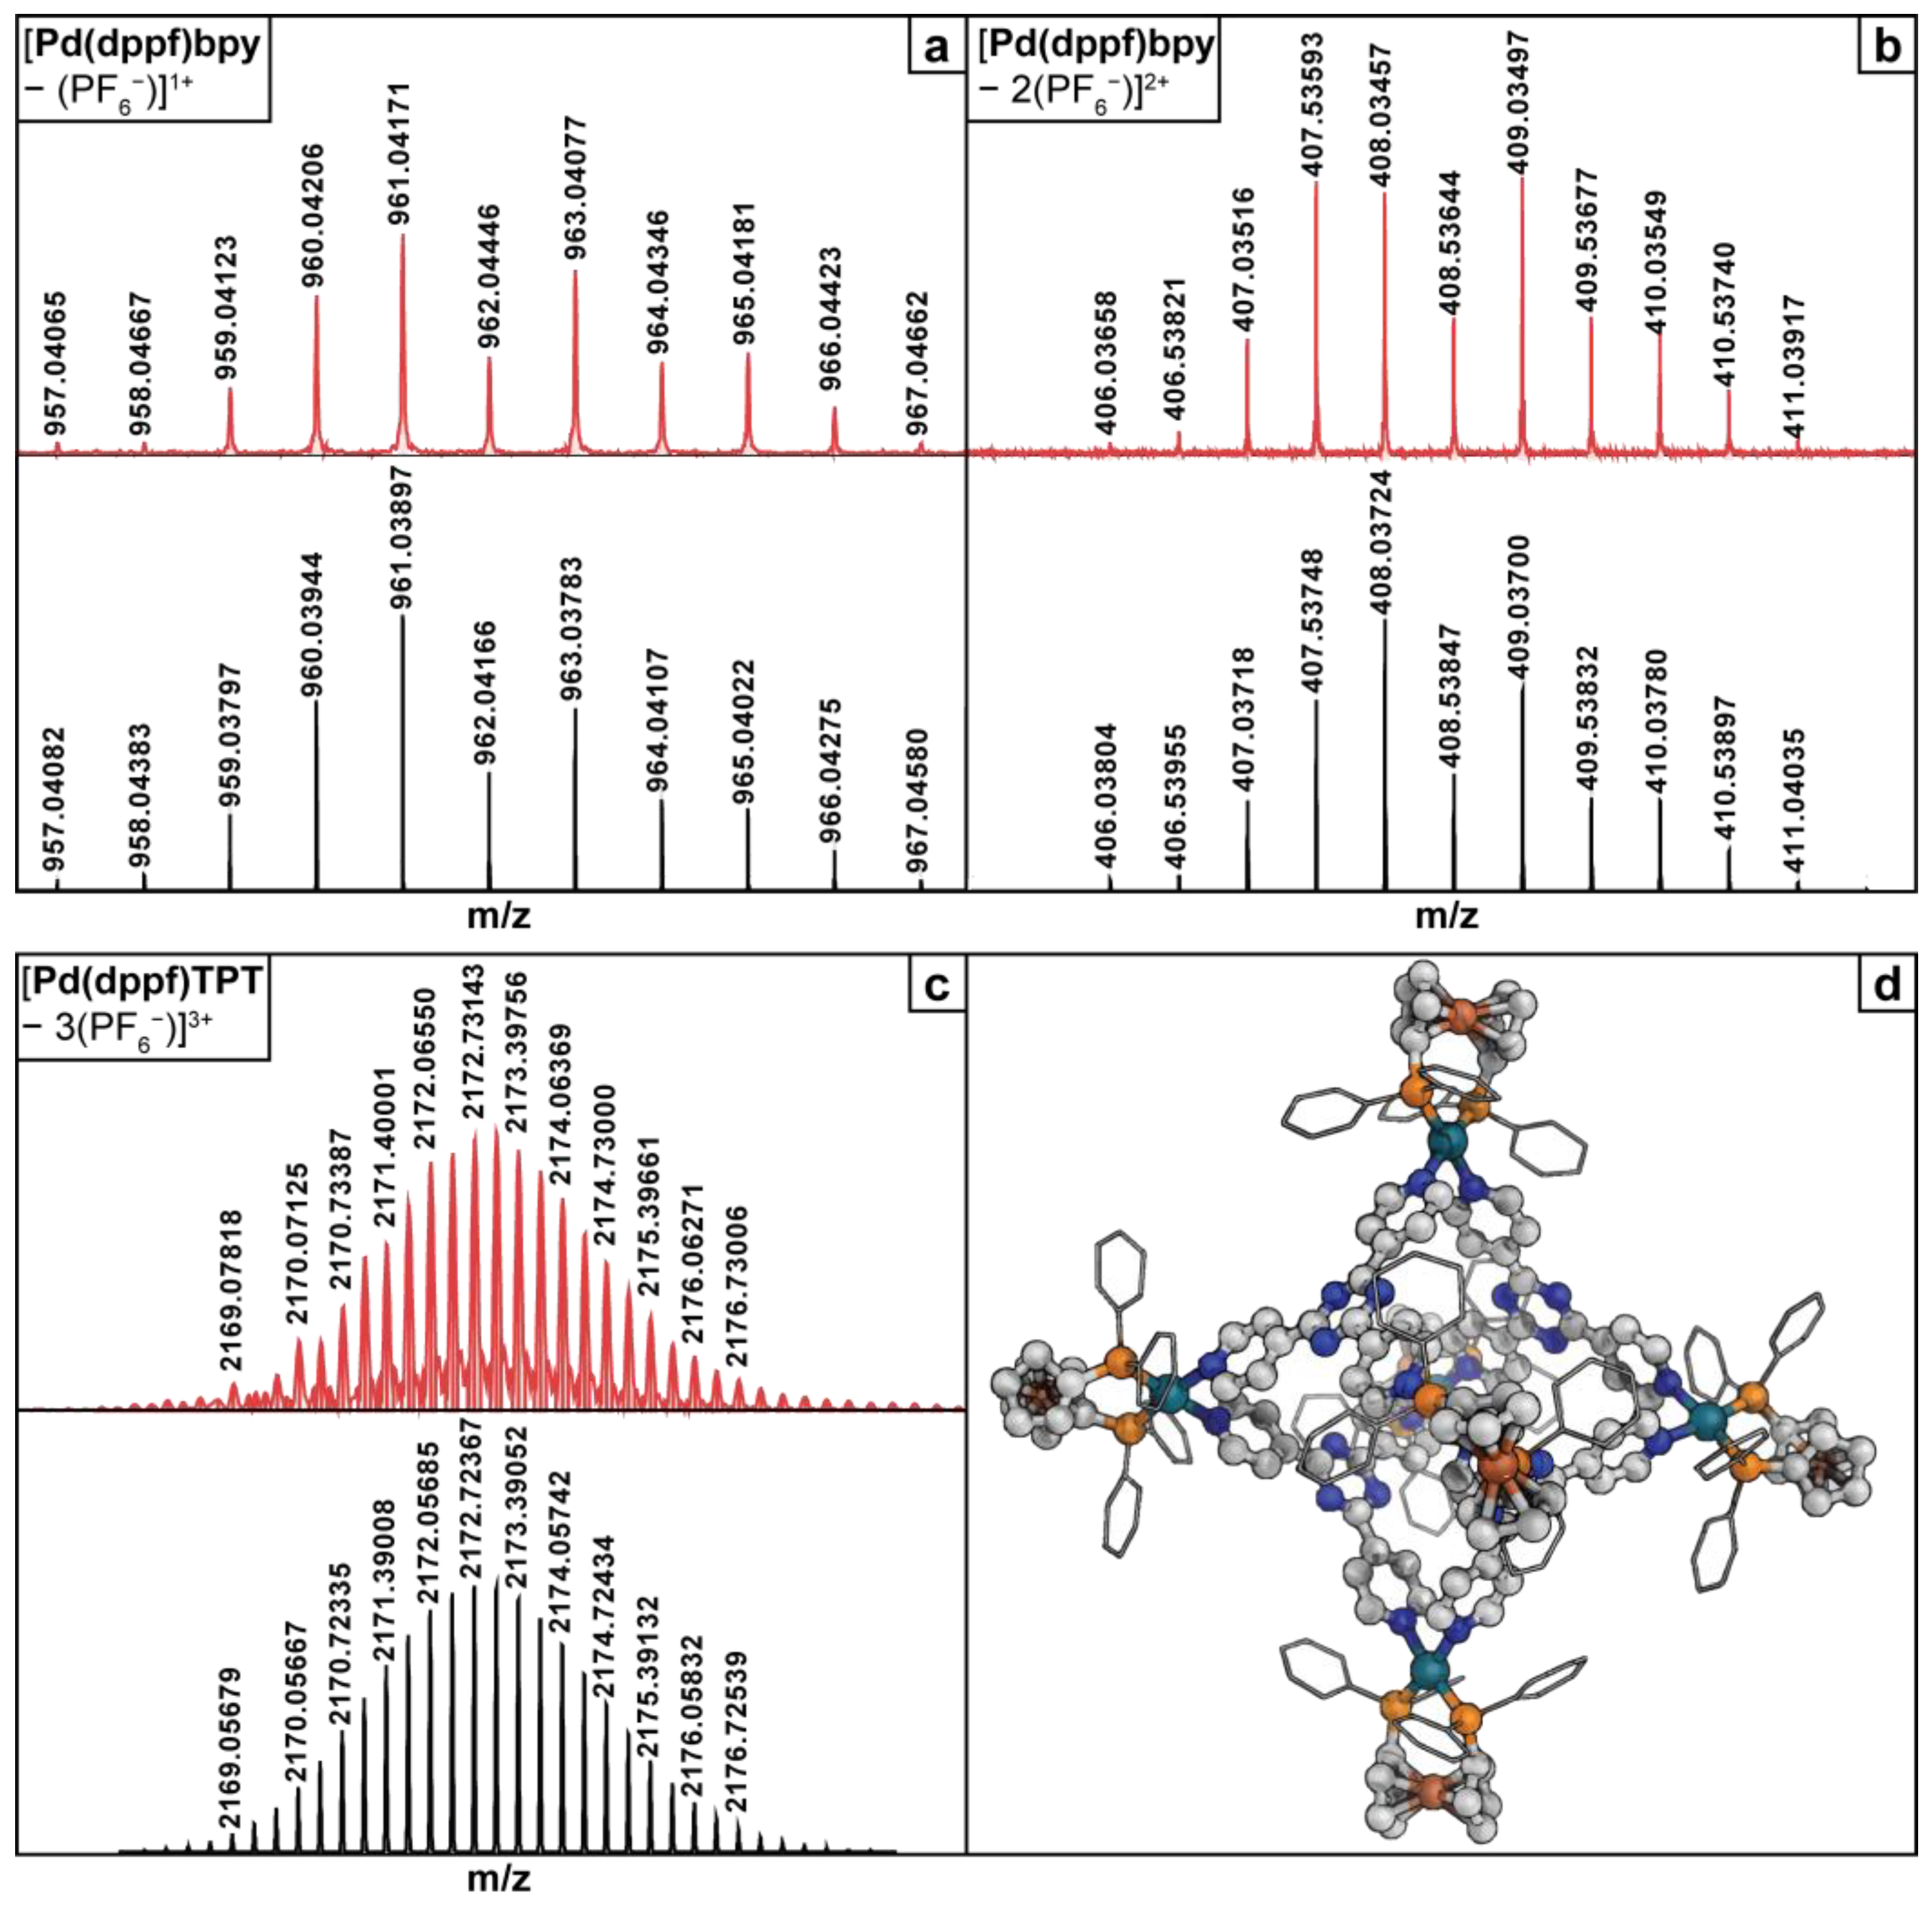
2.2. FT-ICR MS
2.3. X-ray Crystal Structure
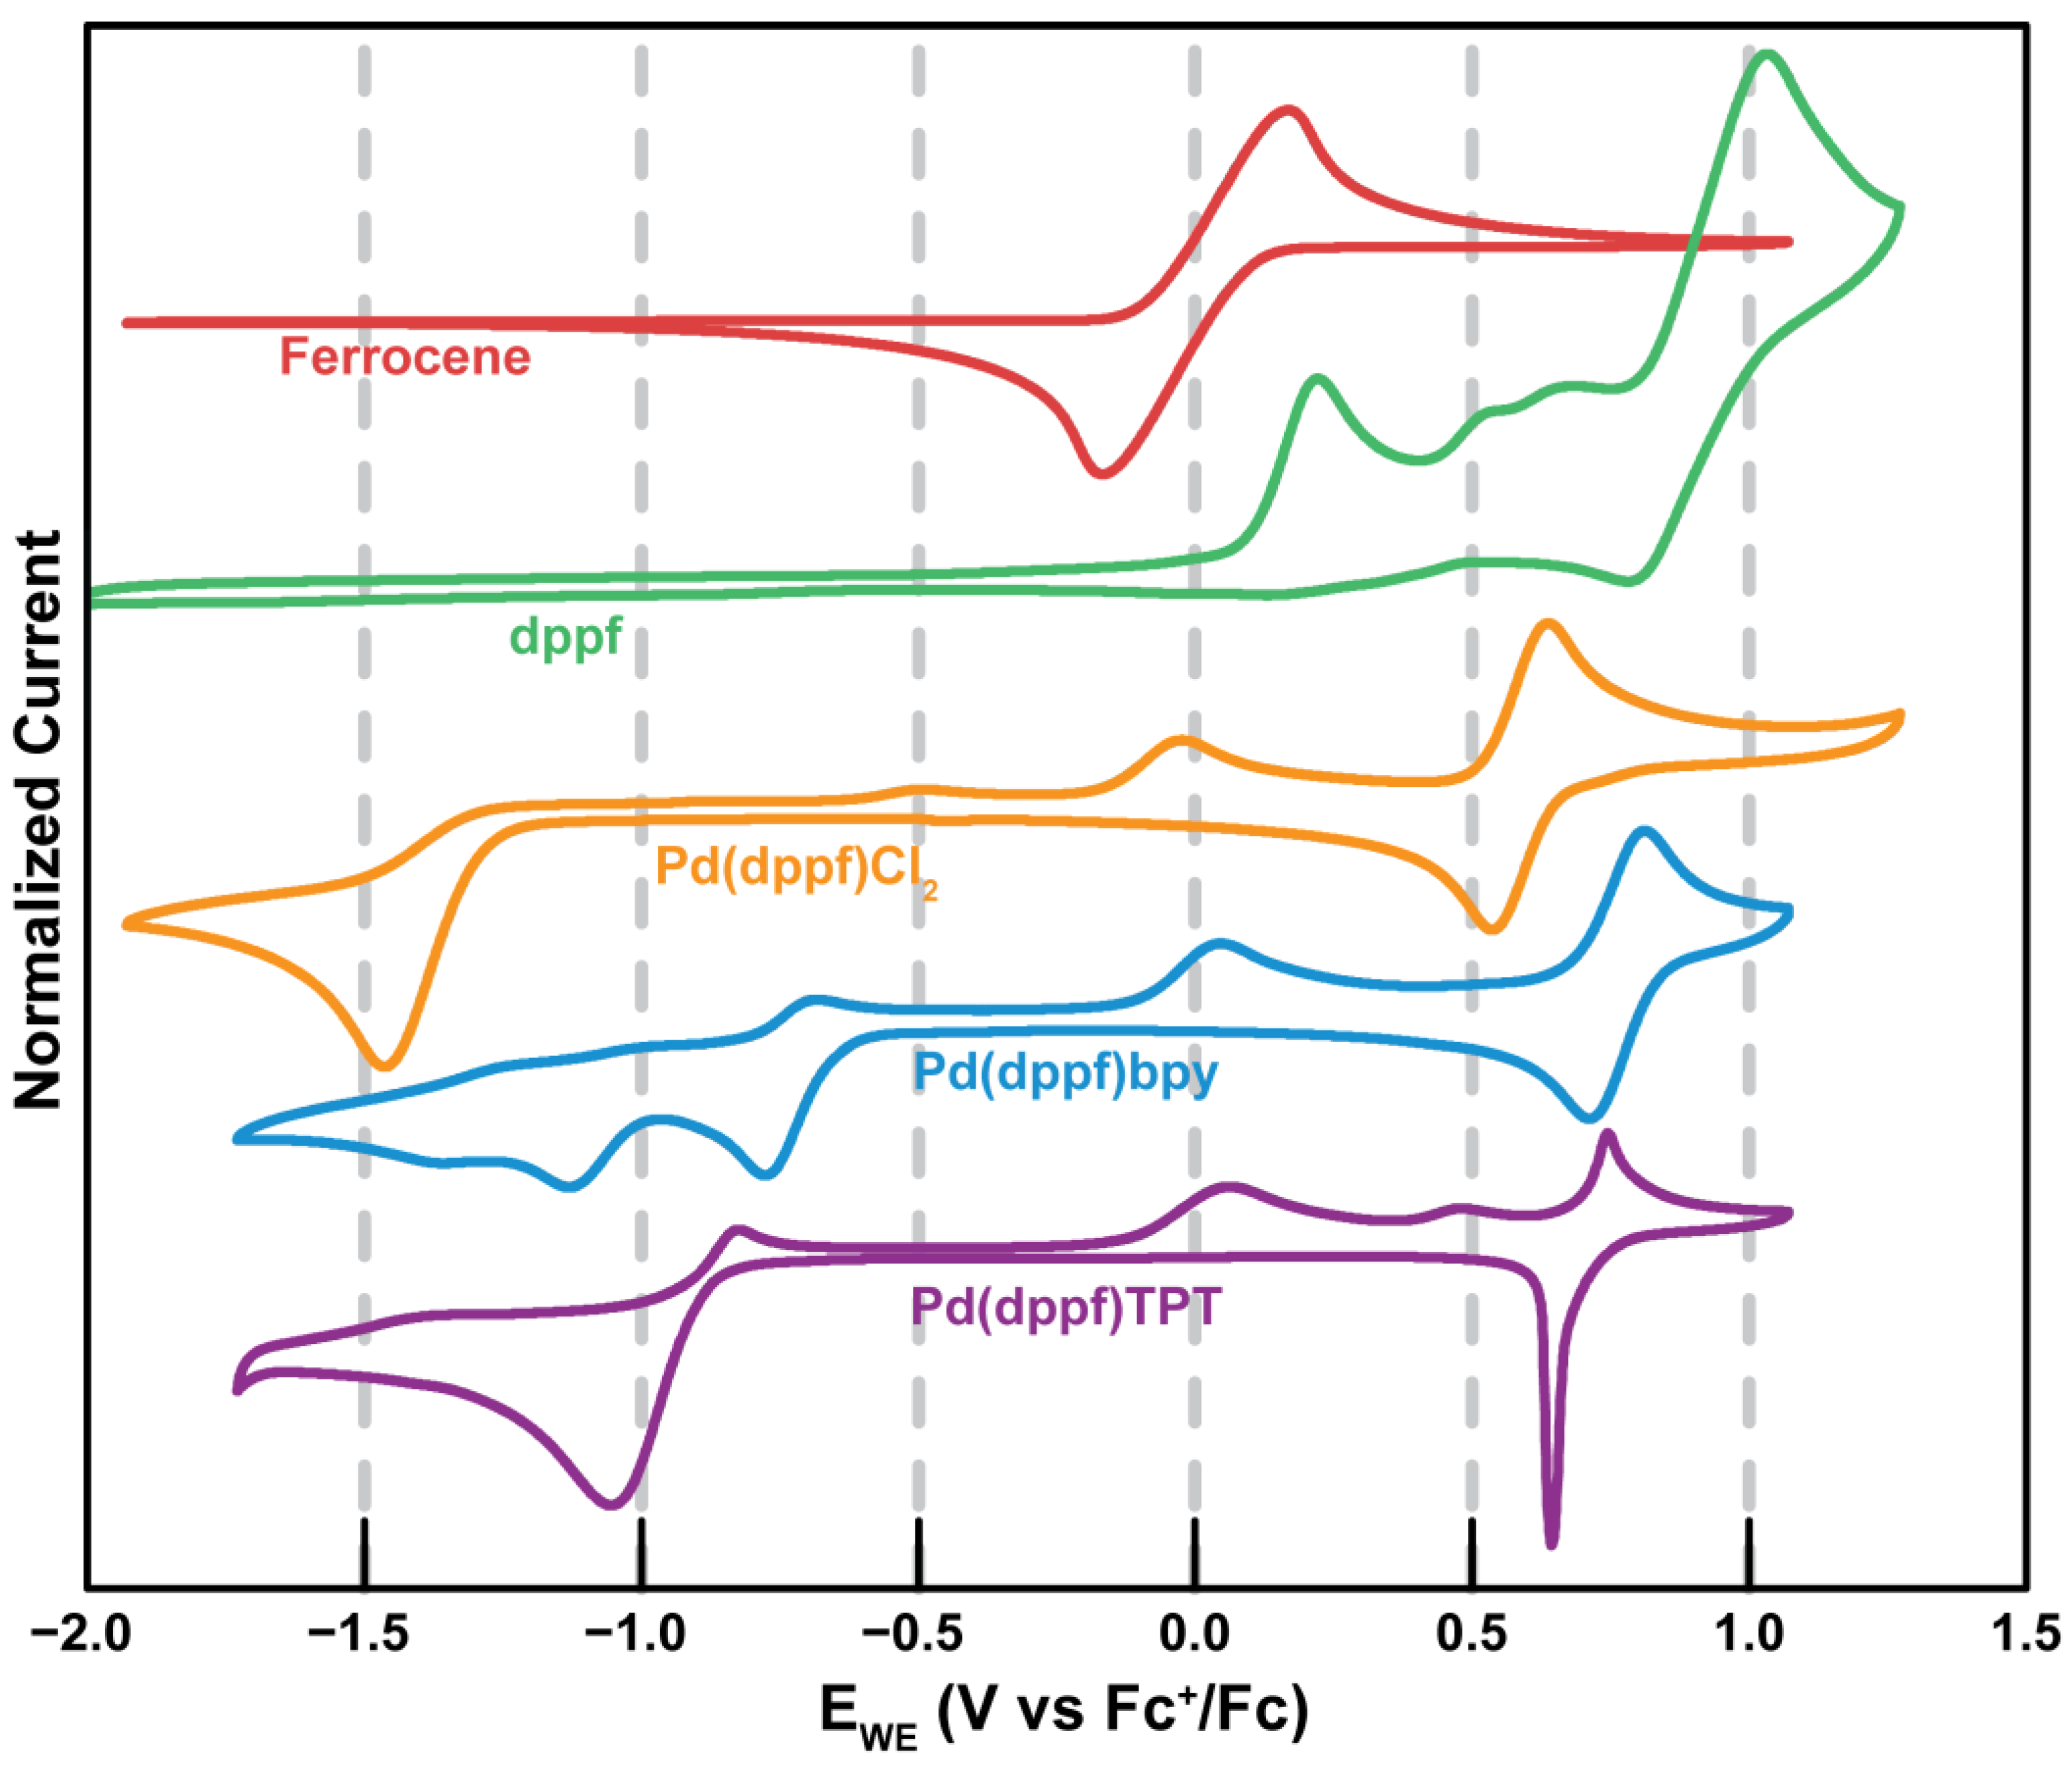
2.4. Electrochemical Characterization
2.4.1. Fc
2.4.2. dppf
2.4.3. Pd(dppf)Cl2
2.4.4. Pd(dppf)bpy
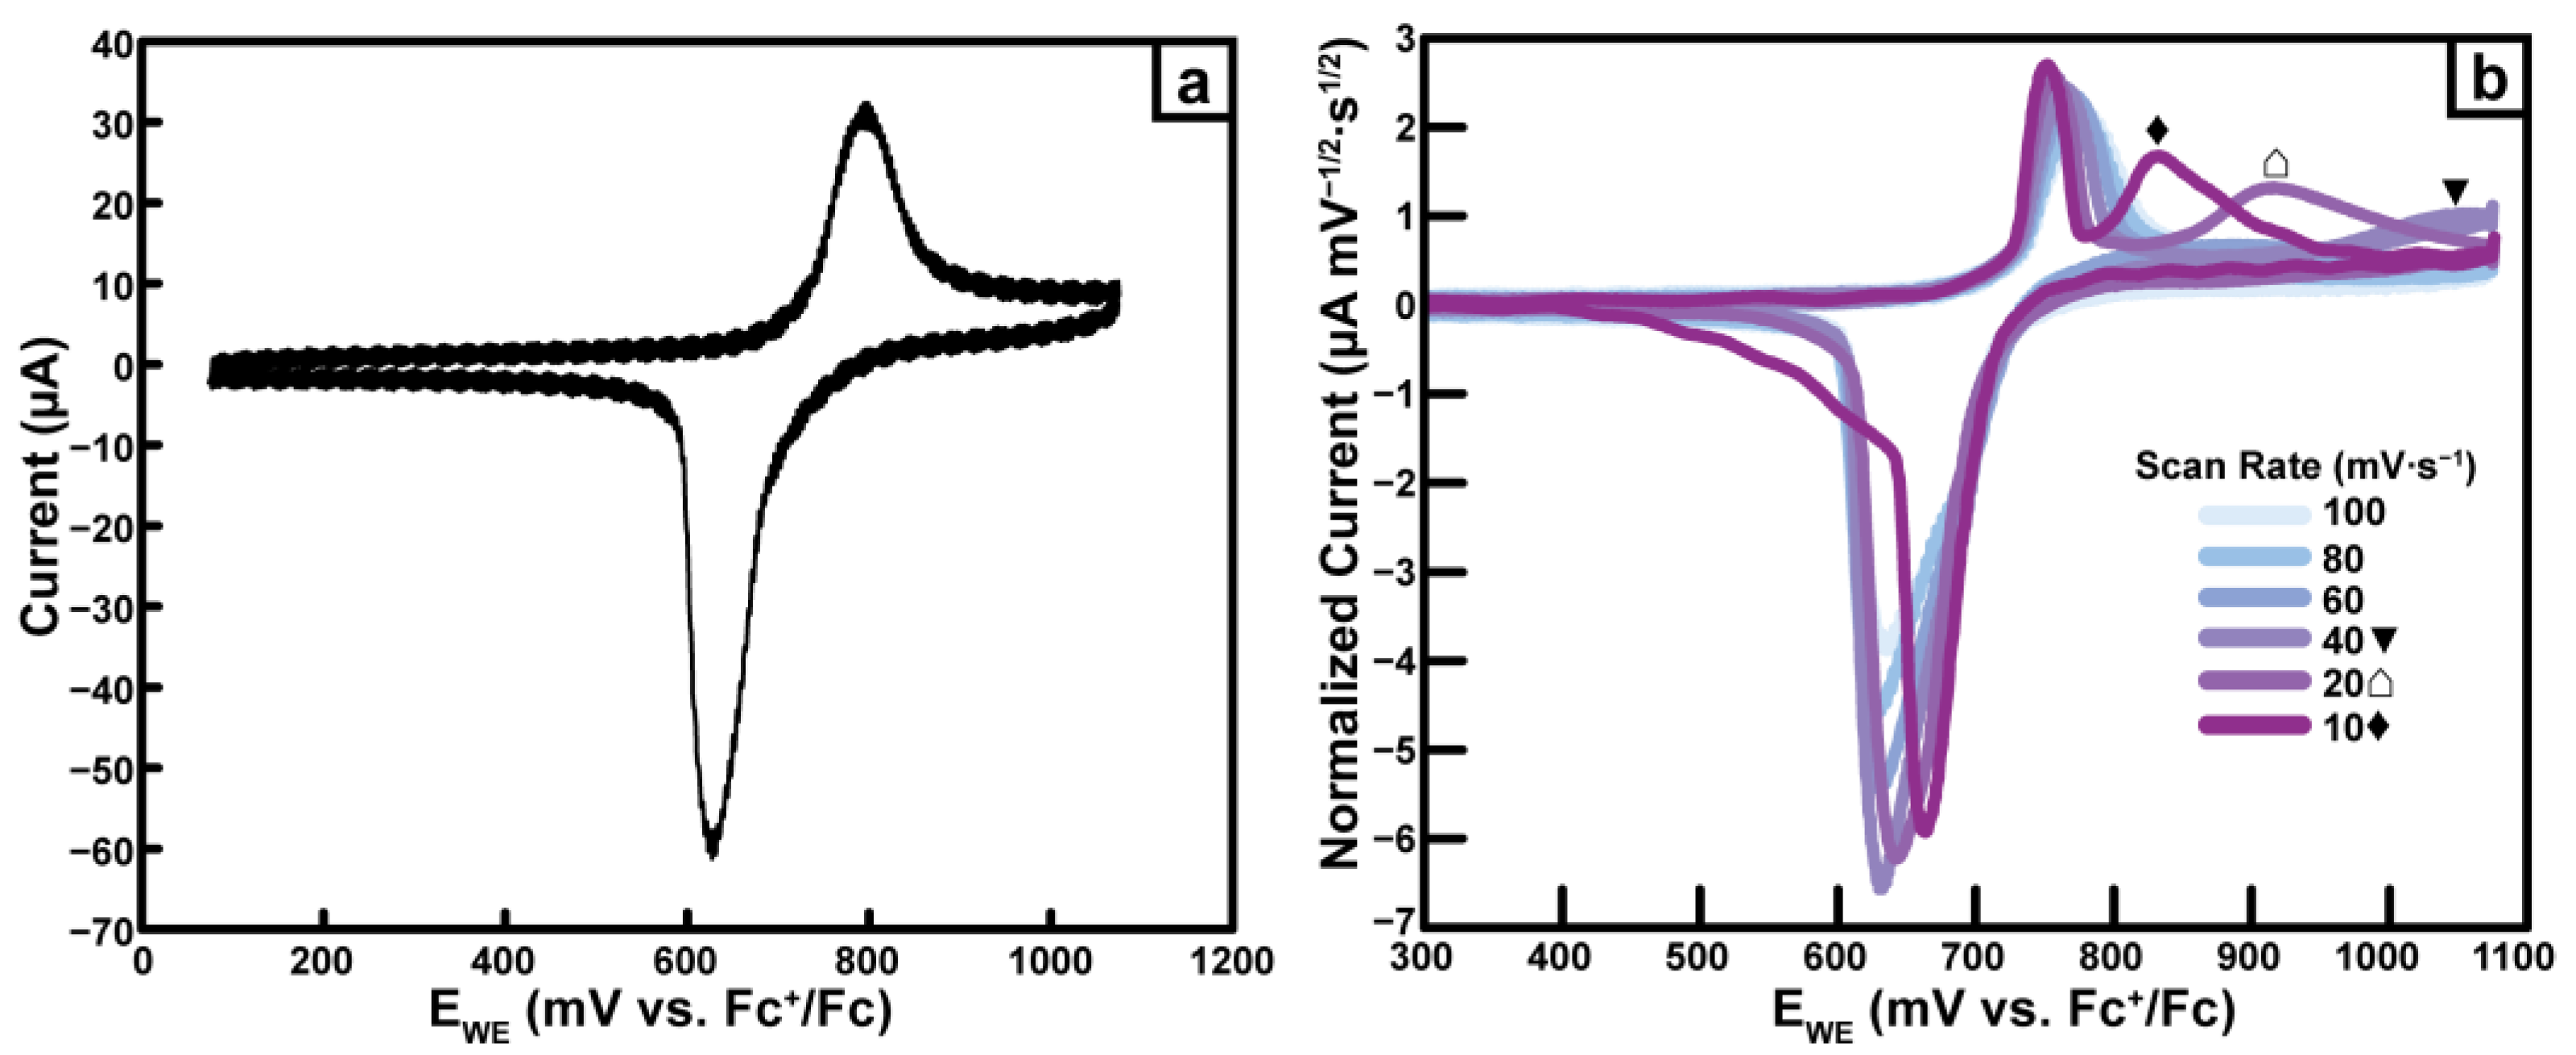
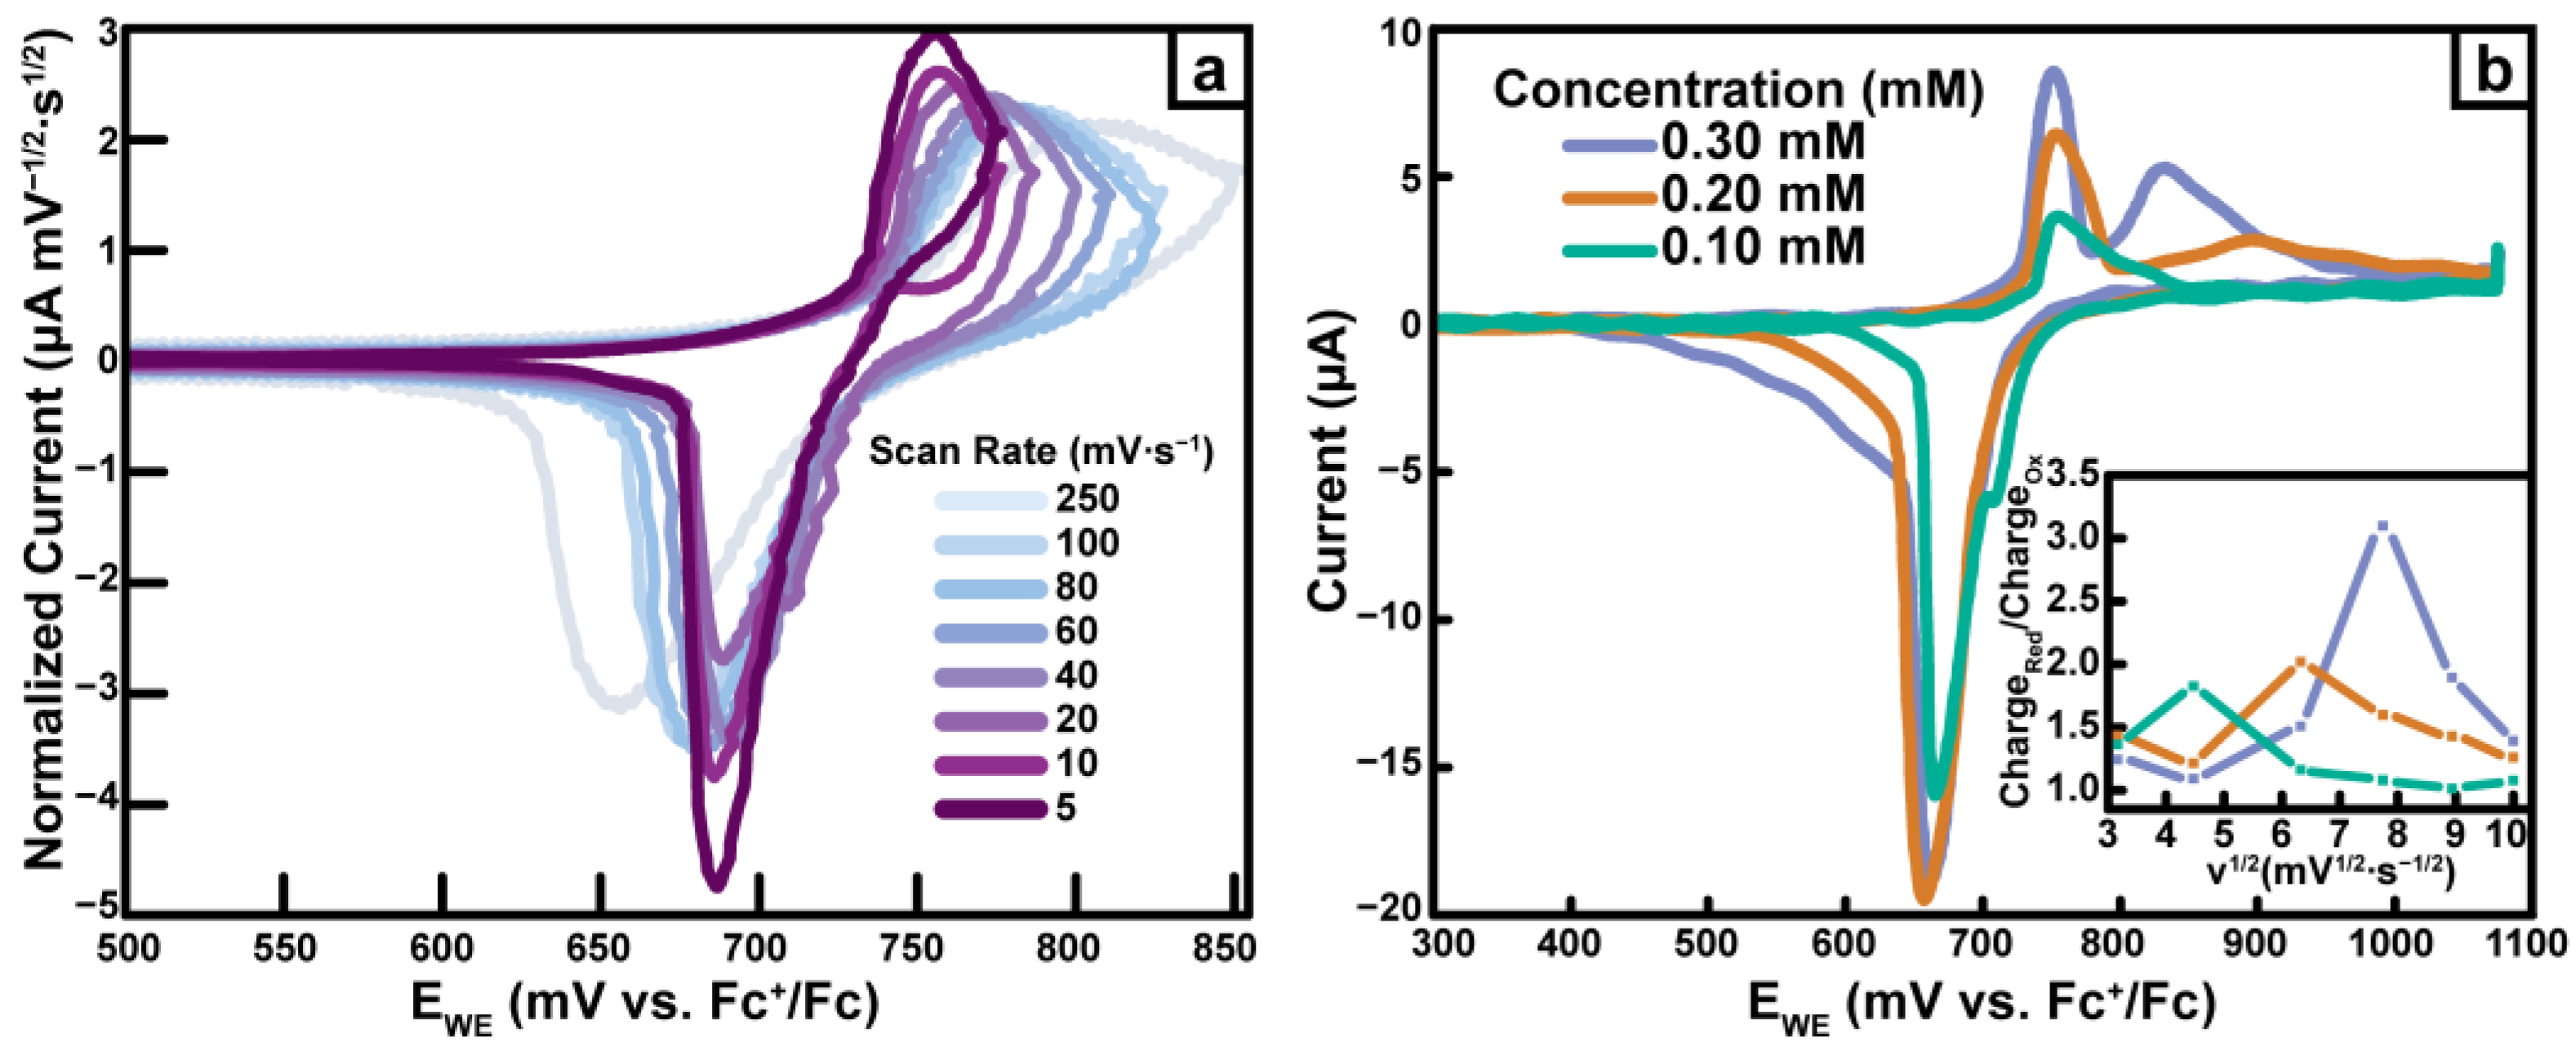
2.4.5. Pd(dppf)TPT
2.5. UV-Vis Spectroelectrochemistry
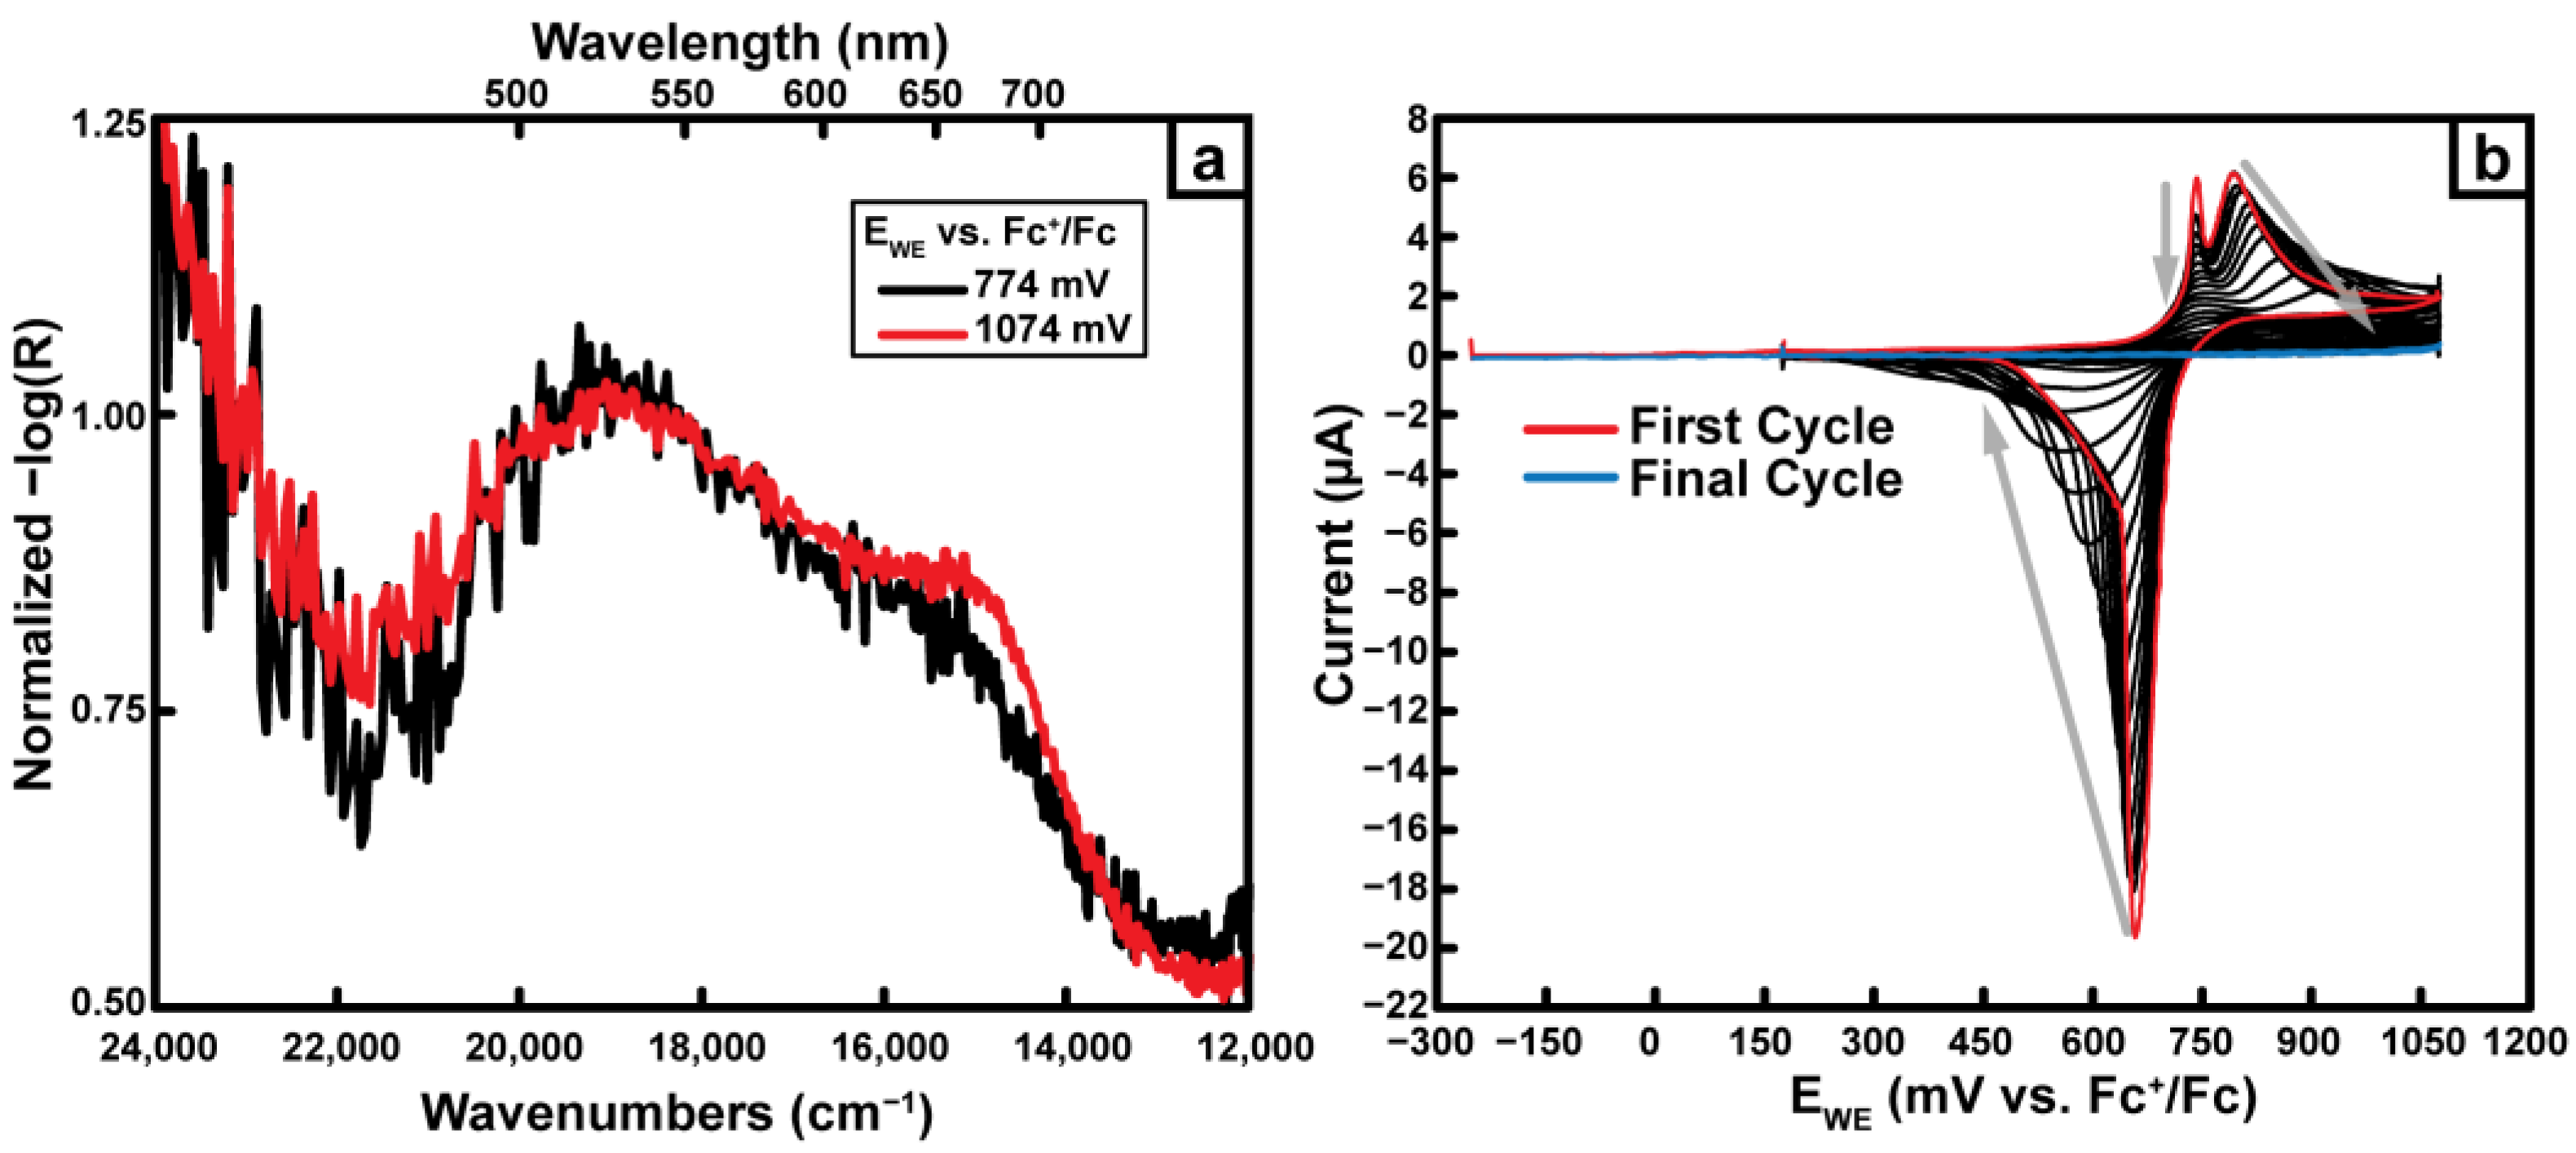
2.6. Diffuse Reflectance Spectroelectrochemistry
2.7. CV Cycling
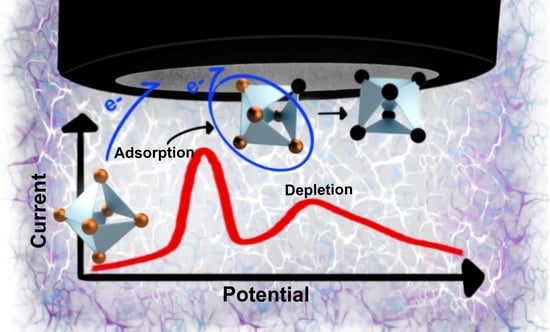
2.8. Proposed Mechanism
3. Materials and Methods
3.1. Materials
3.2. NMR Experiments
3.3. Synthesis of dichloro(1,1′-bis(diphenylphosphino)ferrocene)palladium(II) (Pd(dppf)Cl2)

3.4. Synthesis of [bis-acetonitrile(1,1′-bis(diphenylphosphino)ferrocene)palladium(II)]hexafluorophosphate [(Pd(dppf)(ACN)2](PF6)2)

3.5. Synthesis of 2,2′-dipyridyl(1,1′-bis(diphenylphosphino)ferrocene)palladium(II) hexafluorophosphate (Pd(dppf)bpy)

3.6. Synthesis of Pd(dppf)TPT
3.7. UV-Vis
3.8. Mass Spectrometry
3.9. Crystallographic Details
3.10. Electrochemical Measurements
3.11. UV-Vis Spectroelectrochemistry
3.12. Diffuse Reflectance Spectroelectrochemistry
4. Conclusions
Supplementary Materials
Author Contributions
Funding
Data Availability Statement
Acknowledgments
Conflicts of Interest
References
- Fabbrizzi, L. The ferrocenium/ferrocene couple: A versatile redox switch. ChemTexts 2020, 6, 22. [Google Scholar] [CrossRef]
- Xu, L.; Wang, Y.-X.; Chen, L.-J.; Yang, H.-B. Construction of multiferrocenyl metallacycles and metallacages via coordination-driven self-assembly: From structure to functions. Chem. Soc. Rev. 2015, 44, 2148–2167. [Google Scholar] [CrossRef] [PubMed]
- Young, D.J.; Chien, S.W.; Hor, T.S.A. 1,1’-Bis(diphenylphosphino)ferrocene in functional molecular materials. Dalton Trans. 2012, 41, 12655–12665. [Google Scholar] [CrossRef]
- Musikhina, A.A.; Serebrennikova, P.O.; Zabelina, O.N.; Utepova, I.A.; Chupakhin, O.N. Advanced Application of Planar Chiral Heterocyclic Ferrocenes. Inorganics 2022, 10, 152. [Google Scholar] [CrossRef]
- Tarafder, K.; Surendranath, Y.; Olshansky, J.H.; Alivisatos, A.P.; Wang, L.-W. Hole Transfer Dynamics from a CdSe/CdS Quantum Rod to a Tethered Ferrocene Derivative. J. Am. Chem. Soc. 2014, 136, 5121–5131. [Google Scholar] [CrossRef]
- Paul, A.; Borrelli, R.; Bouyanfif, H.; Gottis, S.; Sauvage, F. Tunable Redox Potential, Optical Properties, and Enhanced Stability of Modified Ferrocene-Based Complexes. ACS Omega 2019, 4, 14780–14789. [Google Scholar] [CrossRef]
- Erb, W.; Richy, N.; Hurvois, J.-P.; Low, P.J.; Mongin, F. From ferrocene to 1,2,3,4,5-pentafluoroferrocene: Halogen effect on the properties of metallocene. Dalton Trans. 2021, 50, 16933–16938. [Google Scholar] [CrossRef]
- Bennett, T.L.R.; Wilkinson, L.A.; Lok, J.M.A.; O’Toole, R.C.P.; Long, N.J. Synthesis, Electrochemistry, and Optical Properties of Highly Conjugated Alkynyl-Ferrocenes and -Biferrocenes. Organometallics 2021, 40, 1156–1162. [Google Scholar] [CrossRef]
- Hsu, W.-C.; Wang, Y.-H. Homogeneous Water Oxidation Catalyzed by First-Row Transition Metal Complexes: Unveiling the Relationship between Turnover Frequency and Reaction Overpotential. ChemSusChem 2022, 15, e202102378. [Google Scholar] [CrossRef]
- Singh, C.; Mukhopadhyay, S.; Hod, I. Metal–organic framework derived nanomaterials for electrocatalysis: Recent developments for CO2 and N2 reduction. Nano Converg. 2021, 8, 1. [Google Scholar] [CrossRef]
- Mazzeo, A.; Santalla, S.; Gaviglio, C.; Doctorovich, F.; Pellegrino, J. Recent progress in homogeneous light-driven hydrogen evolution using first-row transition metal catalysts. Inorg. Chim. Acta 2021, 517, 119950. [Google Scholar] [CrossRef]
- Kasprzak, A.; Nisiewicz, M.K.; Nowicka, A.M. A chromatography-free total synthesis of a ferrocene-containing dendrimer exhibiting the property of recognizing 9,10-diphenylanthracene. Dalton Trans. 2021, 50, 2483–2492. [Google Scholar] [CrossRef] [PubMed]
- Brake, H.; Peresypkina, E.; Virovets, A.V.; Kremer, W.; Klimas, C.; Schwarzmaier, C.; Scheer, M. Au-Containing Coordination Polymers Based on Polyphosphorus Ligand Complexes. Inorg. Chem. 2021, 60, 6027–6039. [Google Scholar] [CrossRef]
- Kunde, T.; Pausch, T.; Guńka, P.A.; Krzyżanowski, M.; Kasprzak, A.; Schmidt, B.M. Fast, solvent-free synthesis of ferrocene-containing organic cages via dynamic covalent chemistry in the solid state. Chem. Sci. 2022, 13, 2877–2883. [Google Scholar] [CrossRef] [PubMed]
- Kasprzak, A.; Kasprzak, N.; Kowalczyk, A.; Nowicka, A.M. Ferrocenylated 1,3,5-triphenylbenzenes for the electrochemical detection of various cations or anions. Dalton Trans. 2021, 50, 8426–8433. [Google Scholar] [CrossRef] [PubMed]
- Vasdev, R.A.S.; Findlay, J.A.; Turner, D.R.; Crowley, J.D. Self-Assembly of a Redox Active, Metallosupramolecular [Pd3L6]6+ Complex Using a Rotationally Flexible Ferrocene Ligand. Chem. Asian. J. 2021, 16, 39–43. [Google Scholar] [CrossRef]
- Kosińska, A.I.; Nisiewicz, M.K.; Nowicka, A.M.; Kasprzak, A. Electrochemical Recognition of Aromatic Species with Ferrocenylated 1,3,5-Triazine- or 1,3,5-Triphenylbenzene-Containing Highly Organized Molecules. ChemPlusChem 2021, 86, 820–826. [Google Scholar] [CrossRef]
- Cook, T.R.; Zheng, Y.-R.; Stang, P.J. Metal-Organic Frameworks and Self-Assembled Supramolecular Coordination Complexes: Comparing and Contrasting the Design, Synthesis, and Functionality of Metal-Organic Materials. Chem. Rev. 2013, 113, 734–777. [Google Scholar] [CrossRef]
- Cook, T.R.; Stang, P.J. Recent Developments in the Preparation and Chemistry of Metallacycles and Metallacages via Coordination. Chem. Rev. 2015, 115, 7001–7045. [Google Scholar] [CrossRef]
- Pilloni, G.; Longato, B.; Corain, B. Heteropolymetallic complexes of 1,1′-bis(diphenylphosphino)ferrocene (dppf): VII. Redox behaviour of dppf. J. Organomet. Chem. 1991, 420, 57–65. [Google Scholar] [CrossRef]
- Corain, B.; Longato, B.; Favero, G.; Ajò, D.; Pilloni, G.; Russo, U.; Kreissl, F.R. Heteropolymetallic complexes of 1,1′-Bis(diphenylphosphino)ferrocene (dppf). III. Comparative physicochemical properties of (dppf)MCl2 (M = Co, Ni, Pd, Pt, Zn, Cd, Hg). Inorganica Chim. Acta 1989, 157, 259–266. [Google Scholar] [CrossRef]
- Jiang, F.; Wang, J.; Li, J.; Wang, N.; Bao, X.; Wang, T.; Yang, Y.; Lan, Z.; Yang, R. Supramolecular Assemblies with Symmetrical Octahedral Structures—Synthesis, Characterization, and Electrochemical Properties. Eur. J. Inorg. Chem. 2013, 2013, 375–380. [Google Scholar] [CrossRef]
- Chen, L.-J.; Li, Q.-J.; He, J.; Tan, H.; Abliz, Z.; Yang, H.-B. Design and Construction of Endo-Functionalized Multiferrocenyl Hexagons via Coordination-Driven Self-Assembly and Their Electrochemistry. J. Org. Chem. 2012, 77, 1148–1153. [Google Scholar] [CrossRef]
- Ghosh, K.; Zhao, Y.; Yang, H.-B.; Northrop, B.H.; White, H.S.; Stang, P.J. Synthesis of a New Family of Hexakisferrocenyl Hexagons and Their Electrochemical Behavior. J. Org. Chem. 2008, 73, 8553–8557. [Google Scholar] [CrossRef]
- Sun, S.-S.; Anspach, J.A.; Lees, A.J. Transition-metal directed self-assembly of admantanoid-shaped supramolecules incorporating ferrocenyl moieties. Inorganica Chim. Acta 2003, 351, 363–368. [Google Scholar] [CrossRef]
- Gray, H.B.; Sohn, Y.S.; Hendrickson, N. Electronic structure of metallocenes. J. Am. Chem. Soc. 1971, 93, 3603–3612. [Google Scholar] [CrossRef]
- Ghosh, S.; Turner, D.R.; Batten, S.R.; Mukherjee, P.S. Self-assembly of a heterometallic molecular triangle using an ambidentate ligand and self-selection for a single linkage isomer. Dalton Trans. 2007, 19, 1869–1871. [Google Scholar] [CrossRef] [PubMed]
- Stang, P.J.; Olenyuk, B.; Fan, J.; Arif, A.M. Combining Ferrocenes and Molecular Squares: Self-Assembly of Heterobimetallic Macrocyclic Squares Incorporating Mixed Transition Metal Systems and a Main Group Element. Single-Crystal X-ray Structure of [Pt(dppf)(H2O)2][OTf]2. Organometallics 1996, 15, 904–908. [Google Scholar] [CrossRef]
- Sun, S.-S.; Anspach, J.A.; Lees, A.J.; Zavalij, P.Y. Synthesis and Electrochemical, Photophysical, and Anion Binding Properties of Self-Assembly Heterometallic Cyclophanes. Organometallics 2002, 21, 685–693. [Google Scholar] [CrossRef]
- Ferrer, M.; Mounir, M.; Rossell, O.; Ruiz, E.; Maestro, M.A. Equilibria between Metallosupramolecular Squares and Triangles with the New Rigid Linker 1,4-Bis(4-pyridyl)tetrafluorobenzene. Experimental and Theoretical Study of the Structural Dependence of NMR Data. Inorg. Chem. 2003, 42, 5890–5899. [Google Scholar] [CrossRef]
- Haynes, W.M.; Lide, D.R.; Bruno, T.J. CRC Handbook of Chemistry and Physics: A Ready-reference Book of Chemical and Physical Data, 97th ed.; CRC Press: Boca Raton, FL, USA, 2016. [Google Scholar]
- Macchioni, A.; Ciancaleoni, G.; Zuccaccia, C.; Zuccaccia, D. Determining accurate molecular sizes in solution through NMR diffusion spectroscopy. Chem. Soc. Rev. 2008, 37, 479–489. [Google Scholar] [CrossRef]
- Chepelin, O.; Ujma, J.; Wu, X.; Slawin, A.M.Z.; Pitak, M.B.; Coles, S.J.; Michel, J.; Jones, A.C.; Barran, P.E.; Lusby, P.J. Luminescent, Enantiopure, Phenylatopyridine Iridium-Based Coordination Capsules. J. Am. Chem. Soc. 2012, 134, 19334–19337. [Google Scholar] [CrossRef]
- Chakrabarty, R.; Mukherjee, P.S.; Stang, P.J. Supramolecular Coordination: Self-Assembly of Finite Two- and Three-Dimensional Ensembles. Chem. Rev. 2011, 111, 6810–6918. [Google Scholar] [CrossRef] [PubMed]
- Komine, S.; Takahashi, S.; Kojima, T.; Sato, H.; Hiraoka, S. Self-Assembly Processes of Octahedron-Shaped Pd6L4 Cages. J. Am. Chem. Soc. 2019, 141, 3178–3186. [Google Scholar] [CrossRef] [PubMed]
- Bard, A.J.; Faulkner, L.R. Electrochemical Methods: Fundamentals and Applications, 2nd ed.; Wiley: New York, NY, USA, 2001. [Google Scholar]
- Ling, X.Y.; Reinhoudt, D.N.; Huskens, J. Ferrocenyl-Functionalized Silica Nanoparticles: Preparation, Characterization, and Molecular Recognition at Interfaces. Langmuir 2006, 22, 8777–8783. [Google Scholar] [CrossRef]
- Kishore, P.V.V.N.; Liao, J.-H.; Hou, H.-N.; Lin, Y.-R.; Liu, C.W. Ferrocene-Functionalized Cu(I)/Ag(I) Dithiocarbamate Clusters. Inorg. Chem. 2016, 55, 3663–3673. [Google Scholar] [CrossRef] [PubMed]
- MacDonald, D.G.; Kübel, C.; Corrigan, J.F. Ferrocenyl Functionalized Silver-Chalcogenide Nanoclusters. Inorg. Chem. 2011, 50, 3252–3261. [Google Scholar] [CrossRef]
- Shayani-jam, H. Electrochemical study of adsorption and electrooxidation of 4,4′-biphenol on the glassy carbon electrode: Determination of the orientation of adsorbed molecules. Monatsh. Chem. 2019, 150, 183–192. [Google Scholar] [CrossRef]
- Sohn, Y.S.; Hendrickson, D.N.; Gray, H.B. Electronic structure of ferricenium ion. J. Am. Chem. Soc. 1970, 92, 3233–3234. [Google Scholar] [CrossRef]
- Weber, K.; Hockett, L.; Creager, S. Long-Range Electronic Coupling between Ferrocene and Gold in Alkanethiolate-based Monolayers on Electrodes. J. Phys. Chem. B 1997, 101, 8286–8291. [Google Scholar] [CrossRef]
- Garah, M.E.; Cook, T.R.; Sepehrpour, H.; Ciesielski, A.; Stang, P.J.; Samorì, P. Concentration-dependent supramolecular patterns of C3 and C2 symmetric molecules at the solid/liquid interface. Colloids Surf. B. 2018, 168, 211–216. [Google Scholar] [CrossRef] [PubMed]
- CrysAlisPRO; Oxford Diffraction/Agilent Technologies UK Ltd.: Yarnton, UK.
- Sheldrick, G. SHELXT—Integrated space-group and crystal-structure determination. Acta Crystallogr. Sect. A 2015, 71, 3–8. [Google Scholar] [CrossRef] [PubMed]
- Sheldrick, G. A short history of SHELX. Acta Crystallogr. Sect. A 2008, 64, 112–122. [Google Scholar] [CrossRef] [PubMed]


Disclaimer/Publisher’s Note: The statements, opinions and data contained in all publications are solely those of the individual author(s) and contributor(s) and not of MDPI and/or the editor(s). MDPI and/or the editor(s) disclaim responsibility for any injury to people or property resulting from any ideas, methods, instructions or products referred to in the content. |
© 2023 by the authors. Licensee MDPI, Basel, Switzerland. This article is an open access article distributed under the terms and conditions of the Creative Commons Attribution (CC BY) license (https://creativecommons.org/licenses/by/4.0/).
Share and Cite
Gilbert, A.B.; Crawley, M.R.; Higgins, T.J.; Li, Y.C.; Watson, D.F.; Cook, T.R. Exploring the Emergent Redox Chemistry of Pd(II) Nodes with Pendant Ferrocenes: From Precursors, through Building Blocks, to Self-Assemblies. Inorganics 2023, 11, 122. https://doi.org/10.3390/inorganics11030122
Gilbert AB, Crawley MR, Higgins TJ, Li YC, Watson DF, Cook TR. Exploring the Emergent Redox Chemistry of Pd(II) Nodes with Pendant Ferrocenes: From Precursors, through Building Blocks, to Self-Assemblies. Inorganics. 2023; 11(3):122. https://doi.org/10.3390/inorganics11030122
Chicago/Turabian StyleGilbert, Austin B., Matthew R. Crawley, Trevor J. Higgins, Yuguang C. Li, David F. Watson, and Timothy R. Cook. 2023. "Exploring the Emergent Redox Chemistry of Pd(II) Nodes with Pendant Ferrocenes: From Precursors, through Building Blocks, to Self-Assemblies" Inorganics 11, no. 3: 122. https://doi.org/10.3390/inorganics11030122