
Structural and Biological Properties of Heteroligand Copper Complexes with Diethylnicotinamide and Various Fenamates: Preparation, Structure, Spectral Properties and Hirshfeld Surface Analysis
 , ,
, ,
Abstract
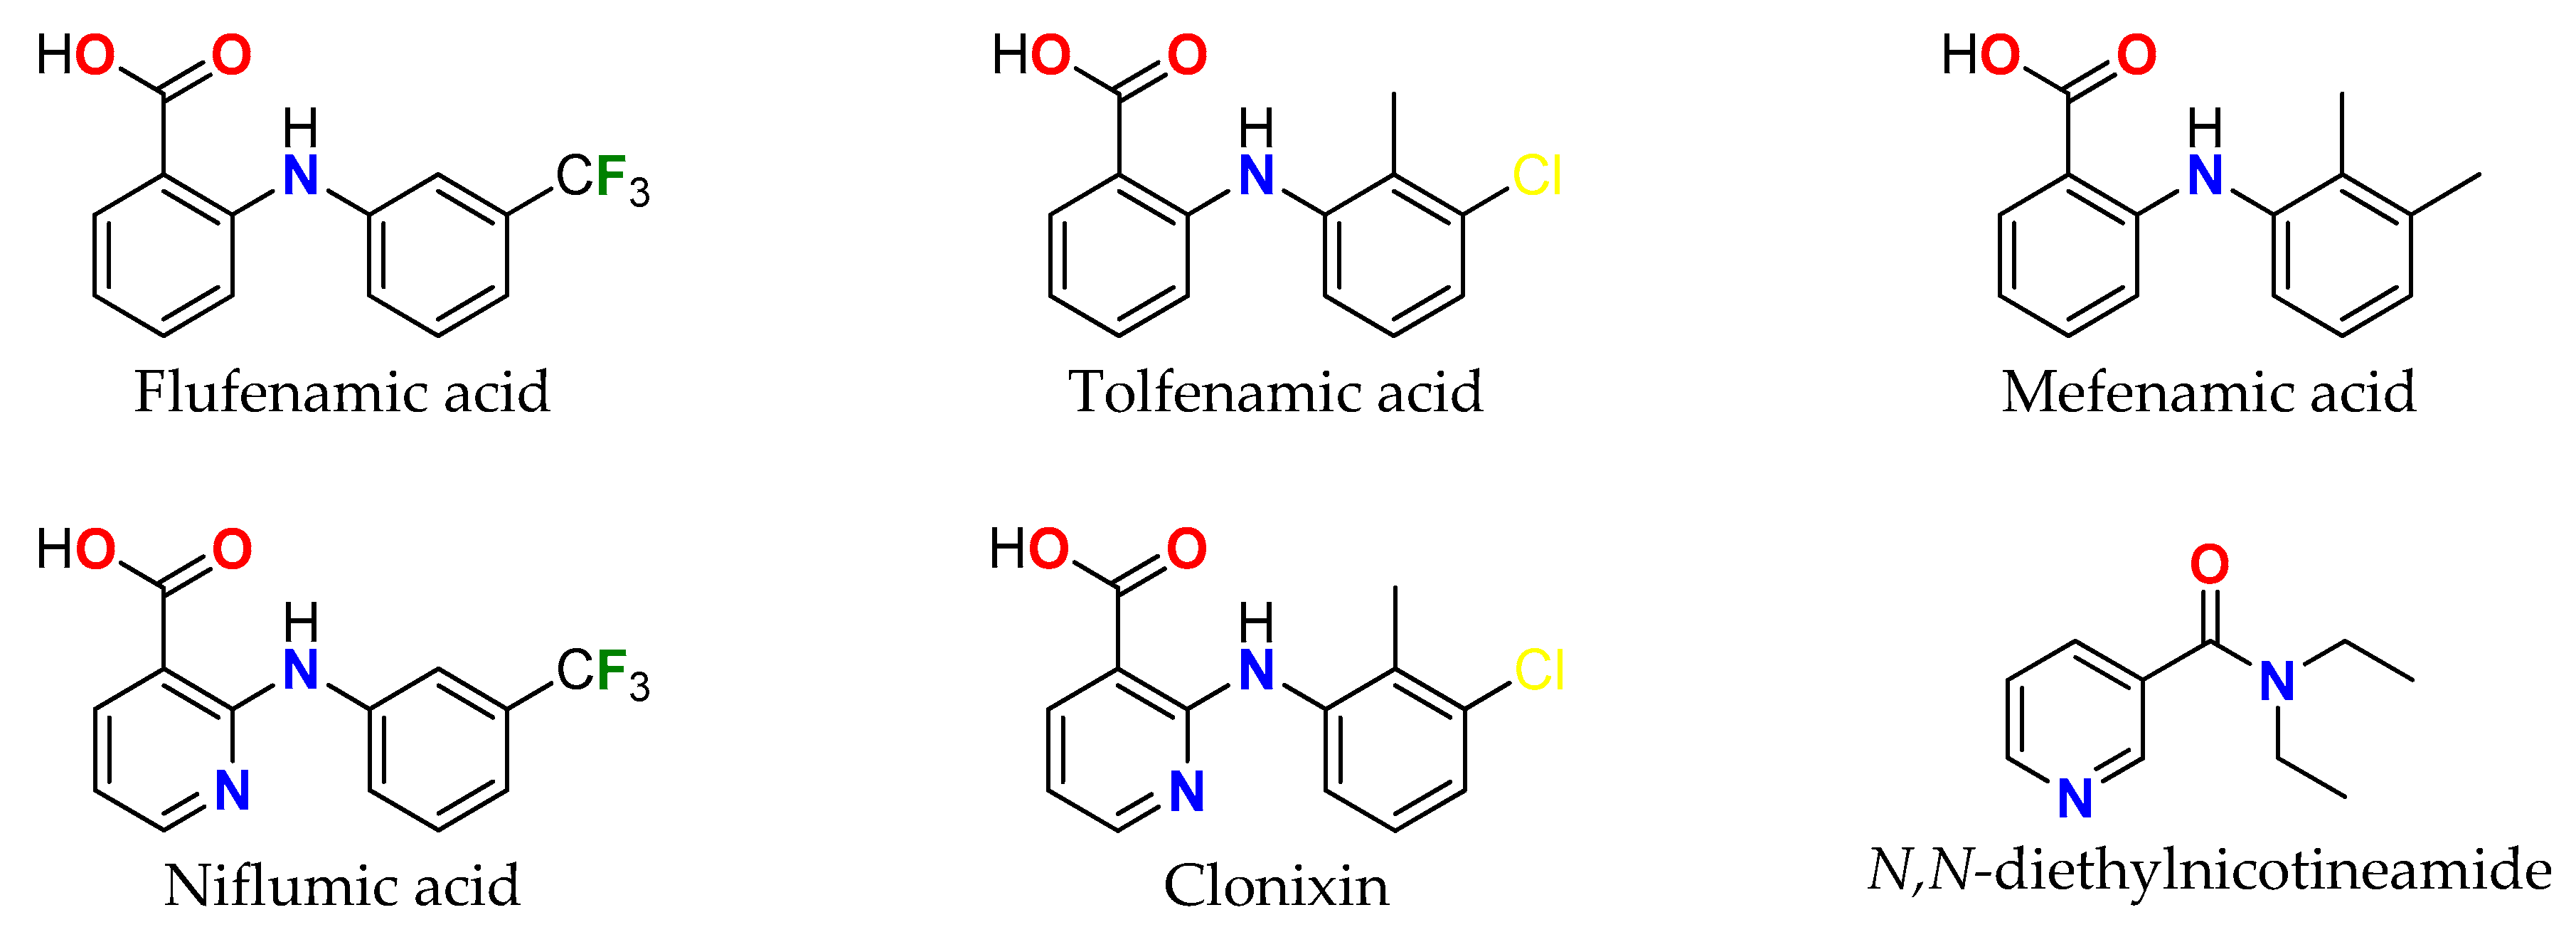
:1. Introduction
2. Results and Discussion
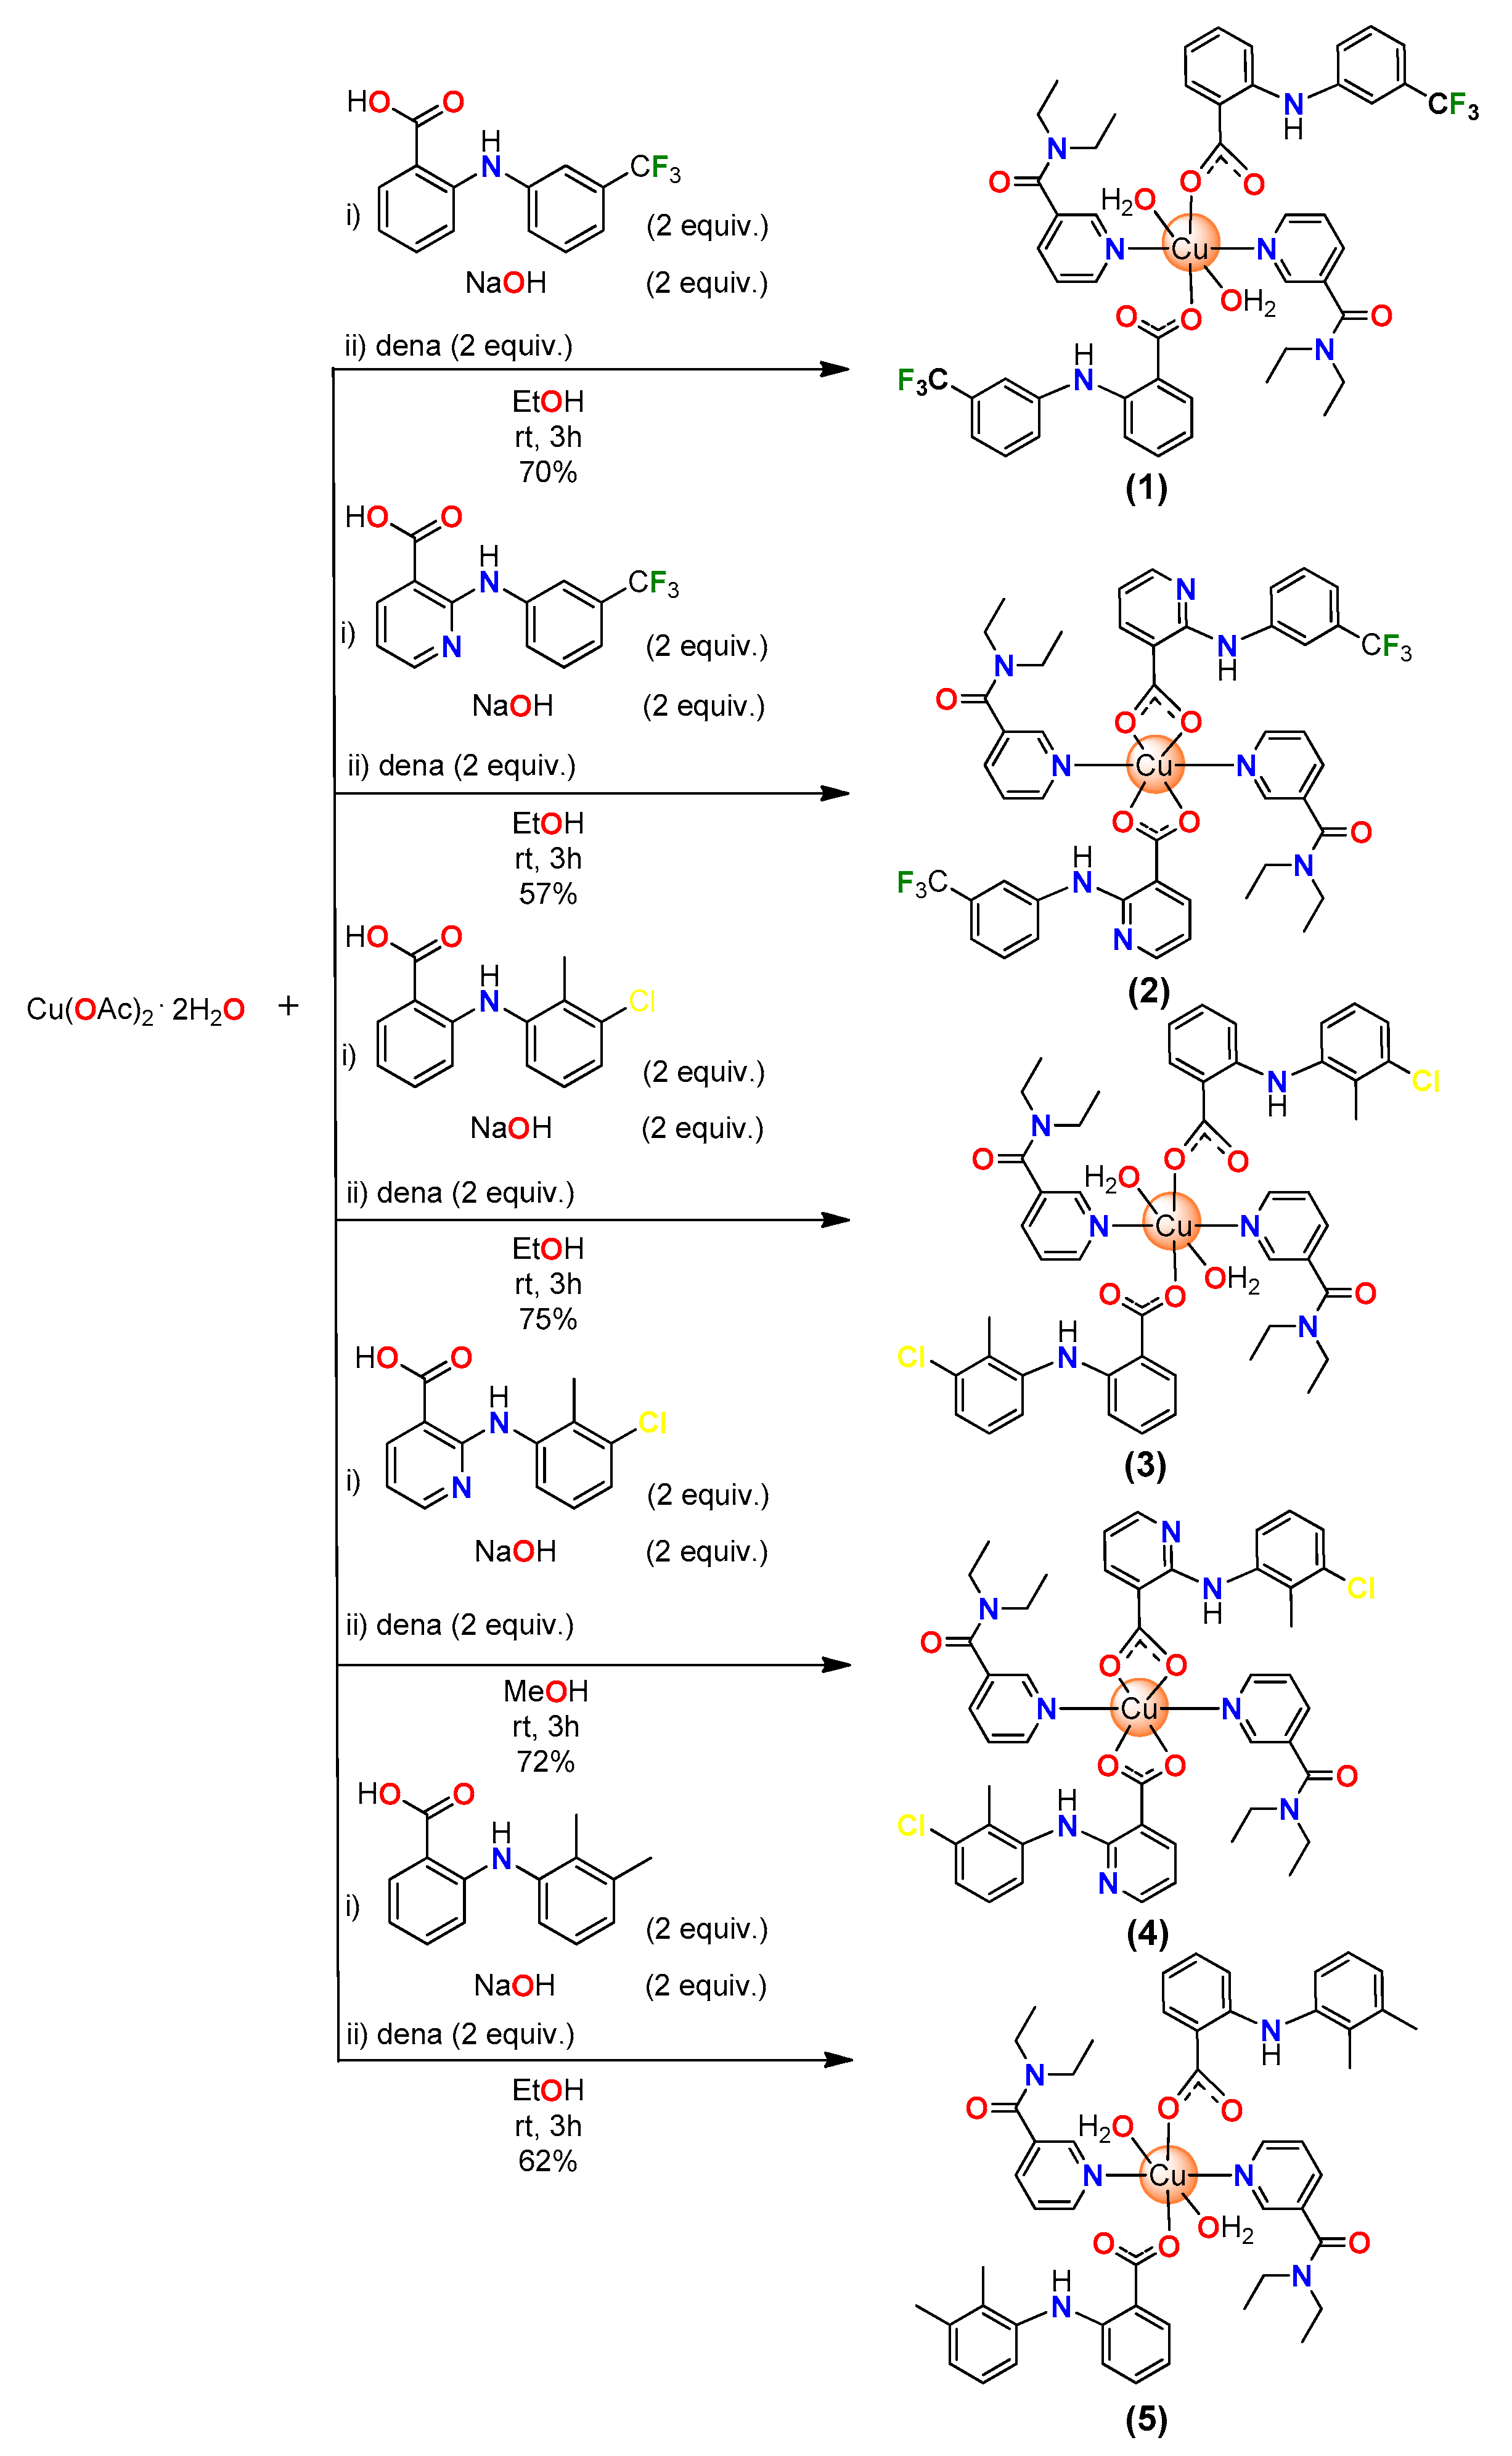
2.1. Synthesis
2.2. IR and UV-Vis Spectroscopy
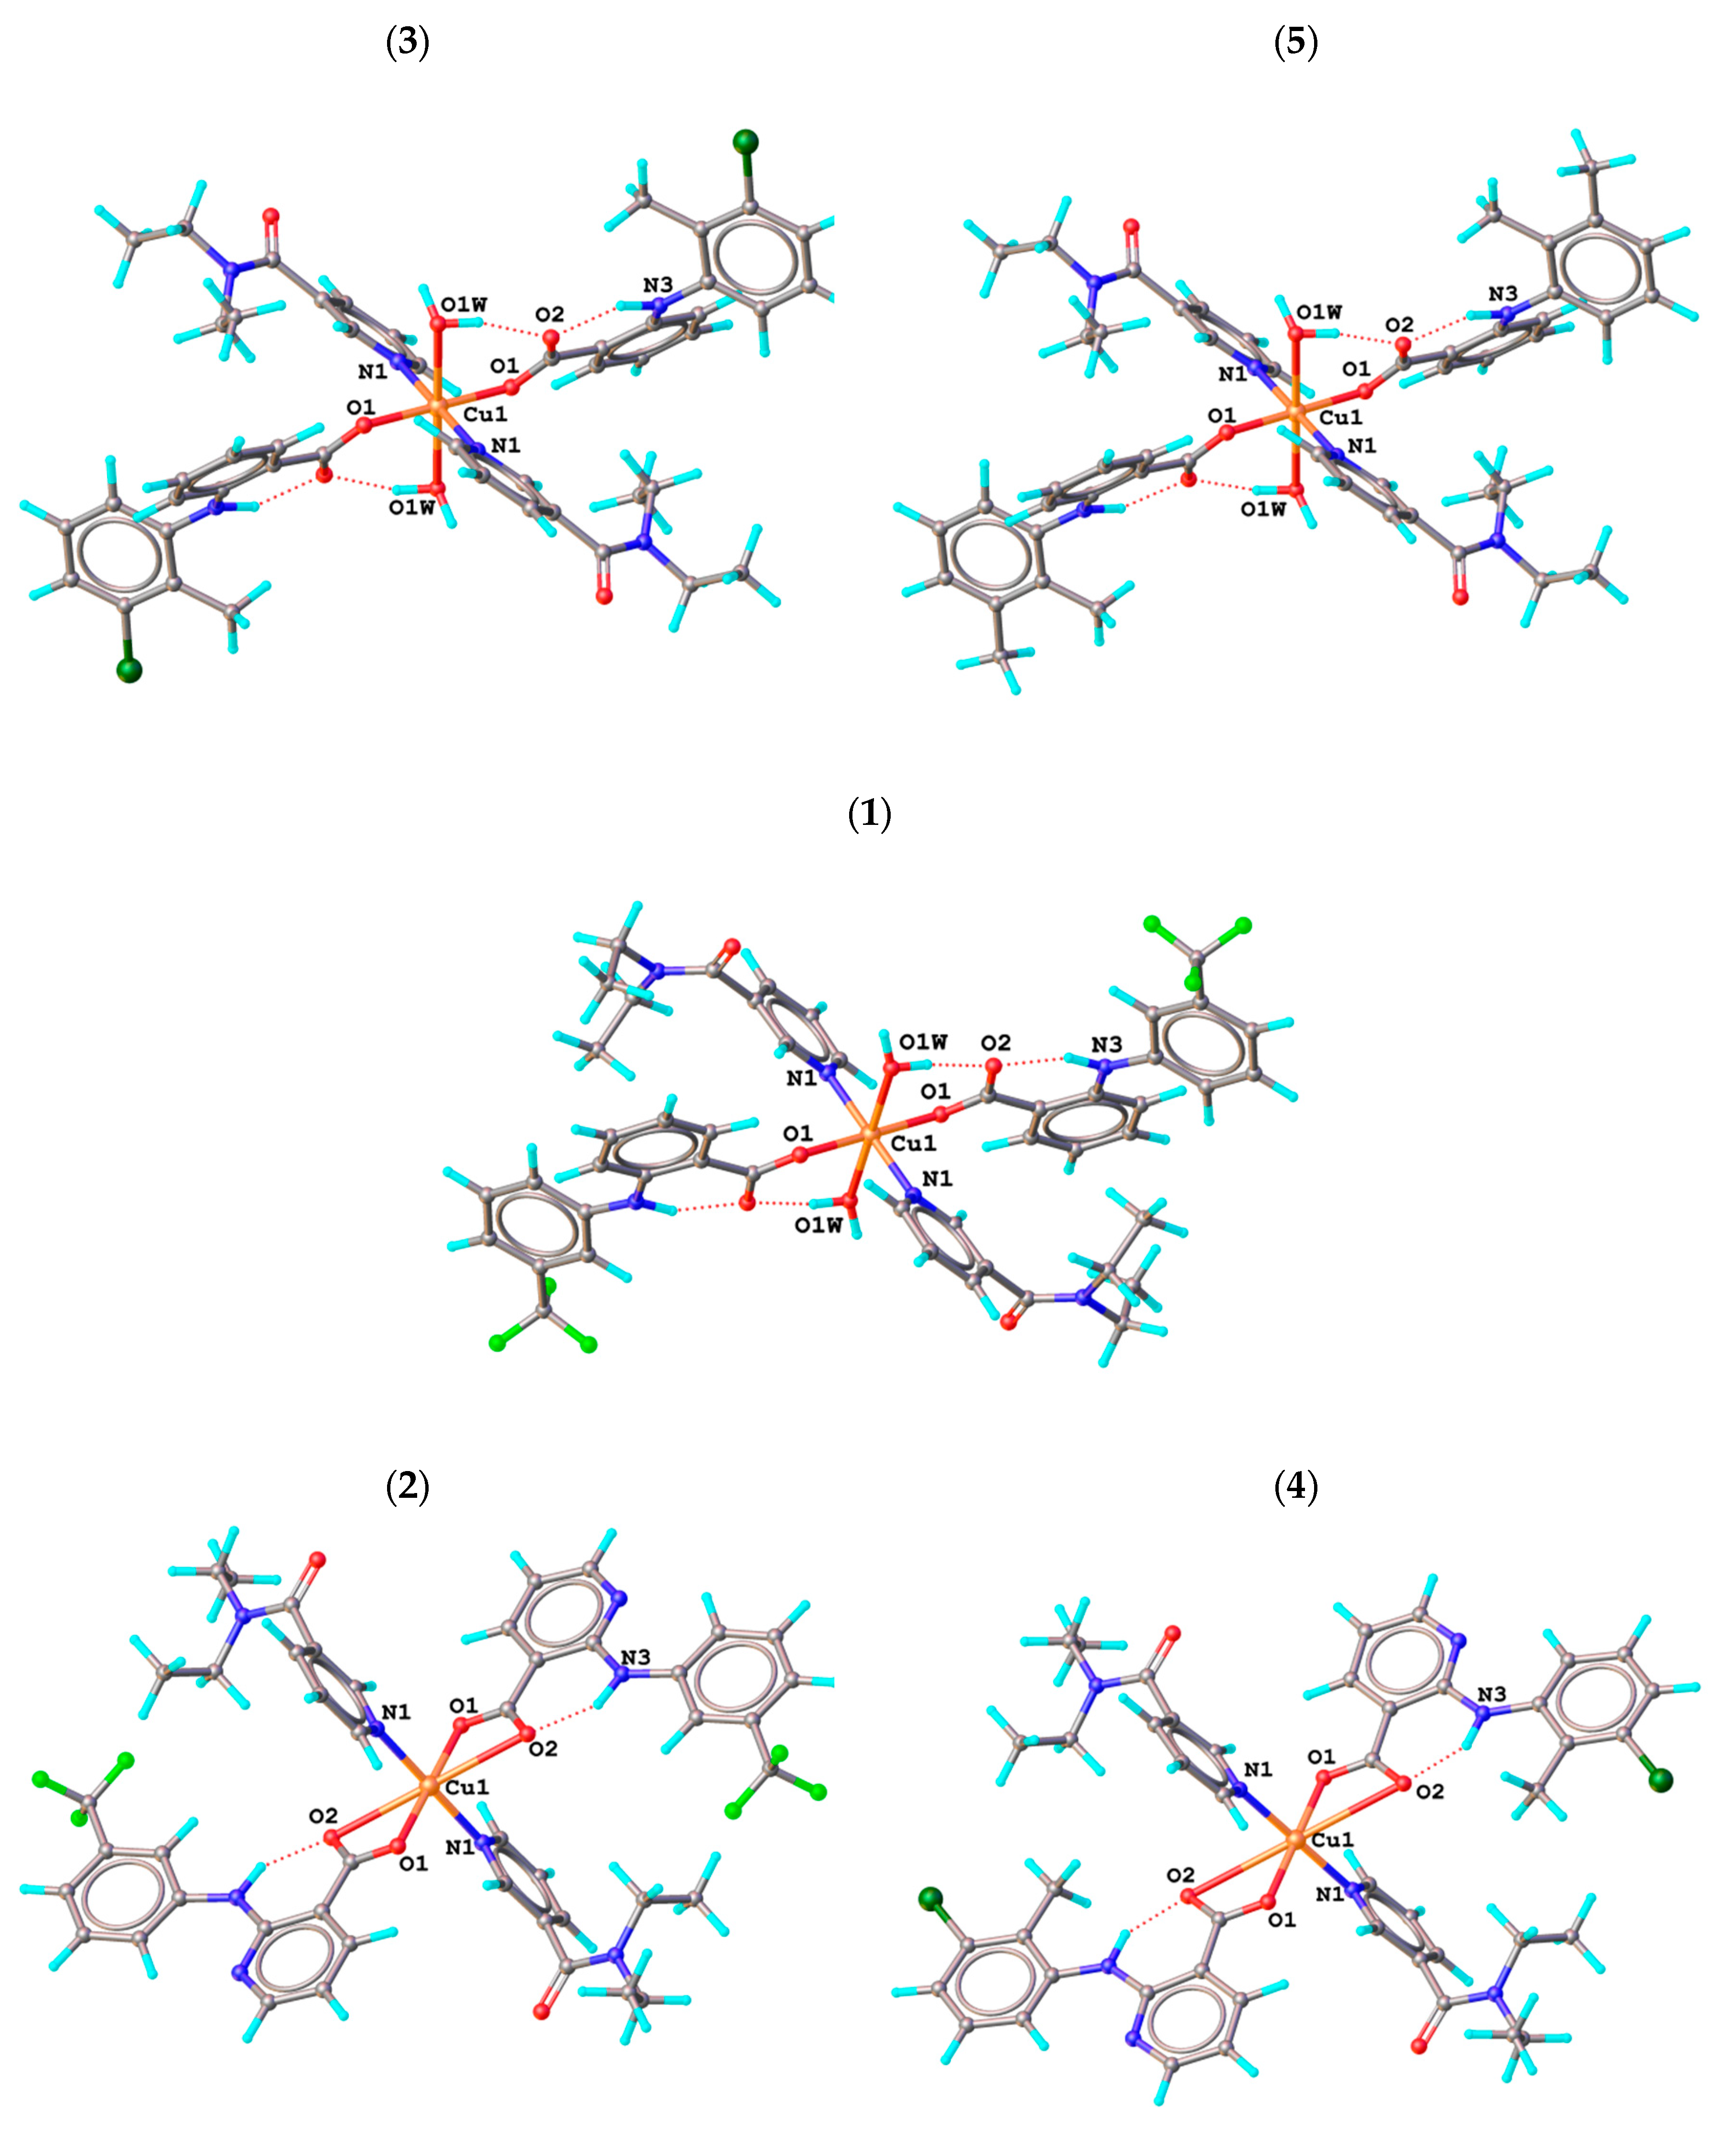
2.3. Molecular and Crystal Structures
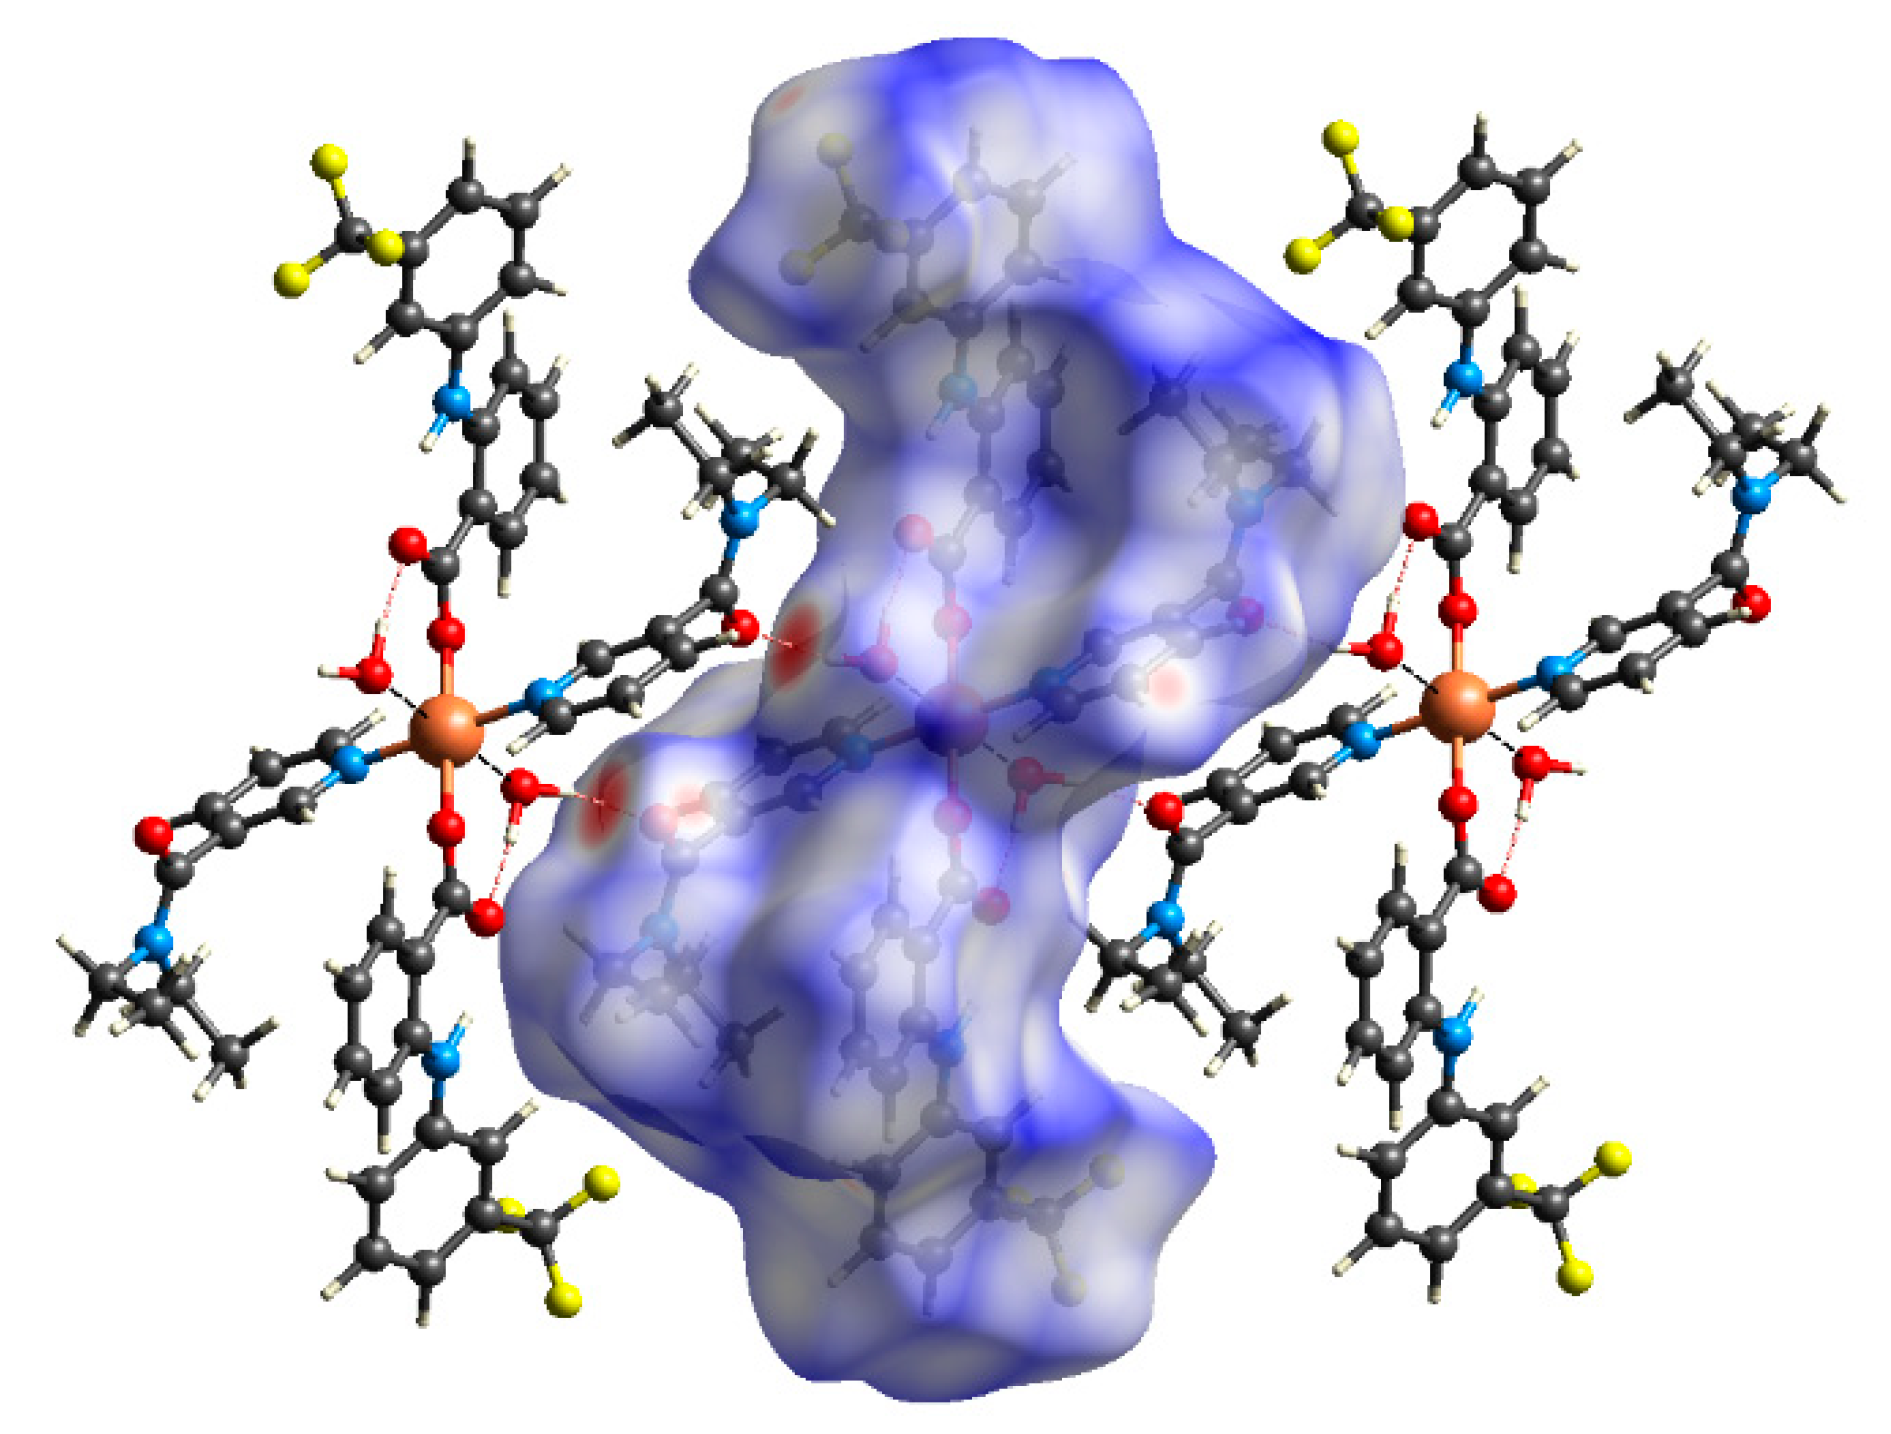
2.4. Hirshfeld Surface Analyses
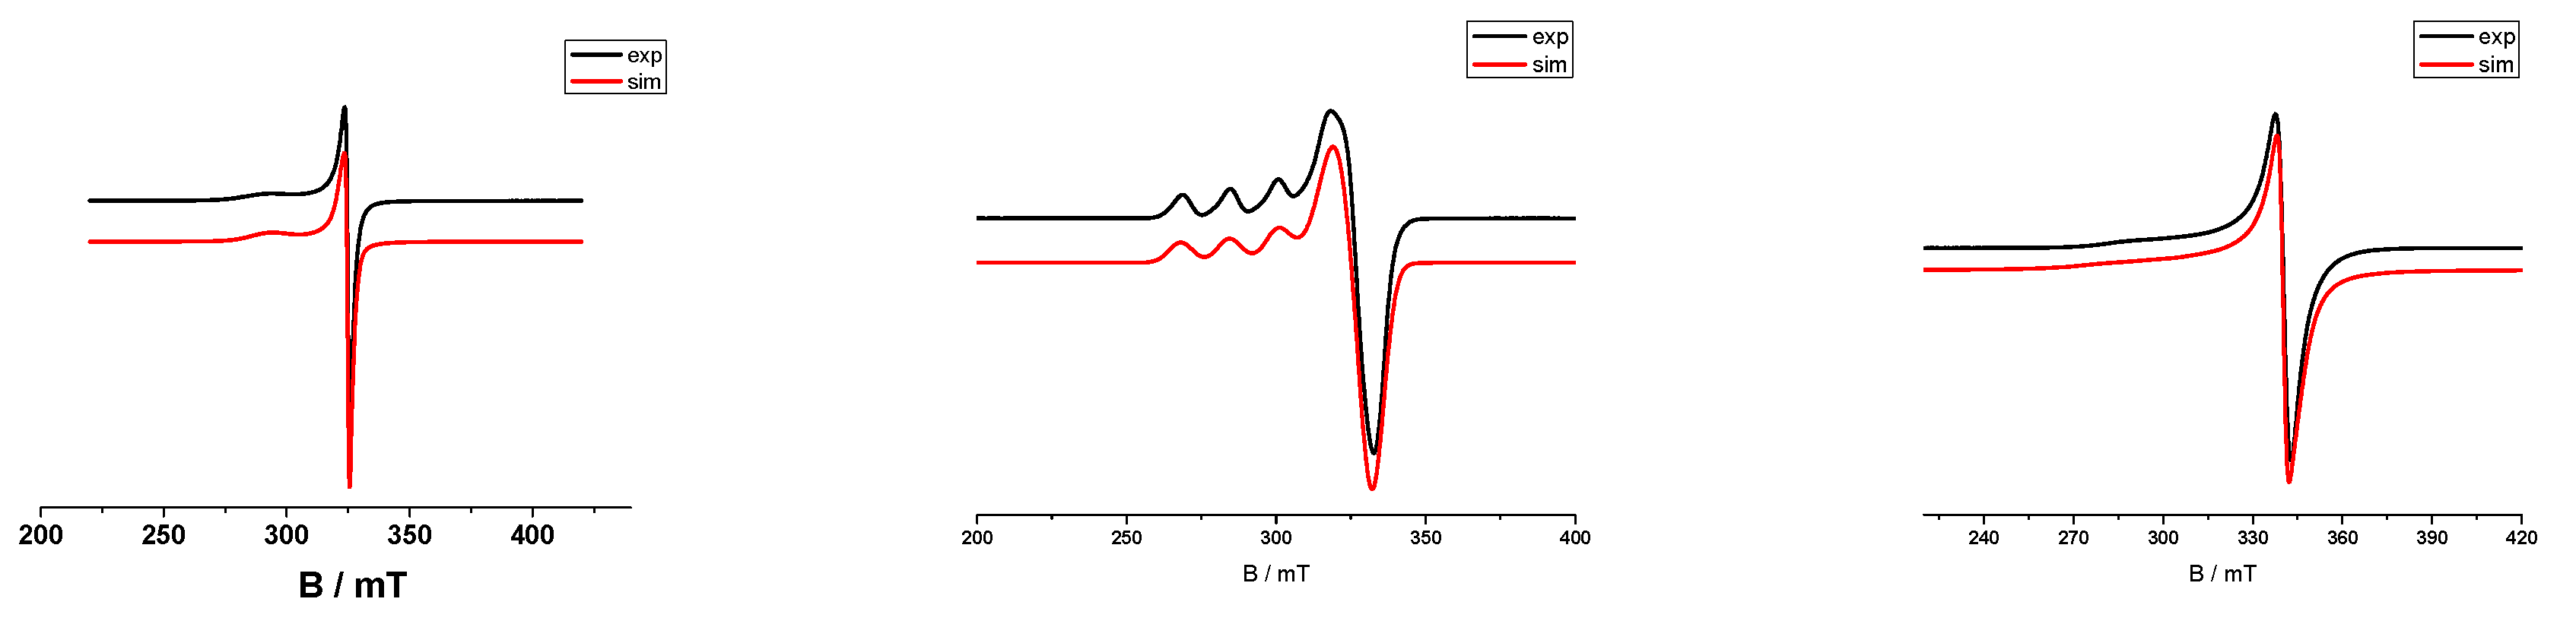
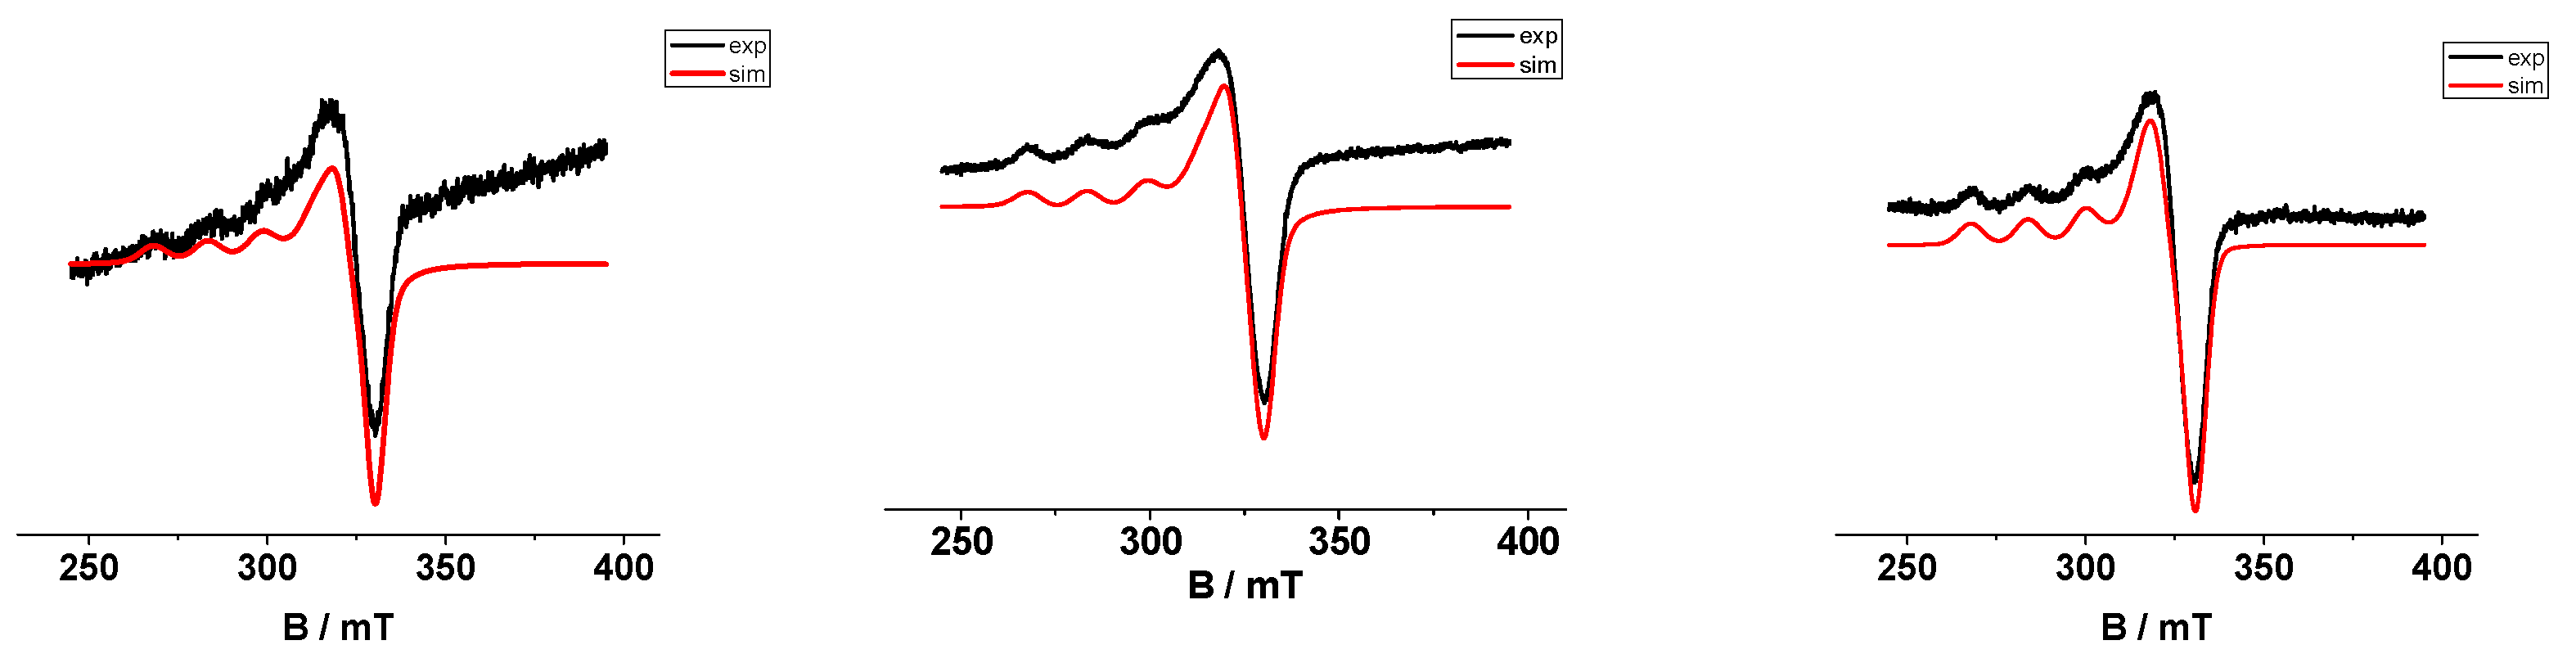
2.5. EPR Spectroscopy
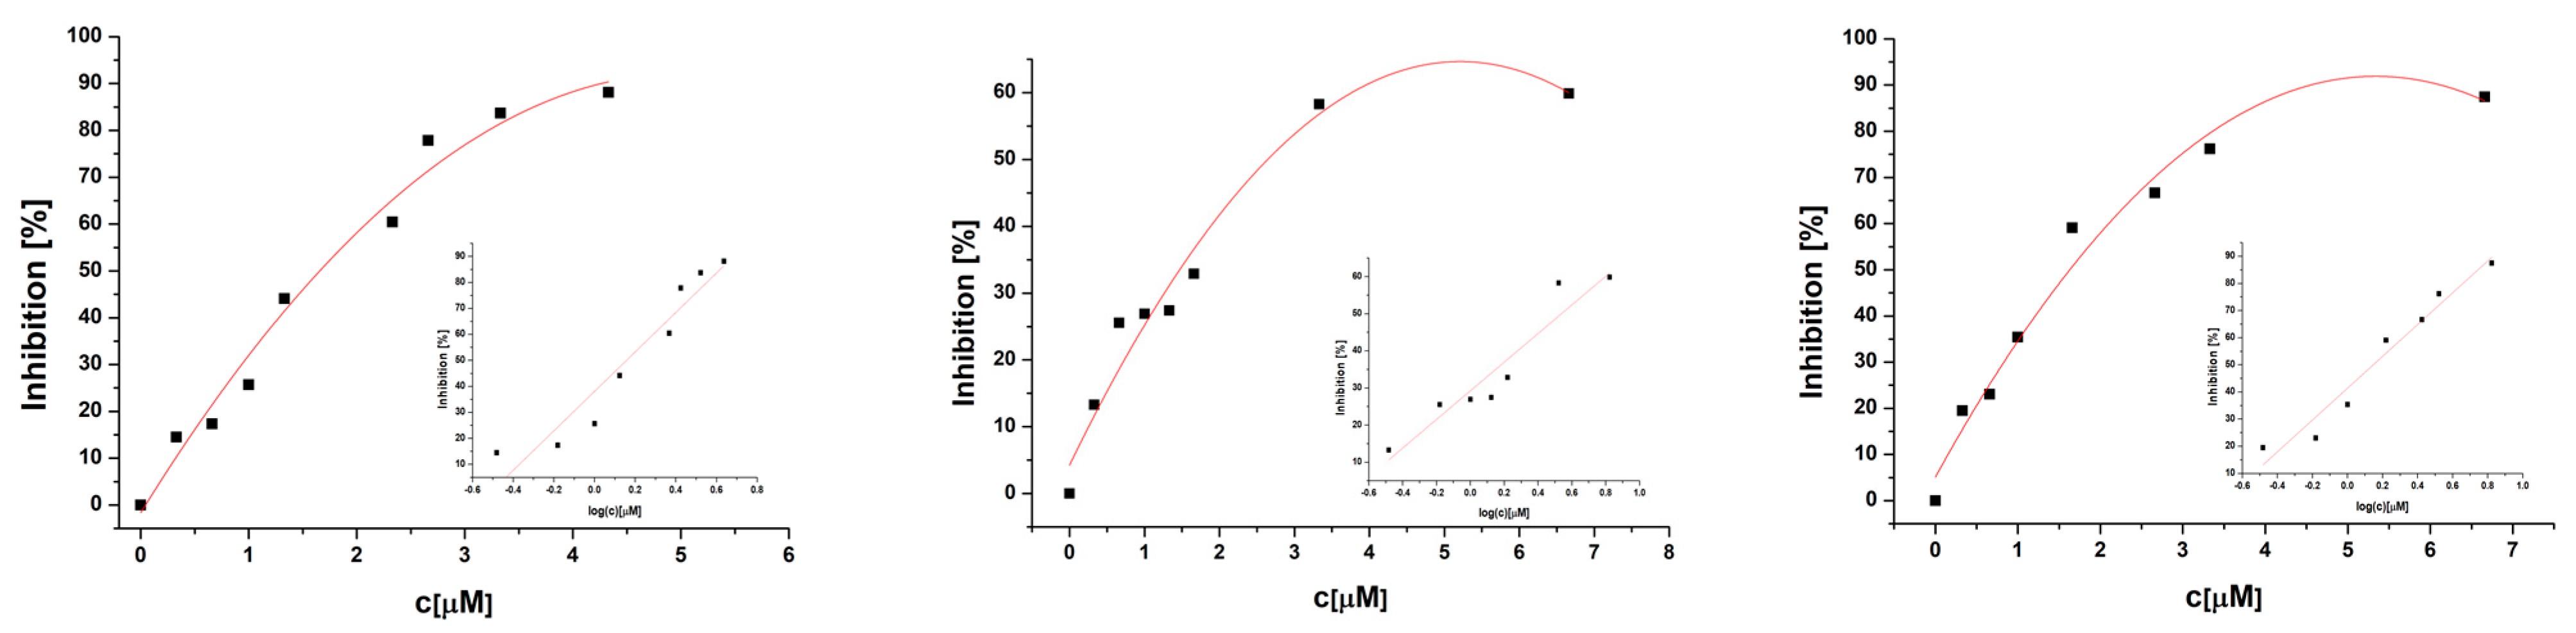
2.6. SOD Mimetic Activity
2.7. Interactions of Complexes with KO2 in the Presence of Neocuproine
2.8. Cyclic Voltammetry
2.9. ct-DNA Interaction Studies
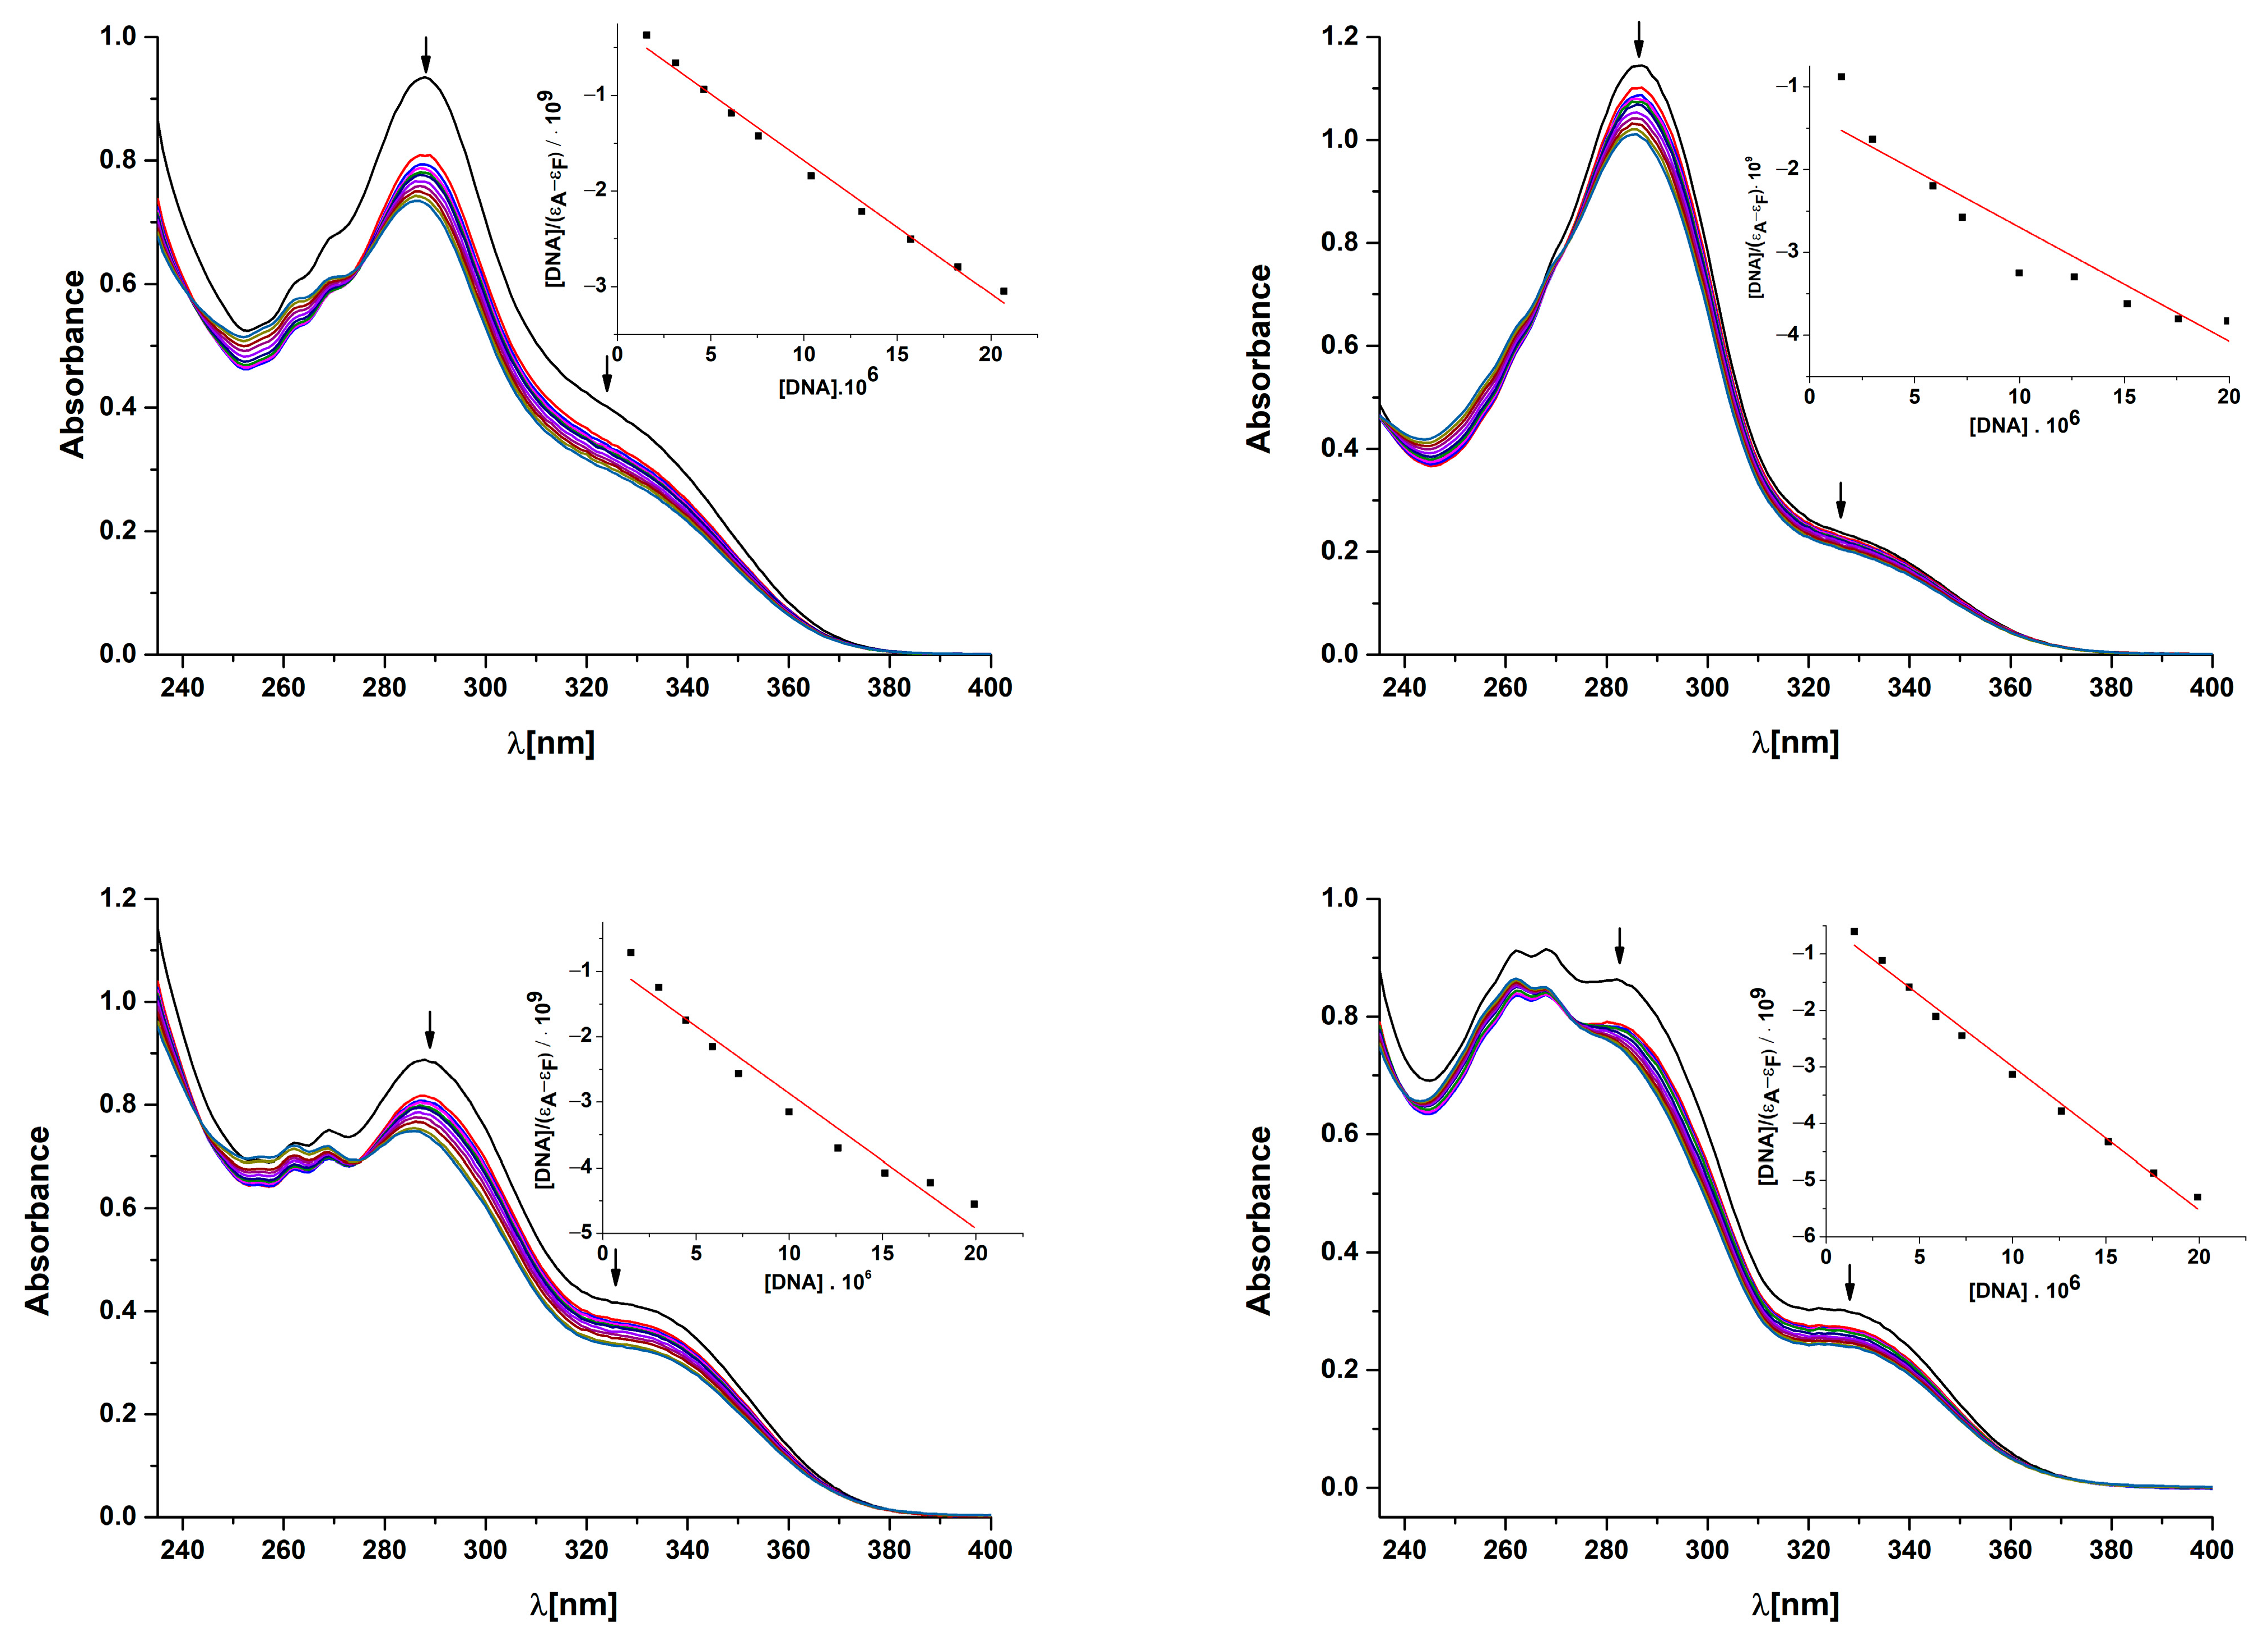
2.9.1. Absorption Titrations
2.9.2. Viscosity Measurements
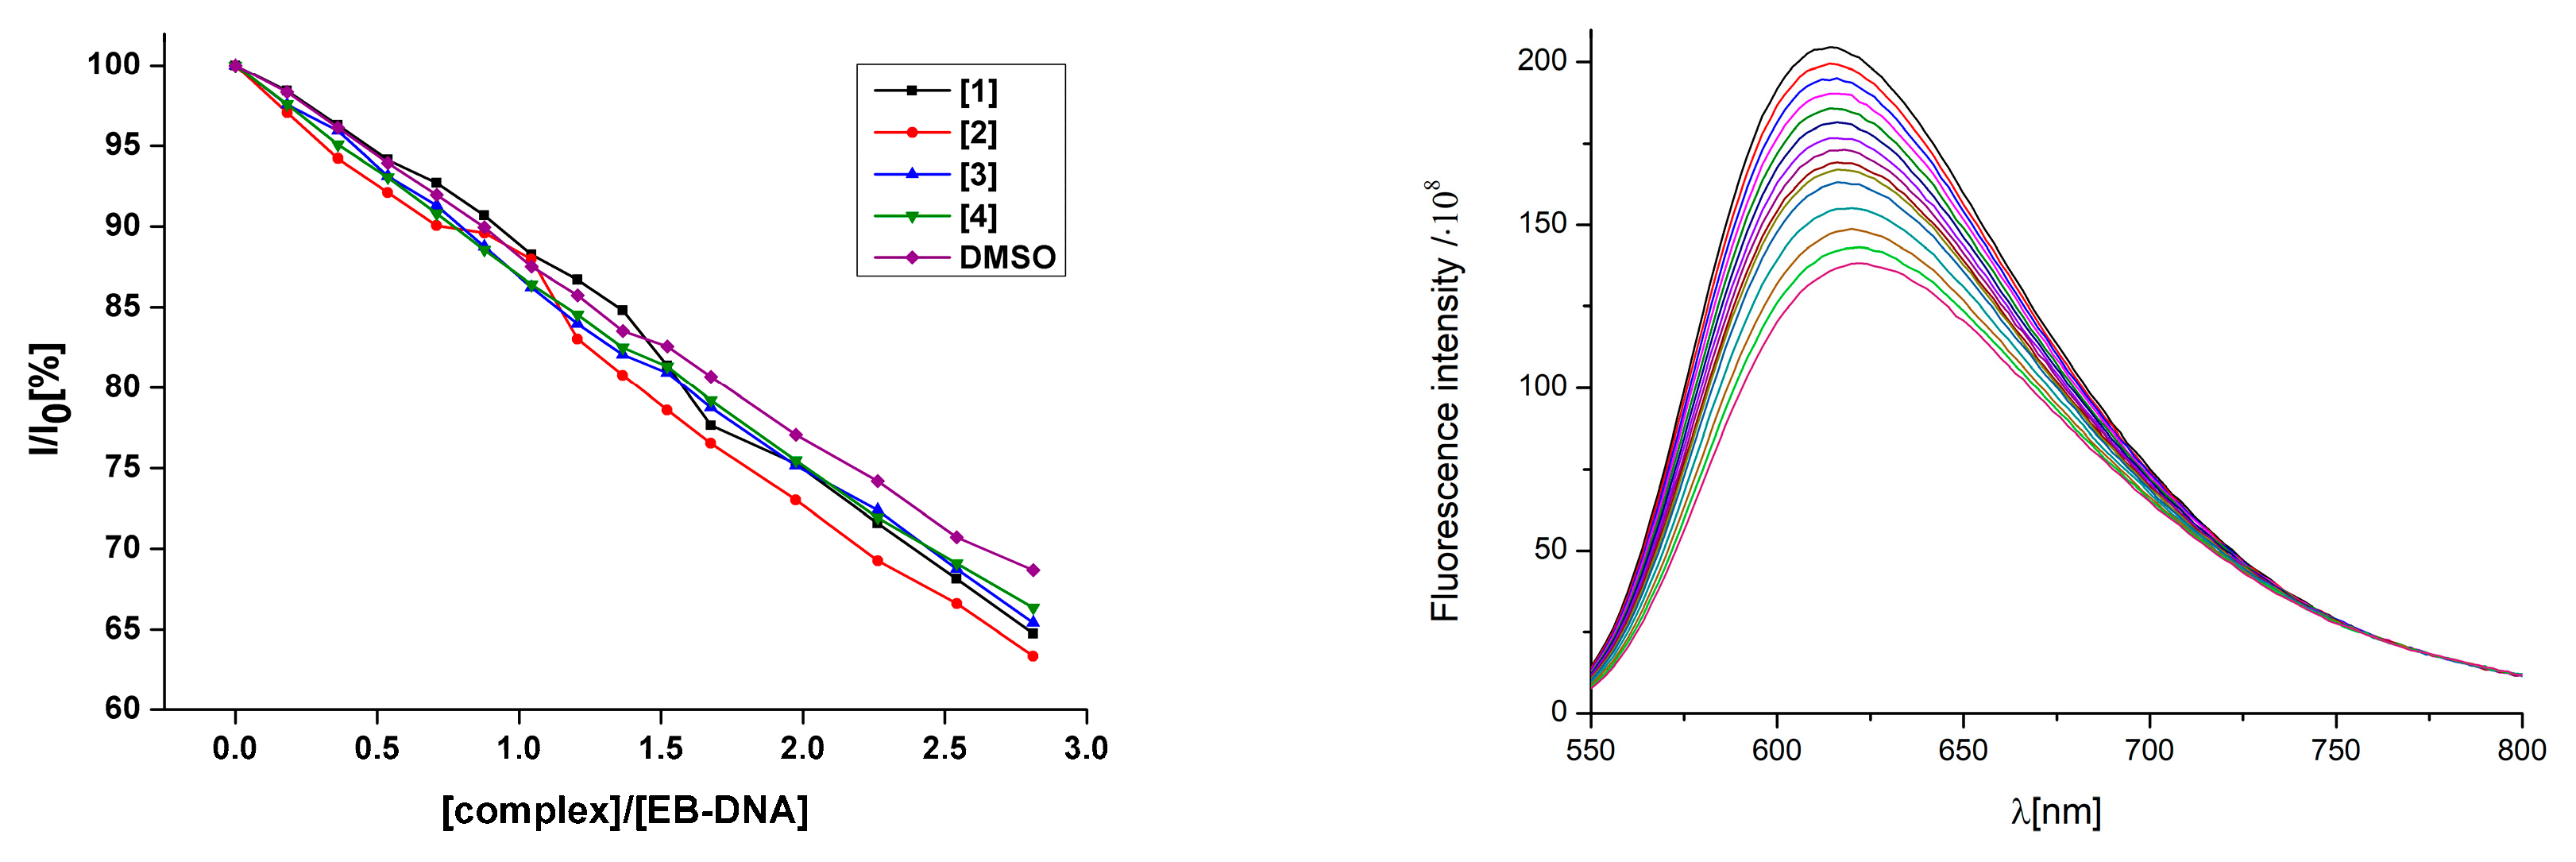
2.9.3. Competitive Studies with EB-DNA
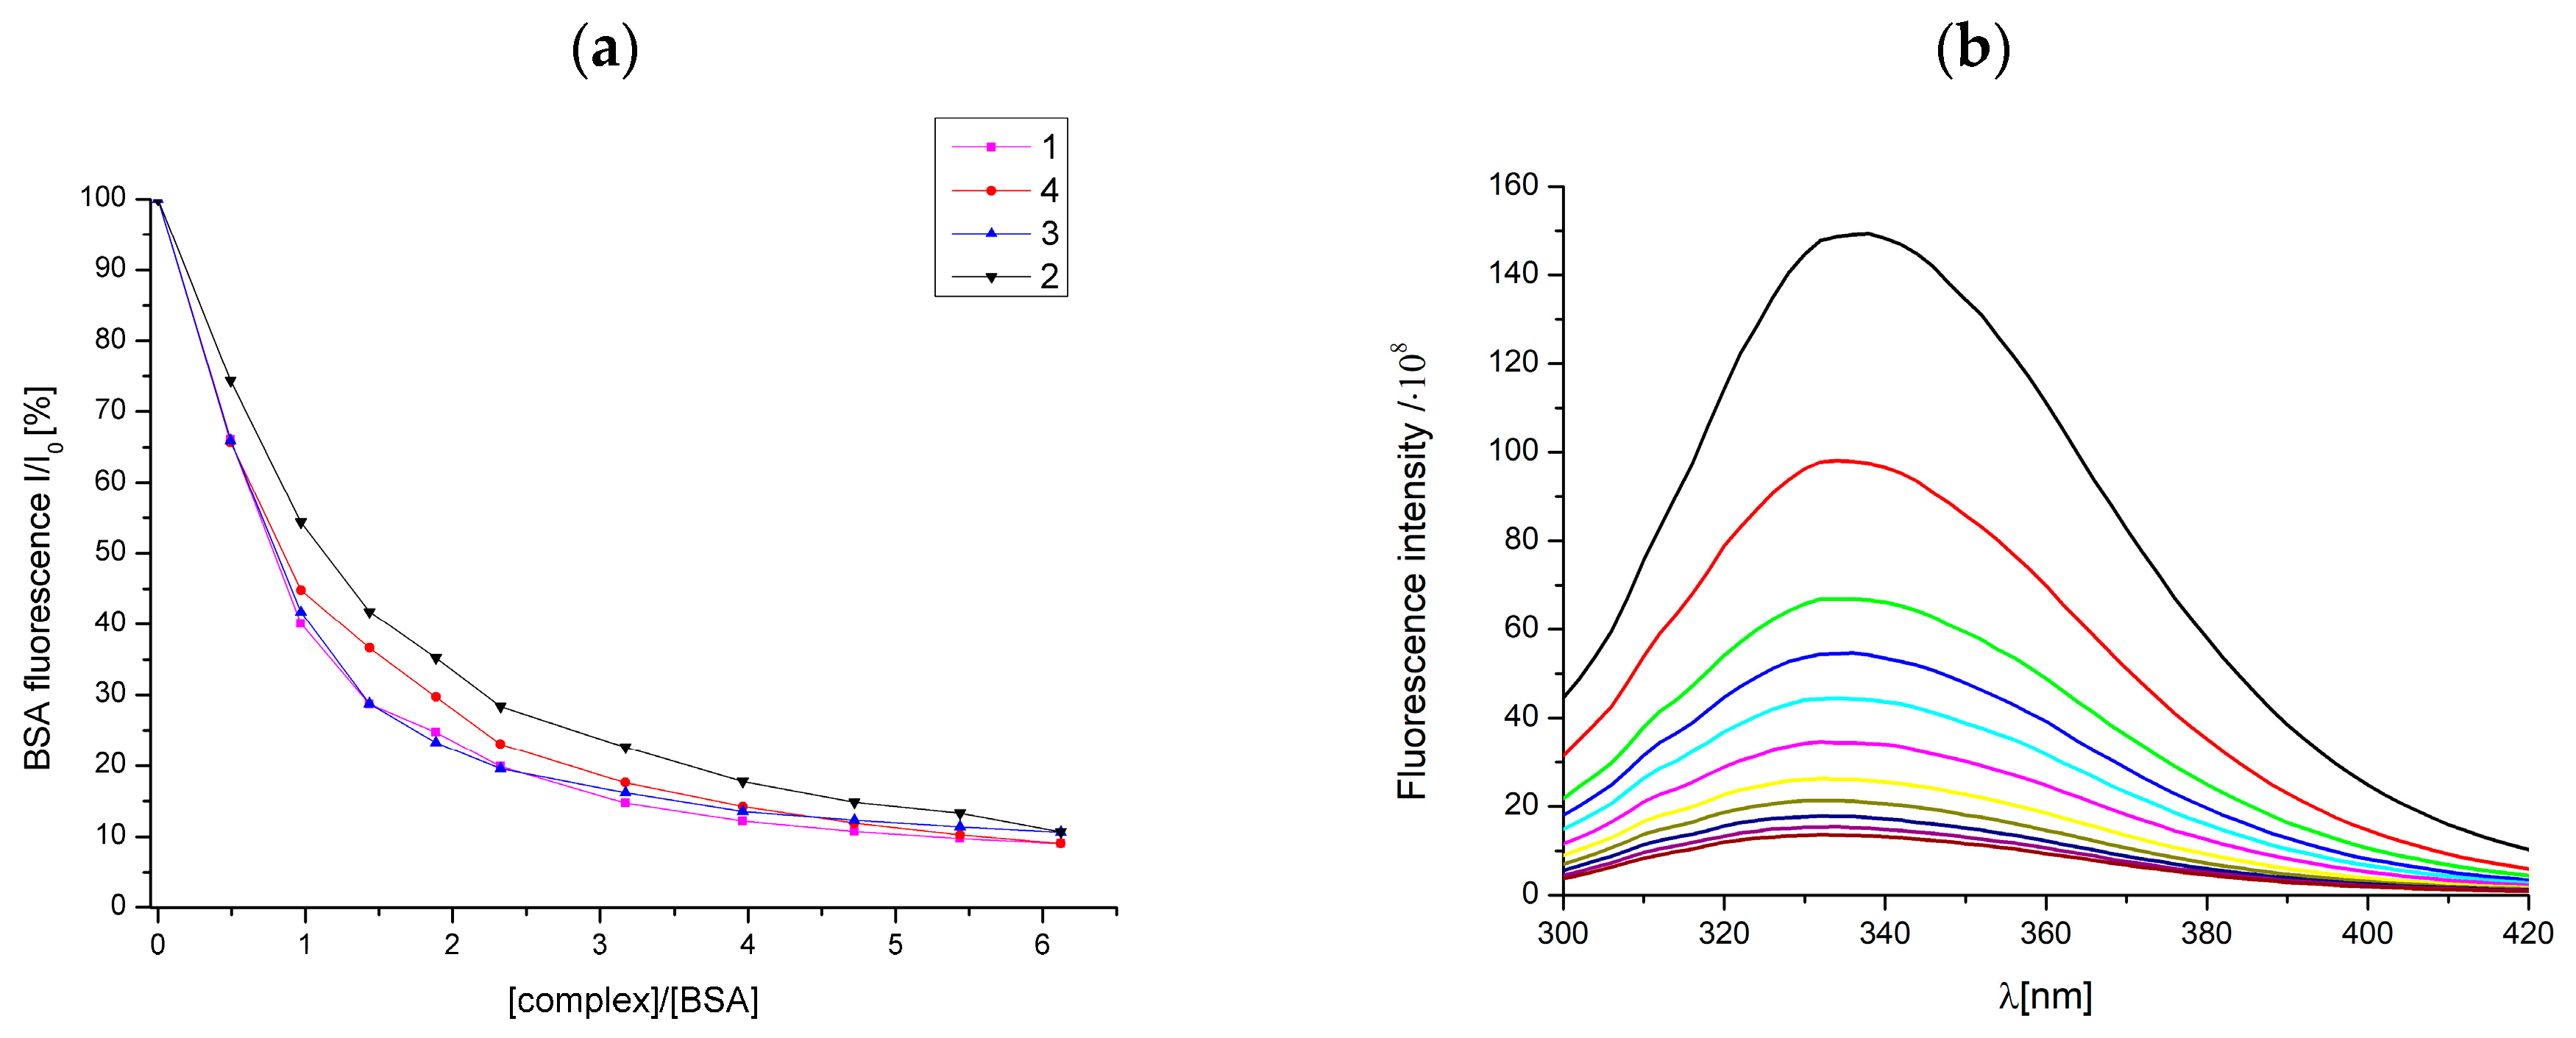
2.10. Interaction of Studied Complexes with BSA
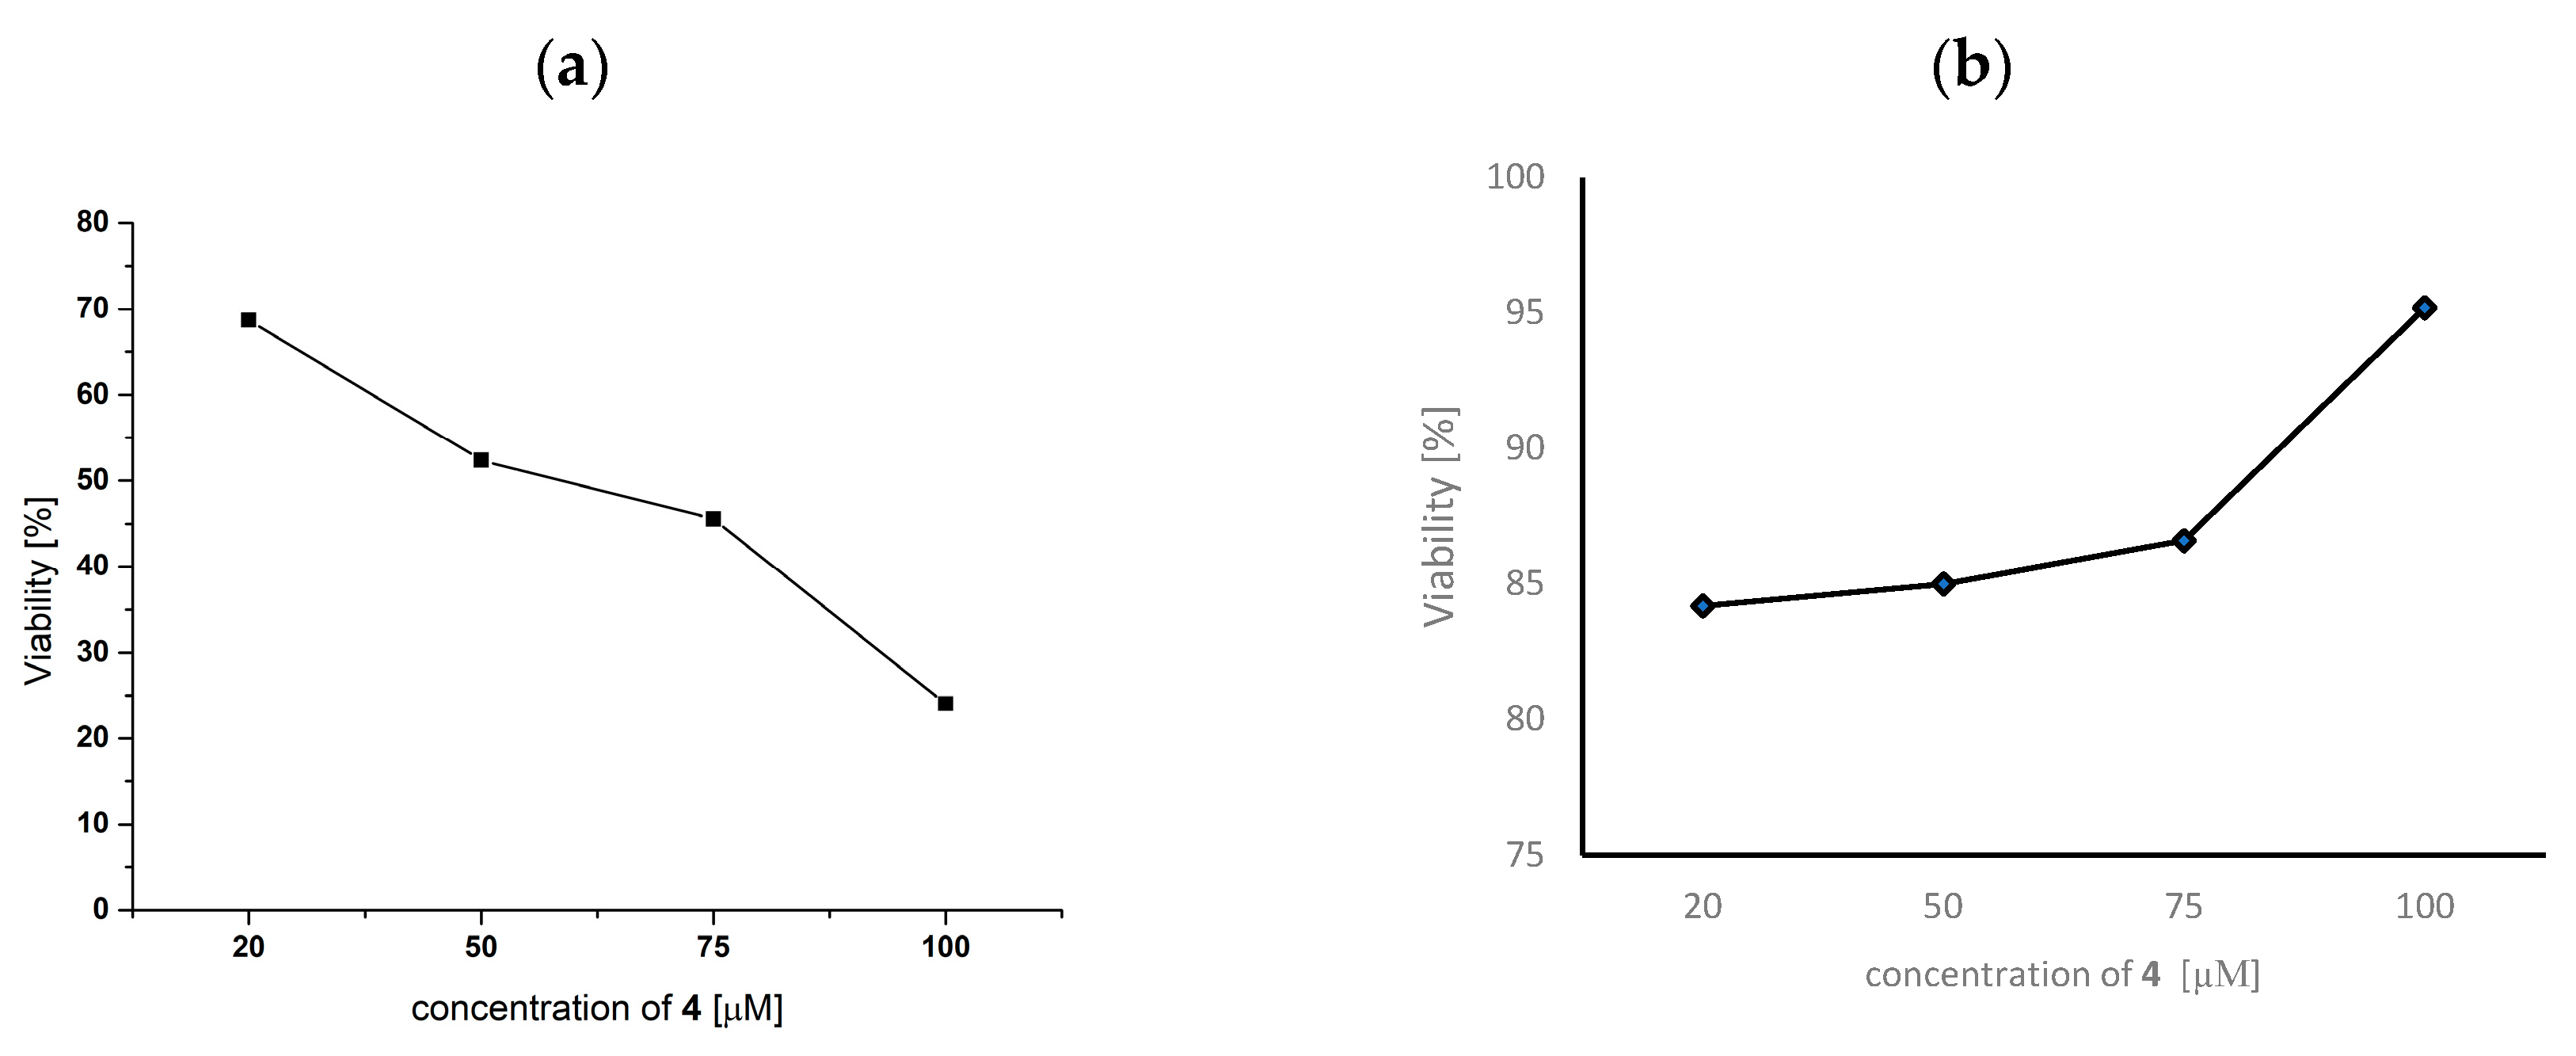
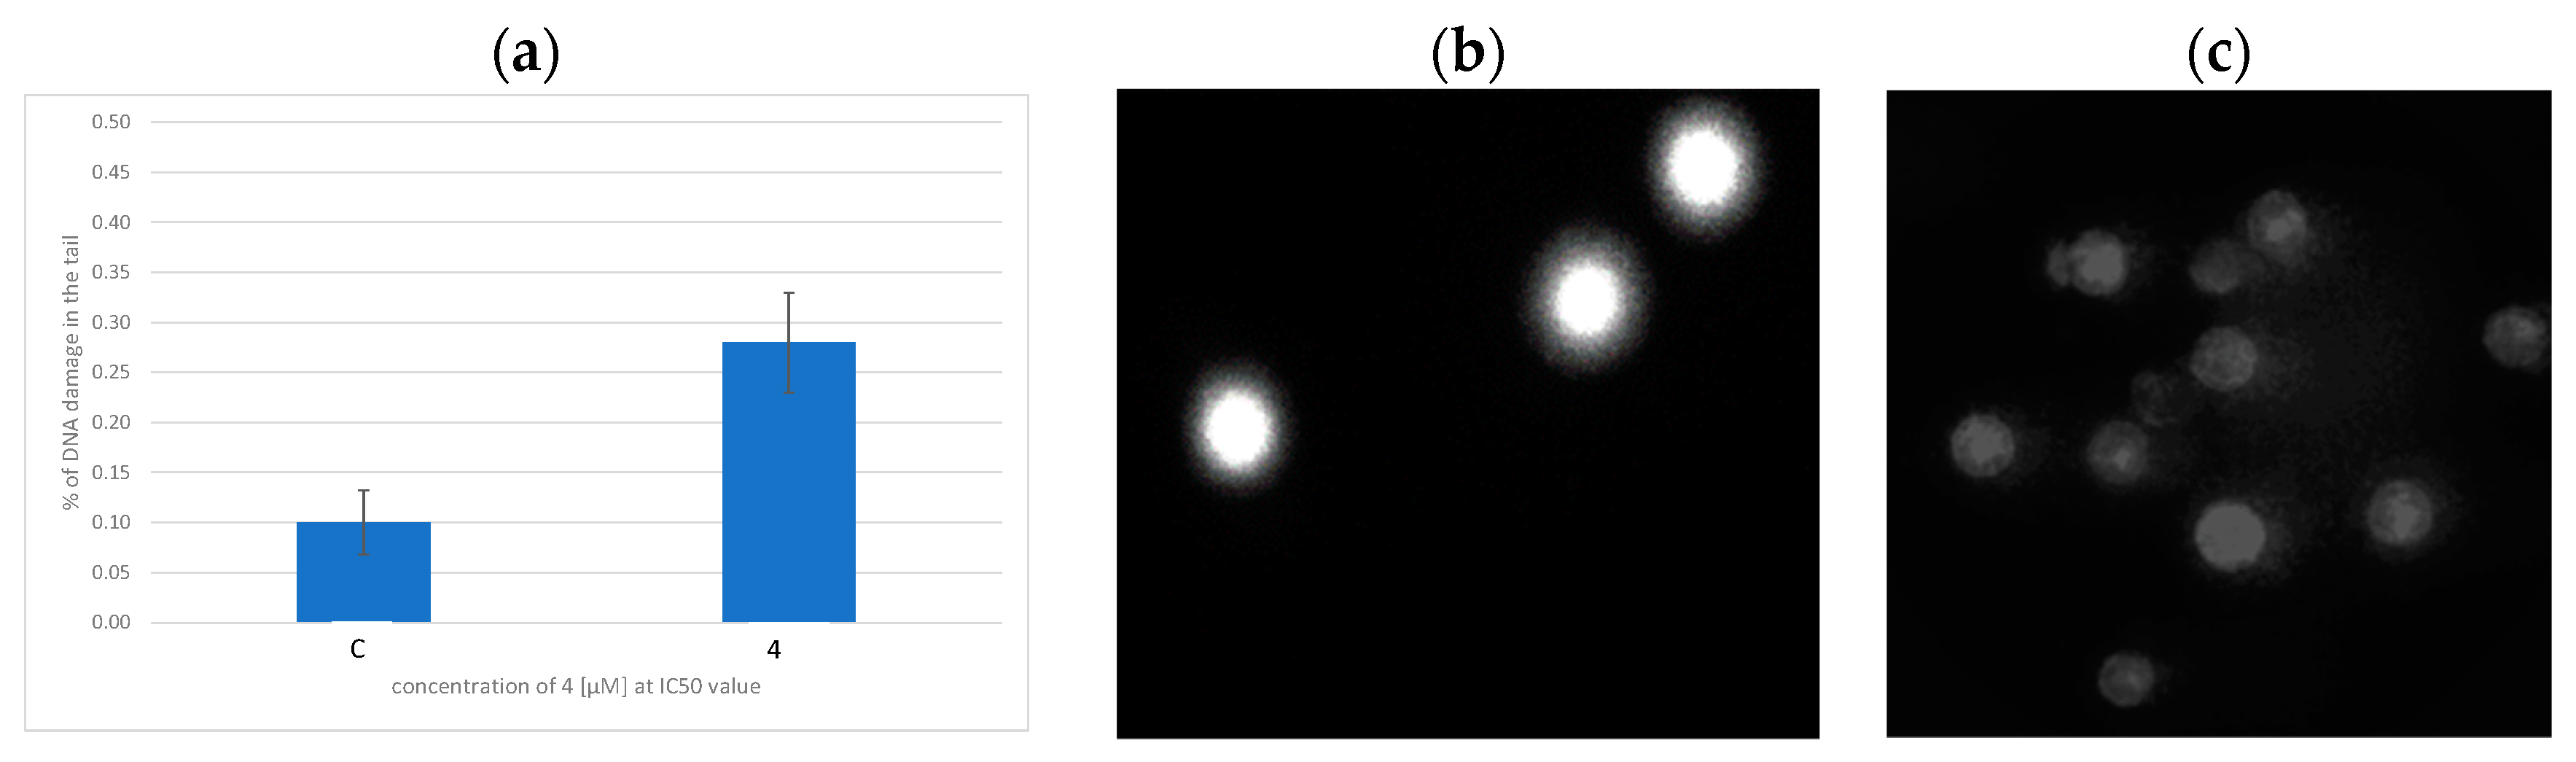
2.11. Anticancer Activity
3. Materials and Methods
3.1. Synthesis
3.2. Physical Measurements
3.3. X-ray Crystallography
3.4. Hirshfeld Surface Analysis
3.5. Electrochemical Study
3.6. Interactions with ct-DNA
3.6.1. Absorption Titrations
3.6.2. Fluorescence Quenching of EB-DNA Adduct
3.6.3. Viscosimetric Studies
3.7. SOD Mimetic Activity
3.8. Bovine Serum Albumin (BSA) Binding Studies
3.9. Anticancer Studies
3.9.1. Cell Culture
3.9.2. Cytotoxic Analysis
3.9.3. Genotoxic Analysis
3.9.4. Statistical Analysis
4. Conclusions
Supplementary Materials
Author Contributions
Funding
Conflicts of Interest
References
- Bindu, S.; Mazumder, S.; Bandyopadhyay, U. Non-steroidal anti-inflammatory drugs (NSAIDs) and organ damage: A current perspective. Biochem. Pharmacol. 2020, 180, 114147. [Google Scholar] [CrossRef] [PubMed]
- Ramos-Inza, S.; Carolina, R.A.; Sanmartin, C.; Sharma, A.K.; Plano, D. NSAIDs: Old Acquaintance in the Pipeline for Cancer Treatment and Prevention-Structural Modulation, Mechanisms of Action, and Bright Future. J. Med. Chem. 2021, 64, 16380–16421. [Google Scholar] [CrossRef]
- Weder, J.E.; Dillon, C.T.; Hambley, T.W.; Kennedy, B.J.; Lay, P.A.; Biffin, J.R.; Regtop, H.L.; Davies, N.M. Copper complexes of non-steroidal anti-inflammatory drugs: An opportunity yet to be realized. Coord. Chem. Rev. 2002, 232, 95–126. [Google Scholar] [CrossRef]
- Matsui, H.; Shimokawa, O.; Kaneko, T.; Nagano, Y.; Rai, K.; Hyodo, L. The pathophysiology of non-steroidal anti-inflammatory drug (NSAID)-induced mucosal injuries in stomach and small intestine. J. Clin. Biochem. Nutr. 2011, 48, 107–111. [Google Scholar] [CrossRef] [PubMed] [Green Version]
- Psomas, G. Copper(II) and zinc(II) coordination compounds of non-steroidal anti-inflammatory drugs: Structural features and antioxidant activity. Coord. Chem. Rev. 2020, 412, 213259. [Google Scholar] [CrossRef]
- Sun, J.-F.; Xu, Y.-J.; Kong, X.-H.; Su, Y.; Wang, Z.-Y. Fenamates inhibit human sodium channel Nav1.7 and Nav1.8. Neurosci. Lett. 2019, 696, 67–73. [Google Scholar] [CrossRef] [PubMed]
- Hill, J.; Zawia, N.H. Fenamates as Potential Therapeutics for Neurodegenerative Disorders. Cells 2021, 10, 702. [Google Scholar] [CrossRef] [PubMed]
- Prasher, P.; Sharma, M. Medicinal chemistry of anthranilic acid derivatives: A mini review. Drug Dev. Res. 2021, 82, 945–958. [Google Scholar] [CrossRef]
- Moncol, J.; Múdra, M.; Lönnecke, P.; Hewitt, M.; Valko, M.; Morris, H.; Švorec, J.; Melnik, M.; Mazúr, M.; Koman, M. Crystal structures and spectroscopic behavior of monomeric, dimeric and polymeric copper(II) chloroacetate adducts with isonicotinamide, N-methylnicotinamide and N,N-diethylnicotinamide. Inorg. Chim. Acta 2007, 360, 3213–3225. [Google Scholar] [CrossRef]
- Choi, H.-E.; Choi, J.-H.; Lee, J.Y.; Kim, J.H.; Kim, J.H.; Lee, J.K.; Kim, G.I.; Park, Y.; Chi, Y.H.; Paik, S.H.; et al. Synthesis and evaluation of nicotinamide derivative as anti-angiogenic agents. Bioorganic Med. Chem. Lett. 2013, 23, 2083–2088. [Google Scholar] [CrossRef]
- Peng, M.; Shi, L.; Ke, S. Nicotinamide-based diamides derivatives as potential cytotoxic agents: Synthesis and biological evaluation. Chem. Cent. J. 2017, 11, 109. [Google Scholar] [CrossRef] [Green Version]
- Banti, C.N.; Hadjikakou, S.K. Non-steroidal anti-inflammatory drugs (NSAIDs) in metal complexes and their effect at the cellular level. Eur. J. Inorg. Chem. 2016, 2016, 3048–3071. [Google Scholar] [CrossRef]
- Khan, H.Y.; Parveen, S.; Yousuf, I.; Tabassum, S.; Arjmand, F. Metal complexes of NSAIDs as potent anti-tumor chemotherapeutics: Mechanistic insights into cytotoxic activity via multiple pathways primarily by inhibition of COX-1 and COX-2 enzymes. Coord. Chem. Rev. 2022, 453, 214316. [Google Scholar] [CrossRef]
- Boodram, J.N.; Mcgregor, I.J.; Bruno, P.M.; Cressey, P.B.; Hemann, M.T.; Suntharalingam, K. Breast Cancer Stem Cell Potent Copper(II)-Non-Steroidal Anti-Inflammatory Drug Complexes. Angew. Chem. Int. Ed. 2016, 55, 2845–2850. [Google Scholar] [CrossRef]
- Eskandari, A.; Boodram, J.N.; Cressey, P.B.; Lu, C.; Bruno, P.M.; Hemann, M.T.; Suntharalingam, K. The breast cancer stem cell potency of copper(II) complexes bearing nonsteroidal anti-inflammatory drugs and their encapsulation using polymeric nanoparticles. Dalton Trans. 2016, 45, 17867–17873. [Google Scholar] [CrossRef] [PubMed] [Green Version]
- Johnson, A.; Iffland-Muhlhaus, L.; Northcote-Smith, J.; Singh, K.; Ortu, F.; Apfel, U.P.; Suntharalingam, K. A bioinspired redox-modulating copper(II)-macrocyclic complex bearing non-steroidal anti-inflammatory drugs with anti-cancer stem cell activity. Dalton Trans. 2022, 51, 5904–5912. [Google Scholar] [CrossRef] [PubMed]
- Zehra, S.; Tabassum, S.; Arjmand, F. Biochemical pathways of copper complexes: Progress over the past 5 years. Drug Discov. Today 2021, 26, 1086–1096. [Google Scholar] [CrossRef]
- Kumar, S.; Sharma, R.P.; Venugopalan, P.; Ferretti, V.; Tarpin, M.; Sayen, S.; Guillon, E. New copper(II) niflumate complexes with N-donor ligands: Synthesis, characterization and evaluation of anticancer potentional against human cell lines. Inorg. Chim. Acta 2019, 488, 260–268. [Google Scholar] [CrossRef]
- Khan, H.Y.; Zehra, S.; Parveen, S.; Yousuf, I.; Tabassum, S.; Arjmand, F. New ionic Cu(II) and Co(II) DACH-flufenamate conjugate complexes: Spectroscopic characterization, single X-ray studies and cytotoxic activity on human cancer cell lines. ChemistrySelect 2018, 3, 12764–12772. [Google Scholar] [CrossRef]
- Nnabuike, G.G.; Salunke-Gawali, S.; Patil, A.S.; Butcher, R.J.; Obaleye, J.A.; Ashtekar, H.; Prakash, B. Copper(II) complexes containing derivative of aminobenzoic acid and nitrogen-rich ligans: Synthesis, characterization and cytotoxic potential. J. Mol. Struct. 2023, 1279, 135002. [Google Scholar] [CrossRef]
- Malis, G.; Geromichalou, E.; Geromichalos, G.D.; Hatzidimitriou, A.G.; Psomas, G. Copper(II) complexes with non-steroidal anti-inflammatory drugs: Structural characterization, in vitro and in silico biological profile. J. Inorg. Biochem. 2021, 224, 111563. [Google Scholar] [CrossRef] [PubMed]
- Sharma, R.P.; Kumar, S.; Venugopalan, P.; Ferretti, V.; Tarushi, A.; Psomas, G.; Witwicki, M. New copper(II) complexes of anti-inflammatory drug mefenamic acid: A concerted study including synthesis, physicochemical characterization and their biological evaluation. RSC Adv. 2016, 6, 88546–88558. [Google Scholar] [CrossRef]
- Tolia, C.; Papadopoulos, A.N.; Raptopoulou, C.P.; Psycharis, V.; Garino, C.; Salassa, L.; Psomas, G. Copper(II) interacting with non-steroidal antiinflammatory drug flufenamic acid: Structure, antioxidant activity and binding to DNA and albumins. J. Inorg. Biochem. 2013, 123, 53–65. [Google Scholar] [CrossRef]
- Dimiza, F.; Fountoulaki, S.; Papadopoulos, A.N.; Kontogiorgis, C.A.; Tangoulis, V.; Raptopoulou, C.P.; Psycharis, V.; Terzis, A.; Kessissoglou, D.P.; Psomas, G. Non-steroidal antiinflammatory drug-copper(II) complexes: Structure and biological perpectives. Dalton Trans. 2011, 40, 8555–8568. [Google Scholar] [CrossRef]
- Barmpa, A.; Perontsis, S.; Hatzidimitriou, A.G.; Psomas, G. Copper(II) complexes with meclofenamate ligands: Structure, interaction with DNA and albumins, antioxidant and anticholinergic activity. J. Inorg. Biochem. 2011, 217, 111357. [Google Scholar] [CrossRef]
- Tarushi, A.; Perontsis, S.; Hatzidimitriou, A.G.; Papadopoulos, A.N.; Kessissoglou, D.P.; Psomas, G. Copper(II) complexes with the non-steroidal anti-inflammatory drug tolfenamic acid: Structure and biological features. J. Inorg. Biochem. 2015, 149, 68–79. [Google Scholar] [CrossRef] [PubMed]
- Simunkova, M.; Lauro, P.; Jomova, K.; Hudecova, L.; Danko, M.; Alwasel, S.; Alhazza, I.M.; Rajcaniova, S.; Kozovska, Z.; Kucerova, L.; et al. Redox-cycling and intercalating properties of novel mixed copper(II) complexes with non-steroidal anti-inflammatory drugs tolfenamic, mefenamic and flufenamic acids and phenanthroline functionality: Structure, SOD-mimetic activity, interaction with albumin, DNA damage study and anticancer activity. J. Inorg. Biochem. 2019, 194, 97–113. [Google Scholar] [CrossRef]
- Jozefíková, F.; Perontsis, S.; Koňáriková, K.; Švorc, Ľ.; Mazúr, M.; Psomas, G.; Moncol, J. In vitro biological activity of copper(II) complexes with NSAIDs and nicotinamide: Characterization, DNA- and BSA-interaction study and anticancer activity. J. Inorg. Biochem. 2022, 228, 111696. [Google Scholar] [CrossRef]
- Jozefíková, F.; Perontsis, S.; Šimunková, M.; Barbieriková, Z.; Švorc, Ľ.; Valko, M.; Psomas, G.; Moncol, J. Novel copper(II) complexes with fenamates and isonicotinamide: Structure and properties, and interactions with DNA and serum albumin. New J. Chem. 2020, 44, 12827–12842. [Google Scholar] [CrossRef]
- Melník, M.; Potočňak, I.; Macášková, Ľ.; Mikloš, D.; Holloway, C.E. Spectral study of copper(II) flufenamates: Crystal and molecular structure of bis(flufenamato)di(N,N-diethylnicotinamide)di(aqua)copper(II). Polyhedron 1996, 15, 2159–2164. [Google Scholar] [CrossRef]
- Švorec, J.; Lörinc, Š.; Moncol, J.; Melník, M.; Koman, M. Structural and spectroscopic characterization of copper(II) tolfenamate complexes. Transit. Met. Chem. 2009, 34, 703–710. [Google Scholar] [CrossRef]
- Melník, M.; Koman, M.; Macášková, Ľ.; Glowiak, T. Spectral and magnetic properties of copper(II) mefenamates: Crystal and molecular structure of bis(mefenamato)di(N,N-diethylnicotinamide)di(aqua)copper(II). J. Coord. Chem. 1998, 44, 163–172. [Google Scholar] [CrossRef]
- Koman, M.; Melník, M.; Glowiak, T. Structure, spectral and magnetic behaviours of copper(niflumato)2(N,N-diethylnicotinamide)2. J. Coord. Chem. 1998, 44, 133–139. [Google Scholar] [CrossRef]
- Nakamoto, K. Infrared and Raman Spectra of Inorganic and Coordination Compounds, Part B, 6th ed.; John Wiley and Sons, Inc.: Hoboken, NJ, USA, 2009; pp. 1–199. [Google Scholar]
- Hathaway, B.J.; Billing, D.E. The electronic properties and stereochemistry of mono-nuclear complexes of the copper(II) ion. Coord. Chem. Rev. 1970, 5, 143. [Google Scholar] [CrossRef]
- Moncol, J.; Mudra, M.; Lönnecke, P.; Koman, M.; Melník, M. Copper(II) halogenopropionates: Low-temperature crystal and molecular structure of bis(2,2-dichloropropionato)-di(methyl-3-pyridylcarbamate)copper(II) and bis(2-bromopropionato)- di(2-pyridylmethanol)copper(II). J. Coord. Chem. 2004, 57, 1065–1078. [Google Scholar] [CrossRef]
- Korabik, M.; Repická, Z.; Martiška, L.; Moncol, J.; Švorec, J.; Padelkova, Z.; Lis, T.; Mazur, M.; Valigura, D. Hydrogen-Bond-Based Magnetic Exchange Between mu-Diethylnicotinamide(aqua)bis(X-salicylato)copper(II) Polymeric Chains. Z. Anorg. Allg. Chem. 2011, 637, 224–231. [Google Scholar] [CrossRef]
- Spackman, M.A.; Jayalitaka, D. Hirshfeld surface analysis. CrystEngComm 2009, 11, 19–32. [Google Scholar] [CrossRef]
- Spackman, M.A.; McKinnon, J.J. Fingerprinting intermolecular interactions in molecular crystals. CrystEngComm 2002, 4, 378–392. [Google Scholar] [CrossRef]
- Sakaguchi, U.; Addison, A.W. Spectroscopic and redocx studies of some copper (II) ccomplexes with biomimetic donor atoms – Implication for protein copper centers. J. Chem. Soc. Dalton Trans. 1979, 600–608. [Google Scholar] [CrossRef]
- Puchonova, M.; Švorec, J.; Švorc, L.; Pavlik, J.; Mazur, M.; Dlhan, L.; Ruzickova, Z.; Moncol’, J.; Valigura, D. Synthesis, spectral, magnetic properties, electrochemical evaluation and SOD mimetic activity of four mixed-ligand Cu(II) complexes. Inorg. Chim. Acta 2017, 455, 298–306. [Google Scholar] [CrossRef]
- Kovala-Demertzi, D.; Galani, A.; Demertzis, M.A.; Skoulika, S.; Kotoglou, C. Binuclear copper(II) complexes of tolfenamic: Synthesis, crystal structure, spectroscopy and superoxide dismutase activity. J. Inorg. Biochem. 2004, 98, 358–364. [Google Scholar] [CrossRef] [PubMed]
- Sheng, Y.; Abreu, I.A.; Cabelli, D.E.; Maroney, M.J.; Miller, A.; Teixeira, M.; Valentine, J.S. Superoxide Dismutases and Superoxide Reductases. Chem. Rev. 2014, 114, 3854–3918. [Google Scholar] [CrossRef] [PubMed]
- Brezova, V.; Valko, M.; Breza, M.; Morris, H.; Telser, J.; Dvoranova, D.; Kaiserova, K.; Varecka, L.; Mazur, M.; Leibfritz, D. Role of radicals and singlet oxygen in photoactivated DNA cleavage by the anticancer drug camptothecin: An electron paramagnetic resonance study. J. Phys. Chem. B 2003, 107, 2415–2425. [Google Scholar] [CrossRef]
- Santini, C.; Pellei, M.; Gandin, V.; Porchia, M.; Tisato, F.; Marzano, C. Advances in Copper Complexes as Anticancer Agents. Chem. Rev. 2014, 114, 815–862. [Google Scholar] [CrossRef]
- Erxleben, A. Interactions of copper complexes with nucleic acids. Coord. Chem. Rev. 2018, 360, 92–121. [Google Scholar] [CrossRef]
- Andrezalova, L.; Orszaghova, Z. Covalent and noncovalent interactions of coordination compounds with DNA: An overview. J. Inorg. Biochem. 2021, 225, 111624. [Google Scholar] [CrossRef]
- Sirajuddin, M.; Ali, S.; Badshah, A. Drug-DNA interactions and their study by UV-Visible, fluorescence spectroscopies and cyclic voltametry. J. Photochem. Photobiol. B Biol. 2013, 124, 1–19. [Google Scholar] [CrossRef]
- Smolkova, R.; Smolko, L.; Samol’ova, E.; Dusek, M. Co(II) fenamato, tolfenamato and niflumato complexes with neocuproine: Synthesis, crystal structure, spectral characterization and biological activity. J. Mol. Struct. 2023, 1272, 134172. [Google Scholar] [CrossRef]
- Arkel, Y.S.; Schrogie, J.J.; Williams, R. Effect of clonixin and aspirin on platelet-aggregation in human volunteers. J. Clin. Pharmacol. 1976, 16, 30–33. [Google Scholar] [CrossRef]
- Spector, D.; Krasnovskaya, O.; Pavlov, K.; Erofeev, A.; Gorelkin, P.; Beloglazkina, E.; Majouga, A. Pt(IV) Prodrugs with NSAIDs as Axial Ligands. Int. J. Mol. Sci. 2021, 22, 3817. [Google Scholar] [CrossRef]
- Ozarowski Andrzej, Spin Software (SpinP.exe). Available online: https://nationalmaglab.org/user-facilities/emr/software/ (accessed on 5 January 2016).
- Kožišková, J.; Hahn, F.; Richter, J.; Kožišek, J. Comparison of different absorption corrections on the model structure of tetrakis(μ2-acetato)-diaqua-di-copper(II). Acta Chim. Slovaca 2016, 9, 136–146. [Google Scholar] [CrossRef] [Green Version]
- Sheldrick, G.M. SHELXT—Integrated space-group and crystal-structure determination. Acta Crystallogr. A 2015, 71, 3–8. [Google Scholar] [CrossRef] [PubMed] [Green Version]
- Palatinus, L.; Chapuis, G. SUPERFLIP—A computer program for the solution of crystal structures by charge flipping in arbitrary dimensions. J. Appl. Crystallogr. 2007, 40, 786–790. [Google Scholar] [CrossRef] [Green Version]
- Burla, M.C.; Caliandro, R.; Carrozzini, B.; Cascarano, G.L.; Cuocci, C.; Giacovazzo, C.; Mallamo, M.; Mazzone, A.; Polidori, G.G. Crystal structure determination and refinement via SIR2014. J. Appl. Crystallogr. 2015, 48, 306–309. [Google Scholar] [CrossRef]
- Sheldrick, G.M. Crystal structure refinement with SHELXL. Acta Crystallogr. C 2015, 71, 3–8. [Google Scholar] [CrossRef] [Green Version]
- Neese, F. Software update the ORCA program system, version 4.0. WIREs Comput. Mol. Sci. 2018, 8e, 1327. [Google Scholar] [CrossRef]
- Balabanov, N.B.; Peterson, K.A. Systematically convergent basis sets for transition metals. I. All-electron correlation consistent basis sets for the 3d elements Sc-Zn. J. Chem. Phys. 2005, 123, 064107. [Google Scholar] [CrossRef] [Green Version]
- Adamo, C.; Barone, V. Toward reliable density functional methods without adjustable parameters: PBE0 model. J. Chem. Phys. 1999, 110, 6158–6170. [Google Scholar] [CrossRef]
- Bourhis, L.J.; Dolomanov, O.V.; Gildea, R.J.; Howard, J.A.K.; Puschmann, H. The anatomy of a comprehensive constrained, restrained refinement program for the modern computing environment—Olex2 dissected. Acta Crystallogr. A 2015, 71, 59–75. [Google Scholar] [CrossRef] [Green Version]
- Kleemiss, F.; Dolomanov, O.V.; Bodensteiner, M.; Peyerimhoff, N.; Midgley, L.; Bourhis, L.J.; Genoni, A.; Malaspina, L.A.; Jayatilaka, D.; Spencer, J.L.; et al. Accurate crystal structures and chemical properties from NoSpherA2. Chem. Sci. 2021, 12, 1675–1692. [Google Scholar] [CrossRef]
- Dolomanov, O.V.; Bourhis, L.J.; Gildea, R.J.; Howard, J.A.K.; Puschmann, H. OLEX2: A complete structure solution, refinement and analysis program. J. Appl. Crystallogr. 2009, 42, 339–341. [Google Scholar] [CrossRef]
- Spackman, P.R.; Turner, M.J.; McKinnon, J.J.; Wolff, S.K.; Grimwood, D.J.; Jayatilaka, D.; Spackman, M.A. CrystalExplorer: A program for Hirshfeld surface analysis, visualization and quantitative analysis of molecular crystals. J. Appl. Crystallogr. 2021, 54, 1006–1011. [Google Scholar] [CrossRef]
- Hirshfeld, F.L. Bonded-atom fragments for describing molecular charge densities. Theor. Chim. Acta 1977, 44, 129–138. [Google Scholar] [CrossRef]
- Parkin, A.; Barr, G.; Dong, W.; Gilmore, C.J.; Jayalitaka, D.; McKinnon, J.J.; Spackman, M.A.; Wilson, C.C. Comparing entire crystal structures: Structural genetic fingerprinting. CrystEngComm 2007, 9, 648–652. [Google Scholar] [CrossRef]
- Wolfe, A.; Shimer, G.H., Jr.; Meehan, T. Polycyclic aromatic hydrocarbons physically intercalate into duplex regions of denatured DNA. Biochemistry 1987, 26, 6392–6396. [Google Scholar] [CrossRef] [PubMed]
- Pyle, A.M.; Rehmann, J.P.; Meshoyrer, R.; Kumar, C.V.; Turro, N.J.; Barton, J.K. Mixed-ligand complexes of ruthenium(II)—Factors governing binding to DNA. J. Am. Chem. Soc. 1989, 111, 3051–3058. [Google Scholar] [CrossRef]
- Carmichael, J.; Degraff, W.G.; Gazdar, A.F.; Minna, J.D.; Mitchell, J.B. Evaluation of a tetrazolium-based semiautomated coloimetric assay—Assesament of chemosensitivity testing. Cancer Res. 1987, 47, 936–942. [Google Scholar]
- Collins, A.R.; Dobson, V.L.; Dusinska, M.; Kennedy, G.; Stetina, R. Comet assay: What can it really tell us? Mutat. Res. 1997, 375, 183–193. [Google Scholar] [CrossRef]


| Complex | ῦ(O−H) | ῦas(COO−) | ῦs(COO−) | Δ | ῦ(C=O) | ῦ(C=N) | λ(d-d) a | λ(d-d) b |
|---|---|---|---|---|---|---|---|---|
| 1 | 3057m 3324w | 1619s c 1606s c | 1378vs | 241 228 | 1619s c | 1581s 1568s | 646br | 795br |
| 2 | - | 1595s c 1582s c | 1387s 1368s | 227/208 214/195 | 1629s | 1595s c 1582s c | 539br 615sh | 791br |
| 3 | 3458m,br 3206m,br | 1613vs c | 1377vs | 236 | 1613s c | 1579s 1557s | 628br | 789br |
| 4 | - | 1602s c 1585vs c | 1380s 1358vs | 244/222 227/205 | 1629s | 1602s c 1585s c | 529br 612sh | 794br |
| 5 | 3473m,br 3217m,br | 1612vs c | 1376vs | 236 | 1612s c | 1575s 1561s | 600br | 801br |
| 1 i | 3 ii | 5 ii | |
| Cu1–O1 | 1.9726(9) | 1.9465(5) | 1.9475(7) |
| Cu1–N1 | 2.0149(11) | 2.0345(6) | 2.0364(9) |
| Cu1–O1W | 2.4356(11) | 2.4827(5) | 2.4879(4) |
| 2 iii | 4 iv | ||
| Cu1–O1 | 1.9502(6) | 1.9296(9) | |
| Cu1–N1 | 2.0086(7) | 2.0170(12) | |
| Cu1–O2 | 2.6467(11) | 2.9554(10) |
| Complex | Temperature | g⊥ | g‖ | gave | ACu‖ /mT | G | f/cm |
|---|---|---|---|---|---|---|---|
| 1 | Solid RT | 2.082 | 2.290 | 2.151 | - | 3.54 | |
| Sol. 100K | 2.078 | 2.312 | 2.156 | 14.5 | 4.00 | 147 | |
| 2 | Solid RT | 2.061 | 2.360 | 2.161 | - | 5.90 | |
| Sol. 100 K | 2.077 | 2.303 | 2.152 | 17.5 | 3.94 | 123 | |
| 3 | Solid RT | 2.063 | 2.305 | 2.144 | 16.2 | 4.84 | 132 |
| Sol. 100 K | 2.072 | 2.307 | 2.150 | 16.7 | 4.26 | 128 | |
| 4 | Solid RT | 2.057 | 2.308 | 2.140 | 16 | 5.40 | 134 |
| Sol. 100 K | 2.073 | 2.315 | 2.154 | 15.5 | 4.32 | 138 | |
| 5 | Solid RT | 2.055 | 2.320 | 2.143 | - | 5.81 | |
| Sol. 100 K | 2.075 | 2.300 | 2.150 | 16.5 | 4.00 | 130 |
| Complex | IC50/μM | Reference |
|---|---|---|
| [Cu(fluf)2(dena)2(H2O)2] (1) | 3.33 | This work |
| [Cu(nifl)2(dena)2] (2) | 1.69 | This work |
| [Cu(tolf)2(dena)2(H2O)2] (3) | 3.46 | This work |
| [Cu(clon)2(dena)2] (4) | 1.41 | This work |
| [Cu(mef)2(dena)2(H2O)2] (5) | 3.15 | This work |
| [Cu(tolf)2(phen)] | 0.98 | [27] |
| [Cu(mef)2(phen)] | 1.23 | [27] |
| [Cu(fluf)2(phen)] | 0.94 | [27] |
| [Cu(3-mesal)2(dena)2(H2O)2] | 3.88 | [41] |
| [Cu(tolf)2(H2O)]2 | 1.97 | [42] |
| Native SOD | 0.04 | [3] |
| Comp | Ep,ox/V | Ep,red/V | E1/2/V | ΔE/V | Ip,ox/μA | Ip,red/μA | Ep,ox/V | Ip,ox/μA |
|---|---|---|---|---|---|---|---|---|
| 1 | −0.133 | −0.085 | −0.109 | −0.048 | 1.386 | −0.917 | 0.741 | 4.05 |
| 2 | −0.126 | −0.096 | −0.111 | −0.030 | 1.064 | −0.542 | 0.941 | 4.36 |
| 3 | −0.124 | −0.097 | −0.111 | −0.027 | 1.427 | −1.104 | 0.734 | 5.00 |
| 4 | −0.136 | −0.096 | −0.116 | −0.040 | 1.449 | −0.681 | 0.877 | 4.62 |
| 5 | −0.133 | −0.087 | −0.110 | −0.046 | 1.279 | −0.876 | 0.633 | 4.36 |
| Complex | Kb [M−1] | R2 | λ(nm)(ΔA/A0 (%), Δλ * (nm) |
|---|---|---|---|
| [Cu(fluf)2(dena)2(H2O)2] (1) | 4.83 (±0.84) · 105 | 0.9897 | 287(21.4, −1) |
| [Cu(nifl)2(dena)2] (2) | 1.04 (±0.75) · 105 | 0.8699 | 287(11.8, −2) |
| [Cu(tolf)2(dena)2(H2O)2] (3) | 2.52 (±0.87) · 105 | 0.9551 | 288(15.7, −3) |
| [Cu(clon)2(dena)2] (4) | 5.46 (±0.87) · 105 | 0.9906 | 281(12,3, −5) |
| Complex | ∆I/I0 (%) | Ksv (M−1)/103 | kq (M−1 s−1)/1011 |
|---|---|---|---|
| [Cu(fluf)2(dena)2(H2O)2] (1) | 35.2 | 3.59 (±0.16) | 1.56 (±0.07) |
| [Cu(nifl)2(dena)2] (2) | 36.7 | 3.79 (±0.13) | 1.65 (±0.06) |
| [Cu(tolf)2(dena)2(H2O)2] (3) | 31.2 | 3.40 (±0.09) | 1.48 (±0.04) |
| [Cu(clon)2(dena)2] (4) | 33.6 | 3.30 (±0.08) | 1.44 (±0.04) |
| DMSO | 30.9 | 3.03 (±0.07) | 1.32 (±0.03) |
| Complex | Ksv (M−1)/105 | kq (M−1 s−1)/1013 | KBSA(M−1)/105 | n |
|---|---|---|---|---|
| [Cu(fluf)2(dena)2(H2O)2] (1) | 5.777 | 2.51 (±0.061) | 3.39 (±0.413) | 1.11 |
| [Cu(nifl)2(dena)2] (2) | 4.411 | 1.92 (±0.073) | 2.18 (±0.164) | 1.16 |
| [Cu(tolf)2(dena)2(H2O)2] (3) | 4.740 | 2.06 (±0.092) | 3.36 (±0.417) | 1.10 |
| [Cu(clon)2(dena)2] (4) | 5.558 | 2.42 (±0.054) | 3.32 (±0.147) | 1.08 |
| 1 | 2 | 3 | 4 | 5 | |
|---|---|---|---|---|---|
| Chemical formula | C48H50CuF6N6O8 | C48H44CuF6N8O6 | C48H54Cl2CuN6O8 | C46H48Cl2CuN8O6 | C50H60CuN6O8 |
| Mr | 1016.504 | 982.448 | 977.450 | 943.395 | 936.615 |
| Crystal system | Monoclinic | Triclinic | Monoclinic | Triclinic | Monoclinic |
| Space group | P21/c | P–1 | P21/n | P–1 | P21/n |
| T/K | 100(1) | 100(1) | 100(1) | 100(1) | 100(1) |
| a/Å | 7.2566(2) | 7.9291(3) | 7.9338(1) | 7.7476(4) | 7.8787(1) |
| b/Å | 37.7315(9) | 12.155(5) | 10.2793(2) | 11.6292(6) | 10.3607(3) |
| c/Å | 8.4952(3) | 12.7150(5) | 28.5066(5) | 12.4652(7) | 28.6114(5) |
| α/° | 90 | 76.947(3) | 90 | 82.283(4) | 90 |
| β/° | 103.354(4) | 72.828(3) | 94.659(1) | 74.404(4) | 94.888(1) |
| γ/° | 90 | 70.520(3) | 90 | 76.633(4) | 90 |
| V/Å3 | 2263.11(12) | 1092.7(5) | 2317.14(7) | 1049.32(10) | 2327.02(8) |
| Z | 2 | 1 | 2 | 1 | 2 |
| λ/Å | 1.54186 | 1.54186 | 1.54186 | 1.54186 | 1.54186 |
| Abs. correction | Multi-scan, LANA | Multi-scan, LANA | Multi-scan, LANA | Multi-scan, LANA | Multi-scan, LANA |
| μ/mm−1 | 1.438 | 1.448 | 2.224 | 2.414 | 1.158 |
| Crystal size/mm | 0.35 × 0.15 × 0.12 | 0.36 × 0.09 × 0.09 | 0.35 × 0.32 × 0.25 | 0.25 × 0.21 × 0.05 | 0.32 × 0.25 × 0.18 |
| ρcalc/g.cm–3 | 1.492 | 1.492 | 1.401 | 1.493 | 1.337 |
| S | 1.015 | 1.096 | 1.064 | 1.047 | 1.073 |
| R1 [I > 2σ(I)] | 0.0283 | 0.0178 | 0.0191 | 0.0237 | 0.0240 |
| wR2 [all data] | 0.0739 | 0.0372 | 0.0486 | 0.0581 | 0.0556 |
| Δ⟩max, Δ⟩min/e Å−3 | 0.74, −0.30 | 0.40, −0.19 | 0.18, −0.38 | 0.25, −0.38 | 0.34, −0.30 |
| CCDC | 2202673 | 2202674 | 2202675 | 2202676 | 2202677 |
Disclaimer/Publisher’s Note: The statements, opinions and data contained in all publications are solely those of the individual author(s) and contributor(s) and not of MDPI and/or the editor(s). MDPI and/or the editor(s) disclaim responsibility for any injury to people or property resulting from any ideas, methods, instructions or products referred to in the content. |
© 2023 by the authors. Licensee MDPI, Basel, Switzerland. This article is an open access article distributed under the terms and conditions of the Creative Commons Attribution (CC BY) license (https://creativecommons.org/licenses/by/4.0/).
Share and Cite
Piroš, M.; Schoeller, M.; Koňariková, K.; Valentová, J.; Švorc, Ľ.; Moncoľ, J.; Valko, M.; Švorec, J. Structural and Biological Properties of Heteroligand Copper Complexes with Diethylnicotinamide and Various Fenamates: Preparation, Structure, Spectral Properties and Hirshfeld Surface Analysis. Inorganics 2023, 11, 108. https://doi.org/10.3390/inorganics11030108
Piroš M, Schoeller M, Koňariková K, Valentová J, Švorc Ľ, Moncoľ J, Valko M, Švorec J. Structural and Biological Properties of Heteroligand Copper Complexes with Diethylnicotinamide and Various Fenamates: Preparation, Structure, Spectral Properties and Hirshfeld Surface Analysis. Inorganics. 2023; 11(3):108. https://doi.org/10.3390/inorganics11030108
Chicago/Turabian StylePiroš, Milan, Martin Schoeller, Katarína Koňariková, Jindra Valentová, Ľubomír Švorc, Ján Moncoľ, Marian Valko, and Jozef Švorec. 2023. "Structural and Biological Properties of Heteroligand Copper Complexes with Diethylnicotinamide and Various Fenamates: Preparation, Structure, Spectral Properties and Hirshfeld Surface Analysis" Inorganics 11, no. 3: 108. https://doi.org/10.3390/inorganics11030108