Fiber Optic Sensor with a Gold Nanowire Group Array for Broad Range and Low Refractive Index Detection

 ,
, 
 ,
,
Abstract
:1. Introduction
2. Model and Principle Analysis
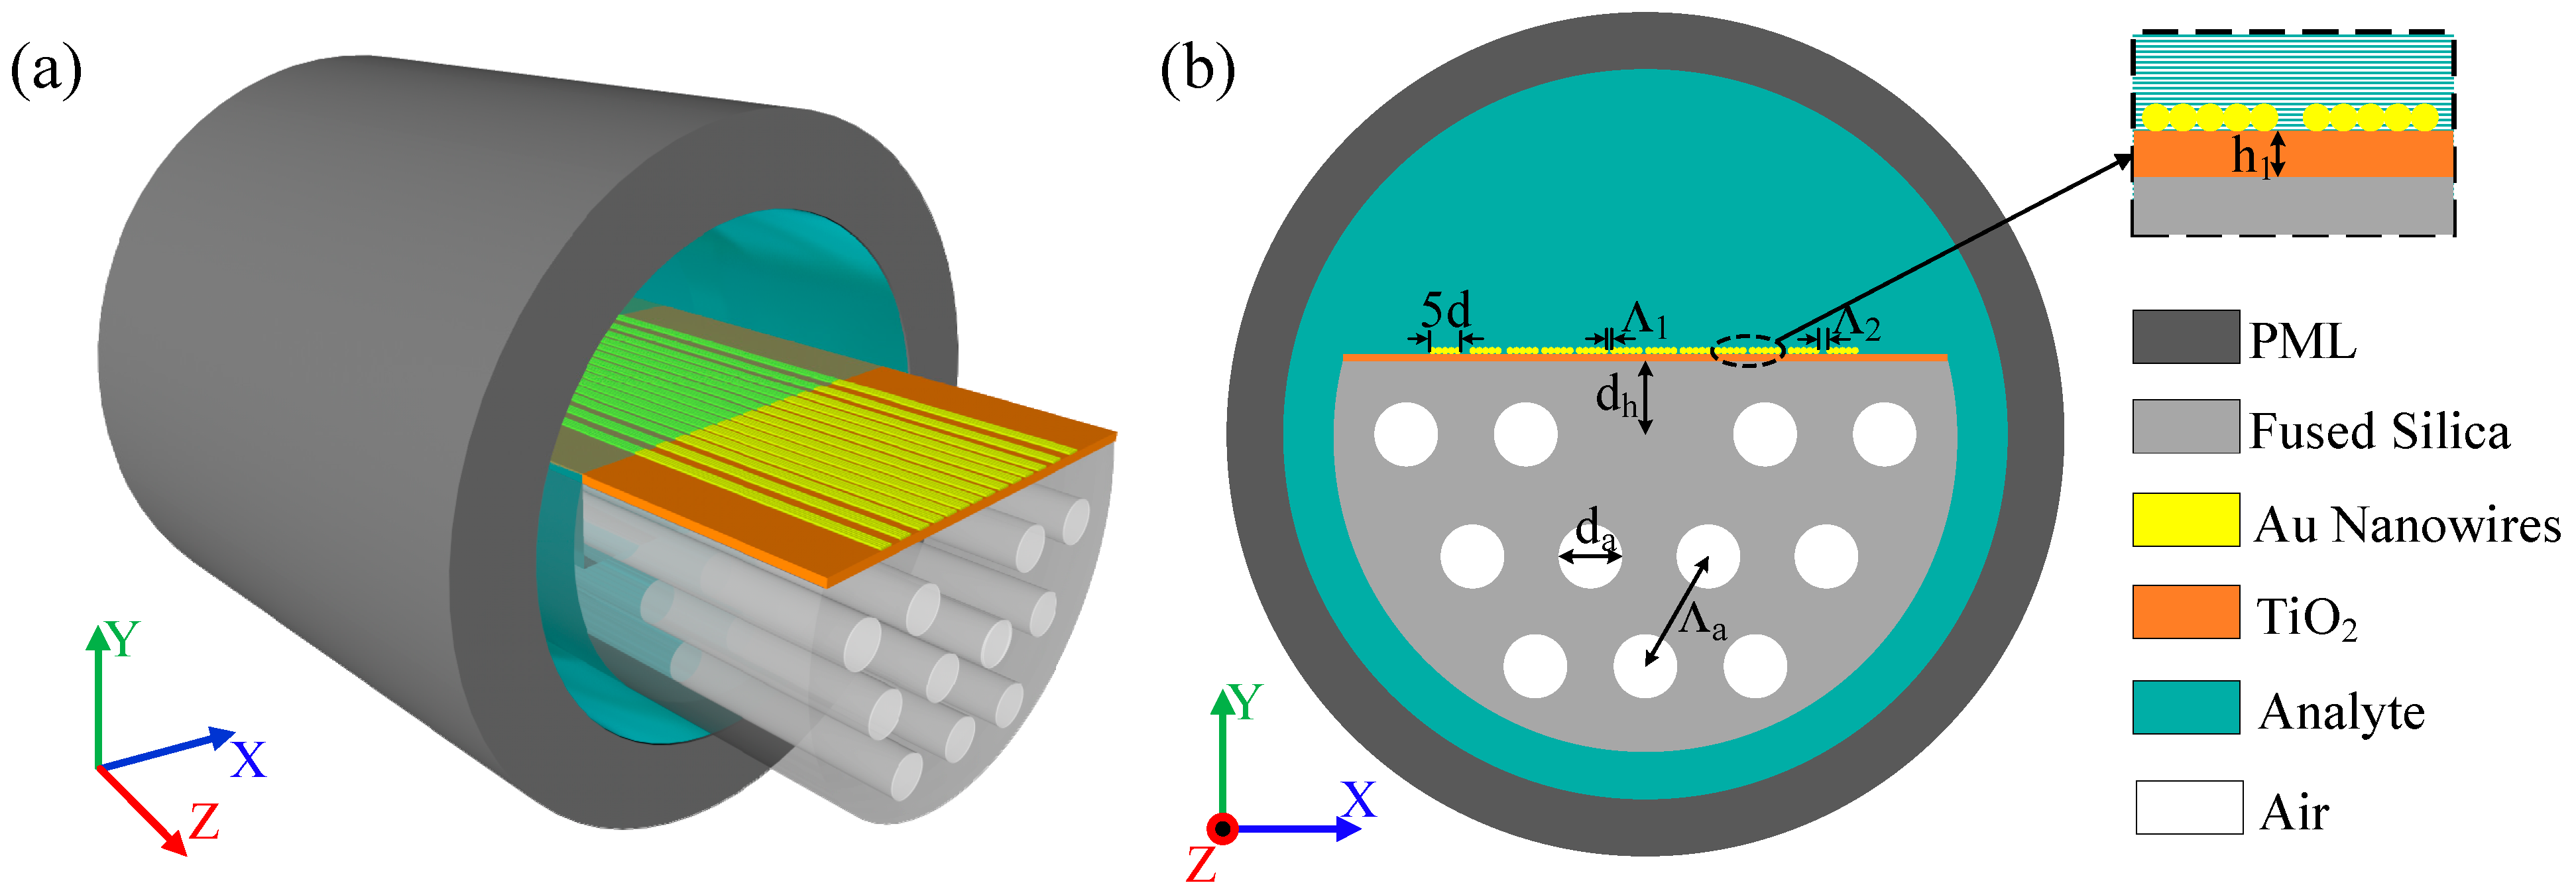
2.1. Model Analysis
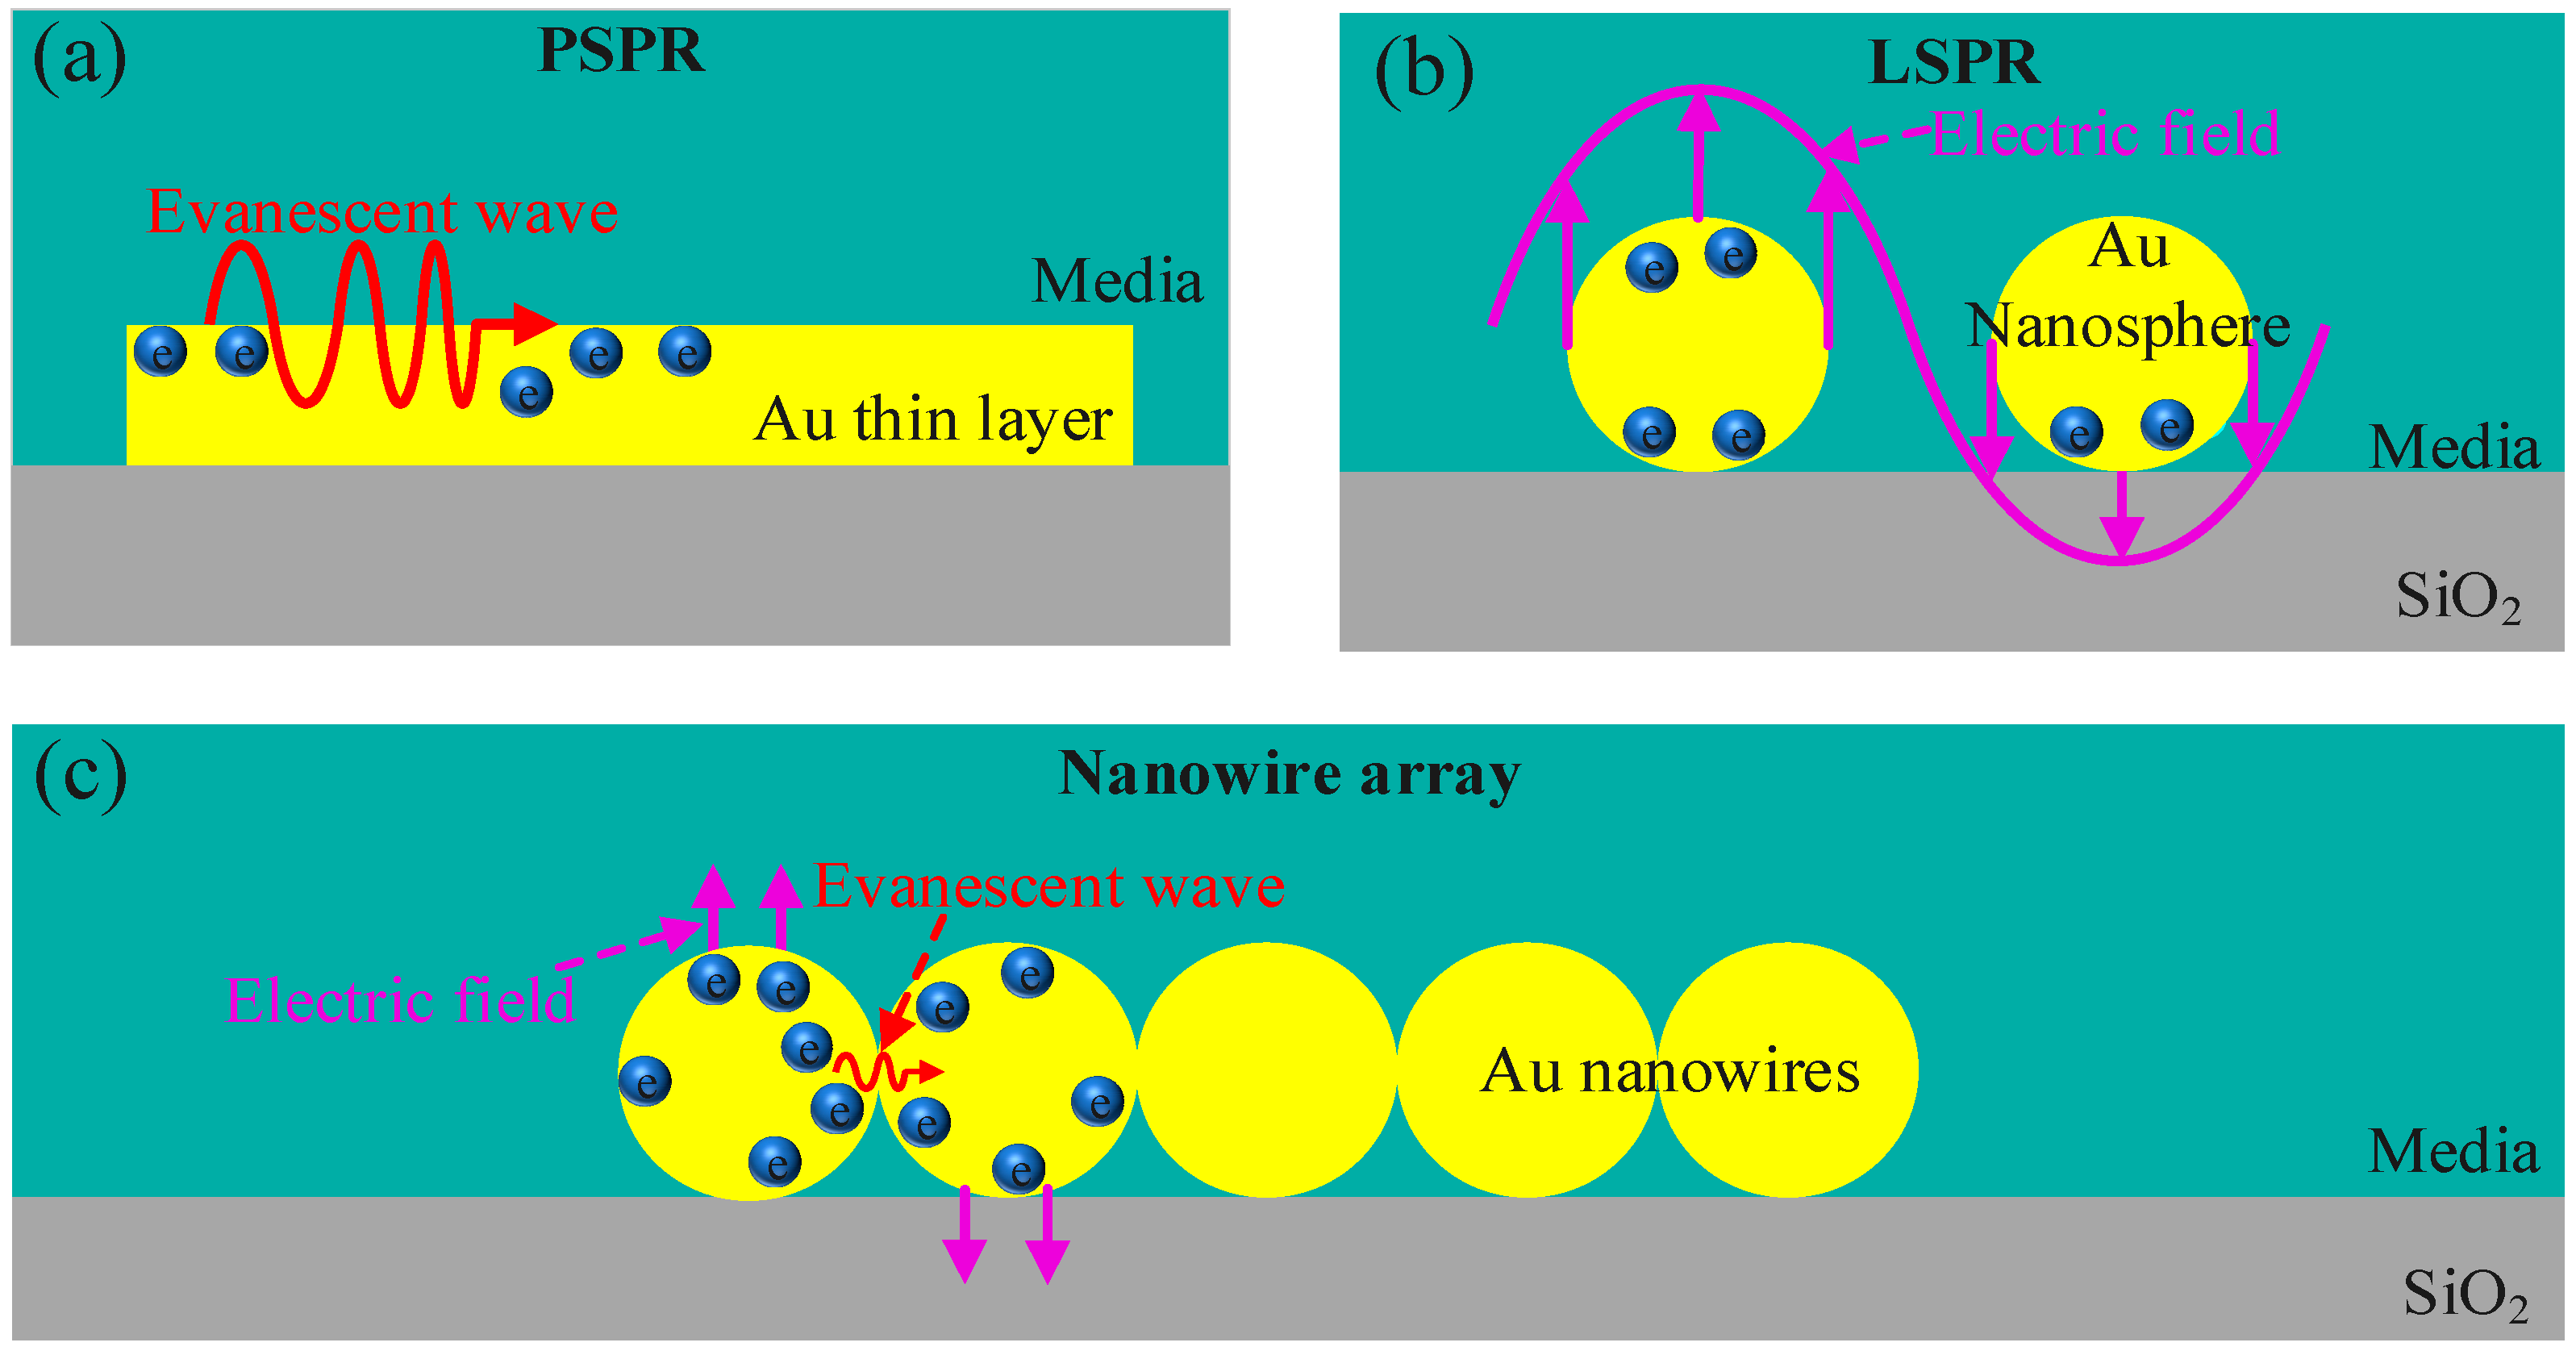
2.2. Principle Analysis
3. Simulation Discussions and Results
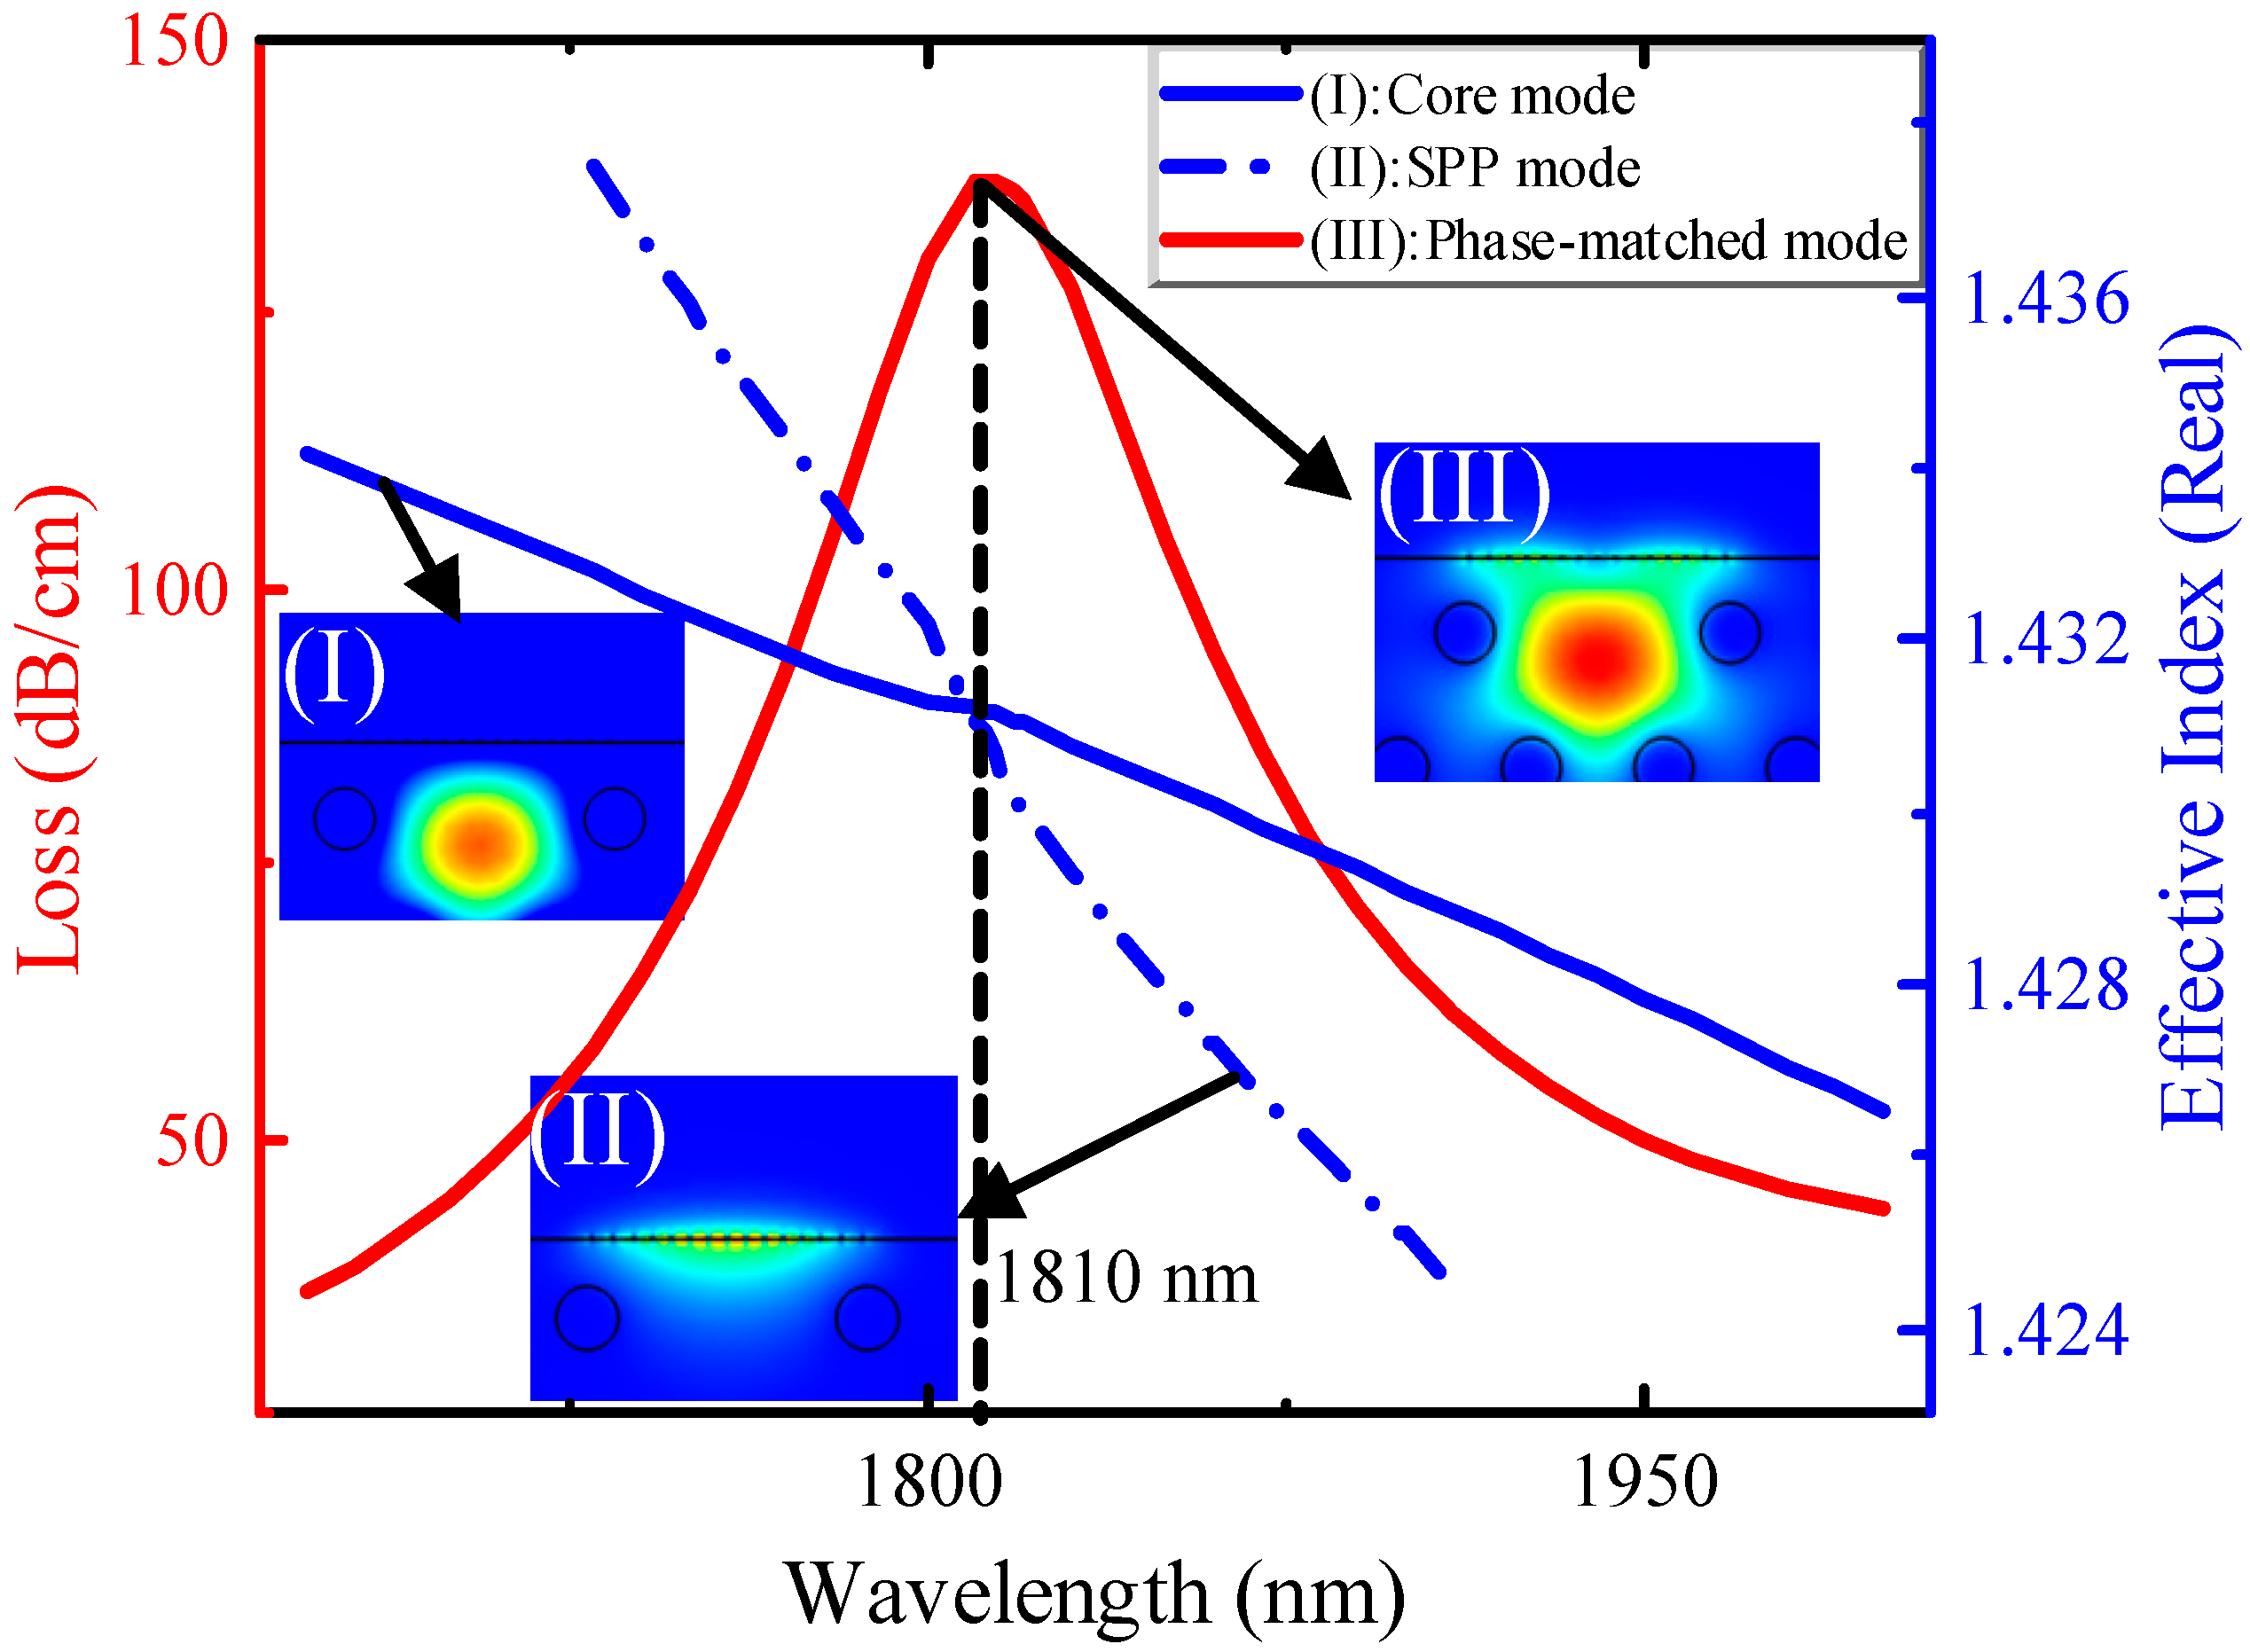
3.1. Mode Analysis and Dispersion Relations
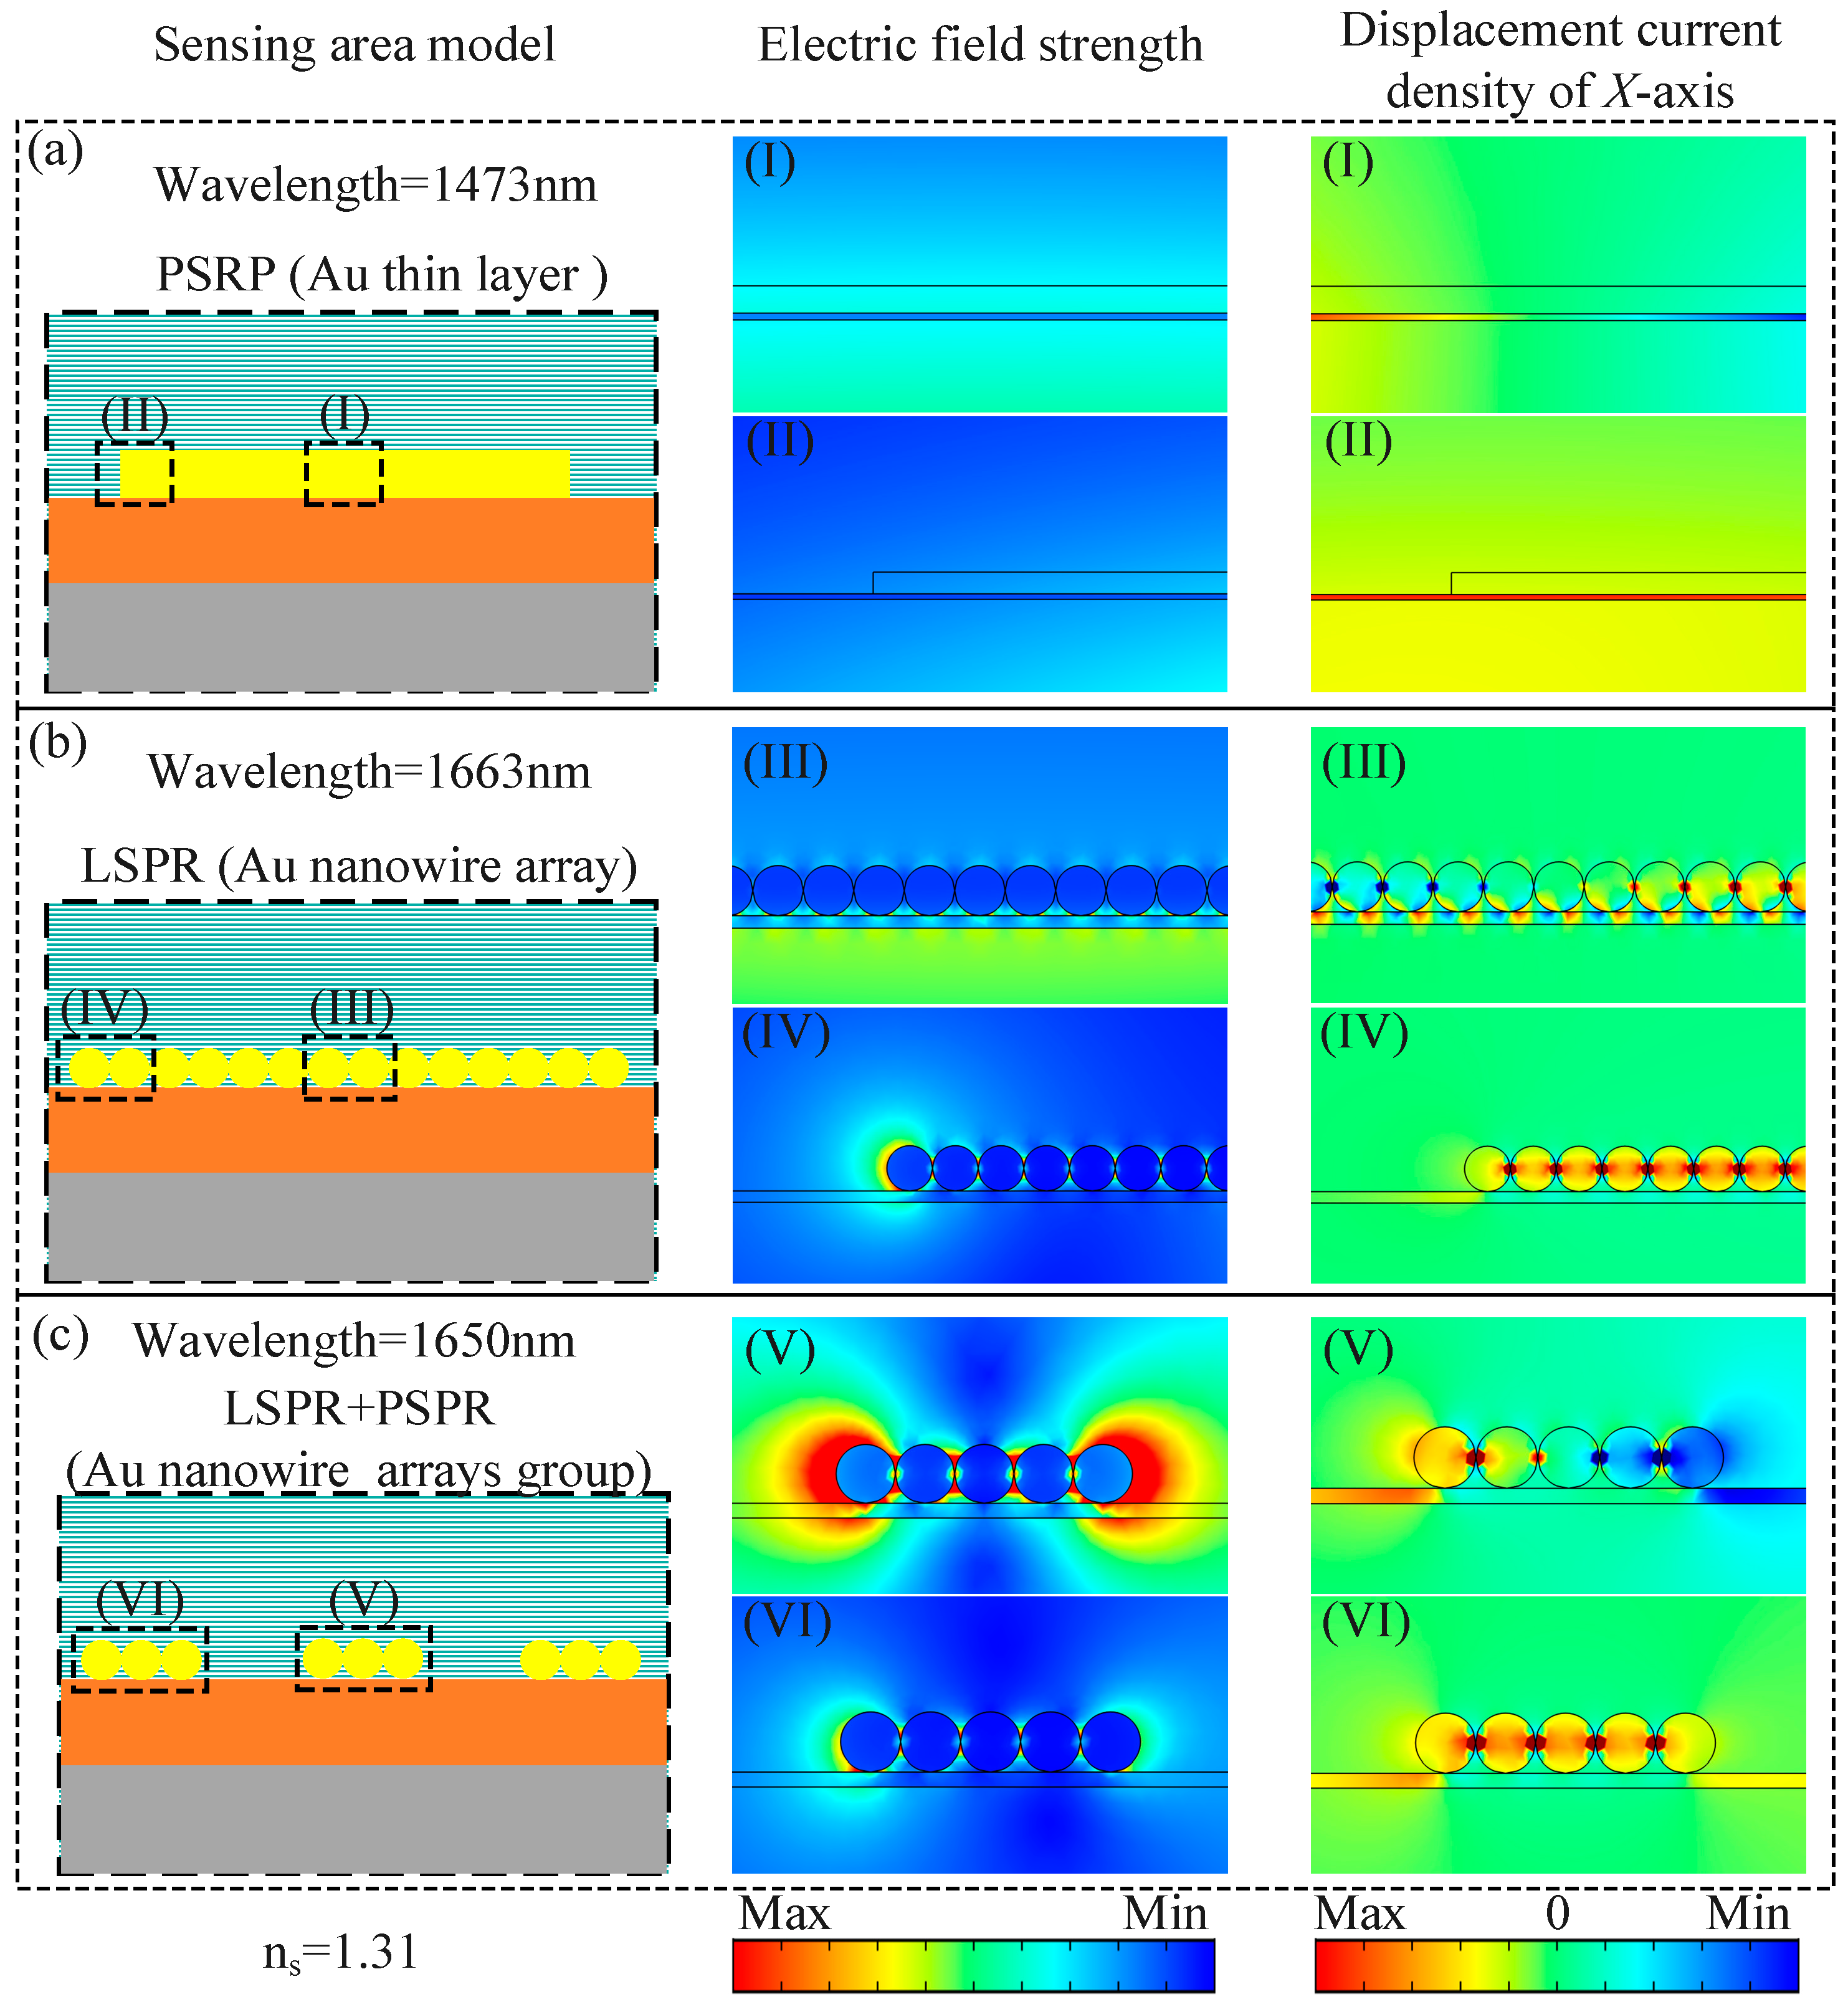
3.2. Simulation Analysis of Sensing Area
3.3. Structural Parameter Optimization
3.4. Sensor Performance
4. Conclusions
Author Contributions
Funding
Institutional Review Board Statement
Informed Consent Statement
Data Availability Statement
Conflicts of Interest
References
- Liu, C.; Su, W.; Wang, F.; Li, X.; Liu, Q.; Mu, H.; Sun, T.; Chu, P.K.; Liu, B. Birefringent PCF-Based SPR Sensor for a Broad Range of Low Refractive Index Detection. IEEE Photonics Technol. Lett. 2018, 30, 1471–1474. [Google Scholar] [CrossRef]
- Zhang, S.; Guo, Y.; Cheng, T.; Li, S.; Li, J. Surface plasmon resonance sensor based on a D-shaped photonic crystal fiber for high and low refractive index detection. Optik 2020, 212, 164697. [Google Scholar] [CrossRef]
- Boates, B.; Hamel, S.; Schwegler, E.; Bonev, S.A. Structural and optical properties of liquid CO2 for pressures up to 1 TPa. J. Chem. Phys. 2011, 134, 064504. [Google Scholar] [CrossRef] [PubMed]
- Yang, Z.; Xia, L.; Li, C.; Chen, X.; Liu, D. A surface plasmon resonance sensor based on concave-shaped photonic crystal fiber for low refractive index detection. Opt. Commun. 2019, 430, 195–203. [Google Scholar] [CrossRef]
- Maidi, A.M.I.; Abas, P.E.; Petra, P.I.; Kaijage, S.; Zou, N.; Begum, F. Theoretical Considerations of Photonic Crystal Fiber with All Uniform-Sized Air Holes for Liquid Sensing. Photonics 2021, 8, 249. [Google Scholar] [CrossRef]
- Paul, A.K.; Sarkar, A.K.; Rahman, A.B.S.; Khaleque, A. Twin Core Photonic Crystal Fiber Plasmonic Refractive Index Sensor. IEEE Sens. J. 2018, 18, 5761–5769. [Google Scholar] [CrossRef]
- Venu, D.; Mayuri, A.V.R.; Neelakandan, S.; Murthy, G.L.N.; Arulkumar, N.; Shelke, N. An efficient low complexity compression based optimal homomorphic encryption for secure fiber optic communication. Optik 2022, 252, 168545. [Google Scholar] [CrossRef]
- Butt, M.A.; Khonina, S.N.; Kazanskiy, N.L. Plasmonics: A Necessity in the Field of Sensing—A Review (Invited). Fiber Integr. Opt. 2021, 40, 14–47. [Google Scholar] [CrossRef]
- Chaudhary, V.S.; Kumar, D.; Kumar, S. Gold-Immobilized Photonic Crystal Fiber-Based SPR Biosensor for Detection of Malaria Disease in Human Body. IEEE Sens. J. 2021, 21, 17800–17807. [Google Scholar] [CrossRef]
- Liu, Y.; Chen, H.; Guo, Y.; Wang, M.; Meng, X.; Jing, X.; Li, S. Ultra-high sensitivity plasmonic sensor based on D-shaped photonic crystal fiber with offset-core. Optik 2020, 221, 165309. [Google Scholar] [CrossRef]
- Lee, K.J.; Liu, X.; Vuillemin, N.; Lwin, R.; Leon-Saval, S.G.; Argyros, A.; Kuhlmey, B.T. Refractive index sensor based on a polymer fiber directional coupler for low index sensing. Opt. Express 2014, 22, 17497–17507. [Google Scholar] [CrossRef] [PubMed]
- Li, X.; Warren-Smith, S.C.; Ebendorff-Heidepriem, H.; Zhang, Y.-n.; Nguyen, L.V. Optical Fiber Refractive Index Sensor with Low Detection Limit and Large Dynamic Range Using a Hybrid Fiber Interferometer. J. Lightwave Technol. 2019, 37, 2954–2962. [Google Scholar] [CrossRef]
- Tan, X.-J.; Zhu, X.-S.; Shi, Y.-W. Hollow fiber sensor based on metal-cladding waveguide with extended detection range. Opt. Express 2017, 25, 16996–17003. [Google Scholar] [CrossRef] [PubMed]
- Karasinski, P.; Tyszkiewicz, C.; Rogozinski, R. Planar Evanescent Wave Ammonia Sensor—Influence of Refractive Index Profile on Sensor Properties. Acta Phys. Pol. A 2011, 120, 651–656. [Google Scholar] [CrossRef]
- Tyszkiewicz, C. Theoretical analysis of slab waveguides supporting SPP modes toward their sensitivity characteristics. In Proceedings of the 11th Conference on Integrated Optics—Sensors, Sensing Structures, and Methods, Szczyrk, Poland, 29 February–4 March 2016. [Google Scholar]
- Wang, C.; Chen, P.-J.; Hsueh, C.-H. Au-Based Thin-Film Metallic Glasses for Propagating Surface Plasmon Resonance-Based Sensor Applications. ACS Omega 2022, 7, 18780–18785. [Google Scholar] [CrossRef] [PubMed]
- Abdullah, H.; Ahmed, K.; Mitu, S.A. Ultrahigh sensitivity refractive index biosensor based on gold coated nanofilm photonic crystal fiber. Results Phys. 2020, 17, 103151. [Google Scholar] [CrossRef]
- Liang, H.; Shen, T.; Feng, Y.; Liu, H.; Han, W. A D-Shaped Photonic Crystal Fiber Refractive Index Sensor Coated with Graphene and Zinc Oxide. Sensors 2021, 21, 71. [Google Scholar] [CrossRef]
- Shen, Y.; Zhou, J.; Liu, T.; Tao, Y.; Jiang, R.; Liu, M.; Xiao, G.; Zhu, J.; Zhou, Z.-K.; Wang, X.; et al. Plasmonic gold mushroom arrays with refractive index sensing figures of merit approaching the theoretical limit. Nat. Commun. 2013, 4, 2381. [Google Scholar] [CrossRef]
- Jiao, S.; Gu, S.; Yang, H.; Fang, H. Research on dual-core photonic crystal fiber based on local surface plasmon resonance sensor with silver nanowires. J. Nanophotonics 2018, 12, 046015. [Google Scholar] [CrossRef]
- Paul, D.; Biswas, R. INVITED Highly sensitive LSPR based photonic crystal fiber sensor with embodiment of nanospheres in different material domain. Opt. Laser Technol. 2018, 101, 379–387. [Google Scholar] [CrossRef]
- Ryu, J.-H.; Lee, H.Y.; Lee, J.-Y.; Kim, H.-S.; Kim, S.-H.; Ahn, H.S.; Ha, D.H.; Yi, S.N. Enhancing SERS Intensity by Coupling PSPR and LSPR in a Crater Structure with Ag Nanowires. Appl. Sci. 2021, 11, 11855. [Google Scholar] [CrossRef]
- Bousiakou, L.G.; Gebavi, H.; Mikac, L.; Karapetis, S.; Ivanda, M. Surface Enhanced Raman Spectroscopy for Molecular Identification—A Review on Surface Plasmon Resonance (SPR) and Localised Surface Plasmon Resonance (LSPR) in Optical Nanobiosensing. Croat. Chem. Acta 2019, 92, 479–494. [Google Scholar] [CrossRef]
- Kim, D.; Yoon, S.J. Effective medium-based analysis of nanowire-mediated localized surface plasmon resonance. Appl. Opt. 2007, 46, 872–880. [Google Scholar] [CrossRef] [PubMed]
- Pathak, A.K.; Singh, V.K. SPR Based Optical Fiber Refractive Index Sensor Using Silver Nanowire Assisted CSMFC. IEEE Photonics Technol. Lett. 2020, 32, 465–468. [Google Scholar] [CrossRef]
- Zhao, L.; Han, H.; Luan, N.; Liu, J.; Song, L.; Hu, Y. A Temperature Plasmonic Sensor Based on a Side Opening Hollow Fiber Filled with High Refractive Index Sensing Medium. Sensors 2019, 19, 3730. [Google Scholar] [CrossRef]
- Wang, D.; Yi, Z.; Ma, G.; Dai, B.; Yang, J.; Zhang, J.; Yu, Y.; Liu, C.; Wu, X.; Bian, Q. Two-channel photonic crystal fiber based on surface plasmon resonance for magnetic field and temperature dual-parameter sensing. Phys. Chem. Chem. Phys. PCCP 2022, 24, 21233–21241. [Google Scholar] [CrossRef]
- Pathak, A.K.; Rahman, B.M.A.; Viphavakit, C. Nanowire Embedded Micro-Drilled Dual-Channel Approach to Develop Highly Sensitive Biosensor. IEEE Photonics Technol. Lett. 2022, 34, 707–710. [Google Scholar] [CrossRef]
- Meshginqalam, B.; Barvestani, J. High performance surface plasmon resonance-based photonic crystal fiber biosensor for cancer cells detection. Eur. Phys. J. Plus 2022, 137, 417. [Google Scholar] [CrossRef]
- Zhan, Y.; Li, Y.; Wu, Z.; Hu, S.; Li, Z.; Liu, X.; Yu, J.; Huang, Y.; Jing, G.; Lu, H.; et al. Surface plasmon resonance-based microfiber sensor with enhanced sensitivity by gold nanowires. Opt. Mater. Express 2018, 8, 3927–3940. [Google Scholar] [CrossRef]
- Anik, M.H.K.; Isti, M.I.A.; Islam, S.M.R.; Mahmud, S.; Talukder, H.; Piran, M.J.; Biswas, S.K.; Kwak, K.-S. Milled Microchannel-Assisted Open D-Channel Photonic Crystal Fiber Plasmonic Biosensor. IEEE Access 2021, 9, 2924–2933. [Google Scholar] [CrossRef]
- Meng, F.; Wang, H.; Fang, D. Research on D-Shape Open-Loop PCF Temperature Refractive Index Sensor Based on SPR Effect. IEEE Photonics J. 2022, 14, 5727605. [Google Scholar] [CrossRef]
- Gu, S.; Sun, W.; Li, M.; Li, Z.; Nan, X.; Feng, Z.; Deng, M. Simultaneous measurement of magnetic field and temperature based on photonic crystal fiber plasmonic sensor with dual-polarized modes. Optik 2022, 259, 169030. [Google Scholar] [CrossRef]
- Shakya, A.K.; Singh, S. Design of refractive index sensing based on optimum combination of plasmonic materials gold with indium tin oxide/titanium dioxide. J. Nanophotonics 2022, 16, 026010. [Google Scholar] [CrossRef]
- Zhang, Y.; Wang, L.; Jia, P.; Zhai, C.; An, G.; Liu, L.; Zhu, F.; Su, J. High-sensitivity refractive index sensor with cascaded dual-core photonic crystal fiber based on vernier effect. Optik 2022, 256, 168488. [Google Scholar] [CrossRef]
- Hooshmand, N.; Mousavi, H.S.; Panikkanvalappil, S.R.; Adibi, A.; El-Sayed, M.A. High-sensitivity molecular sensing using plasmonic nanocube chains in classical and quantum coupling regimes. Nano Today 2017, 17, 14–22. [Google Scholar] [CrossRef]
- Liu, D.; Wu, T.; Zhang, Q.; Wang, X.; Guo, X.; Su, Y.; Zhu, Y.; Shao, M.; Chen, H.; Luo, Y.; et al. Probing the in-Plane Near-Field Enhancement Limit in a Plasmonic Particle-on-Film Nanocavity with Surface-Enhanced Raman Spectroscopy of Graphene. ACS Nano 2019, 13, 7644–7654. [Google Scholar] [CrossRef]
- Liu, C.; Yang, L.; Liu, Q.; Wang, F.; Sun, Z.; Sun, T.; Mu, H.; Chu, P.K. Analysis of a Surface Plasmon Resonance Probe Based on Photonic Crystal Fibers for Low Refractive Index Detection. Plasmonics 2018, 13, 779–784. [Google Scholar] [CrossRef]
- Zhao, L.; Han, H.; Lian, Y.; Luan, N.; Liu, J. Theoretical analysis of all-solid D-type photonic crystal fiber based plasmonic sensor for refractive index and temperature sensing. Opt. Fiber Technol. 2019, 50, 165–171. [Google Scholar] [CrossRef]
- Wieduwilt, T.; Kirsch, K.; Dellith, J.; Willsch, R.; Bartelt, H. Optical Fiber Micro-Taper with Circular Symmetric Gold Coating for Sensor Applications Based on Surface Plasmon Resonance. Plasmonics 2013, 8, 545–554. [Google Scholar] [CrossRef]
- Jing, G.; Bodiguel, H.; Doumenc, F.; Sultan, E.; Guerrier, B. Drying of Colloidal Suspensions and Polymer Solutions near the Contact Line: Deposit Thickness at Low Capillary Number. Langmuir 2010, 26, 2288–2293. [Google Scholar] [CrossRef]
- Zhang, J.-C.; Mao, Y.; Wang, W.; Guan, Y.-R.; Bao, Y.; Niu, L. In Situ Investigation on Electrochemical Polymerization and Properties of Polyaniline Thin Films by Electrochemical Surface Plasmon Resonance. Chin. J. Anal. Chem. 2015, 43, 350–355. [Google Scholar]
- Tan, D.; Wang, Y.; Gan, Y. Facile Visible-Light-Assisted Synthesis, Optical, and Electrochemical Properties of Pd Nanoparticles with Single crystalline and Multiple-twinned Structures. Rare Met. Mater. Eng. 2017, 46, 2065–2069. [Google Scholar]
- Baba, A.; Tada, K.; Janmanee, R.; Sriwichai, S.; Shinbo, K.; Kato, K.; Kaneko, F.; Phanichphant, S. Controlling Surface Plasmon Optical Transmission with an Electrochemical Switch Using Conducting Polymer Thin Films. Adv. Funct. Mater. 2012, 22, 4383–4388. [Google Scholar] [CrossRef]


| ns | RW (nm) | Loss (dB/cm) | WS (nm/RIU) | ns | RW (nm) | Loss (dB/cm) | WS (nm/RIU) |
|---|---|---|---|---|---|---|---|
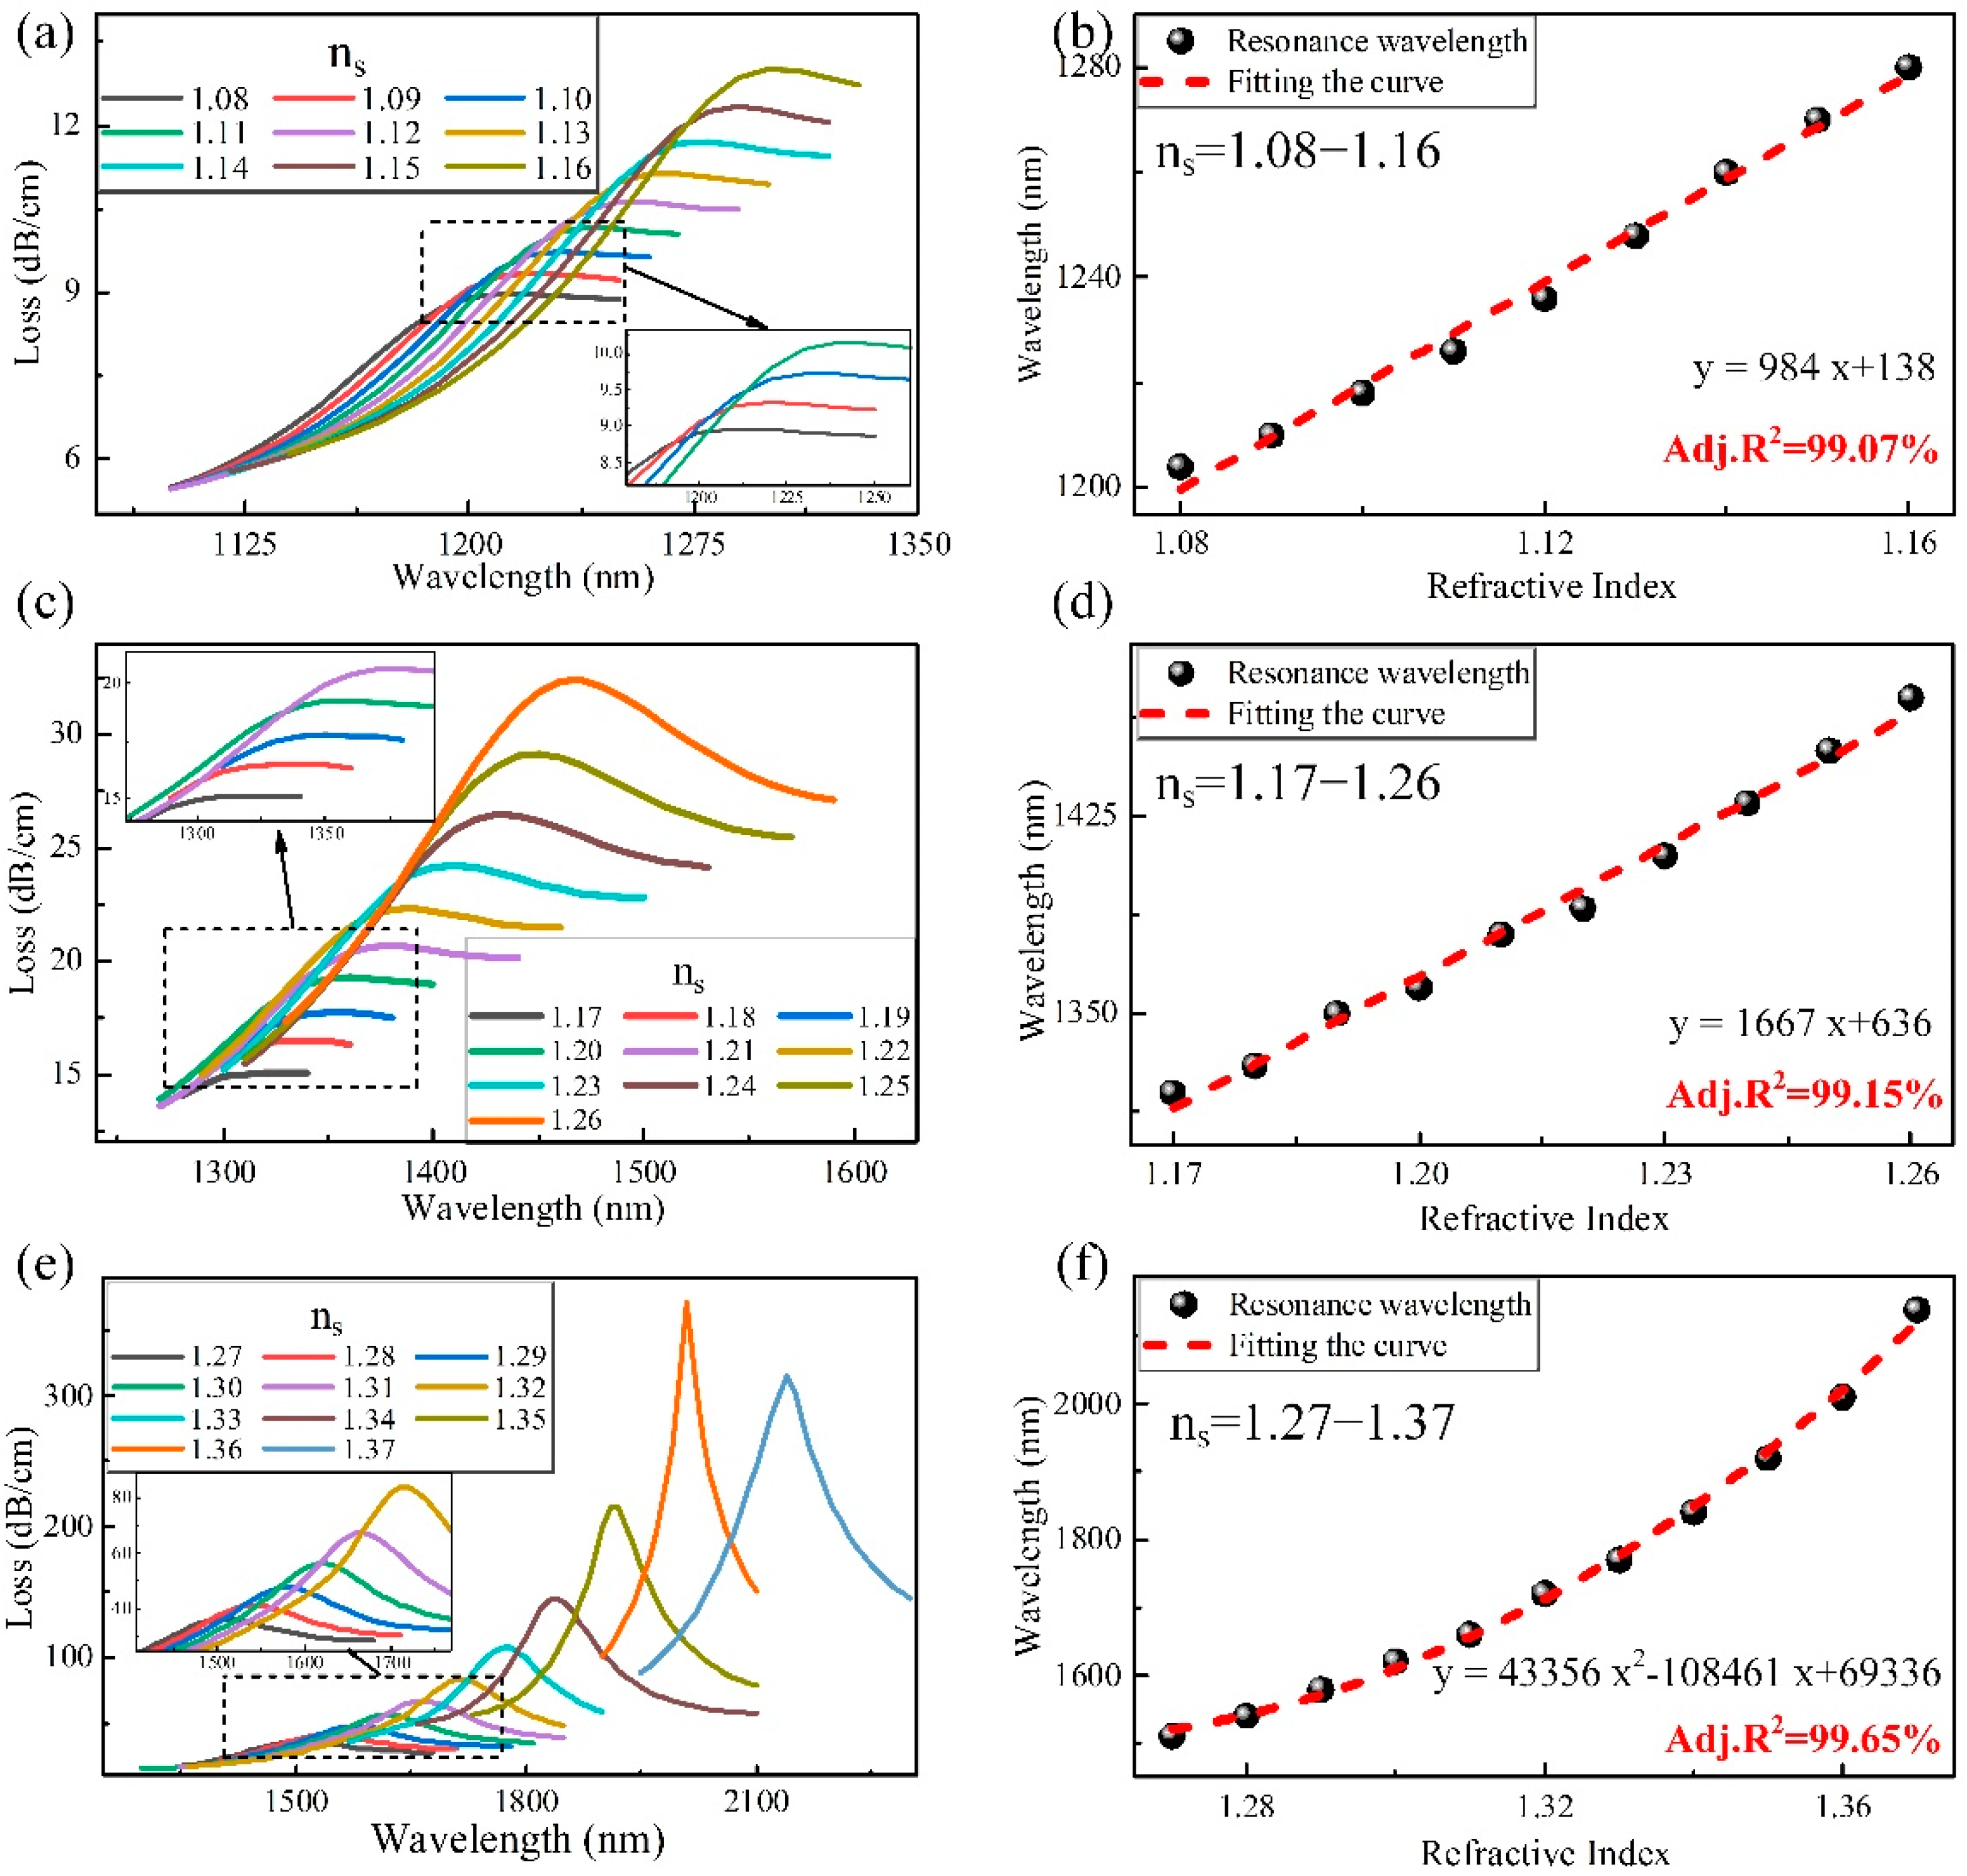
| 1.08 | 1210 | 8.97 | 1000 | 1.23 | 1410 | 24.22 | 2000 |
| 1.09 | 1220 | 9.33 | 1000 | 1.24 | 1430 | 26.46 | 2000 |
| 1.10 | 1230 | 9.73 | 1000 | 1.25 | 1450 | 29.04 | 2000 |
| 1.11 | 1240 | 10.16 | 1000 | 1.26 | 1470 | 32.37 | 4000 |
| 1.12 | 1250 | 10.62 | 2000 | 1.27 | 1510 | 36.35 | 3000 |
| 1.13 | 1270 | 11.34 | 1000 | 1.28 | 1540 | 41.33 | 4000 |
| 1.14 | 1280 | 11.71 | 1000 | 1.29 | 1580 | 47.72 | 4000 |
| 1.15 | 1290 | 12.33 | 1000 | 1.30 | 1620 | 56.17 | 4000 |
| 1.16 | 1300 | 13.34 | 2000 | 1.31 | 1660 | 67.51 | 6000 |
| 1.17 | 1320 | 15.21 | 1000 | 1.32 | 1720 | 83.63 | 5000 |
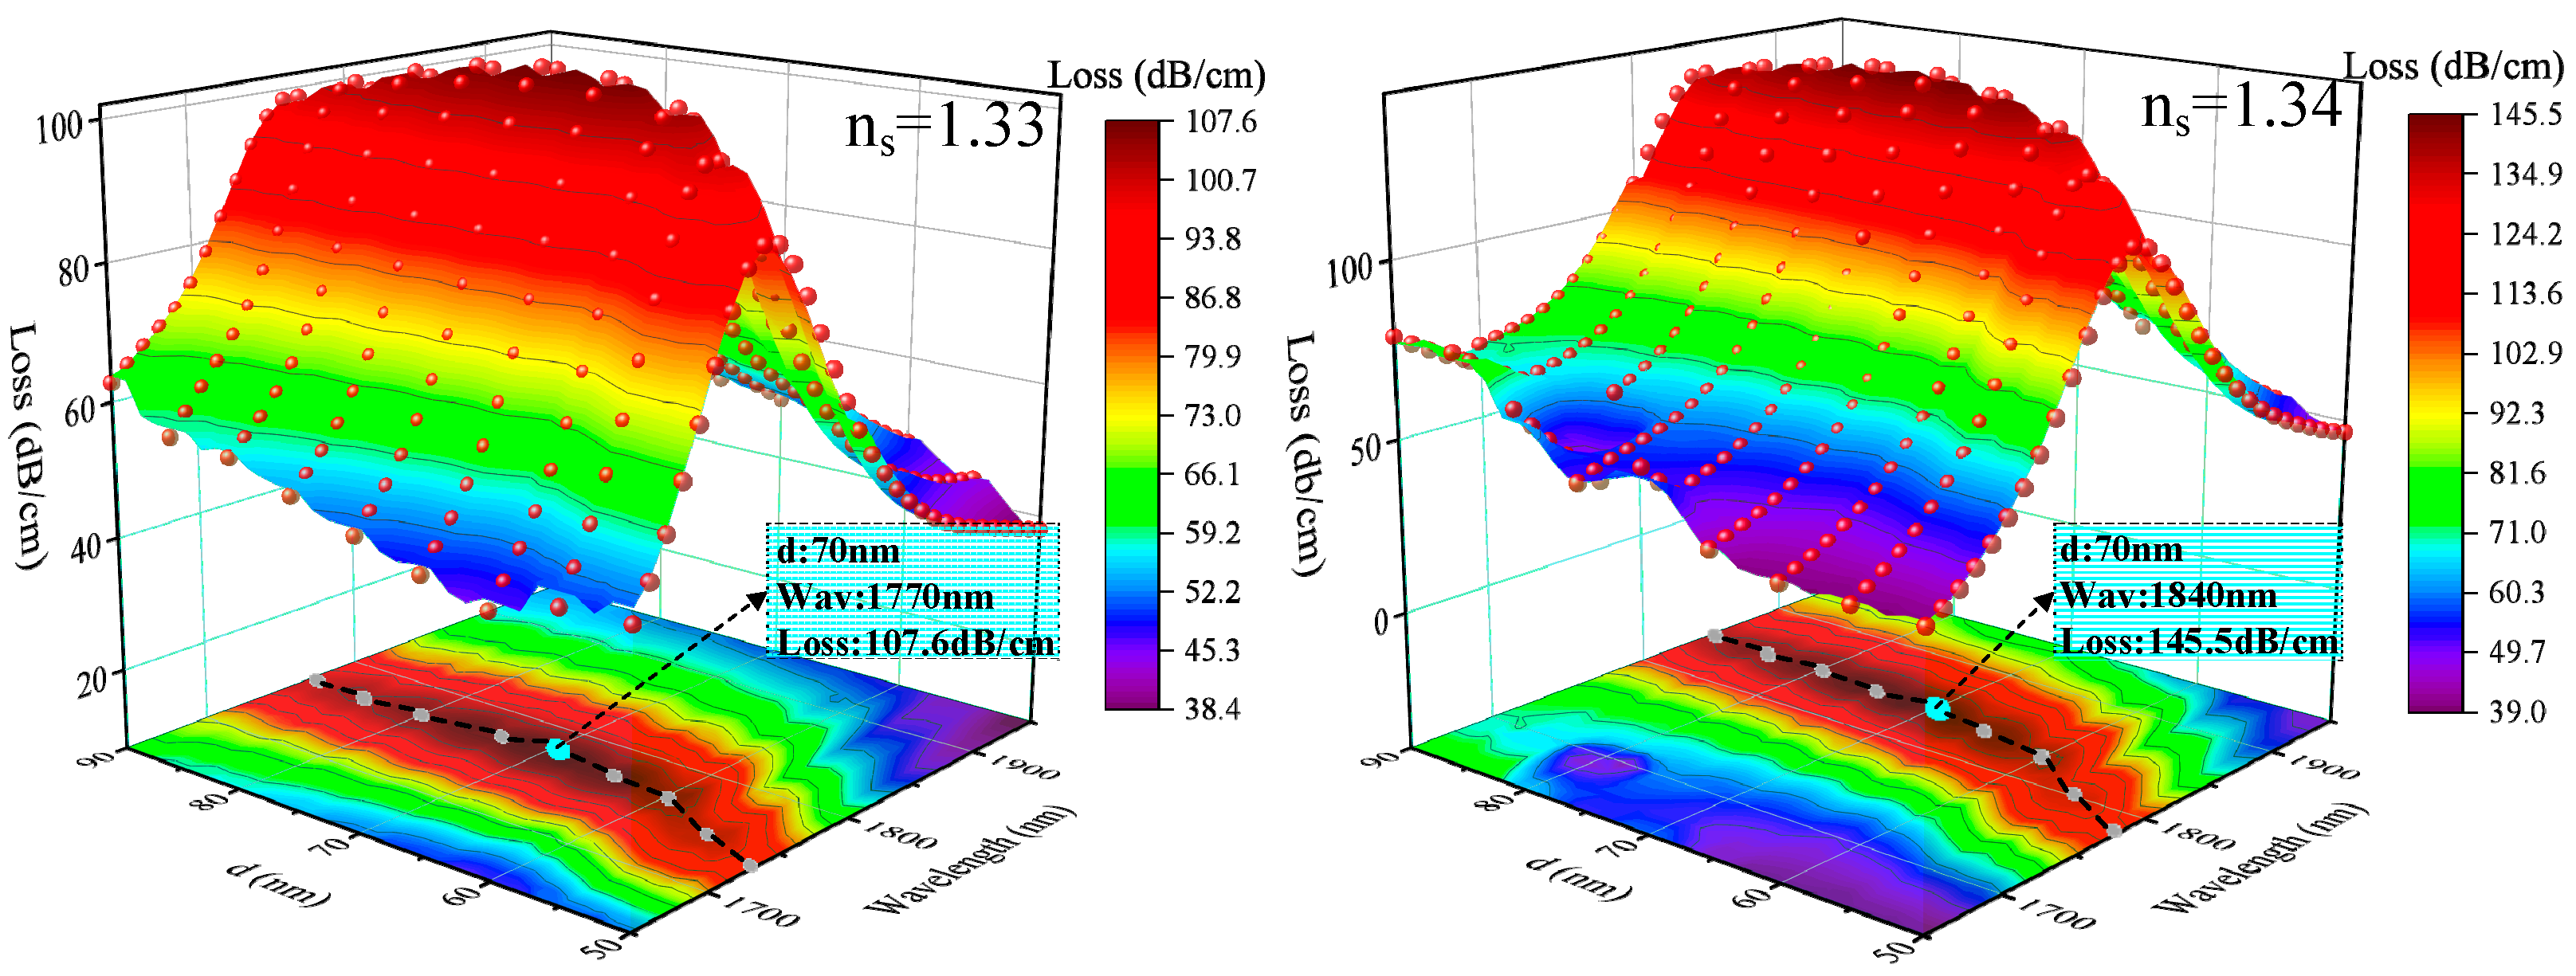
| 1.18 | 1330 | 16.48 | 2000 | 1.33 | 1770 | 107.62 | 7000 |
| 1.19 | 1350 | 17.71 | 1000 | 1.34 | 1840 | 145.64 | 8000 |
| 1.20 | 1360 | 19.06 | 2000 | 1.35 | 1920 | 215.12 | 9000 |
| 1.21 | 1380 | 20.60 | 1000 | 1.36 | 2010 | 371.76 | 13,000 |
| 1.22 | 1390 | 22.30 | 2000 | 1.37 | 2140 | 315.63 | NA |
| Design | ns Range | Wavelength Range (nm) | Max WS (nm/RIU) | Ave WS (nm/RIU) |
|---|---|---|---|---|
| Au nanowires [20] | 1.33–1.36 | 599–768 | 9000 | 5500 |
| Au nanowires, Low RI [38] | 1.27–1.36 | 640–960 | 9100 | 2350 |
| Ag nanowire, Broad Range [39] | 1.33–1.42 | 530–920 | 10,300 | 4300 |
| Ag nanowire [25] | 1.33–1.38 | 1097–1570 | 9314 | 4730 |
| Low RI, Broad Range, PSPR, LSPR | 1.08–1.16 | 1210–1300 | 2000 | 1125 |
| 1.17–1.27 | 1320–1510 | 4000 | 1900 | |
| 1.28–1.37 | 1540–2140 | 13,000 | 6667 |
Publisher’s Note: MDPI stays neutral with regard to jurisdictional claims in published maps and institutional affiliations. |
© 2022 by the authors. Licensee MDPI, Basel, Switzerland. This article is an open access article distributed under the terms and conditions of the Creative Commons Attribution (CC BY) license (https://creativecommons.org/licenses/by/4.0/).
Share and Cite
Xiao, G.; Su, J.; Yang, H.; Ou, Z.; Li, H.; Liu, X.; Chen, Z.; Luo, Y.; Li, J. Fiber Optic Sensor with a Gold Nanowire Group Array for Broad Range and Low Refractive Index Detection. Photonics 2022, 9, 661. https://doi.org/10.3390/photonics9090661
Xiao G, Su J, Yang H, Ou Z, Li H, Liu X, Chen Z, Luo Y, Li J. Fiber Optic Sensor with a Gold Nanowire Group Array for Broad Range and Low Refractive Index Detection. Photonics. 2022; 9(9):661. https://doi.org/10.3390/photonics9090661
Chicago/Turabian StyleXiao, Gongli, Jiapeng Su, Hongyan Yang, Zetao Ou, Haiou Li, Xingpeng Liu, Zanhui Chen, Yunhan Luo, and Jianqing Li. 2022. "Fiber Optic Sensor with a Gold Nanowire Group Array for Broad Range and Low Refractive Index Detection" Photonics 9, no. 9: 661. https://doi.org/10.3390/photonics9090661