High-Power, Narrow-Linewidth Distributed-Feedback Quantum-Cascade Laser for Molecular Spectroscopy

 , , and
Abstract
:1. Introduction
2. Methods
2.1. Manufacturing
2.2. Characterization
3. Discussion
4. Outlook
Author Contributions
Funding
Institutional Review Board Statement
Informed Consent Statement
Data Availability Statement
Conflicts of Interest
Abbreviations
| QCL | Quantum Cascade Laser |
| FWHM | Full Width Halfg Maximum |
| DFB | Distributed Feedback Bragg Reflector |
| MOPA | Master Oscillator Power Amplifier |
| FNSPD | Frequency Noise Power Spectral Density |
| CW | Continuous Wave |
References
- Faist, J.; Capasso, F.; Sivco, D.L.; Sirtori, C.; Hutchinson, A.L.; Cho, A.Y. Quantum Cascade Laser. Science 1994, 264, 553. [Google Scholar] [CrossRef] [PubMed]
- Santagata, R.; Tran, D.B.A.; Argence, B.; Lopez, O.; Tokunaga, S.K.; Wiotte, F.; Mouhamad, H.; Goncharov, A.; Abgrall, M.; Coq, Y.L.; et al. High-precision methanol spectroscopy with a widely tunable SI-traceable frequency-comb-based mid-infrared QCL. Optica 2019, 6, 411. [Google Scholar] [CrossRef]
- Genner, A.; Martín-Mateos, P.; Moser, H.; Lendl, B. A Quantum Cascade Laser-Based Multi-Gas Sensor for Ambient Air Monitoring. Sensors 2020, 20, 1850. [Google Scholar] [CrossRef] [PubMed]
- Krötz, P.; Stupar, D.; Krieg, J.; Sonnabend, G.; Sornig, M.; Giorgetta, F.; Baumann, E.; Giovannini, M.; Hoyler, N.; Hofstetter, D.; et al. Applications for quantum cascade lasers and detectors in mid-infrared high-resolution heterodyne astronom. Appl. Phys. B 2008, 90, 187. [Google Scholar] [CrossRef]
- Germann, M.; Tong, X.; Willitsch, S. Observation of electric-dipole-forbidden infrared transitions in cold molecular ions. Nat. Phys. 2014, 10, 820. [Google Scholar] [CrossRef]
- Argence, B.; Chanteau, B.; Lopez, O.; Nicolodi, D.; Abgrall, M.; Chardonnet, C.; Daussy, C.; Darquié, B.; Le Coq, Y.; Amy-Klein, A. Quantum cascade laser frequency stabilization at the sub-Hz level. Nat. Photonics 2015, 9, 456. [Google Scholar] [CrossRef]
- Myers, T.L.; Williams, R.M.; Taubman, M.S.; Gmachl, C.; Capasso, F.; Sivco, D.L.; Baillargeon, J.N.; Cho, A.Y. Free-running frequency stability of mid-infrared quantum cascade lasers. Opt. Lett. 2002, 27, 170. [Google Scholar] [CrossRef]
- Tombez, L.; Francesco, J.D.; Schilt, S.; Domenico, G.D.; Faist, J.; Thomann, P.; Hofstetter, D. Frequency noise of free-running 4.6 μm distributed feedback quantum cascade lasers near room temperature. Opt. Lett. 2011, 36, 3109. [Google Scholar] [CrossRef]
- Razeghi, M.; Slivken, S.; Bai, Y.; Gokden, B.; Darvish, S.R. High power quantum cascade lasers. New J. Phys. 2009, 11, 125017. [Google Scholar] [CrossRef]
- Bai, Y.; Bandyopadhyay, N.; Tsao, S.; Slivken, S.; Razeghi, M. Room temperature quantum cascade lasers with 27% wall plug efficiency. Appl. Phys. Lett. 2011, 98, 181102. [Google Scholar] [CrossRef]
- Lyakh, A.; Maulini, R.; Tsekoun, A.; Go, R.; Patel, C.K.N. Multiwatt long wavelength quantum cascade lasers based on high strain composition with 70% injection efficiency. Opt. Express 2012, 20, 24272. [Google Scholar] [CrossRef]
- Schawlow, A.L.; Townes, C.H. Infrared and Optical Masers. Phys. Rev. 1958, 112, 1940. [Google Scholar] [CrossRef]
- Henry, C. Theory of the linewidth of semiconductor lasers. IEEE J. Quantum Electron. 1982, 18, 259. [Google Scholar] [CrossRef]
- Aellen, T.; Maulini, R.; Terazzi, R.; Hoyler, N.; Giovannini, M.; Faist, J.; Blaser, S.; Hvozdara, L. Direct measurement of the linewidth enhancement factor by optical heterodyning of an amplitude-modulated quantum cascade laser. Appl. Phys. Lett. 2006, 89, 091121. [Google Scholar] [CrossRef]
- Hangauer, A.; Wysocki, G. Gain Compression and Linewidth Enhancement Factor in Mid-IR Quantum Cascade Lasers. IEEE J. Sel. Top. Quantum Electron. 2015, 21, 74–84. [Google Scholar] [CrossRef]
- Bartalini, S.; Borri, S.; Cancio, P.; Castrillo, A.; Galli, I.; Giusfredi, G.; Mazzotti, D.; Gianfrani, L.; De Natale, P. Observing the Intrinsic Linewidth of a Quantum-Cascade Laser: Beyond the Schawlow-Townes Limit. Phys. Rev. Lett. 2010, 104, 083904. [Google Scholar] [CrossRef]
- Yamanishi, M.; Edamura, T.; Fujita, K.; Akikusa, N.; Kan, H. Theory of the Intrinsic Linewidth of Quantum-Cascade Lasers: Hidden Reason for the Narrow Linewidth and Line-Broadening by Thermal Photons. IEEE J. Quantum Electron. 2008, 44, 12. [Google Scholar] [CrossRef]
- Najafian, K.; Meir, Z.; Willitsch, S. From megahertz to terahertz qubits encoded in molecular ions: Theoretical analysis of dipole-forbidden spectroscopic transitions in N2+. Phys. Chem. Chem. Phys. 2020, 22, 23083. [Google Scholar] [CrossRef]
- Menzel, S.; Diehl, L.; Pflügl, C.; Goyal, A.; Wang, C.; Sanchez, A.; Turner, G.; Capasso, F. Quantum cascade laser master-oscillator power-amplifier with 1.5 W output power at 300 K. Opt. Express 2011, 19, 16229–16235. [Google Scholar] [CrossRef]
- Hinkov, B.; Beck, M.; Gini, E.; Faist, J. Quantum cascade laser in a master oscillator power amplifier configuration with Watt-level optical output power. Opt. Express 2013, 21, 19180. [Google Scholar] [CrossRef]
- Faist, J.; Hofstetter, D.; Beck, M.; Aellen, T.; Rochat, M.; Blaser, S. Bound-to-continuum and two-phonon resonance, quantum-cascade lasers for high duty cycle, high-temperature operation. IEEE J. Quantum Electron. 2002, 38, 533–546. [Google Scholar] [CrossRef]
- Beck, M.; Faist, J.; Oesterle, U.; Ilegems, M.; Gini, E.; Melchior, H. Buried heterostructure quantum cascade lasers with a large optical cavity waveguide. IEEE Photonics Technol. Lett. 2000, 12, 1450–1452. [Google Scholar] [CrossRef]
- Süess, M.J.; Peretti, R.; Liang, Y.; Wolf, J.M.; Bonzon, C.; Hinkov, B.; Nida, S.; Jouy, P.; Metaferia, W.; Lourdudoss, S.; et al. Advanced Fabrication of Single-Mode and Multi-Wavelength MIR-QCLs. Photonics 2016, 3, 26. [Google Scholar] [CrossRef]
- Bertrand, M.; Franckié, M.; Forrer, A.; Faist, J. 2022; unpublished.
- Okoshi, T.; Kikuchi, K.; Nakayama, A. Novel method for high resolution measurement of laser output spectrum. Electron. Lett. 1980, 16, 630. [Google Scholar] [CrossRef]
- Ludvigsen, H.; Tossavainen, M.; Kaivola, M. Laser linewidth measurements using self-homodyne detection with short delay. Opt. Commun. 1998, 155, 180. [Google Scholar] [CrossRef]
- Baney, D.M.; Sorin, W.V. Fiber Optic Test and Measurement; Chapter 13; Prentice-Hall: Hoboken, NJ, USA, 1998. [Google Scholar]
- Bucalovic, N.; Dolgovskiy, V.; Schori, C.; Thomann, P.; Domenico, G.D.; Schilt, S. Experimental validation of a simple approximation to determine the linewidth of a laser from its frequency noise spectrum. Appl. Opt. 2012, 51, 4582. [Google Scholar] [CrossRef] [PubMed]
- Domenico, G.D.; Schilt, S.; Thomann, P. Simple approach to the relation between laser frequency noise and laser line shape. Appl. Opt. 2010, 49, 4801. [Google Scholar] [CrossRef]
- Gordon, I.; Rothman, L.; Hargreaves, R.; Hashemi, R.; Karlovets, E.; Skinner, F.; Conway, E.; Hill, C.; Kochanov, R.; Tan, Y.; et al. The HITRAN2020 molecular spectroscopic database. J. Quant. Spectrosc. Radiat. Transf. 2022, 277, 107949. [Google Scholar] [CrossRef]
- Borri, S.; Bartalini, S.; Pastor, P.C.; Galli, I.; Giusfredi, G.; Mazzotti, D.; Yamanishi, M.; De Natale, P. Frequency-Noise Dynamics of Mid-Infrared Quantum Cascade Lasers. IEEE J. Quantum Electron. 2011, 47, 984. [Google Scholar] [CrossRef]
- Sergachev, I.; Maulini, R.; Gresch, T.; Blaser, S.; Bismuto, A.; Müller, A.; Bidaux, Y.; Südmeyer, T.; Schilt, S. Frequency stability of a dual wavelength quantum cascade laser. Opt. Express 2017, 25, 11027. [Google Scholar] [CrossRef]
- Bartalini, S.; Borri, S.; Galli, I.; Giusfredi, G.; Mazzotti, D.; Edamura, T.; Akikusa, N.; Yamanishi, M.; Natale, P.D. Measuring frequency noise and intrinsic linewidth of a room-temperature DFB quantum cascade laser. Opt. Express 2011, 19, 17996. [Google Scholar] [CrossRef] [PubMed]
- Tombez, L.; Schilt, S.; Francesco, J.D.; Thomann, P.; Hofstetter, D. Temperature dependence of the frequency noise in a mid-IR DFB quantum cascade laser from cryogenic to room temperature. Opt. Express 2012, 20, 6851. [Google Scholar] [CrossRef] [PubMed]
- Cappelli, F.; Galli, I.; Borri, S.; Giusfredi, G.; Cancio, P.; Mazzotti, D.; Montori, A.; Akikusa, N.; Yamanishi, M.; Bartalini, S.; et al. Subkilohertz linewidth room-temperature mid-infrared quantum cascade laser using a molecular sub-Doppler reference. Opt. Lett. 2012, 37, 4811. [Google Scholar] [CrossRef] [PubMed]
- Borri, S.; Galli, I.; Cappelli, F.; Bismuto, A.; Bartalini, S.; Cancio, P.; Giusfredi, G.; Mazzotti, D.; Faist, J.; Natale, P.D. Direct link of a mid-infrared QCL to a frequency comb by optical injection. Opt. Lett. 2012, 37, 1011. [Google Scholar] [CrossRef]
- Tombez, L.; Schilt, S.; Hofstetter, D.; Südmeyer, T. Active linewidth-narrowing of a mid-infrared quantum cascade laser without optical reference. Opt. Lett. 2013, 38, 5079. [Google Scholar] [CrossRef]
- Sergachev, I.; Maulini, R.; Bismuto, A.; Blaser, S.; Gresch, T.; Bidaux, Y.; Müller, A.; Schilt, S.; Südmeyer, T. All-electrical frequency noise reduction and linewidth narrowing in quantum cascade lasers. Opt. Lett. 2014, 39, 6411. [Google Scholar] [CrossRef]
- Fasci, E.; Coluccelli, N.; Cassinerio, M.; Gambetta, A.; Hilico, L.; Gianfrani, L.; Laporta, P.; Castrillo, A.; Galzerano, G. Narrow-linewidth quantum cascade laser at 8.6 μm. Opt. Lett. 2014, 39, 4946. [Google Scholar] [CrossRef]


| Current State of the Art | |||||
|---|---|---|---|---|---|
| Pow. [mW] | FWHM [kHz] | Obs. Time [ms] | WL [m] | Author | Ref. |
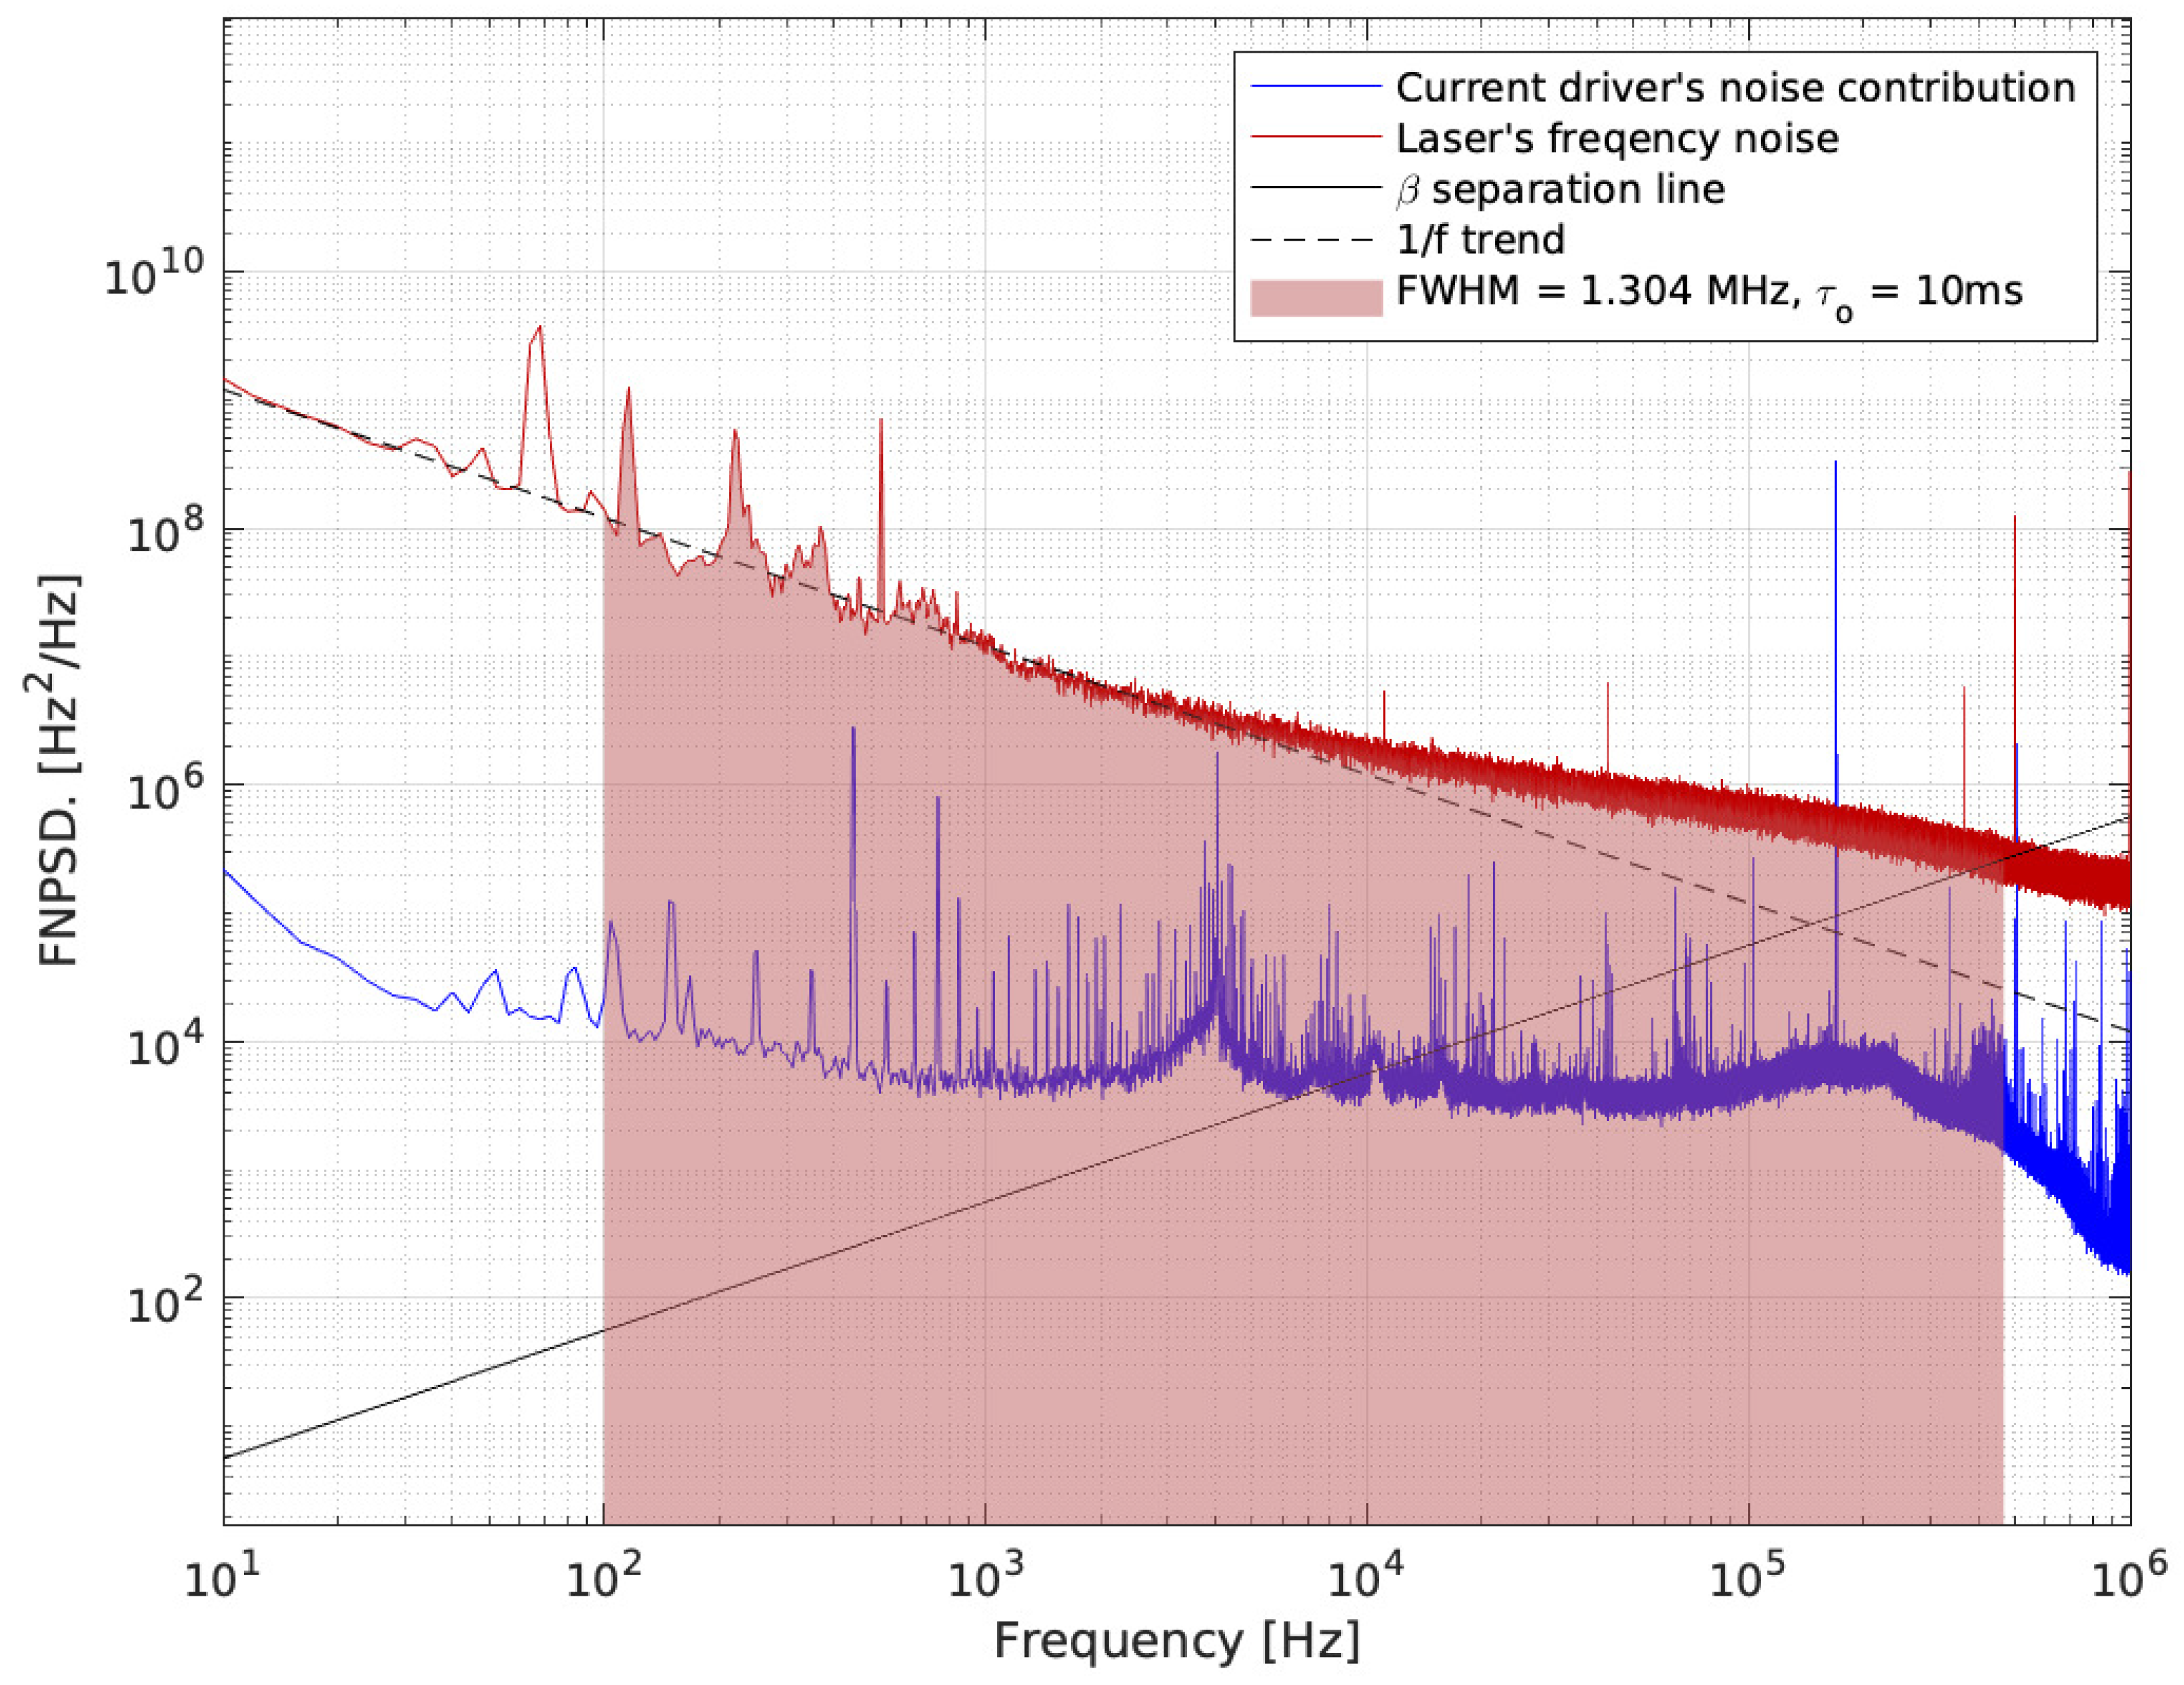
| >300 | 1300 | 10 | 4.56 | Bertrand 2022 | this work |
| 20 | 400 | 10 | 4.36 | Bartalini 2011 | [33] |
| 6 | 550 | 5 | 4.6 | Tombez 2011 | [8] |
| 20 | 770 | 10 | 4.56 | Tombez 2012 | [34] |
| 10 | 500 | 1 | 4.3 | Cappelli 2012 | [35] |
| 20 | 2750 | 50 | 4.67 | Borri 2012 | [36] |
| 10 | 2000 | 10 | 4.55 | Tombez 2013 | [37] |
| 20 | 1700 | 10 | 7.9 | Sergachev 2014 | [38] |
| 50 | 3200 | 1 | 8.6 | Fasci 2014 | [39] |
| 40 | 300 | 1000 | 10.3 | Argence 2015 | [6] |
| 150 | 380 | 1 | 4.5 | Sergachev 2017 | [32] |
Publisher’s Note: MDPI stays neutral with regard to jurisdictional claims in published maps and institutional affiliations. |
© 2022 by the authors. Licensee MDPI, Basel, Switzerland. This article is an open access article distributed under the terms and conditions of the Creative Commons Attribution (CC BY) license (https://creativecommons.org/licenses/by/4.0/).
Share and Cite
Bertrand, M.; Shlykov, A.; Shahmohamadi, M.; Beck, M.; Willitsch, S.; Faist, J. High-Power, Narrow-Linewidth Distributed-Feedback Quantum-Cascade Laser for Molecular Spectroscopy. Photonics 2022, 9, 589. https://doi.org/10.3390/photonics9080589
Bertrand M, Shlykov A, Shahmohamadi M, Beck M, Willitsch S, Faist J. High-Power, Narrow-Linewidth Distributed-Feedback Quantum-Cascade Laser for Molecular Spectroscopy. Photonics. 2022; 9(8):589. https://doi.org/10.3390/photonics9080589
Chicago/Turabian StyleBertrand, Mathieu, Aleksandr Shlykov, Mehran Shahmohamadi, Mattias Beck, Stefan Willitsch, and Jérôme Faist. 2022. "High-Power, Narrow-Linewidth Distributed-Feedback Quantum-Cascade Laser for Molecular Spectroscopy" Photonics 9, no. 8: 589. https://doi.org/10.3390/photonics9080589