Communication

Convolution Error Reduction for a Fabry–Pérot-Based Linewidth Measurement: A Theoretical and Experimental Study

1
Center for Advanced Laser Technology, Hebei University of Technology, Tianjin 300401, China
2
Hebei Key Laboratory of Advanced Laser Technology and Equipment, Tianjin 300401, China
*
Authors to whom correspondence should be addressed.
Photonics 2022, 9(12), 1004; https://doi.org/10.3390/photonics9121004
Submission received: 25 October 2022 / Revised: 11 December 2022 / Accepted: 14 December 2022 / Published: 19 December 2022

Abstract

:
Linewidth measurement of a short pulse single-longitudinal mode laser with a low repetition rate has been a big challenge. Although the Fabry–Pérot (FP) etalon in combination with a beam profiler is an effective approach to measure the linewidth, the convolution error introduced by the inherent transmission spectrum width of an FP restricts the measurement accuracy. Here, the source of convolutional errors of the FP etalon-based linewidth measurement is analyzed, and the convolutional fitting method is proposed to reduce the errors. The results show that the linewidth measurement using the FP cavity with low reflectance (95%) can achieve the same resolution as that with high reflectance (99.5%) based on this convolution error reduction method. The study provides a simple approach to accurately measuring the linewidth of pulsed lasers, even with low energy.

1. Introduction

As one of the most important parameters of lasers, linewidth has a bearing on how and where different laser sources can be applied [1,2,3,4,5]. Although the linewidth does not play a critical role in some fields dominated by power and wavelength, lasers with narrow linewidth are necessary for the applications, such as high-resolution spectroscopy and coherent optical communication [6,7,8,9,10]. At present, the primary methods to measure laser linewidth include optical spectrometer, beat frequency method [11,12,13,14,15,16,17], Fabry-Pérot (FP) scanning interferometer [18,19], and FP etalon combined with a camera-based beam profiler (CBP) [20,21,22,23]. For continuous or quasi-continuous lasers, the spectrometer method, beat frequency method, and FP interferometer can measure the laser linewidth effectively. However, in the case of lasers with a low repetition rate and short-pulse duration, these methods are difficult to increase the sampling rate [24,25,26,27,28]. The FP etalon combined with CBP to measure the laser linewidth does not have a strict requirement for the repetition rate of laser and is, therefore, well suited for the linewidth measurement of pulsed lasers.
Although algorithms such as pixel rotation can eliminate errors caused by pixel size, there are still some inaccuracies associated with the linewidth measurement results due to the presence of transmission spectrum width (TSW) [29,30]. The interference spectrum characterized by the interference circle is supposed to be the convolution of the intrinsic laser spectrum and the transmission spectrum of FP etalon, and the resulting error is the convolution error. The higher the reflectivity of FP, the more accurate the linewidth measurement results, but the high reflectivity etalon has a high insertion loss, so only low-reflectivity etalon can be used for low-power lasers. Hence, it is particularly important to find a way to reduce the convolution error that is critical to improving the practicality of line width measurement [30,31].
In this paper, we have proposed an algorithm for convolution error reduction of FP etalon-based laser linewidth measurement. First, the interference circle of the laser was measured using different reflectance FP etalon, and the interference linewidths were determined by Gaussian fitting. Then, the sources of convolution errors and their effects on linewidth results were analyzed. Finally, the convolution error is significantly reduced by the convolutional fitting method, which can improve the measurement accuracy. This work is of significant importance to accurately measure the linewidth of low-power laser using low-reflectivity etalons.

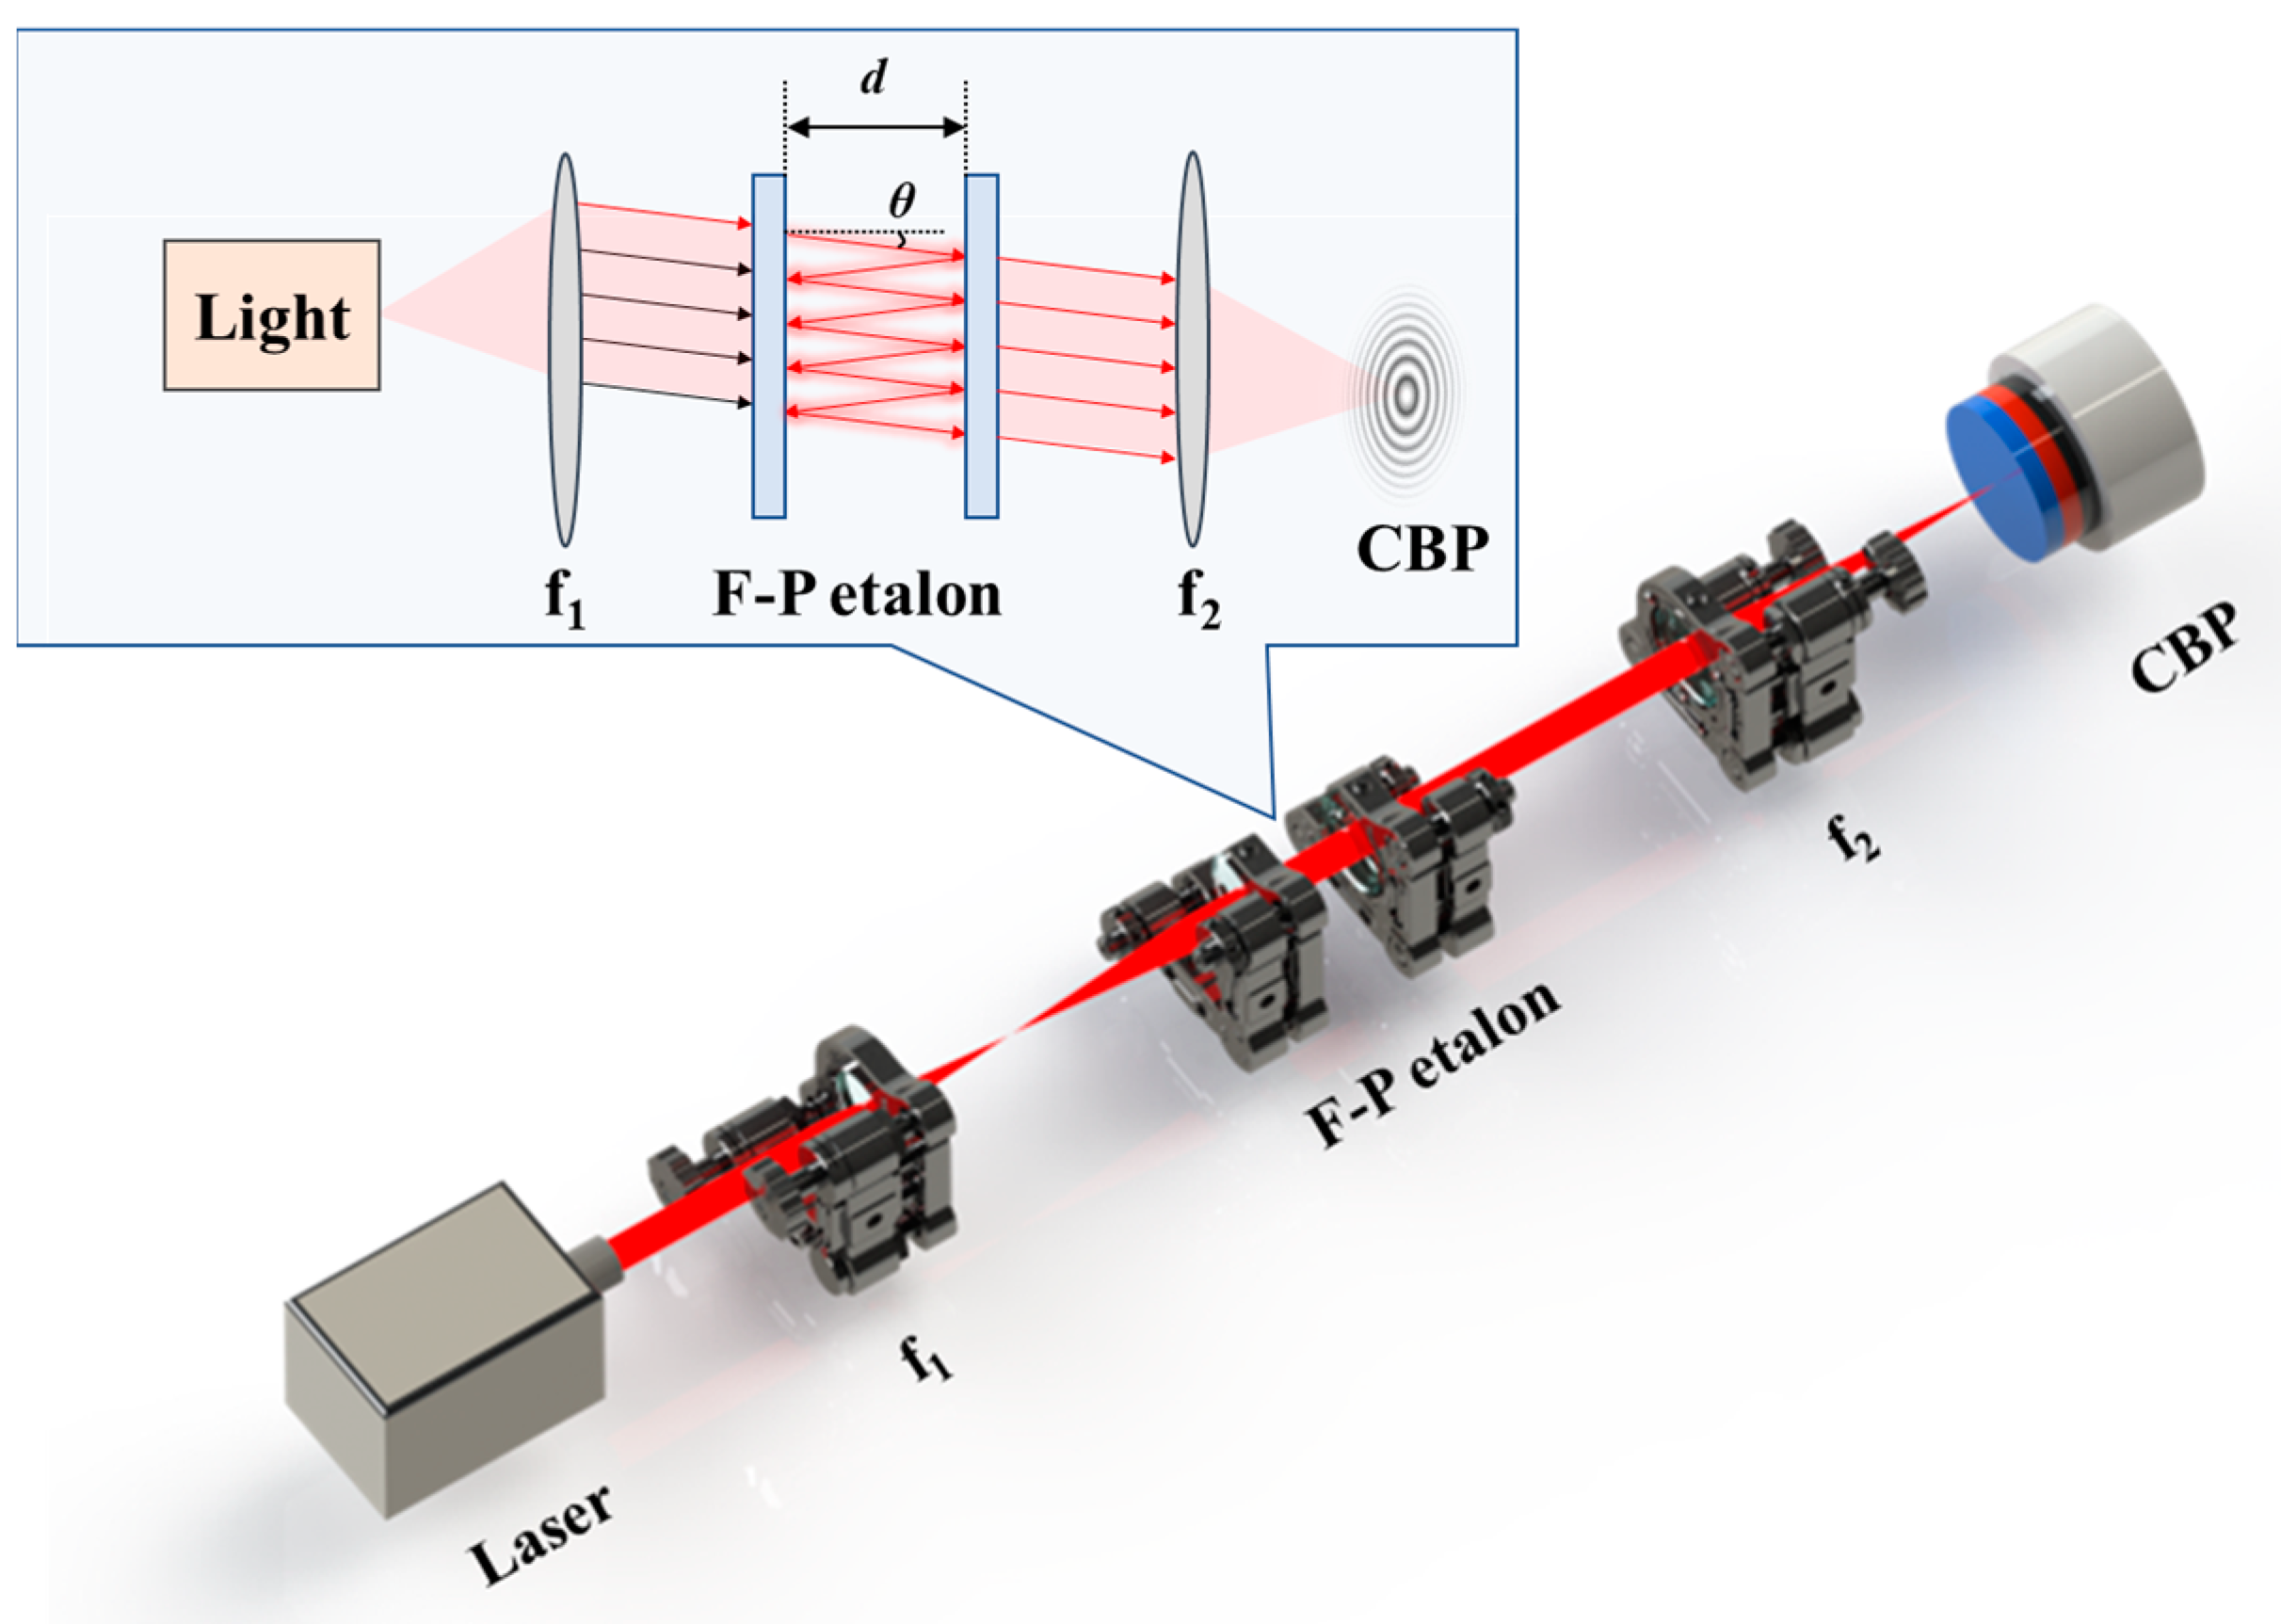
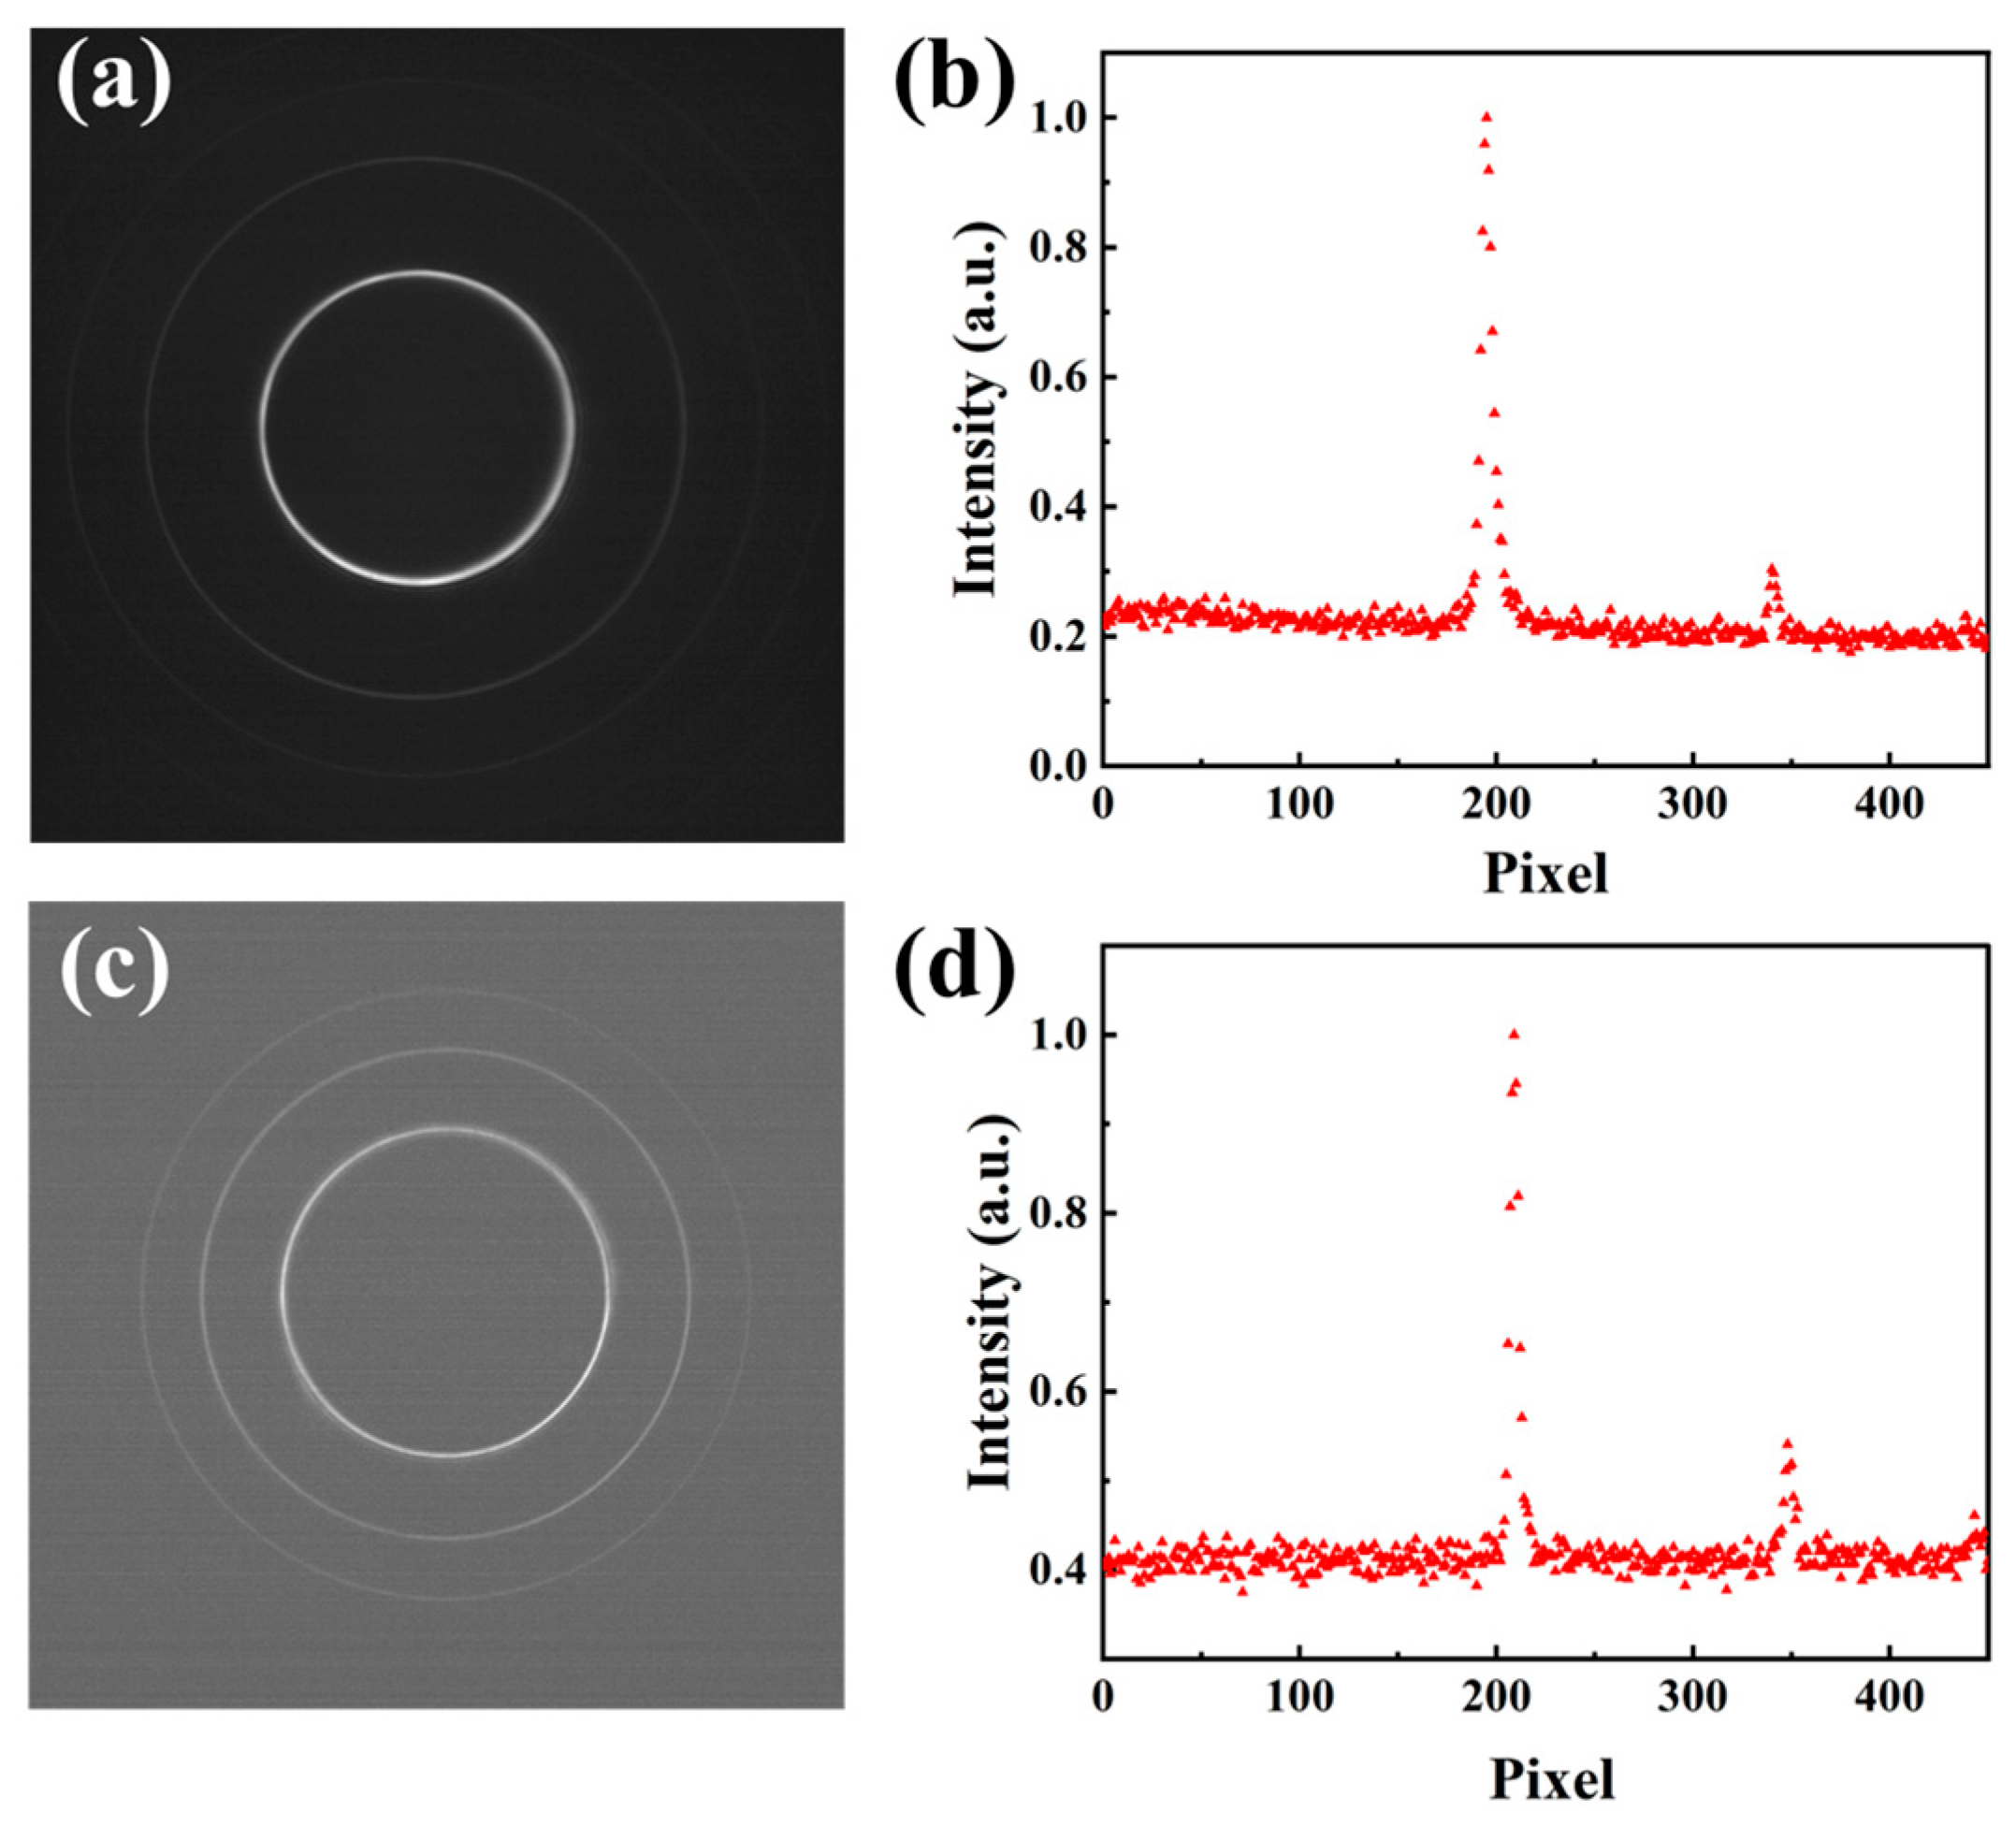
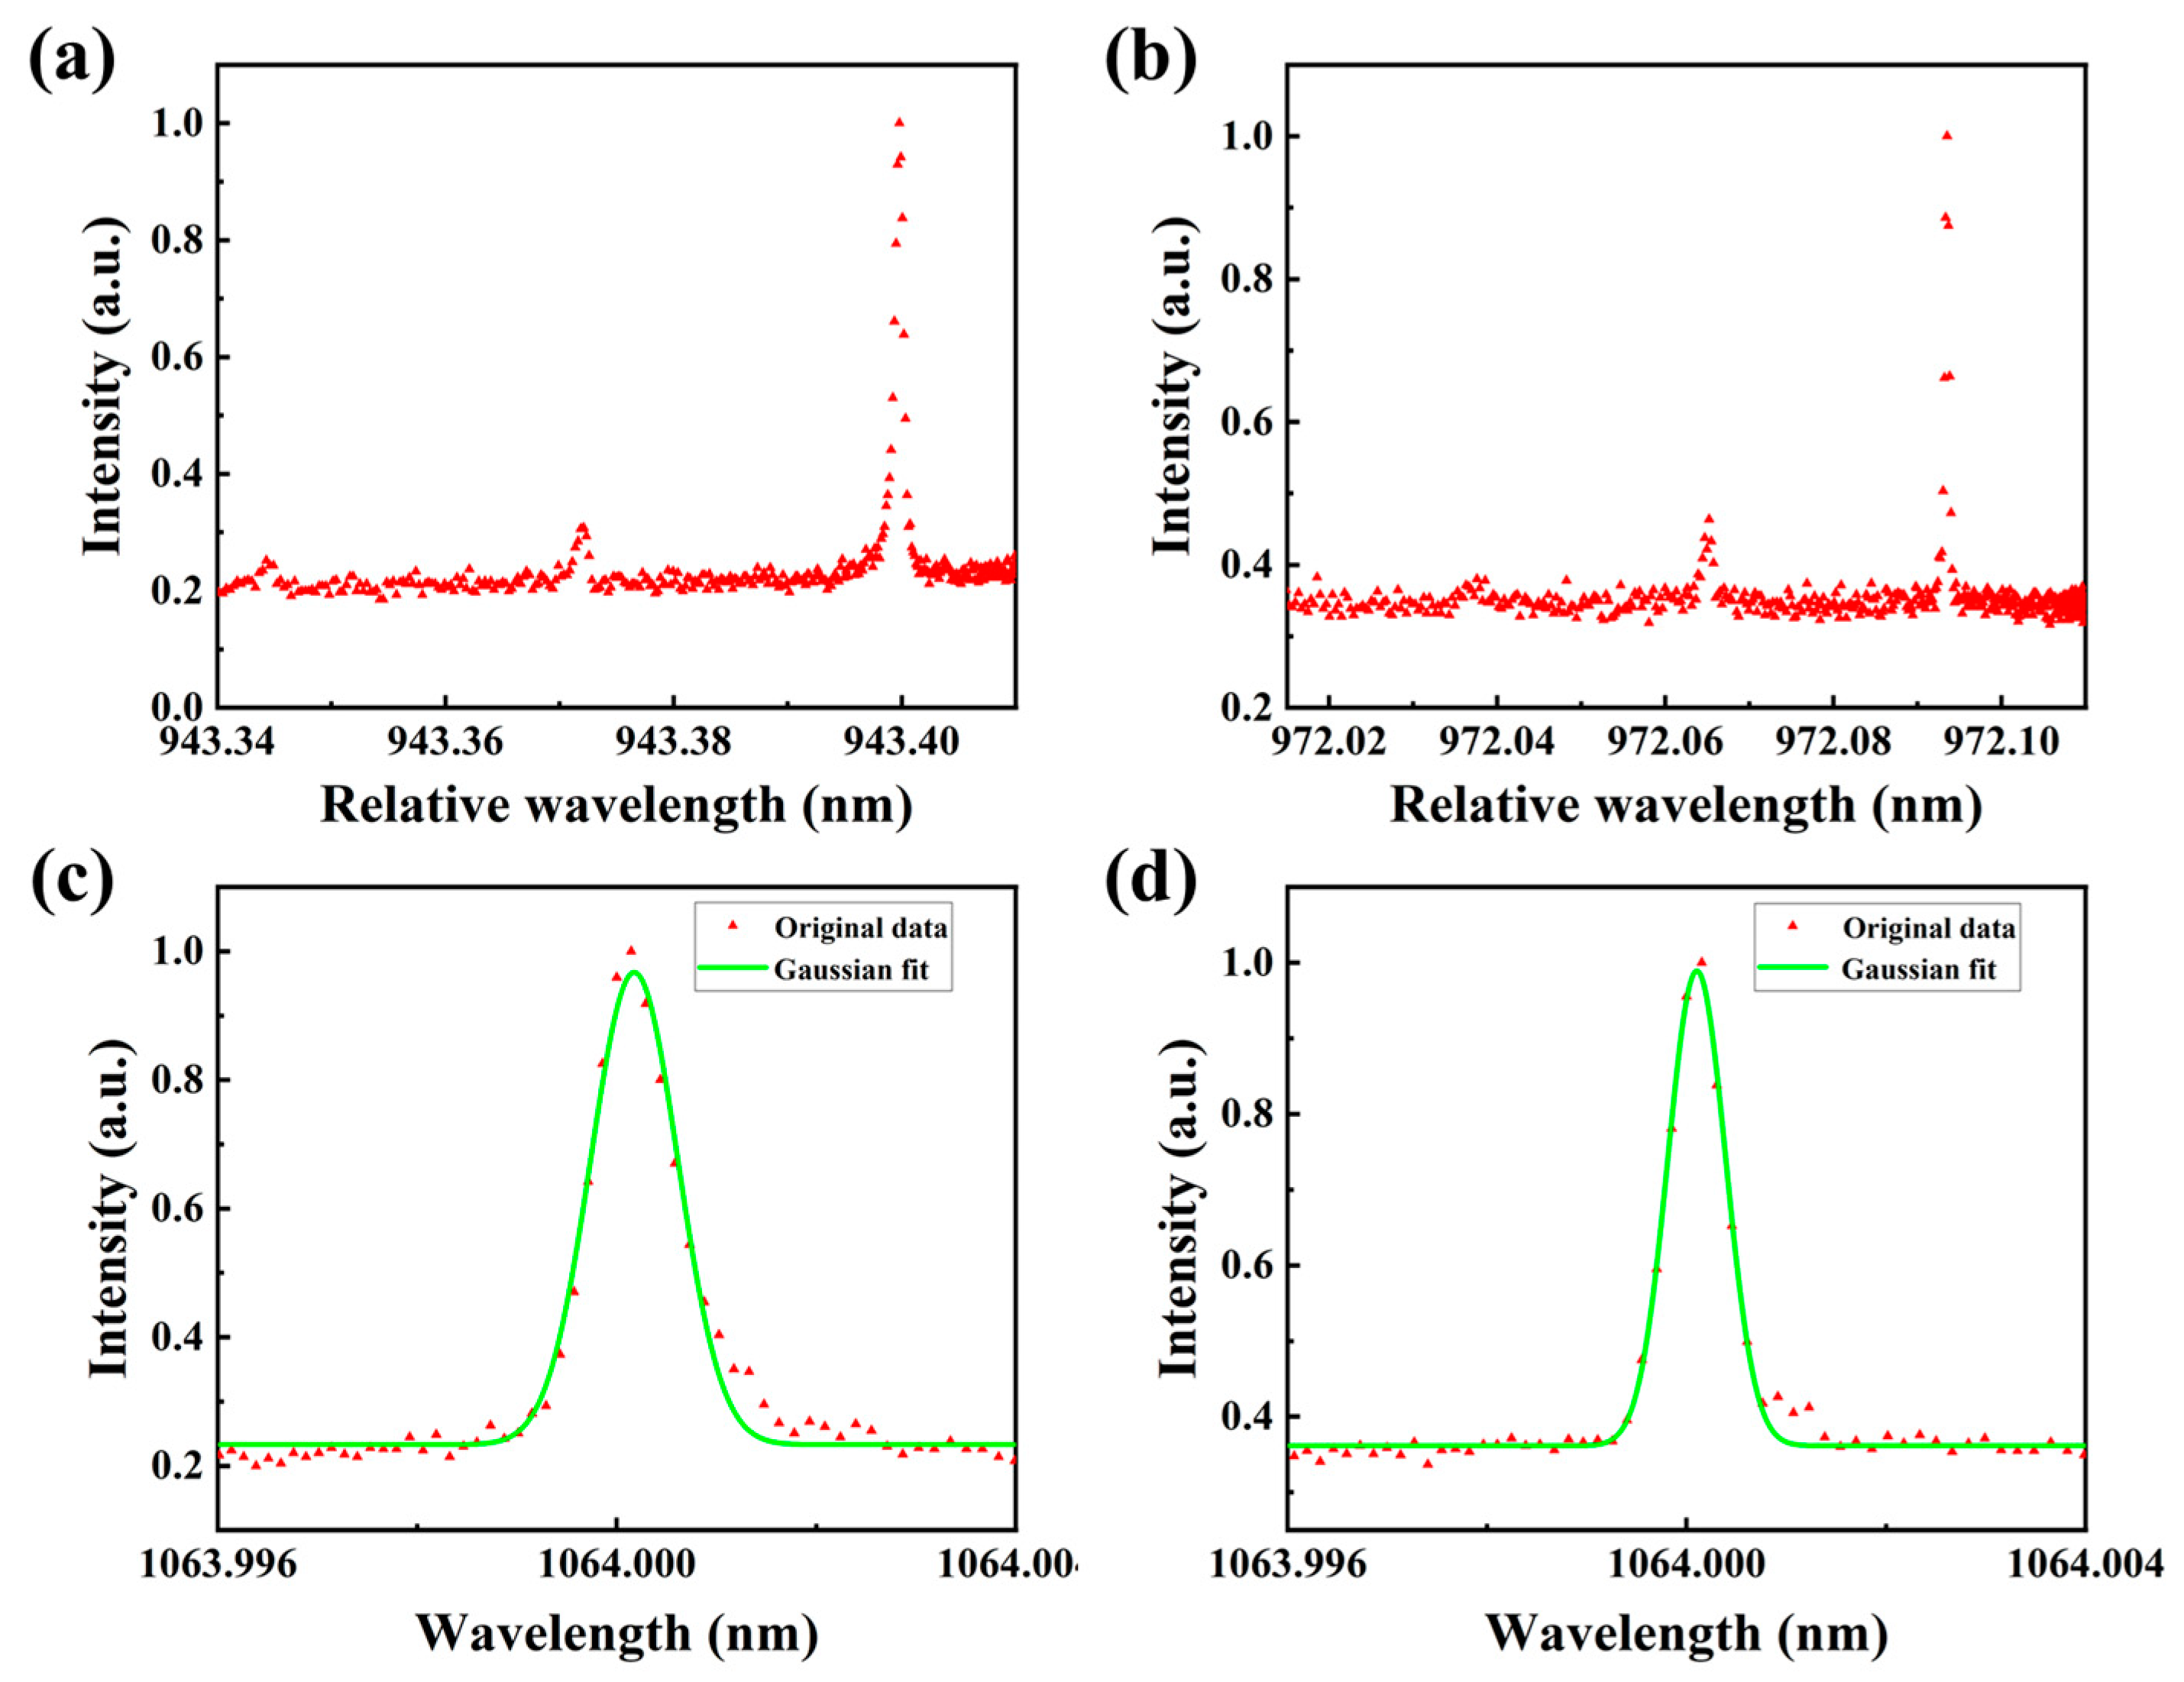
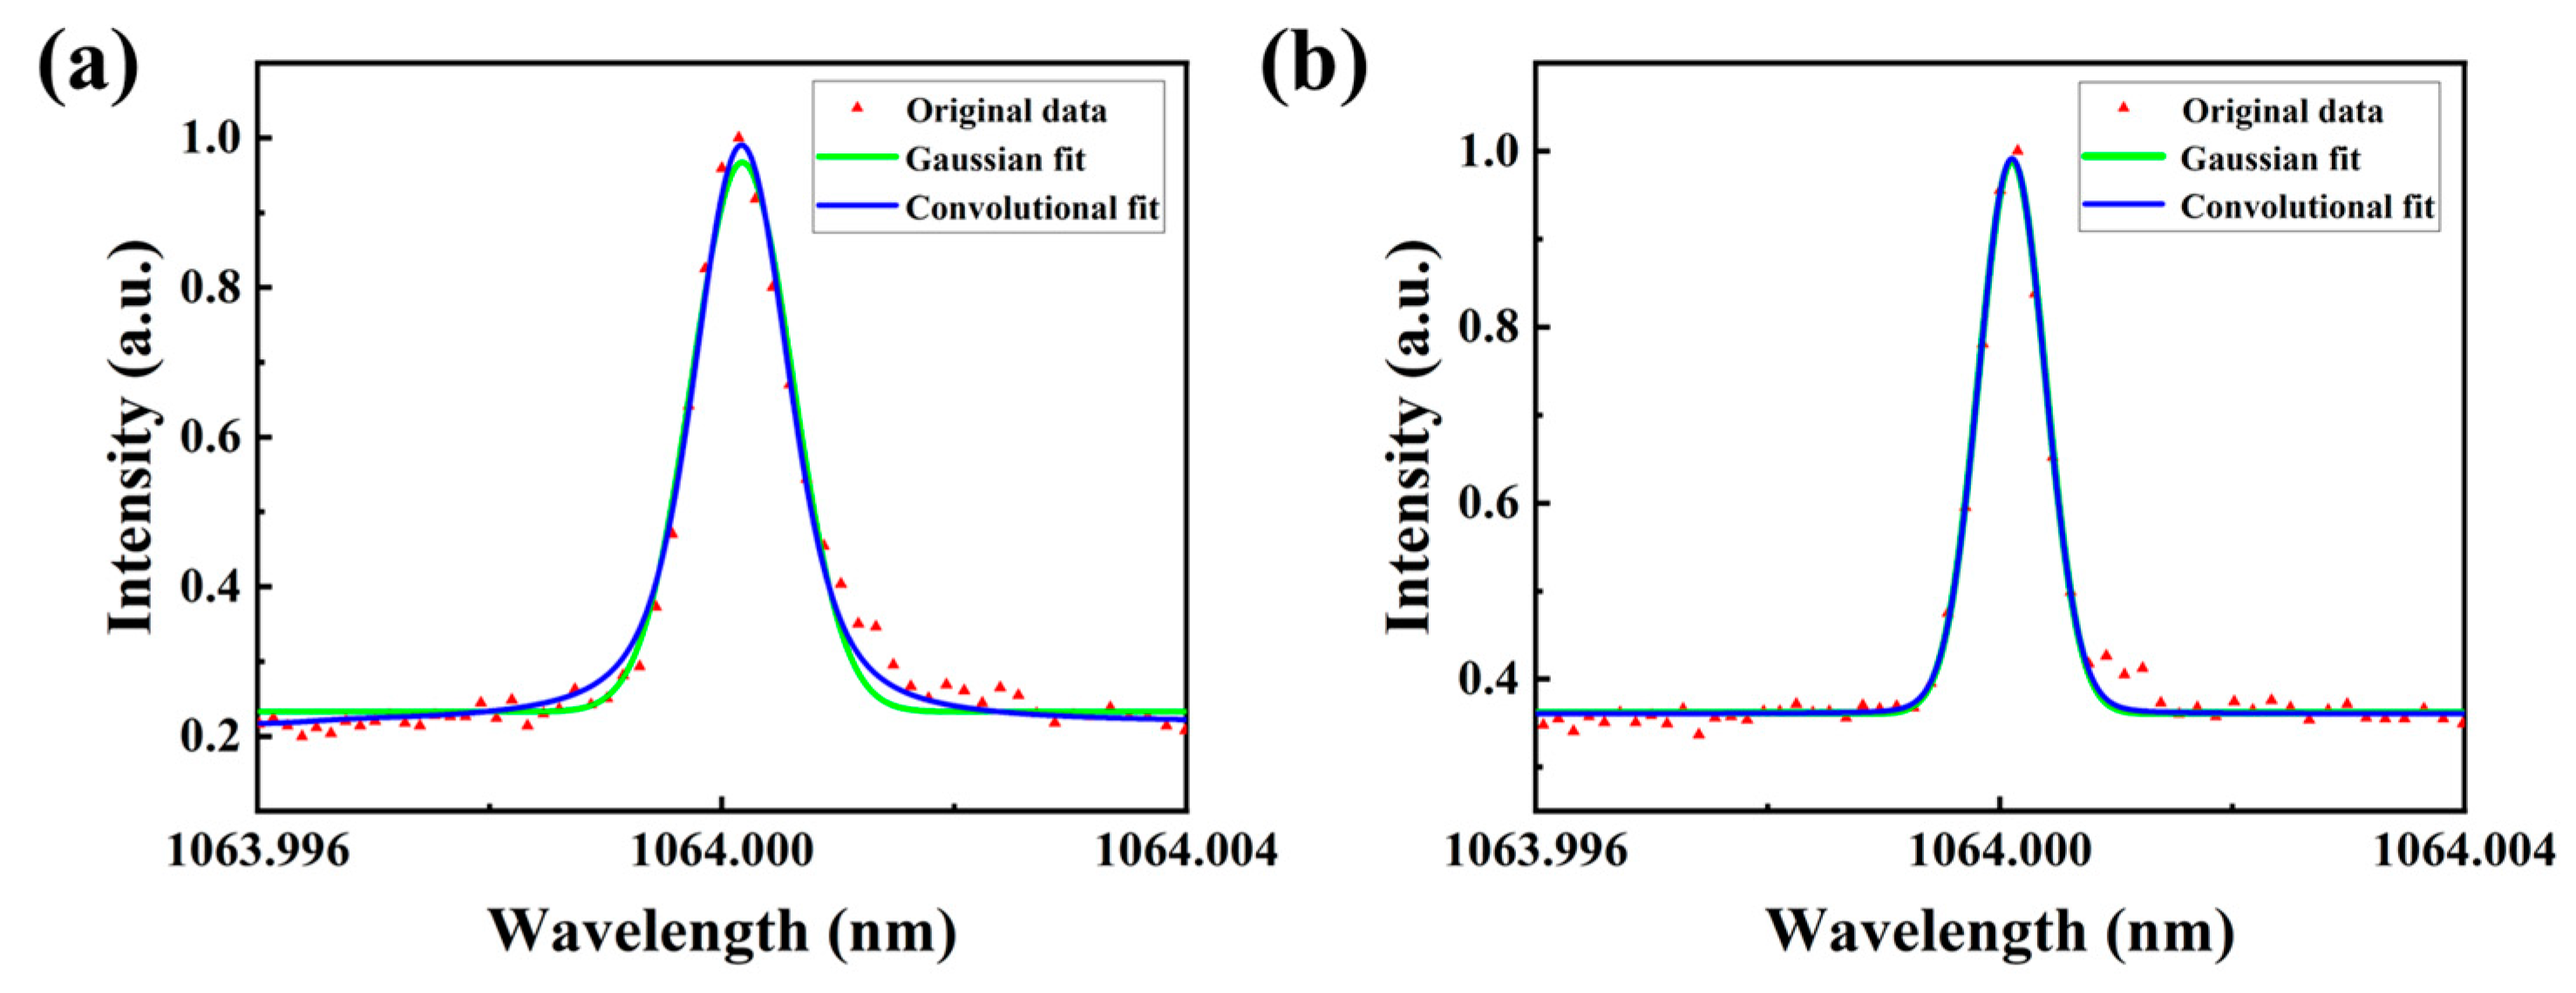
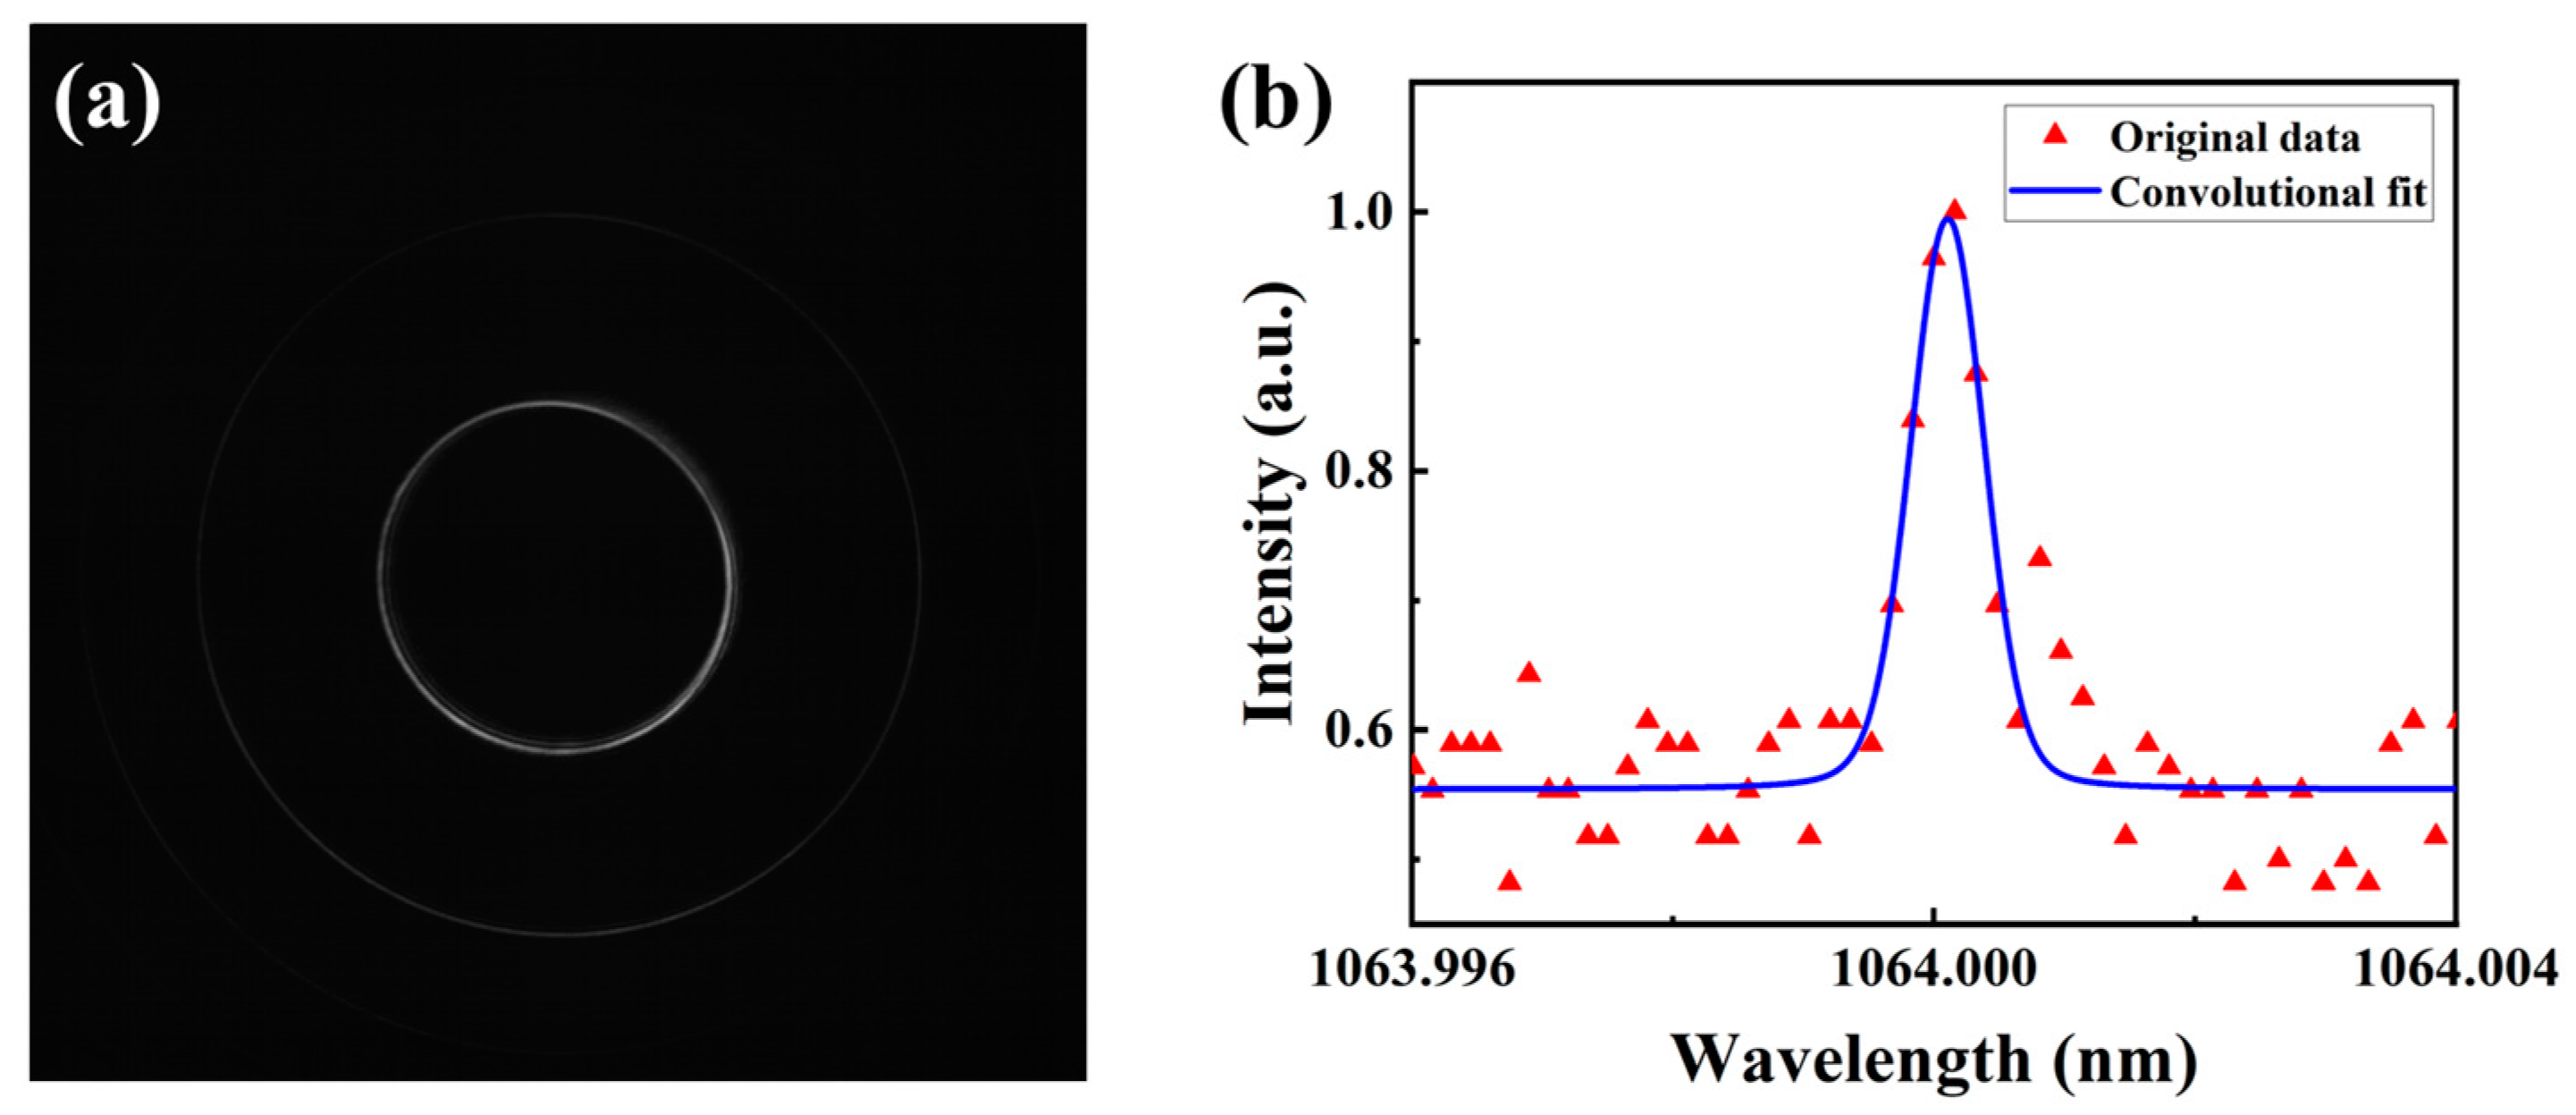
2. Experimental Setup and Gaussian Fit

The experimental setup based on the principle of equal inclination interference is shown in Figure 1. The laser to be measured is a passively Q-switched single-longitudinal-mode laser producing an output pulse width of 10 ns and repetition rate of 10 Hz [32,33,34], which has an output energy of ~10 mJ. The longitudinal-mode interval of the cavity is 3 GHz, and the theoretical linewidth of the cavity model is 260.7 MHz. The lens f1 is used for beam coupling; the interference phenomena occur at the focus of f2; the free spectrum range of this etalon is 7.5 GHz; The CBP (DataRay WinCamd-LCM) has a resolution of 1024 × 1024 with a pixel size of 11 μm.
The interference circles generated by the FP etalon with 95% and 99.5% reflectivity are shown in Figure 2a,c, respectively, which will be further processed by computer. One row of data extracted from a straight line through the center of the circle is drawn as a scatter plot as shown in Figure 2b,d.
The scatter plot in Figure 2 needs to be fitted with a Gaussian function to obtain the linewidths:
y = e ( λ λ 0 ) 2 2 ( Γ 2 2 ln 2 ) 2
where λ 0 is the central wavelength, and Γ is the full width at half maxima (FWHM) of curves. Since the fitting of Equation (1) is wavelength-fitting, it is necessary to change the abscissa of Figure 2b,d in order to obtain the linewidths. The interference phenomena occur when:
2 n d · c o s θ = m λ ,
where n is the refractive index of the FP etalon substrate, d is the distance of the FP etalon, and θ is the refraction angle of the incident light. We find that λ is linearly related to c o s θ and not linearly related to the number of pixels, so the FWHM obtained by its fit is not the linewidth of the laser. The abscissa of the scatter plot in Figure 2 is linearly processed as shown in Figure 3.
We transformed the abscissa of the scatter plot in Figure 3 into relative wavelength based on Equation (3) and the results are shown in Figure 4a,b.
λ r = c o s θ · F S R s p a c e ,
where λ r is the relative wavelength, F S R is the free spectral range of the FP etalon, and s p a c e is the distance between the two peaks in Figure 3. We chose one peak and translated its abscissa to characterize the spectrum of the laser, a Gaussian fit was further used to determine the linewidth (as shown in Figure 4c,d). As each pulse of the pulsed laser is generated independently, there may be a slight difference between the linewidths of each pulse. We, therefore, took multiple interferometric images and repeated the above steps several times, using the average value to characterize the linewidth of the laser. Taking measure errors into account, the measurement results are 255.4   ±   3.5   MHz and 169.2   ±   3.2   MHz ,   respectively .

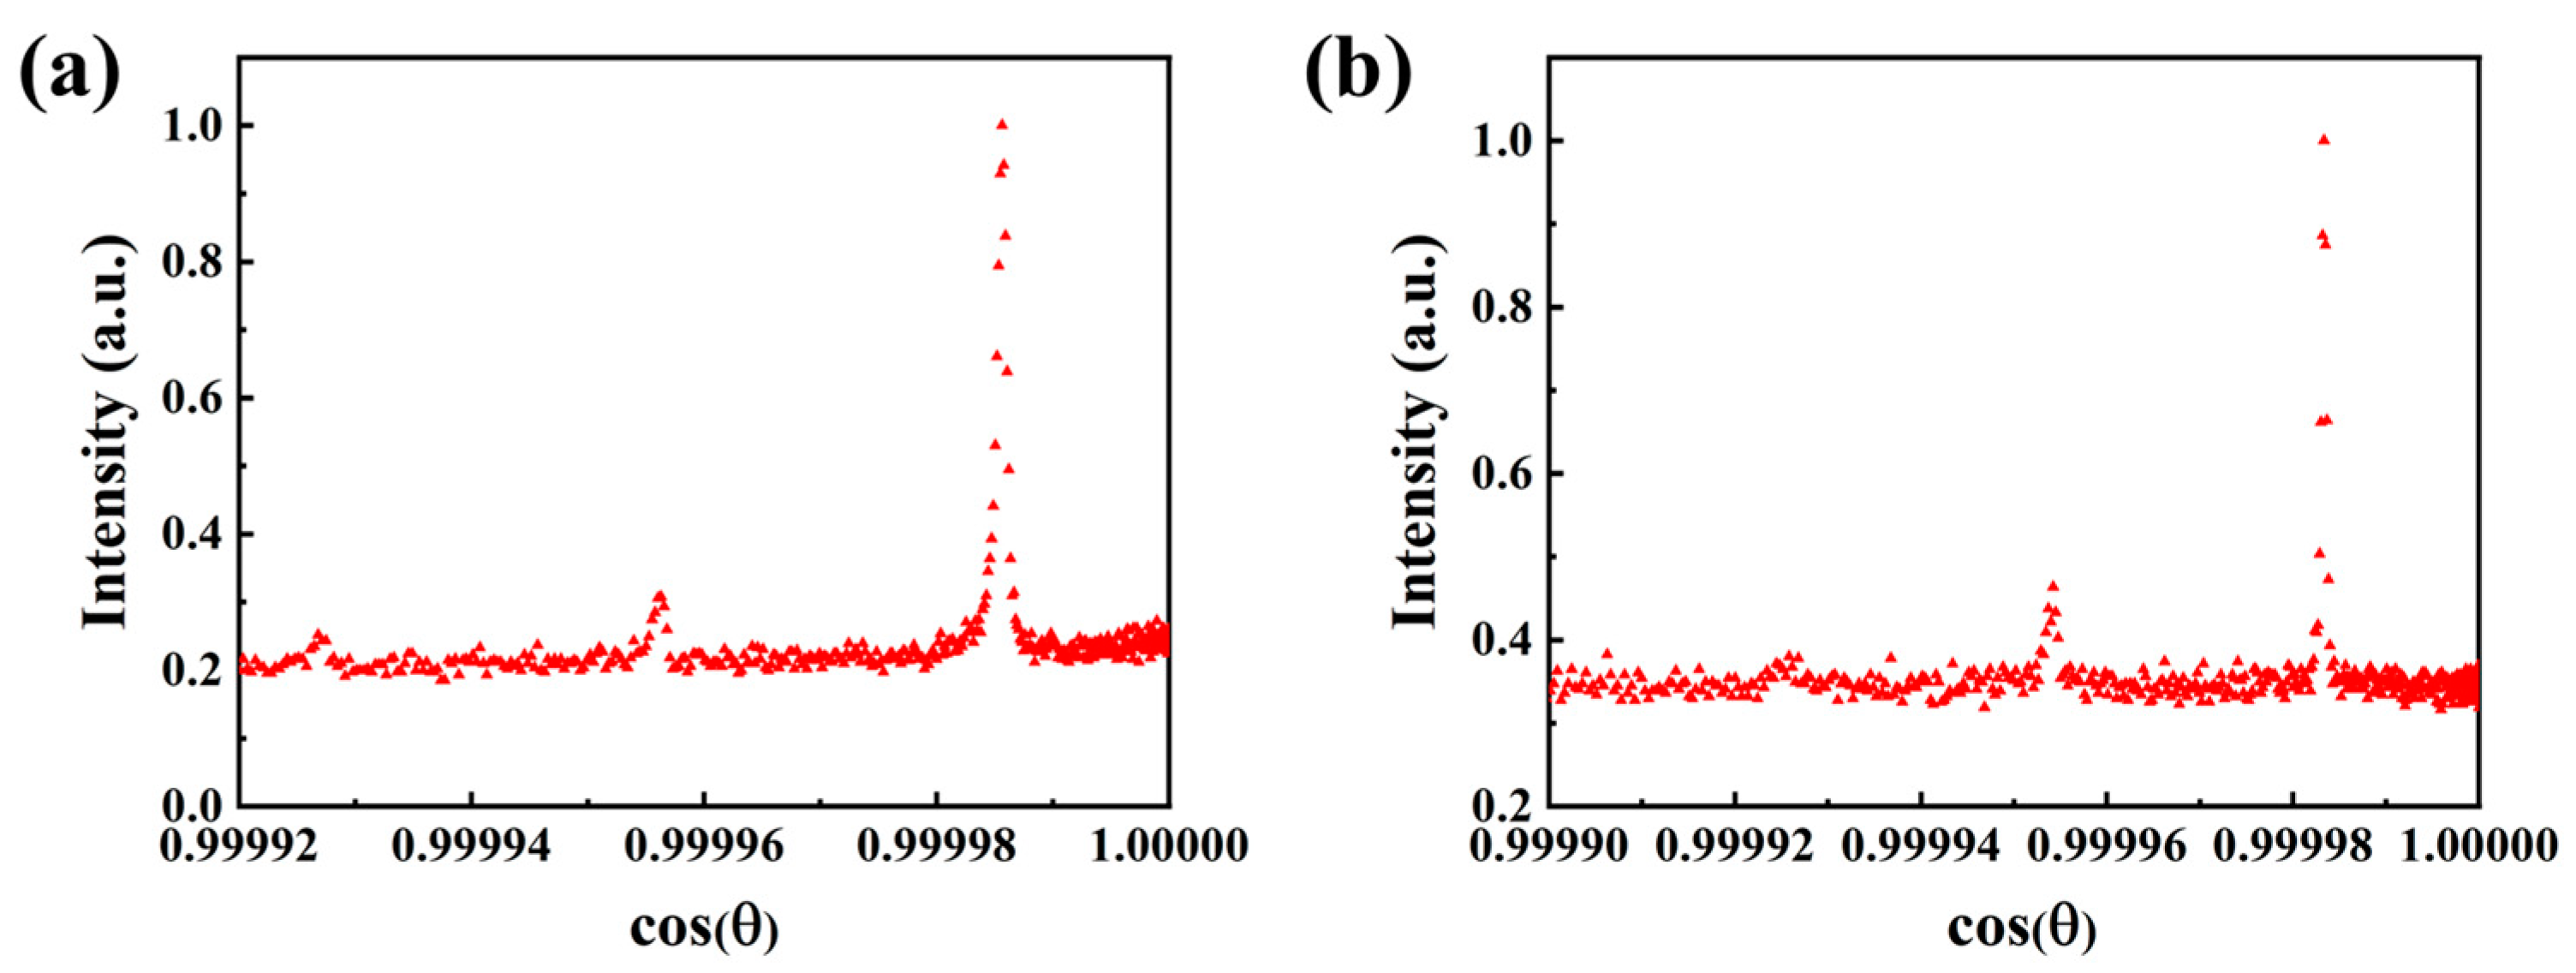
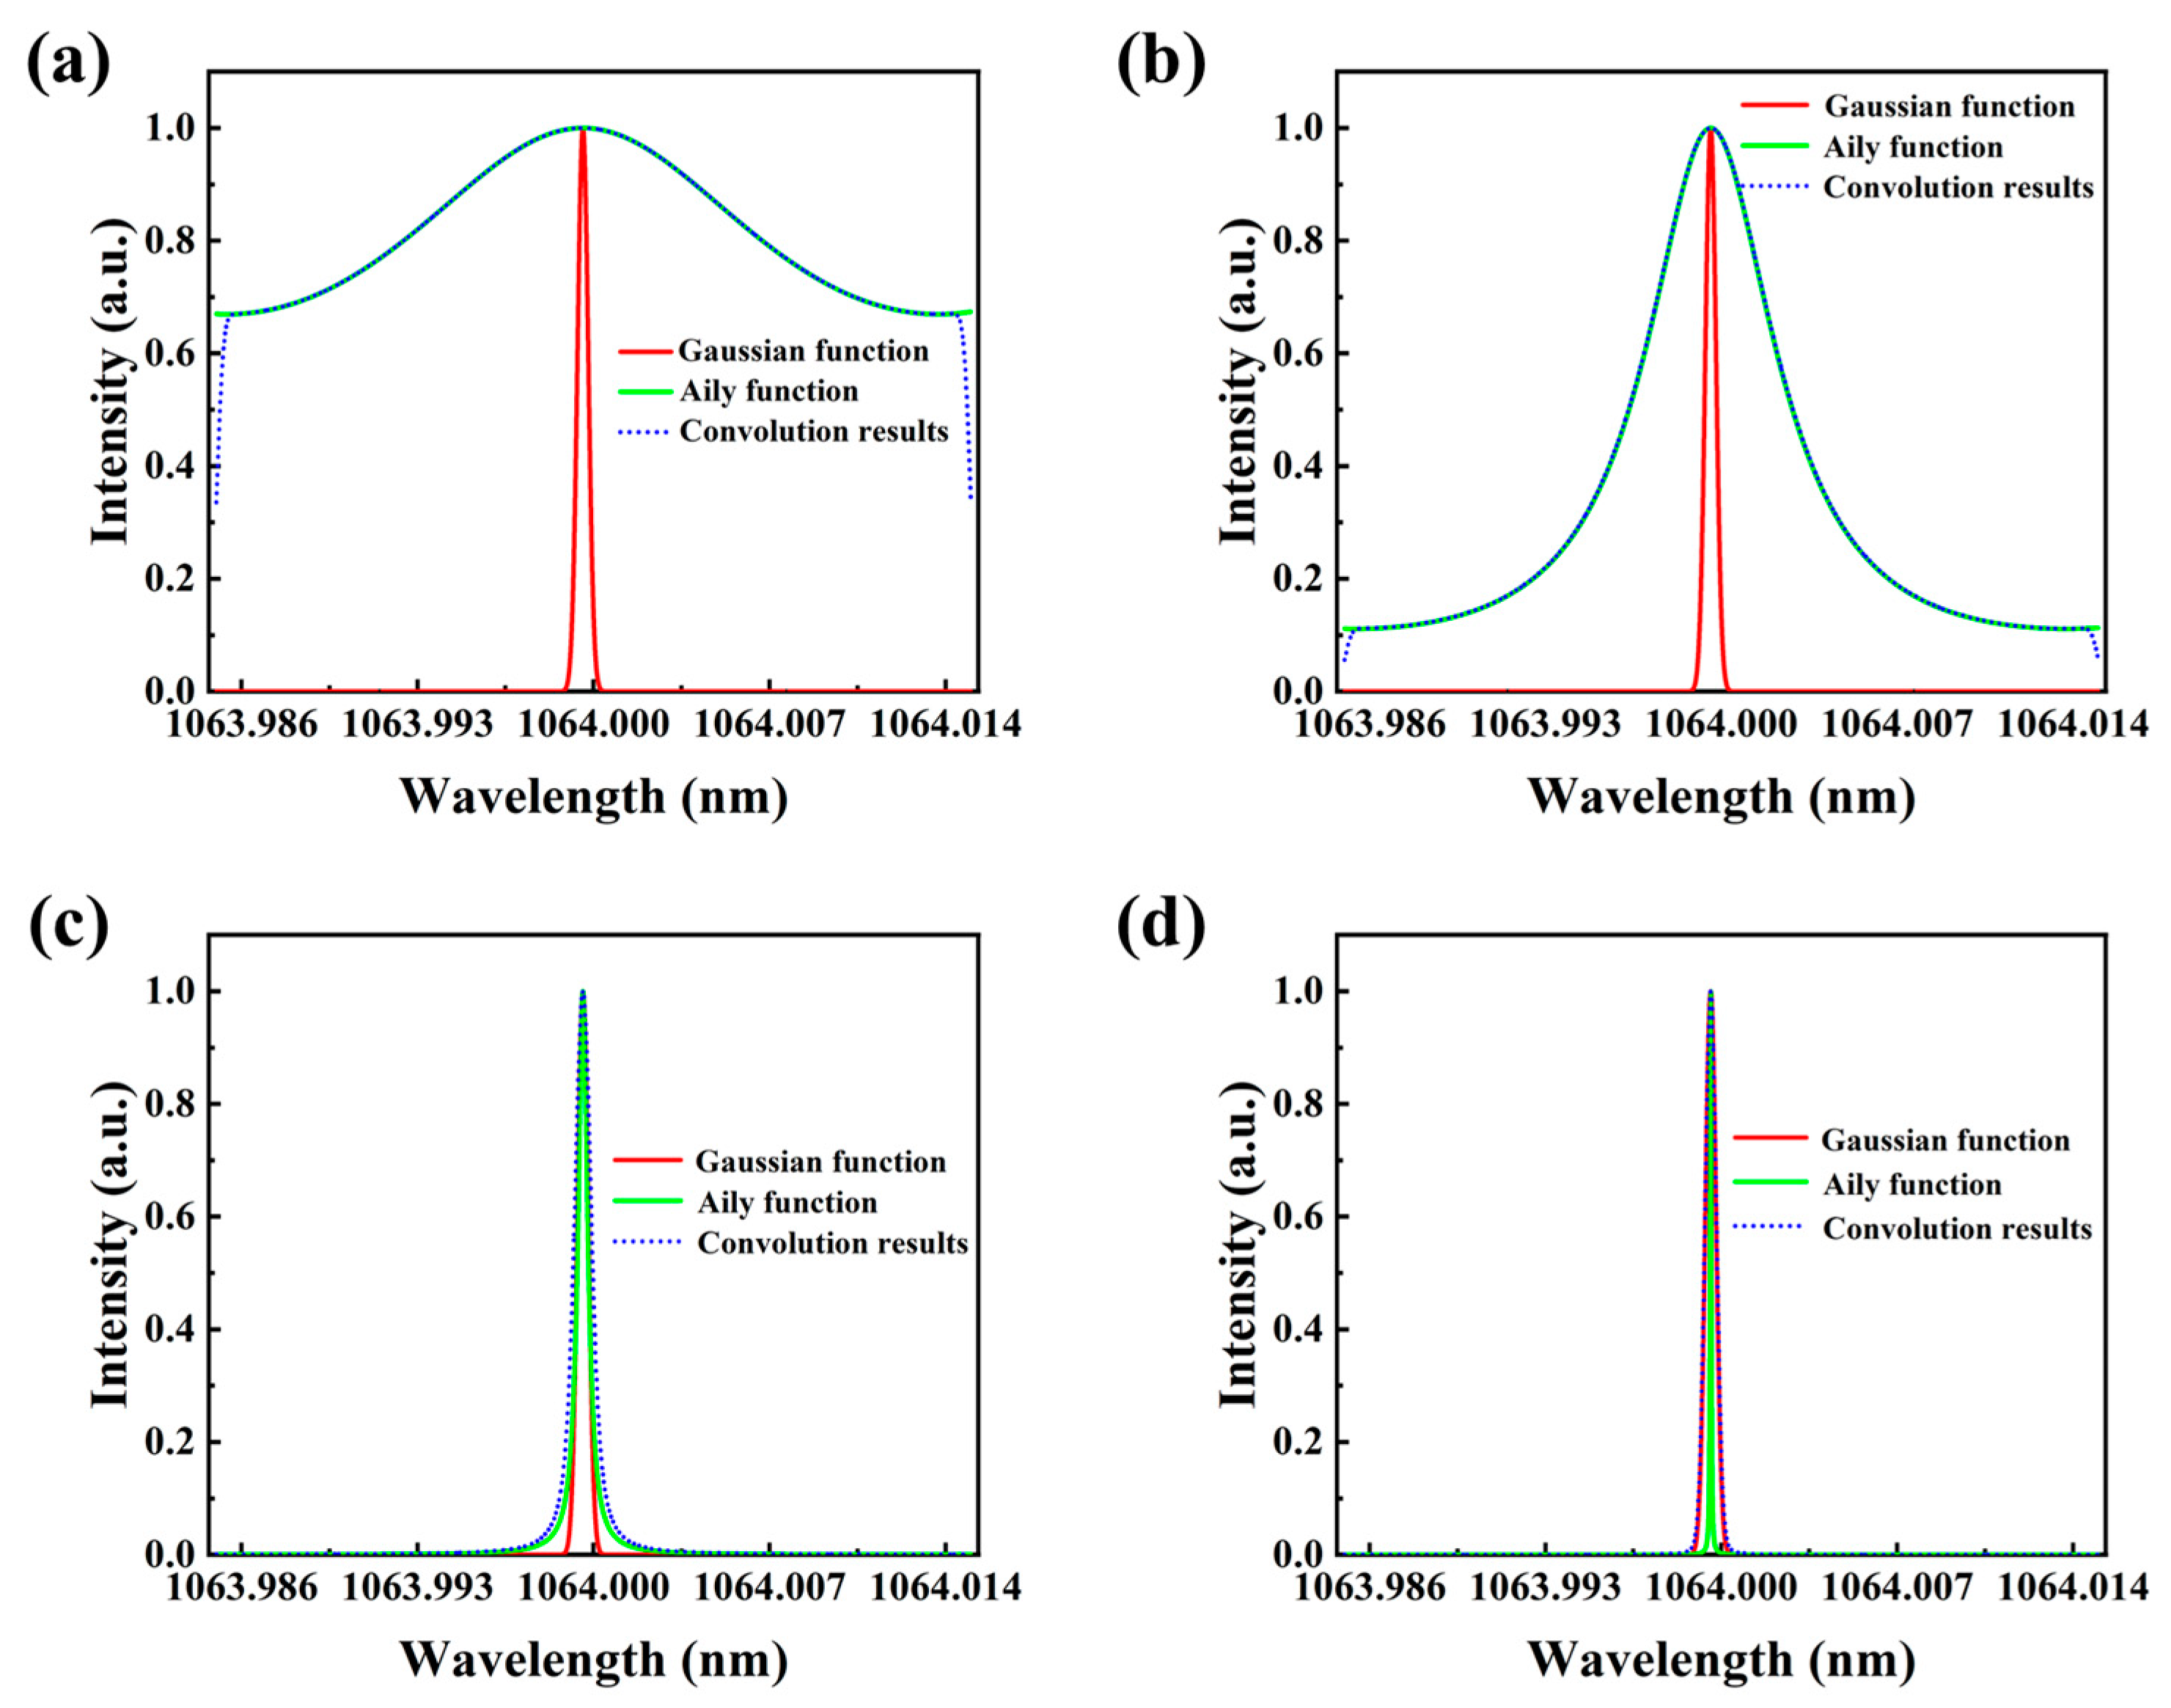
3. Analysis and Reduction of Convolution Error

It can be observed that there is a significant difference in the linewidth values measured by FP etalon with different reflectance, which is because the interference spectrum measured by FP etalon is not the intrinsic laser spectrum, but the convolution of the transmission spectrum of FP etalon and the intrinsic laser spectrum [30,35]. The transmission spectrum of FP etalon can be expressed by the Airy function [35], and the interference spectrum extracted from the interferogram should be expressed as:
I o u t ( λ ) = + e ( λ λ 0 ) 2 2 ( Γ 2 2 ln 2 ) 2 · 1 1 + 4 R ( 1 R ) 2 s i n 2 ( 2 π n d λ τ ) d τ ,
where R is the reflectance of FP etalon, and the right-hand side of the integral is the Airy function. The TSW of Airy function can be expressed as [30]:
Γ A i l y = c ( 1 R ) 2 π n d R
where Γ A i l y is the TSW of FP etalon. The corresponding transmission spectrum of FP etalon with different reflectivity is shown as the green curve in Figure 5. We took a Gaussian function with a stationary linewidth to act as the intrinsic laser spectrum and convolve it with the Airy functions corresponding to different reflectance based on Equation (4), and the convolution results are shown as the blue dotted line in Figure 5. It can be observed that as the reflectance increases, the TSW progressively becomes narrower and convolution spectrum gradually approaches the intrinsic spectrum, which is the reason why the FWHM in Figure 4c is wider than the FWHM in Figure 4d. When the TSW of FP etalon is narrow enough, the transmission spectrum can be considered as an impulse function. Due to the nature of convolution: the convolution of any function with an impulse function is still the function itself, concluding that the higher the reflectance of the FP, the closer the interference spectrum is to the intrinsic spectrum and the more accurate the measured linewidth values.
The convolutional fitting method uses Equation (4) to fit the interference data. The results of the convolution fitting and Gaussian fitting are shown in Figure 6 and Table 1 (all results are calculated several times from different interferometric images). From Figure 6, we can observe that the profiles of the Gaussian fitting and the convolution fitting are extremely close in Figure 6b, while there is a slight difference between the fitted curves in Figure 6a. This also verifies that the higher the reflectivity of FP etalon, the more accurate the measured linewidth will be. We proposed the residuals to indicate the accuracy of the fitting:
R e s i d u a l = i = 1 N [ f ( λ i ) g ( λ i ) ] ,
where f ( λ i ) is the fitted value, g ( λ i ) is the actual value of the spectrum scatter plot in Figure 6, and N is the number of scatter points used for the fitting. From Table 1, we can observe that the convolutional fitting is better than the Gaussian fitting, hence the results from the convolutional fitting are more accurate. We found that the linewidth values measured by different reflectivity etalon are only 3.8 MHz different after convolutional fitting. We believe that the global error should be the combination of the intrinsic error due to the TSW and the measurement error characterized by the standard deviation. Hence, the measured linewidth is 255.4   ±   125.5   MHz using an FP etalon with 95% reflectivity without any error reduction, and can be considered as 165.9   ±   10.8   MHz after error reduction by a convolutional fitting method (measure errors are integrated into all results). It can be concluded that the convolutional fitting method significantly improves the accuracy of linewidth measurement.
In order to verify the applicability of the proposed method at low-power lasers, we used a half-wave plate combined with a polarizer to form an energy attenuation device to make the single pulse energy of the laser less than 1mj and measured the output linewidth in this case, the results are shown in Figure 7. Due to the weakness of the incident light, high-reflective etalons are no longer suitable and in such a situation only low-reflective etalons can be used. As can be seen in Figure 7a, even though a low-reflectivity etalon is used, the interference rings are very difficult to capture. The linewidth measured in this case is 159.9   ±   6.9   MHz . As can be seen in Figure 7b, there is some stray light in the measured interferometric data due to the weak incident light, making the standard deviation of the measurement large, but the average measured linewidth is in the error tolerance range compared to the results in Table 1.

4. Conclusions

In this paper, a study of laser linewidth measurement based on the FP etalon was carried out for the problem of difficulty in measuring the linewidth of a short pulse (nanosecond level) laser with a low repetition rate. We have measured the interference circle of laser using different reflectance FP etalon in combination with a CBP. The image information in the interference circle was converted into spectrum information by coordinate variation, and then the interference linewidth was obtained by Gaussian fitting. The sources of convolution errors and their effects on linewidth measurement results were analyzed and the convolutional fitting method was proposed to reduce the errors. It is concluded that the convolutional fitting method can significantly reduce the convolution error of linewidth results.

Author Contributions

Data curation, X.H. and J.W.; Formal analysis, X.H. and B.C.; Investigation, X.H. and Z.B.; visualization, X.H; Writing—original draft, X.H.; Conceptualization, X.H., Z.B. and Z.L.; Methodology, Z.B., Y.W. and Z.L. Writing—review editing, Z.B., Y.W. and C.C.; Supervision, Z.B. and Z.L. All authors have read and agreed to the published version of the manuscript.

Funding

This work was supported by the National Natural Science Foundation of China (61927815), Program of State Key Laboratory of Quantum Optics and Quantum Optics Devices (KF202201), Key Laboratory of Functional Crystals and Laser Technology Foundation (FCLT202004), Natural Science Foundation of Tianjin (20JCZDJC00430), and Funds for Basic Scientific Research of Hebei University of Technology (JBKYTD2201).

Data Availability Statement

The data that support the findings of this study are available on request from the corresponding author. The data are not publicly available due to privacy or ethical restrictions.

Conflicts of Interest

The authors declare no conflict of interest.

References

  1. Fu, S.; Shi, W.; Feng, Y.; Zhang, L.; Yang, Z.; Xu, S.; Zhu, X.; Norwood, R.A.; Peyghambarian, N. Review of recent progress on single-frequency fiber lasers. J. Opt. Soc. Am. B. 2017, 34, A49–A62. [Google Scholar] [CrossRef]
  2. Yang, X.; Bai, Z.; Chen, D.; Chen, W.; Yan, F.; Richard, P.M. Widely-tunable single-frequency diamond Raman laser. Opt. Express 2021, 29, 29449–29457. [Google Scholar] [CrossRef] [PubMed]
  3. Zhao, Z.; Bai, Z.; Jin, D.; Qi, Y.; Ding, J.; Yan, B.; Wang, Y.; Lu, Z.; Mildren, R.P. Narrow laser-linewidth measurement using short delay self-heterodyne interferometry. Opt. Express 2022, 30, 30600–30610. [Google Scholar] [CrossRef] [PubMed]
  4. Peng, W.; Jin, P.; Li, F.; Su, J.; Lu, H.; Peng, K. A Review of the High-Power All-Solid-State Single-Frequency Continuous-Wave Laser. Micromachines 2021, 12, 1426. [Google Scholar] [CrossRef]
  5. Chen, H.; Bai, Z.; Yang, X.; Ding, J.; Qi, Y.; Yan, B.; Wang, Y.; Lu, Z.; Mildren, R.M. Enhanced stimulated Brillouin scattering utilizing Raman conversion in diamond. Appl. Phys. Lett. 2022, 120, 181103. [Google Scholar] [CrossRef]
  6. Bai, Z.; Zhao, Z.; Tian, M.; Jin, D.; Pang, Y.; Li, S.; Yan, X.; Wang, Y.; Lu, Z. A comprehensive review on the development and applications of narrow-linewidth lasers. Microw. Opt. Techn. Lett. 2022, 64, 2244–2255. [Google Scholar] [CrossRef]
  7. Jin, D.; Bai, Z.; Lu, Z.; Fan, R.; Zhao, Z.; Yang, X.; Wang, Y.; Mildren, R.P. 22.5-W narrow-linewidth diamond Brillouin laser at 1064 nm. Opt. Lett. 2022, 47, 5360–5363. [Google Scholar] [CrossRef]
  8. Guan, H.; Novack, A.; Galfsky, T.; Ma, Y.; Fathololoumi, S.; Horth, A.; Huynh, N.T.; Roman, J.; Shi, R.; Caverley, M.; et al. Widely-tunable, narrow-linewidth III-V/silicon hybrid external-cavity laser for coherent communication. Opt. Express 2018, 26, 7920–7933. [Google Scholar] [CrossRef] [Green Version]
  9. Zhou, K.; Zhao, Q.; Huang, X.; Yang, C.; Li, C.; Zhou, E.; Xu, X.; Wong, K.Y.; Cheng, H.; Gan, J.; et al. kHz-order linewidth controllable 1550 nm single-frequency fiber laser for coherent optical communication. Opt. Express 2017, 25, 19752–19759. [Google Scholar] [CrossRef]
  10. Sheng, Q.; Ma, H.; Li, R.; Wang, M.; Shi, W.; Yao, J. Recent progress on narrow-linewidth crystalline bulk Raman lasers. Results Phys. 2020, 17, 103073. [Google Scholar] [CrossRef]
  11. Arpita, S.R.; Pradeep, K.K. Brillouin-induced self-heterodyne method for low jitter measurement of laser linewidth. J. Opt. Soc. Am. B. 2019, 36, 3145–3150. [Google Scholar]
  12. Gao, J.; Jiao, D.; Deng, X.; Liu, J.; Zhang, L.; Zang, Q.; Zhang, X.; Liu, T.; Zhang, S. A Polarization-Insensitive Recirculating Delayed Self-Heterodyne Method for Sub-Kilohertz Laser Linewidth Measurement. Photonics 2021, 8, 137. [Google Scholar] [CrossRef]
  13. Xue, M.; Zhao, J. Laser linewidth measurement based on long and short delay fiber combination. Opt. Express 2021, 29, 27118–27126. [Google Scholar] [CrossRef] [PubMed]
  14. Huang, S.; Zhu, T.; Liu, M.; Huang, W. Precise measurement of ultra-narrow laser linewidths using the strong coherent envelope. Sci. Rep.-UK 2017, 7, 41988. [Google Scholar] [CrossRef] [PubMed] [Green Version]
  15. Wang, Z.; Ke, C.; Zhong, Y.; Xing, C.; Wang, H.; Yang, K.; Cui, S.; Liu, D. Ultra-narrow-linewidth measurement utilizing dual-parameter acquisition through partially coherent light interference. Opt. Express 2020, 28, 8484–8493. [Google Scholar] [CrossRef]
  16. Bai, Z.; Zhao, Z.; Qi, Y.; Ding, J.; Li, S.; Yang, X.; Wang, Y.; Lu, Z. Narrow-Linewidth Laser Linewidth Measurement Technology. Front. Phys. 2021, 9, 768165. [Google Scholar] [CrossRef]
  17. Peng, Y. A Novel Scheme for Hundred-Hertz Linewidth Measurements with the Self-Heterodyne Method. Chin. Phys. Lett. 2013, 30, 084208. [Google Scholar] [CrossRef]
  18. Gao, W.; Lu, Z.; He, W.; Dong, Y.; Hasi, W. Characteristics of amplified spectrum of a weak frequency-detuned signal in a Brillouin amplifier. Laser Part Beams 2009, 2, 465–470. [Google Scholar] [CrossRef]
  19. Xue, J.; Chen, W.; Pan, Y.; Shi, J.; Fang, Y.; Xie, H.; Xie, M.; Sun, L.; Su, B. Pulsed laser linewidth measurement using Fabry–Pérot scanning interferometer. Results Phys. 2016, 6, 698–703. [Google Scholar] [CrossRef] [Green Version]
  20. Ma, Y.; Yu, Y.; Li, H.; Huang, J.; Yao, Y.; Zhou, B.; Fang, Y.; Min, J.; Liang, K. Accurate measurement of high resolution spectrum obtained by F–P etalon and ICCD. Appl. Phys. B-Lasers O 2014, 116, 575–584. [Google Scholar] [CrossRef]
  21. Yao, Y.; Niu, Q.; Liang, K. Measurement error analysis of Brillouin lidar system using F–P etalon and ICCD. Opt. Commun. 2016, 375, 58–62. [Google Scholar] [CrossRef]
  22. Huang, J.; Ma, Y.; Zhou, B.; Li, H.; Yu, Y.; Liang, K. Processing method of spectrum measurement using FP etalon and ICCD. Opt. Express 2012, 20, 18568–18578. [Google Scholar] [CrossRef] [PubMed]
  23. Zhang, L.; Zhang, D.; Yang, Z.; Shi, J.; Liu, D.; Gong, W.; Fry, E.S. Experimental investigation on line width compression of stimulated Brillouin scattering in water. Appl. Phys. Lett. 2011, 98, 221106. [Google Scholar] [CrossRef]
  24. Toshihiko, T.; Kenichi, I.; Toshiharu, T. Linewidth Measurement of a Single Longitudinal Mode AlGaAs Laser with a Fabry-Perot Interferometer. Jpn. J. Appl. Phys. 1980, 19, L725–L727. [Google Scholar]
  25. Jakup, R.; Bostjan, B. Injection-locked range and linewidth measurements at different seed-laser linewidths using a Fabry–Pérot laser-diode. Opt. Quant. Electron. 2018, 50, 502. [Google Scholar]
  26. George, H.M.; Edward, I.M.; Craig, R.W. The national ignition facility. Opt. Eng. 2004, 43, 2841–2853. [Google Scholar]
  27. John, D.L.; Peter, A.; Richard, L.B.; Glendinning, S.G.; Siegfried, H.G.; Steven, W.H.; Robert, L.K.; Otto, L.L.; Laurence, J.S. The physics basis for ignition using indirect-drive targets on the National Ignition Facility. Phys. Plasmas 2004, 11, 339–491. [Google Scholar]
  28. Zheng, W.; Wei, X.; Zhu, Q.; Jing, F.; Hu, D.; Su, J.; Zheng, K.; Yuan, X.; Zhou, X.; Dai, W.; et al. Laser performance of the SG-III laser facility. High Power Laser Sci. 2016, 4, e21. [Google Scholar] [CrossRef] [Green Version]
  29. Ma, Y.; Li, H.; Yu, Y.; Yao, Y.; Fang, Y.; Zhou, B.; Huang, J.; Min, J.; Liang, K. Experimental analysis on calibration of instrument broadening in a lidar system with Fabry–Perot etalon. J. Mod. Optic 2013, 60, 1967–1975. [Google Scholar] [CrossRef]
  30. Hun, X.; Bai, Z.; Chen, B.; Wang, J.; Cui, C.; Qi, Y.; Ding, J.; Wang, Y.; Lu, Z. Fabry–Pérot based short pulsed laser linewidth measurement with enhanced spectrum resolution. Results Phys. 2022, 37, 105510. [Google Scholar] [CrossRef]
  31. Zhao, Z.; Bai, Z.; Jin, D.; Chen, X.; Qi, Y.; Ding, J.; Yan, B.; Wang, Y.; Lu, Z.; Mildren, R.P. The Influence of Noise Floor on the Measurement of Laser Linewidth Using Short-Delay-Length Self-Heterodyne/Homodyne Techniques. Micromachines 2022, 13, 1311. [Google Scholar] [CrossRef]
  32. Chen, B.; Bai, Z.; Zhao, G.; Zhang, Y.; Yan, B.; Qi, Y.; Ding, J.; Wang, K.; Wang, Y.; Lu, Z. Compound Cavity Passively Q-Switched Single-Longitudinal-Mode Diode-Pumped Laser. Front. Phys. 2022, 10, 820177. [Google Scholar] [CrossRef]
  33. Jin, D.; Bai, Z.; Wang, Q.; Chen, Y.; Liu, Z.; Fan, R.; Qi, Y.; Ding, J.; Yang, X.; Wang, Y.; et al. Doubly Q-switched single longitudinal mode Nd:YAG laser with electro-optical modulator and Cr4+:YAG. Opt. Commun. 2020, 463, 125500. [Google Scholar] [CrossRef]
  34. Xue, F.; Zhang, S.; Cong, Z.; Huang, Q.; Guan, G.; Wu, Q.; Chen, H.; Bai, F.; Liu, Z. Diode-end-pumped single-longitudinal-mode passively Q-switched Nd: GGG laser. Laser Phys. Lett. 2018, 15, 035001. [Google Scholar] [CrossRef]
  35. Liang, K.; Ma, Y.; Huang, J.; Li, H.; Yu, Y. Precise measurement of Brillouin scattering spectrum in the ocean using F–P etalon and ICCD. Appl. Phys. B-Lasers O 2011, 105, 421. [Google Scholar] [CrossRef]
Figure 1. Schematic diagram of the experimental setup used for measurement of the laser linewidth.
Photonics 09 01004 g001
Figure 2. (a) Recorded Interference circle (R = 95%), (b) scatter plot of normalized pixel intensity (R = 95%), (c) recorded Interference circle (R = 99.5%), and (d) scatter plot of normalized pixel intensity (R = 99.5%).
Photonics 09 01004 g002
Figure 3. (a) Scatter plot after linear processing of the abscissa in Figure 2 (R = 95%) and (b) scatter plot after linear processing of the abscissa in Figure 2 (R = 99.5%).
Photonics 09 01004 g003
Figure 4. (a) Scatter plot of relative wavelengths (R = 95%), (b) scatter plot of relative wavelengths (R = 99.5%), (c) Gaussian fitting of scatter plot in (a), and (d) Gaussian fitting of scatter plot in (b).
Photonics 09 01004 g004
Figure 5. Comparison of Gaussian function, Airy function, and their convolution results under different reflectance: (a) R = 10%, (b) R = 50%, (c) R = 95%, and (d) R = 99.5%.
Photonics 09 01004 g005
Figure 6. (a) Convolutional fitting—Gaussian fitting (R = 95%) and (b) Convolutional fitting—Gaussian fitting (R = 99.5%).
Photonics 09 01004 g006
Figure 7. (a) Interference circles at low power (R = 95%) and (b) interference data and convolutional fit results.
Photonics 09 01004 g007
Table 1. Comparison of error reduction using etalon with different reflectance.
ReflectanceTSWLinewidth of Gaussian Fitting (Γ1)Residuals of Gaussian FittingLinewidth of Convolutional Fitting (Γ2)Residuals of Convolutional FittingDifference
12)
R = 95%122 MHz 255.4   ±   3.5 MHz0.0584 nm 165.9   ±   2.2 MHz0.0317 nm89.5 MHz
R = 99.5%9.6 MHz 169.2   ±   3.2 MHz0.01 nm 162.1   ±   4.8 MHz0.0092 nm7.1 MHz
Publisher’s Note: MDPI stays neutral with regard to jurisdictional claims in published maps and institutional affiliations.

