Article

An Optical POCT Device for Colorimetric Detection of Urine Test Strips Based on Raspberry Pi Imaging

1
School of Communication and Information Engineering, Shanghai University, Shanghai 200444, China
2
State Key Laboratory of Transducer Technology, Shanghai Institute of Microsystem and Information Technology, Chinese Academy of Sciences, Shanghai 200050, China
*
Author to whom correspondence should be addressed.
These authors contributed equally to this work.
Photonics 2022, 9(10), 784; https://doi.org/10.3390/photonics9100784
Submission received: 4 October 2022 / Revised: 18 October 2022 / Accepted: 19 October 2022 / Published: 21 October 2022
(This article belongs to the Special Issue Advances in Photonic Materials and Technologies)

Abstract

:
Urine examinations are widely applied in hospitals using urine test strip analyzers or other sophisticated professional instruments. However, such methods are inconvenient health monitoring of patients at home. Herein, we construct an optical device for point-of-care testing (POCT) for urine analysis at home or on the spot. A black box and color calibration curve are established to eliminate the influence of ambient light with an independent internal lighting system included in the device. A Raspberry Pi with a CSI camera is programmed to automatically collect the strip images and identify the HSV values of the image with an image processing algorithm. During this process, these corrected colors are converted to concentration values by preloaded standard curves. Under optimal conditions, the proposed POCT device can quantitatively and automatically detect glucose within 1 min, with linear detection ranging from 2 mM to 60 mM and a detection limit of 1.16 mM. In addition, the device demonstrates satisfactory accuracy and quantitative analysis of ketone bodies, glucose, protein, occult blood, pH, and leukocytes in human urine samples with high-resolution concentrations, achieving results similar to those obtained with hospital instruments. The proposed device is portable and user-friendly, providing convenient colorimetric analysis for urine. Furthermore, the proposed device also has considerable potential for the development of in vitro diagnosis methods through combination with other test strips.

1. Introduction

Urine, as a byproduct of kidney metabolism, consists of many nitrogen-containing substances, including creatinine, urea, and uric acid, which are soluble in water and excreted from the body during urination. The color and composition of urine can significantly change in the presence of certain diseases, such as hematuria, diabetes, or kidney stones. In clinical practice, urine serves as a non-invasive sample that can be easily collected without pain or special equipment, playing an important role in health monitoring [1,2,3]. Given the sophisticated laboratory equipment and skilled personnel required for analysis, current urine diagnostic technology is subject to limited use for real-time detection and family health monitoring, as well as in underdeveloped areas of the world with limited medical infrastructure and scarce resources. Therefore, it is of considerable significance to establish a rapid and simple urine detection method for health monitoring [4].
Point-of-care testing (POCT) is defined as rapid and simple detection using portable instruments at the sampling site [5,6]. Owing to its convenience, POCT can analyze experimental results in a timely manner, considerably reducing the test time and cost and enabling rapid decision making, as well as on-site treatment for patients in clinical units [7,8]. Among POCT assay methods, colorimetry is regarded as the most convenient test without the use of expensive equipment [9]. The colorimetric method can be completed with only one piece of functional paper and can be divided into visual and digital image colorimetry (DIC) [10]. Visual colorimetry is mainly dependent on color discrimination via human eyes. Fan Li et al. [11] proposed a visual colorimetric sensor using chitosan-stabilized gold nanoparticles for the detection of uric acid in human urine. Visual colorimetry-based methods can achieve rapid detection with a simple instrument and convenient operation [12,13]. However, they often lack sufficient sensitivity and accuracy, as the results can be easily affected by personal subjectivity and environmental factors, restricting their practical application [14]. DIC allows image acquisition tools to collect sample images and for the samples to be analyzed using image processing software [15,16]. Cameras, CMOS image sensors (CIS), and smartphones can be used to acquire images. The images taken for DIC are mainly represented in the RGB (red, green, and blue) color space. Any color can be decomposed into the three basic colors and read out by image processing software. Thus, DIC can reduce the influence of the naked eye and improve the accuracy of detection results.
Researchers have attempted to design POCT devices via DIC technology using smartphones owing to their advantages of excellent photography function, the availability of multiple image processing programs, and portability [17,18], providing a potential device suitable for on-site rapid detection of urine. For example, Ye et al. [19] and Jalal et al. [20] reported a smartphone and paper-sensor-based device for colorimetric analysis of glucose, protein, pH, and red blood cells in urine. Yang et al. [21] developed a new color space transformation-based colorimetric algorithm using CIElab to quantitatively define the degree of color similarity for commercially available urine test strips. Unfortunately, urine POCT is subject to some limitations, such as susceptibility to external light conditions, reflections and chromatic aberration, a limited space to accommodate the paper sensors and all the reference color cards, as well as the position of the sensor must be determined before assaying the target color.
In this study, we present a sensitive and rapid colorimetric method using a Raspberry Pi-based device with self-developed software, which was applied to determine the concentration of ketone bodies (KETs), glucose (GLU), protein (PRO), occult blood (BLD), pH, and leukocytes (LEUs) in urine through a urine test strip. The principle of the proposed device is shown in Figure 1. The image processing algorithm and the black box were designed to guarantee the correct digitalization of the color. Additionally, the standard curve and the calibration curve derived from the collected images were preloaded so that the reference color was omitted, leading to the possibility of producing a small POCT device. The test strip position was automatically identified by two blank lines, successfully reaching an optimal condition of sensors. Compared with images taken by smartphones, the use of a stable and reliable internal light source and a fixed distance between the sample and the camera in the designed device can compromise the repeatability, sensitivity, and reliability of colorimetric analysis. Our device could be potentially used for urine detection for at-home health monitoring of patients.

2. Materials and Methods

2.1. Materials and Reagents

Phosphate-buffered saline (PBS) and HCL were purchased from Sigma-Aldrich (St. Louis, MO, USA). Deionized (DI) water was generated by a Millipore water purification system. Glucose was purchased from Aladdin Reagent Co. Ltd. (Shanghai, China). Urine test strips (AVE-8B, AVE, Shanghai, China) were purchased from AVE Science & Technology Co., Ltd. (Changsha, China). Urine control solution (UQ-11, URIT, China) was purchased from URIT Medical Electronic Group Co., Ltd. (Guilin, China). All other reagents were of analytical grade for direct use without further purifications.

2.2. Preparation of the Solutions

The standard solution was prepared by serially dissolving the samples into 10 mL deionized water at a concentration equivalent to positive level 3+. Subsequently, the lower-level solution was prepared by diluting the stock solution and confirmed by a urinary analyzer (IQ200Sprint, Beckman Coulter Inc., Pasadena, CA, USA). For further analysis, the glucose sample was dissolved in deionized water at concentrations of 56 mM, 28 mM, 14 mM, 5.6 mM, and 2.8 mM. Buffer solutions of pH 5.0, 6.0, 6.5, 7.0, and 8.0 were prepared with appropriate amounts of sodium citrate, citric acid, KH2PO4, K2HPO4, NaH2PO4, Na2HPO4, boric acid, and NaOH according to the literature [22]. Human urine samples were obtained from Shanghai Songjiang District Central Hospital with the informed consent of the donors.

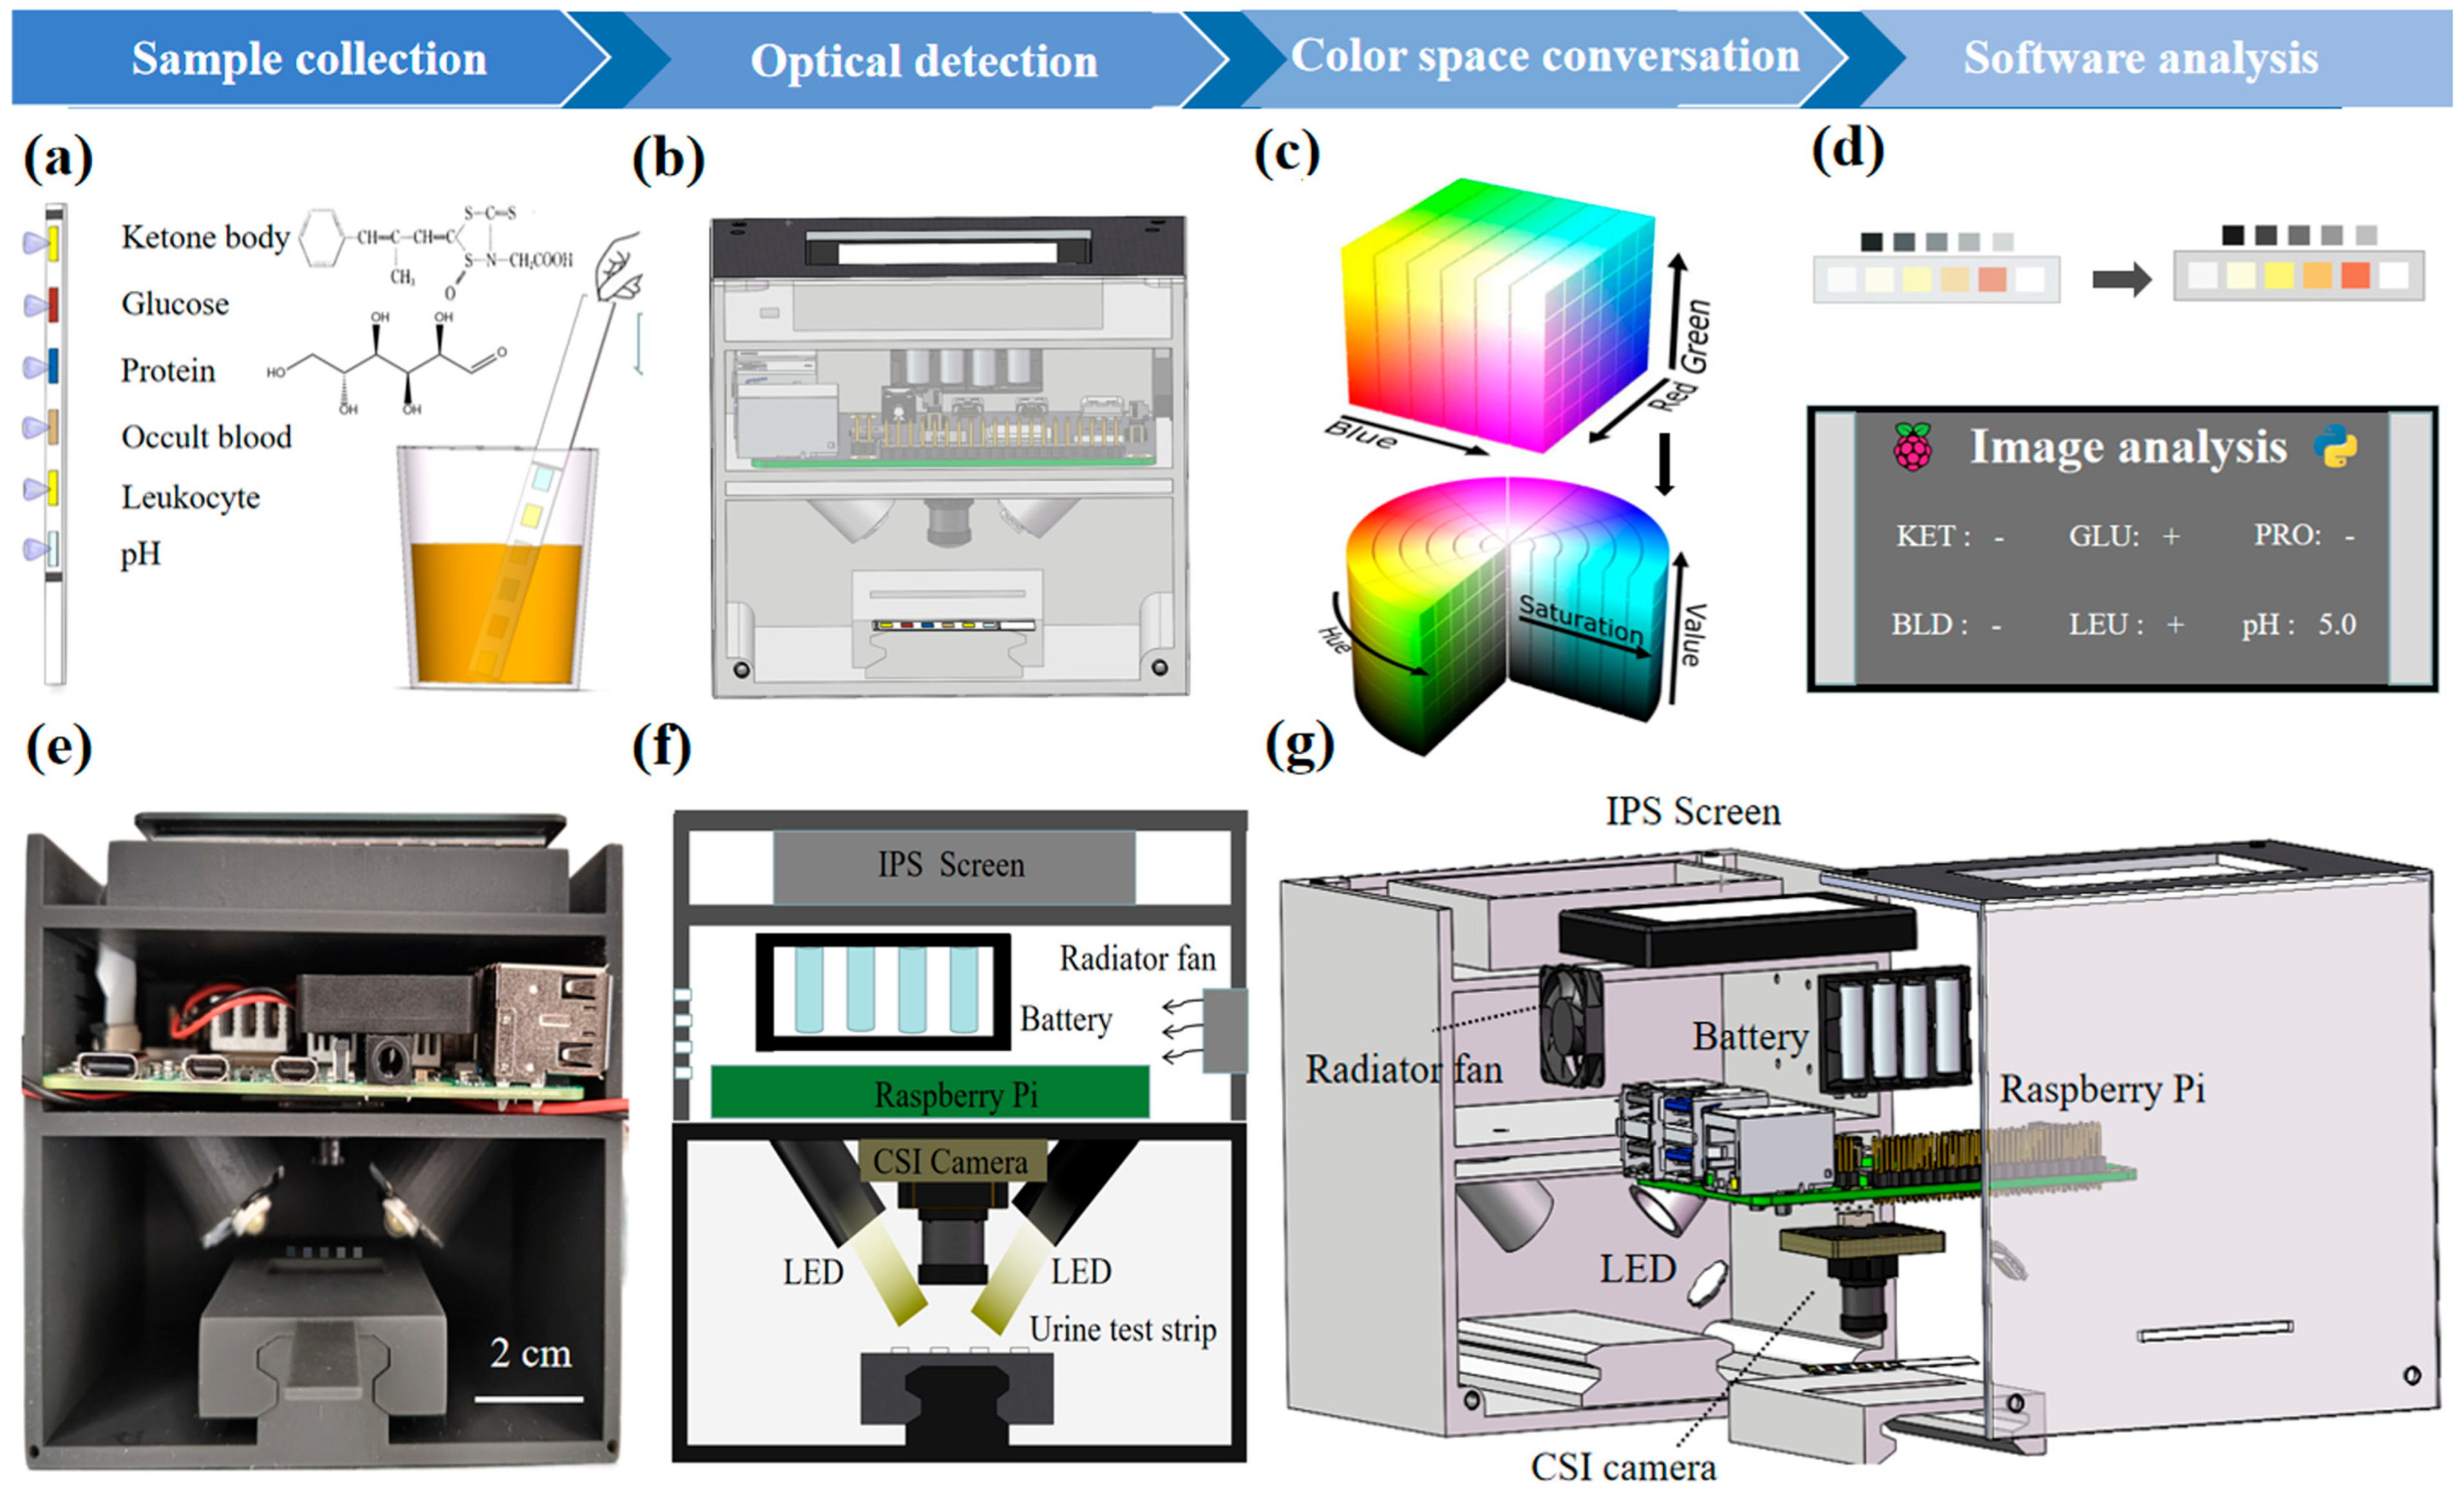
2.3. Design of the Optical POCT Device

In order to ensure illumination uniformity and avoid the influence of the external environment, an optical POCT device was designed and developed (Figure S1 in supporting information), including a black box, a Raspberry 4b+, an in-plane switching (IPS) touch screen, two 6000 K light-emitting diode (LED) lights, a wide-angle FOV150° camera serial interface (CSI) camera (RPi Camera V2, Waveshare Co., Ltd., Shenzhen, China), a 5 V lithium battery, a stabilized voltage module (LM2596S), a radiator fan, and a holder for the test strip. A black box with dimensions of 85 × 60 × 65 mm (length × width × height), providing a darkroom for photographs, was designed using SolidWorks software and fabricated using 3D printing. The inner wall of the optical box was covered with black light-absorbing flannel to avoid light reflection. A Raspberry 4b+ was selected as the embedded controller for the device due to its low cost, small size, and availability of open-source support libraries, which can be programmed to automatically analyze images after capture. The CSI camera was used to capture a high-resolution image of the strip under the condition of a fixed height in order to reduce the likelihood of human error. The two LED lights were set at a fixed 45° angle with an appropriate brightness to ensure the uniform illumination of the imaging area. The stabilized voltage module ensured that the LED was powered by a stable operating voltage. The device can be operated with a user-friendly touch screen interface.

2.4. Color Space Transformation

Because RGB values of the digitized images are directly related to the analytic values of the light intensity in some situations [23,24], the RGB color space was selected for optimization. However, the RGB parameters of one digitized color do not change monotonously with spectral wavelength and intensity [25]. Given these limitations, alternative HSV (hue saturation value) and CIELAB (L*a*b*) color spaces are sometimes selected [17,21,26,27]. In this study, our device was applied to detect multichemical components, which exhibit different colors or different intensities of a specific color. In order to simultaneously satisfy the experimental requirements, the RGB color space was converted into HSV color space in our study because H and S parameters monotonously change with spectral wavelength and intensity variation, as shown in Figure S2 (supporting information). According to the following equations, the original RGB color space was converted to HSV color space, which was the best match for spectroscopic change.
m a x = m a x   r , g , b ,   m i n = m i n   r , g , b
h = 0 °                                                                                                               i f   m a x = m i n 60 ° × g b m a x m i n                                                                   i f   m a x = r   a n d   g     b 60 ° × g b m a x m i n + 360 °                                         i f   m a x = r   a n d   g < b 60 ° × b r m a x m i n + 120 °                                         i f   m a x = g 60 ° × r g m a x m i n + 240 °                                         i f   m a x = b
s =     0                                                                                     i f   m a x = 0     m a x m i n m a x = 1 m i n m a x                     o t h e r w i s e
v = m a x

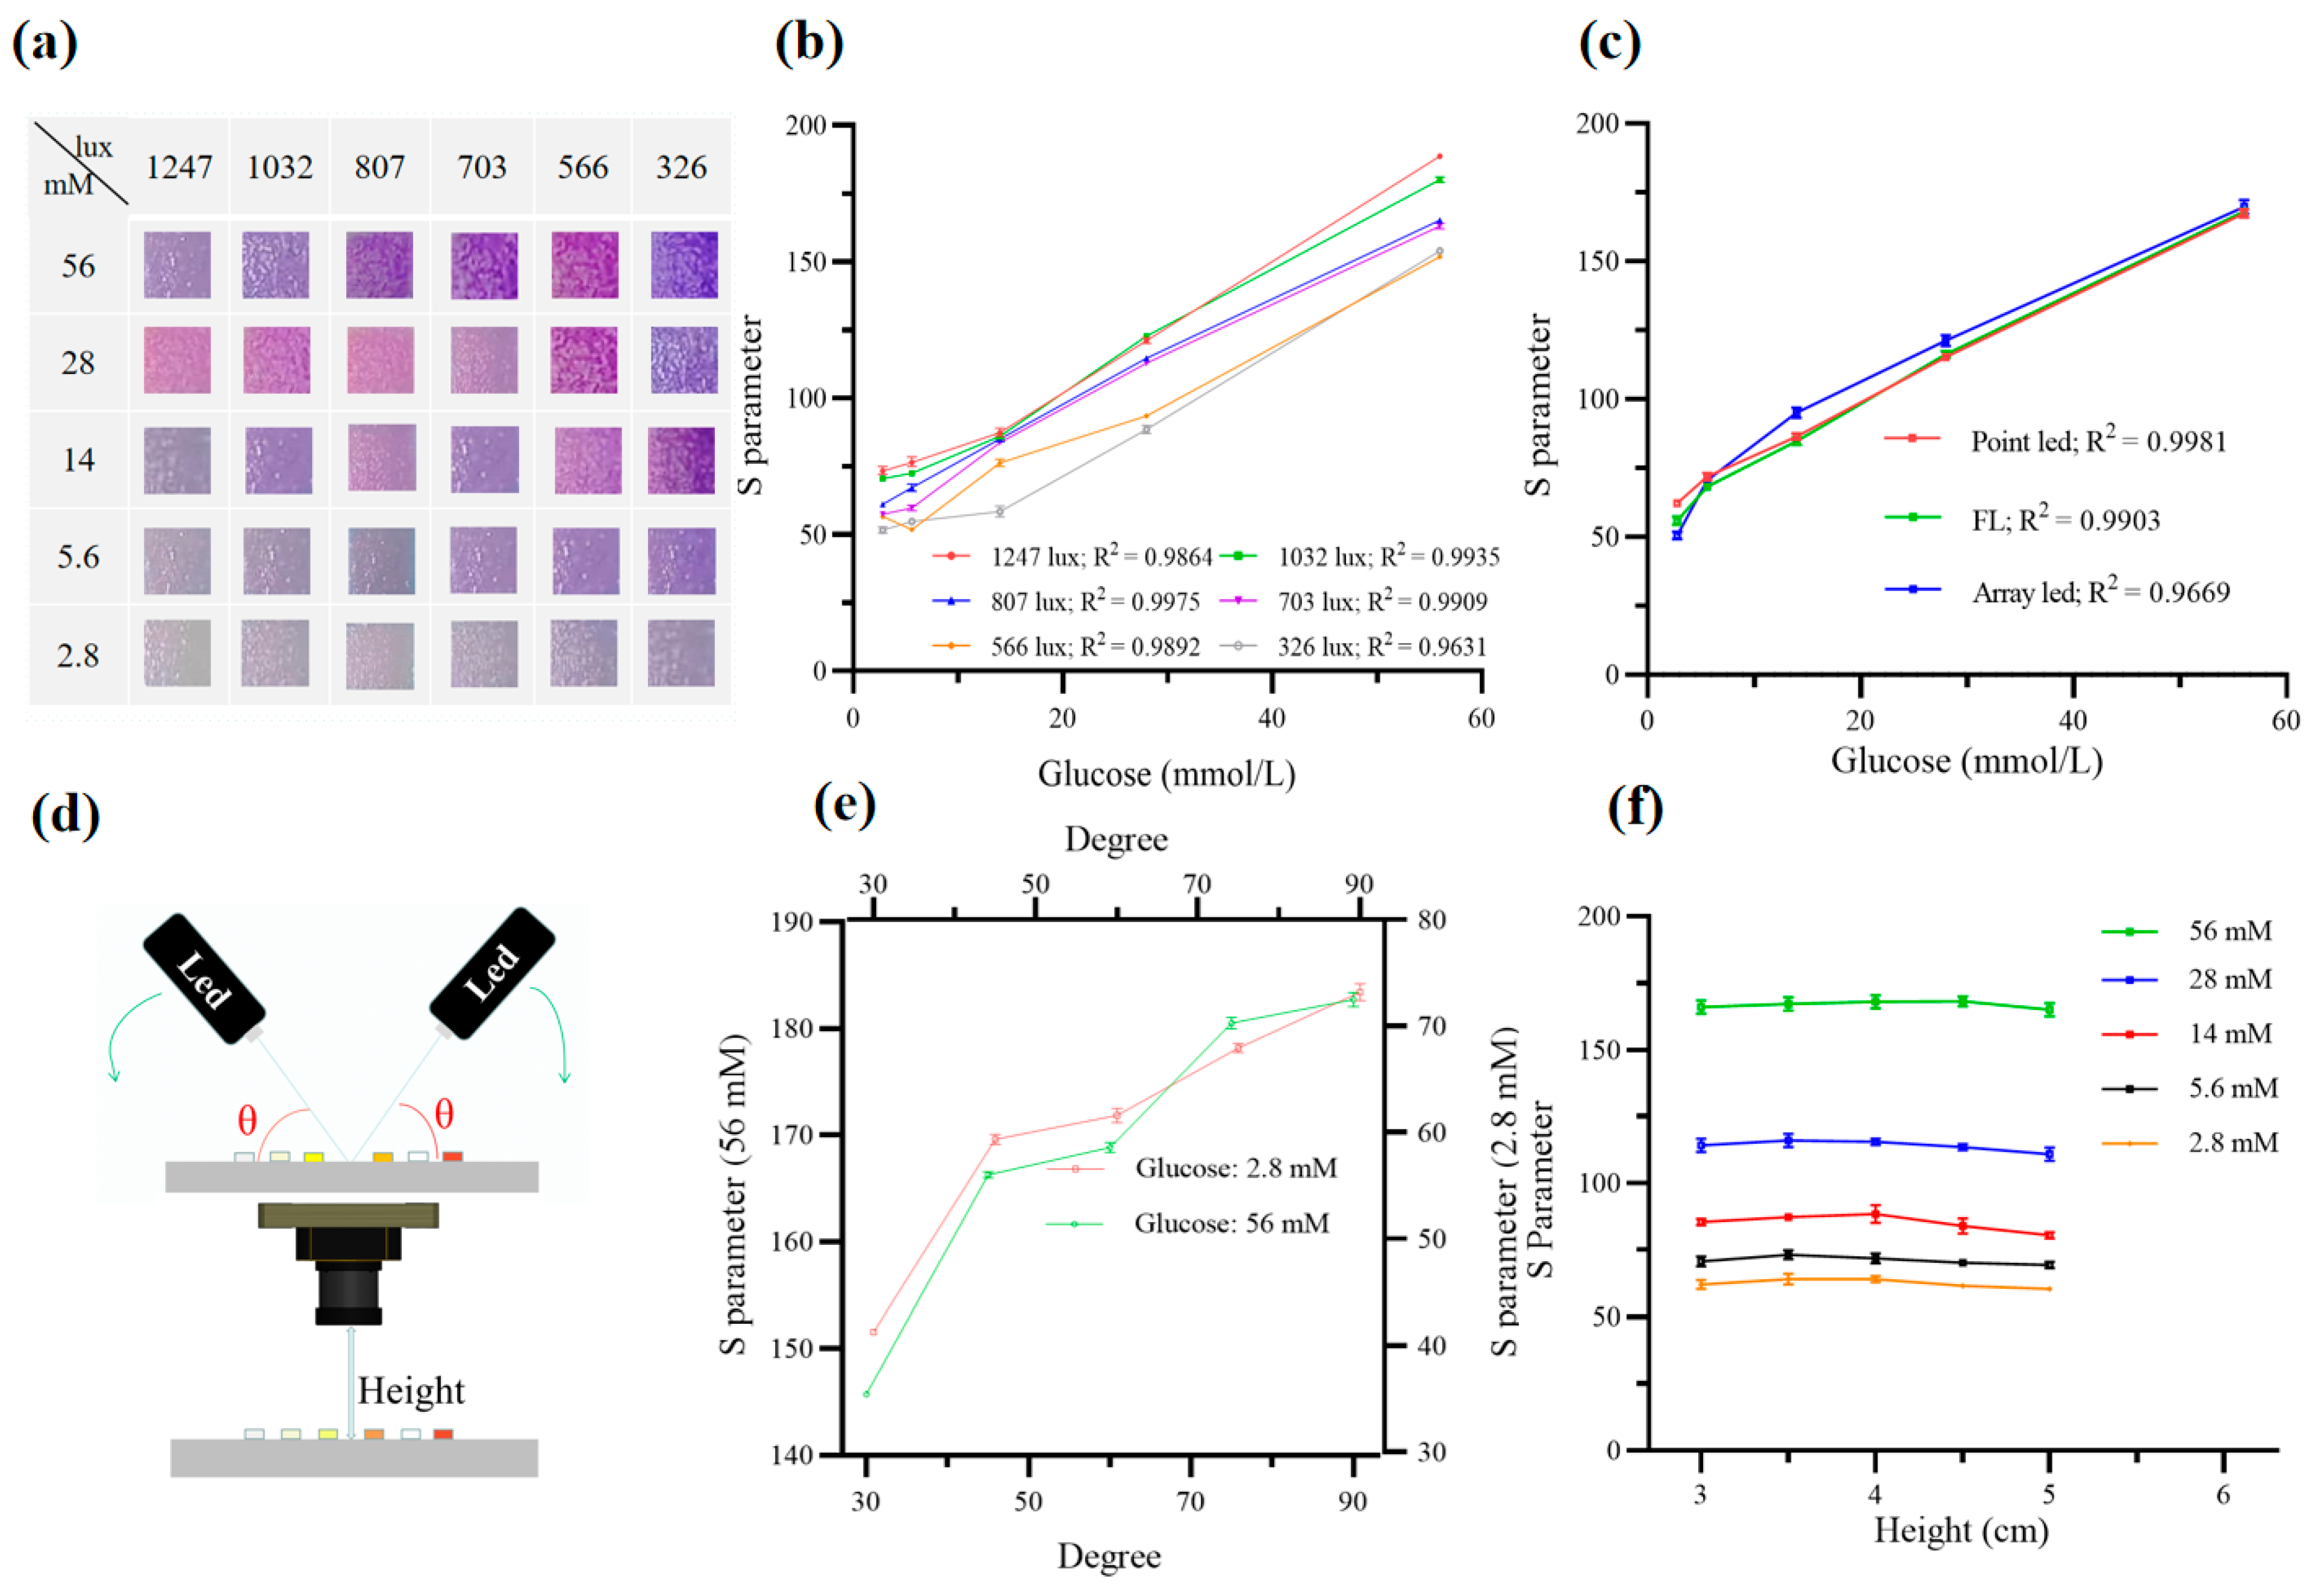
2.5. Optimization of Sensing Conditions for Best Illumination Uniformity

To measure the color intensity, a picture was first taken by a camera and processed by a self-developed software called Getcolor, which was installed on a Raspberry Pi. The software was written in Python with the Opencv and PYQT5 support libraries. Data can also be transmitted to smartphones in real time through Bluetooth. The test strip was directly placed under the camera, and the distance between the test strip and the camera was 5 cm. Images for colorimetric analysis were taken without technical adjustments, such as a filter or close-up shots. The images were imported to the Raspberry Pi application in order to read the HSV parameter values. Then, the relationship between the average HSV values and the analytic concentration was used to plot the working curve for colorimetric analysis. Next, the impact of illumination and illuminance on the test strip color was explored by changing the illumination conditions. All illuminance measurements were performed using an illuminometer (TES1330A, TES Electrical Electronic Co., Ltd., Taipei, China). Finally, the effect of shooting conditions on the illumination uniformity was investigated by changing the height of the camera and the angle of the light source to design a suitable light path structure for the black box.

2.6. Automatic Recognition of the Paper-Based Sensors and the Image Processing Algorithm

Figure S3a in Supporting Information shows a typical sensor array consisting of 6 sensors pads, which detect ketone bodies, glucose, protein, occult blood, pH, and leukocytes in urine from the left to the right. The urine test strip was placed into a holder to determine the fuzzy position of the strip. The template comprised a periodic pattern, and two black bars were drawn at both ends of the normal array, as shown in Figure S3b in Supporting Information. When the camera was turned on, it converted the picture into a single image with an appropriate threshold level and high contrast. After the prefabricated template was projected onto the single image, two black markers and periodic patterns were used to determine the exact location and size of the array. The color changed, along with reaction time, as shown in Figure S4 (Supporting Information), so we set the program to take pictures every 5 s within 60 s upon test strip insertion and to record the number of different pixel points between the two pictures to select the most stable image for color digitization (Figure S5 in Supporting Information). Due to the presence of thick particles on the test strip, the obtained image was denoised using a fast median-filtering algorithm (Figure S6 in Supporting Information). The equation is listed below, where f(x, y) and g(x, y) are the pixel grey values of the original image and the processed image, respectively, and W is a two-dimensional template.
g x , y =   med     f x k ,   y l ,   k ,   l w  
The contrast-enhanced images highlight the target area, which is helpful for the next step. Then, a K-means segmentation algorithm (Figure S7 in Supporting Information) was applied to segment the image in order to determine the target area for color digitization. The color calibration algorithm traverses the pixel points in the target area. For each pixel point, if any component of the RGB channel was higher than the empirical threshold (245), the pixel was considered a reflection point to be deleted (Figure S8 in Supporting Information). Finally, the average RGB value of the target area was calculated.

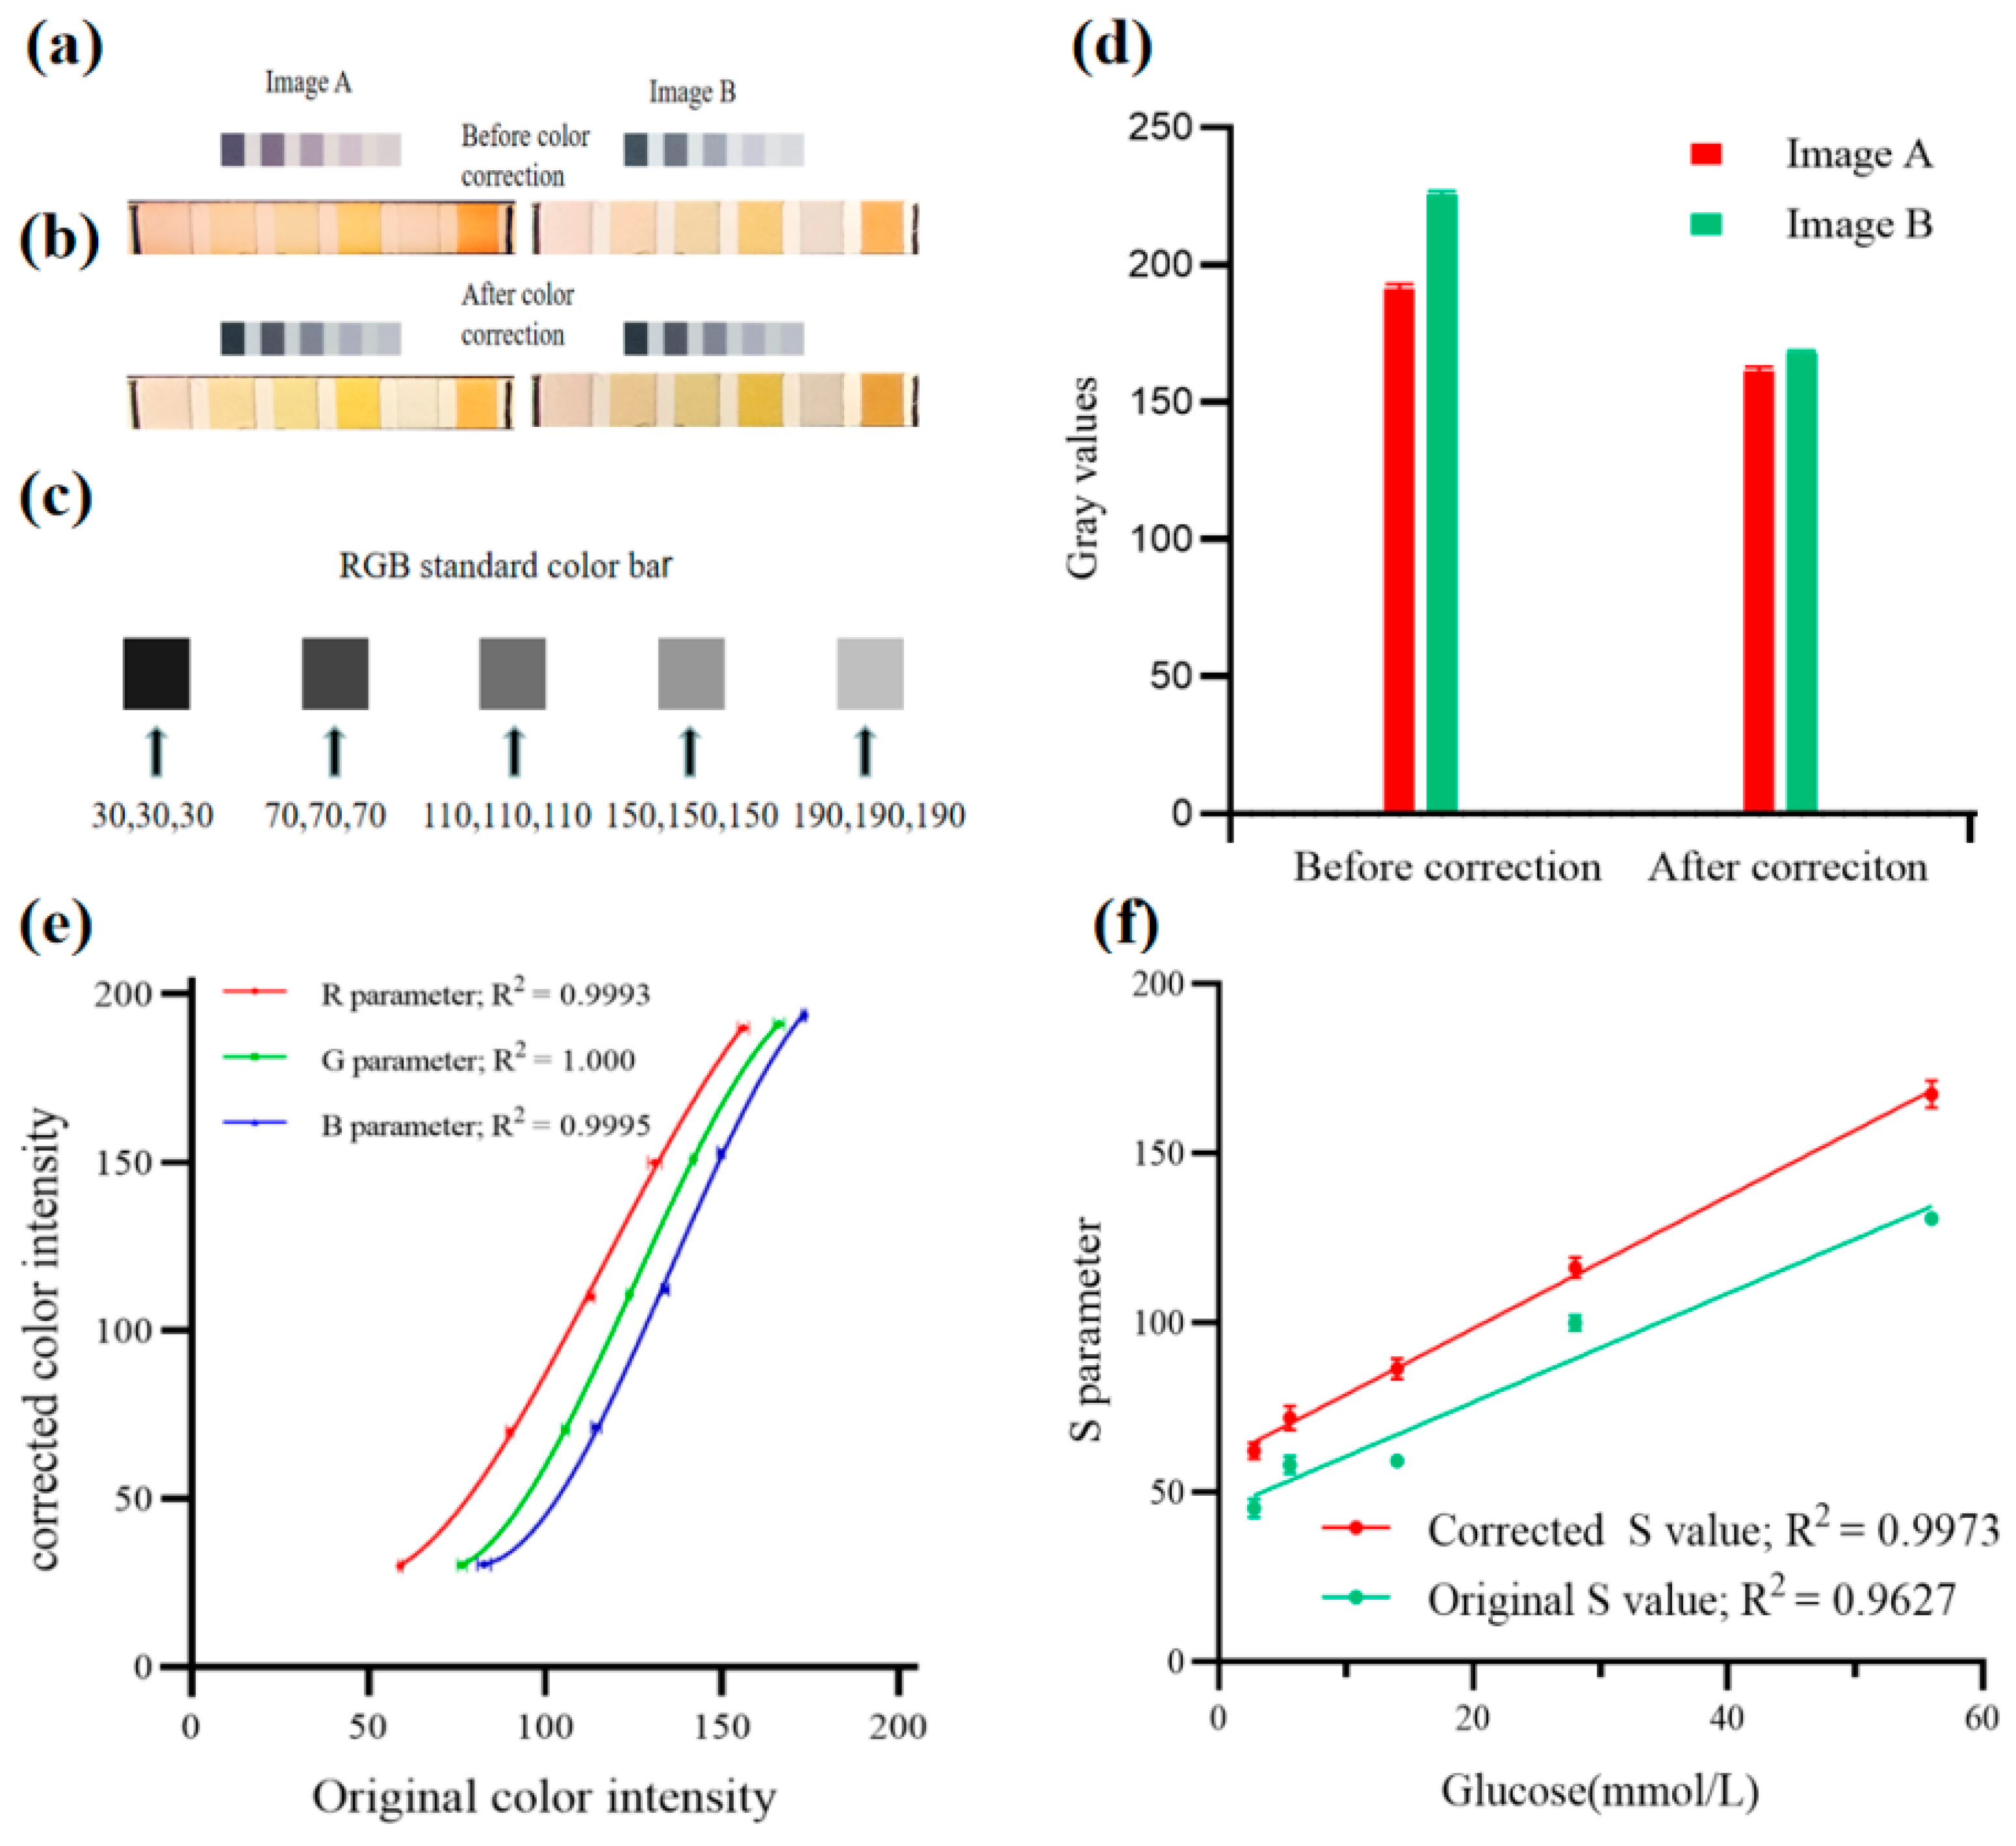
2.7. Color Correction

We used a standard color bar and a Python code to correct color. The Python code automatically recognized the urine test strip. The standard color bar was placed in the black box next to the strip, which was used to establish the calibration curves for color correction with color areas with different RGB values: (30, 30, 30), (70, 70, 70), (110, 110, 110), (150, 150, 150), and (190, 190, 190). By measuring the color intensities of the color bar, three color correction curves for the R, G, and B parameters were established, respectively, using a cubic curve to fit the plots. Then, the calibration curves were used to correct the color intensity of all pixels in the images by replacing the RGB values of the original image in the corresponding calibration curves.

2.8. Detection of Clinical Samples and Statistical Analysis

All experiments using the clinical samples were performed in accordance with institutional and national guidelines. The first urine samples were collected in the morning upon waking with urine sampling tubes and were tested according to the aforementioned procedures. Routine urine data were acquired from the hospital.
The experiment was repeated three times, with a total of 10 samples for each condition. Quantitative data are presented as mean ± standard error of the mean (SEM). Bland–Altman analysis was performed to evaluate the correlation between the glucose concentration measured by the proposed method and the known glucose concentration.

3. Results and Discussions

3.1. Color Correction Using a Standard Color Bar

Images for the urine test strip and standard color bar were taken at different illuminances using the black box. As shown in Figure 2a, there was an obvious difference in color between the two images; the image taken at 1247 lux showed a higher brightness and a lower warmth. However, the two images were similar in color after color correction using the established calibration curves, as shown in Figure 2b. We used the gray values of the urine test strip to represent the color intensity. Figure 2d indicates that the obvious difference in color intensity was eliminated after color correction. The parameters of ordinary mobile phones, such as light condition, camera-lens F number, image algorithms, and photograph condition, including distances and angles, play a critical role in the accuracy of colorimetric detection, which may lead to differences in chromatic aberration in the taken images [28,29]. Due to a fixed distance and angle when shooting with a focused CSI camera, our device with a black box can effectively eliminate the difference in color intensity of photos under different lighting conditions. Figure 2e,f shows the color calibration curves for RGB parameters and an improved liner relationship between the S parameter and glucose concentration after correction. We used a standard color band for color calibration, with dimensions of 20 mm by 5 mm, which considerably reduced the volume of the device.

3.2. Optimization of the Sensing Conditions

The uniformity of illumination and light intensity is very important for the acquisition of color information [30]. Even a slight change in illumination and illuminance can affect the results. Therefore, the influence of illuminance on the colorimetric data was examined using an LED with a varying working voltage. We set the working voltage to 2.6 V, 2.7 V, 2.8 V, 2.9 V, 3 V, and 3.1 V, with a corresponding illuminance of 326 lux, 566 lux, 703 lux, 807 lux, 1032 lux, and 1247 lux, respectively. Photographic images and the corresponding working curves are shown in Figure 3a,b respectively. As shown in Figure 3b, the S parameter was varied within a certain range, which was affected by the illuminance; thus, a suitable illuminance was required to ensure the accuracy of the colorimetric analysis. Furthermore, the working curves plotted at 807 lux yielded an acceptable detection performance, with a determination coefficient of 0.9975 greater than 0.99. Thus, 2.9 V was selected as the suitable working voltage for the subsequent experiments.
In order to investigate whether the colorimetric data were affected by the illumination, glucose concentration-dependent color variation from the urine test strips was obtained under different illuminations. Due to the varying spectral responses of the illuminations, the reflective colors from different light sources showed fairly different RGB intensities. As a result, the S parameters calculated based on the RGB parameter intensities were affected by illumination, so we plotted S parameters vs. glucose concentration, as shown in Figure 3c. Compared to the working curves with an LED point source, that with a fluorescent lamp (FL) showed lower S parameter values at 2.8 mM, which may explain why FL showed lower intensities in the 570–600 nm wavelength range, which was relevant to yellow color, whereas LED showed more even intensities over the whole visible light wavelength, resulting in increased S-parameter intensity for yellow color. Moreover, the point LED source showed better uniformity in light than the array LED source. Therefore, the working curves with an LED point source achieved the best detection performance, with an R2 value of 0.9981. Thus, the 6000 K point LED was selected as the illumination source for the subsequent experiments.
The angular dependence of colorimetry was examined in this study. As shown in Figure 3e, the S parameters intensity was obtained with glucose concentrations of 2.8 mM and 5.6 mM. The images were shot with the angle varying from 90° to 30°, and S parameters significantly changed. The results indicate that a fixed angle was a precondition for colorimetric analysis. We also found that 45 degree illumination can make the light more uniform; therefore, 45 degree illumination was selected for the subsequent experiments. The dependence of distance between the camera and the urine test strip was also examined. Figure 3f illustrates a 5.75% decrease in S parameter values at various glucose concentrations when the distance from the sample was increased by 2 cm with the camera properly focused. Considering a large view to accommodate all test strips and a small device for POCT applications, a distance of 3 cm between the camera and the sample was selected as a fixed shooting distance to ensure the accuracy and repeatability of the colorimetric analysis.

3.3. Optimization of the Algorithm

After the algorithmic process, the linear relationship between the S parameter and glucose concentration was improved; R2 increased from 0.9486 to 0.9993, as shown in Figure 4a,d. Despite a linear relationship between V and glucose concentration, the V value sometimes exceeded 245, which was mistakenly interpreted as reflective points and deleted by the algorithm. The S parameter was more sensitive than the V parameter when the glucose concentration was in the range of 0–10 mM. Thus, the S parameter was selected to establish the working curve rather than the V value.
In order to verify the effectiveness of the algorithm for glucose sensing, we prepared samples with varying glucose concentrations. The calculated curves yielded an excellent linear correlation between the results calculated by our algorithm and the real results. The fitting curve generated by the algorithm (Figure 4e) was closer to the y = x than those shown in Figure 4b, indicating the high accuracy of the algorithm. The glucose oxidase method (GOD) is the gold standard for detection of glucose concentrations [31]. For comparison with data obtained from two measurements, Bland–Altman analysis was used to show the difference [32]. In Figure 4c,f, the horizontal axis represents the average glucose concentrations obtained with the two analysis methods, whereas the vertical axis shows the differences between the two methods. To exhibit whether the differences fell into 95% confidence interval, ±1.96SD lines were drawn in the B&A plot. As shown in Figure 4c, the deviation exceeded the lines at concentrations of 14 mM, 28 mM, and 56 mM but not at 56 mM (Figure 4f), indicating that the colorimetric analysis was more reliable after the algorithm process. Therefore, the algorithm effectively improves the accuracy of colorimetric analysis results.

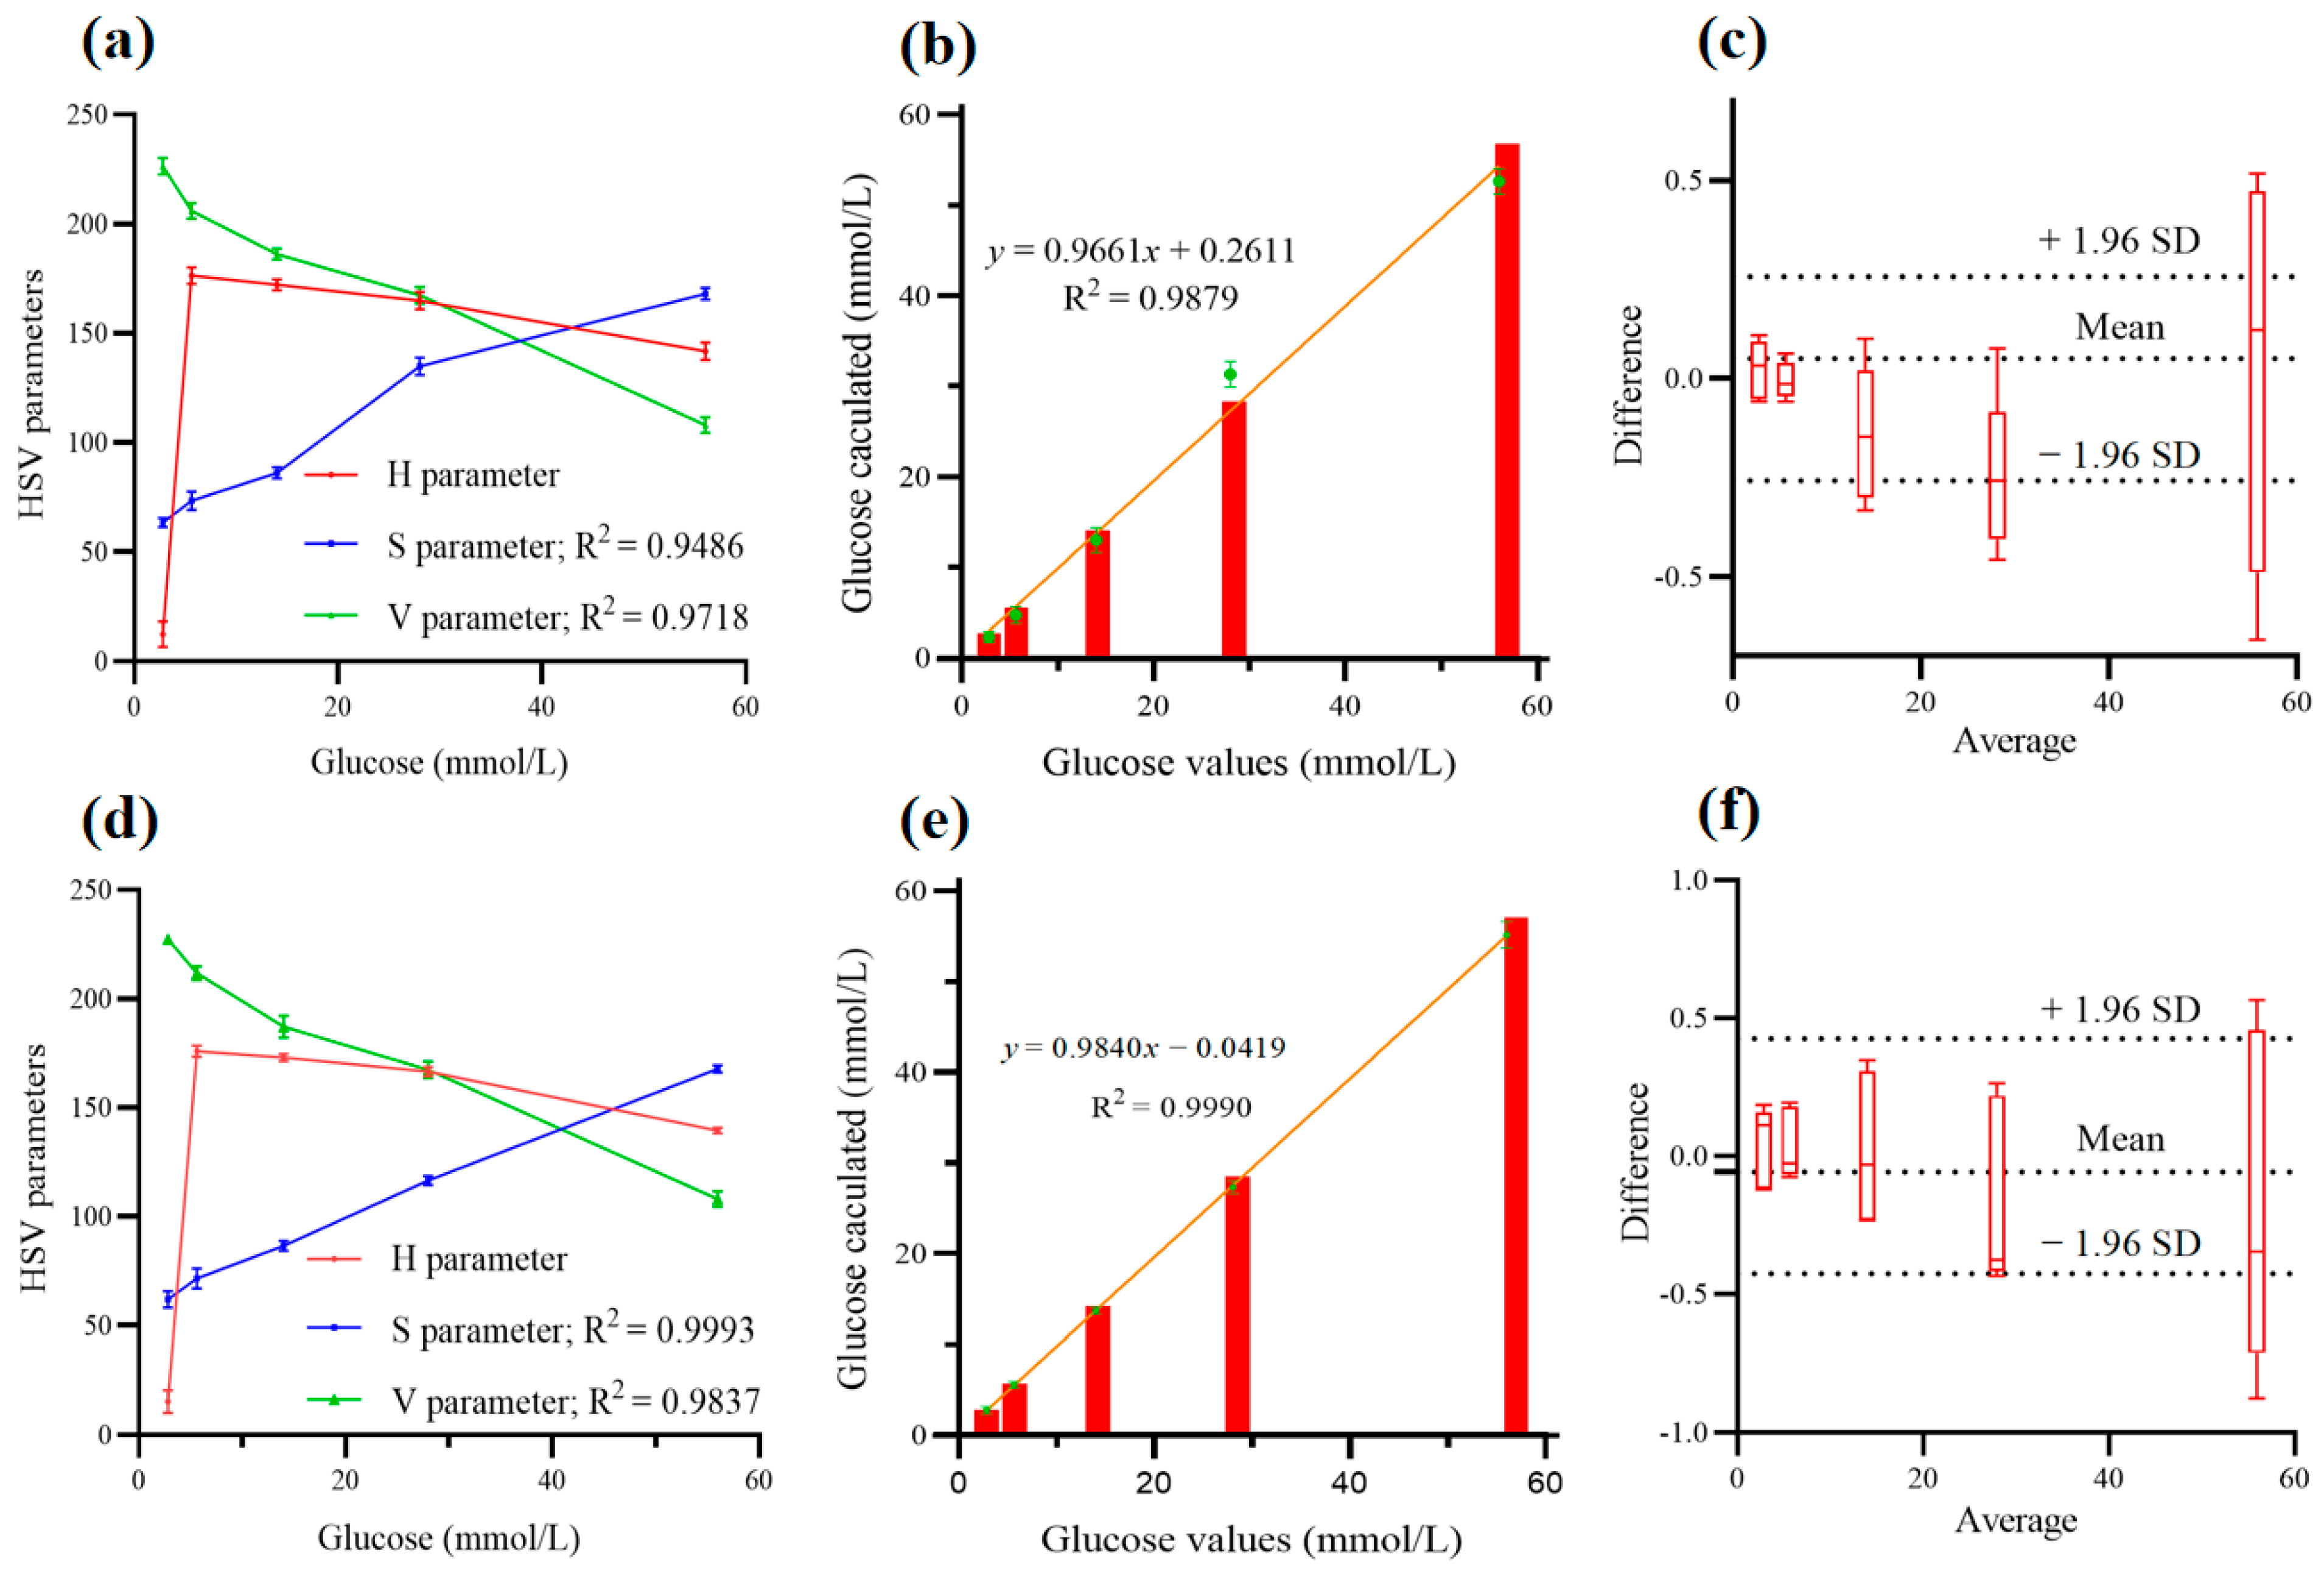
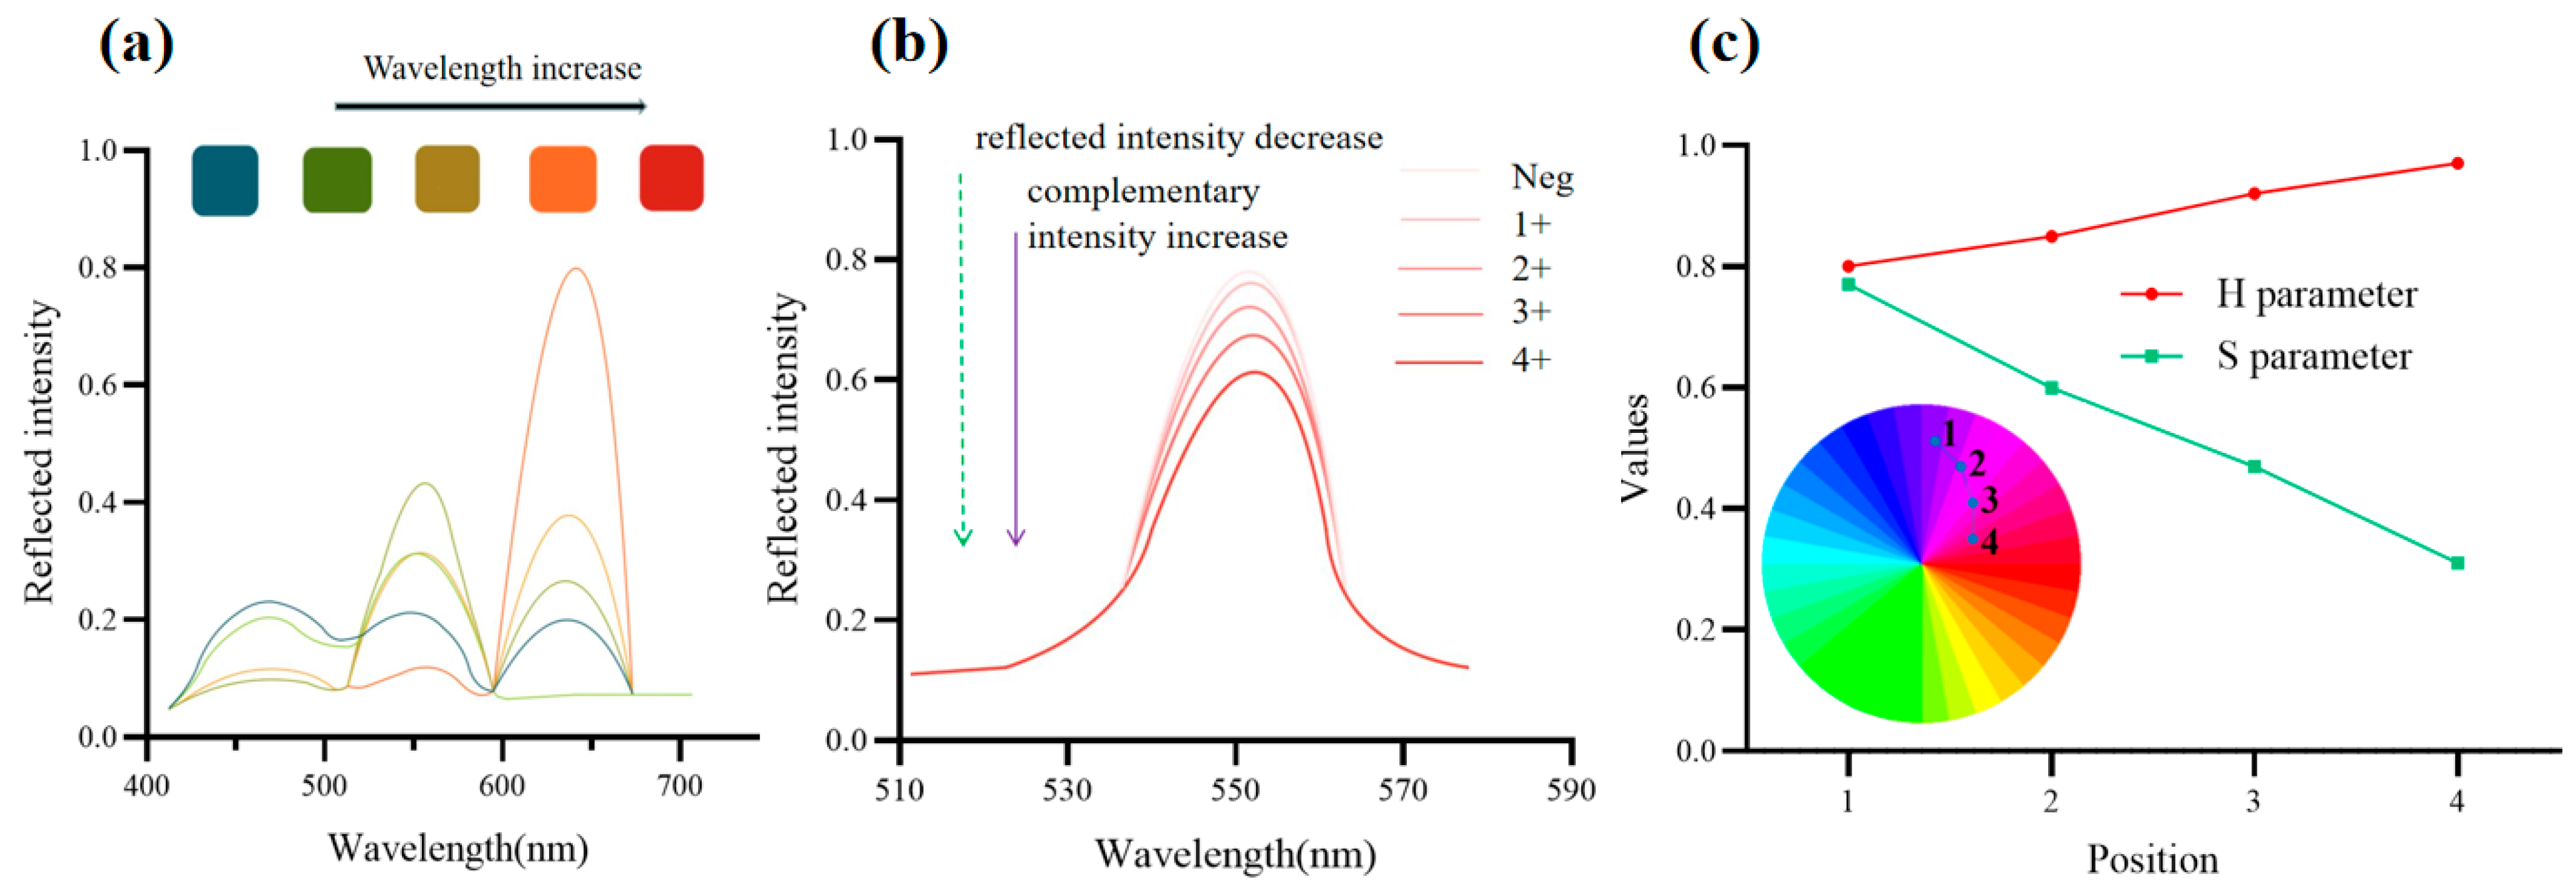
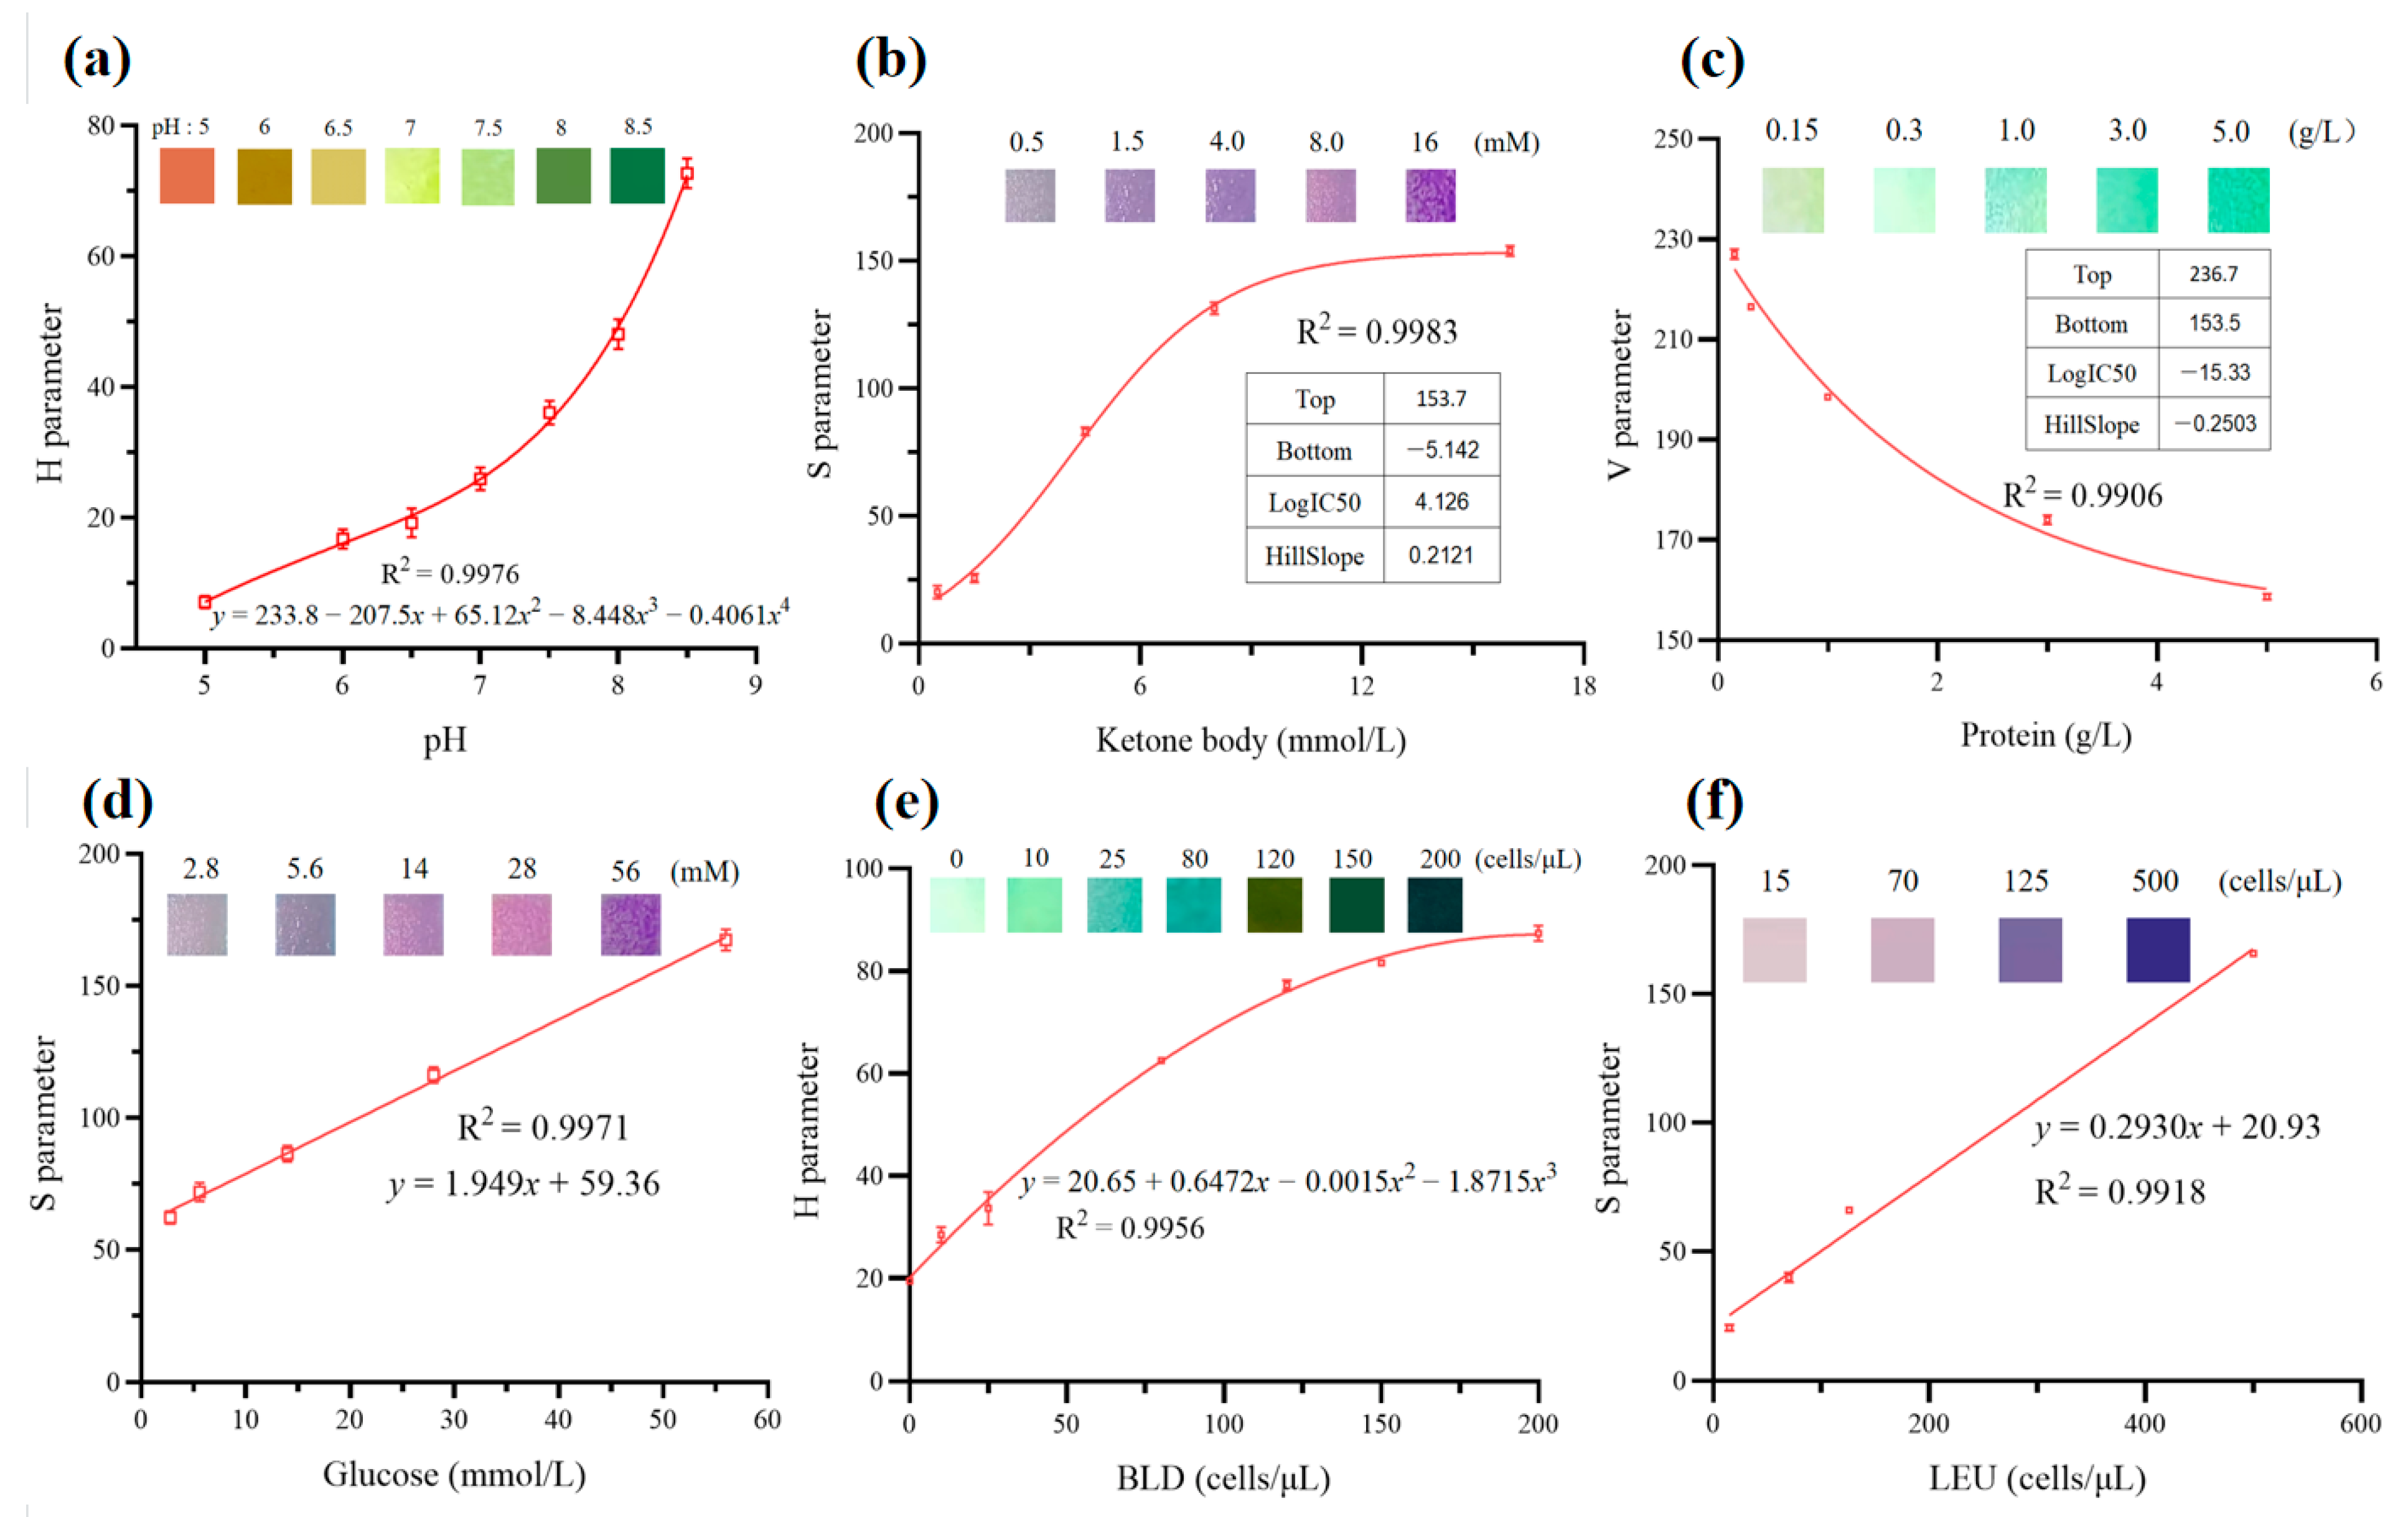
3.4. Conversion of the Correct RGB Color to Analytical Values

The RGB images captured by the camera only contain three RGB parameters with specific wavelengths around 630, 550, and 450 nm. However, the relative ratio of the RGB colors does not generally correspond to the spectral wavelength change, as shown in Figure 5a. The H parameter is a suitable alternative because a color represented by a single value is well-matched with the observed color represented by a wavelength [26,33]. Although the measured RGB colors have fixed wavelengths, the H parameter transformed by the RGB value monotonously changes with the wavelengths. For example, the color change from orange to green when the pH changes from 5 to 8.5 follows the monotonous increase in the H parameter but not the composition of RGB values. Although the pH and H do not have a liner relationship, other non-linear fitting functions can be used to build working curves.
The S parameter represents the intensity, which monotonously changes, along with intensity variety [34]. Because the observed color is measured by the reflection of the incident light on the detected sensors, the increased intensity of a specific color is the result of the decreased intensity of its complementary color. Figure 5b shows the decrease in intensity at 550 nm, with the green color turning paler. However, what was actually observed is the pink color turning more violet. When the concentration of the glucose increased, the decrease in the measured intensity at 550 nm increased the S value.
According to actual detection results, the combined action of the H and S parameters changed the color. It is necessary to determine which parameters are most sensitive in order to identify colors. Figure 5c shows the relationship between the value and the position, along with the color change in both H and S parameters. The results indicate that the S parameter was more sensitive; thus, the S parameter is more well-suited to identify color. After image processing under the optimal sensing condition, the HSV values of the image from the analyte were tested (Figure S9 in Supporting Information). The HSV parameter of each analyte was determined according to the determination coefficient and sensitivity. For example, the S parameter in glucose analysis showed a better coefficient and sensitivity compared with the H and V parameters. Thus, glucose sensing belongs to the S type. Based on this method, we determined each sensor pad in the urine test strip. The sensors belonging to the H type are pH and occult blood; the sensors belonging to the S type are ketone bodies, glucose, and leukocytes; and the sensors belonging to the V type are protein.
The home page, the real-time detection, and the data recording interface of Getcolor are shown in Figure S10 (supporting information). The working curve could be established under the optimal sensing conditions, as shown in Figure 6. The ratio of the H parameter to pH showed a linear relationship from 5 to 7.5 and nonlinear relationship above 7.5 owing to the faster color-change rate of the strip at higher pH [20]. Given a large detection range from the human body, a fourth-order polynomial curve was used to fit the H parameter with pH in the range of 5–8.5, as in a previous study [27]. With respect to the HSV curves of KET, PRO, and BLD at varying concentrations, linear relationships were observed within the front concentration range (KET: 1.5–8.0 mM, PRO: 0.15–2.0 g/L, and BLD: 0–100 cells/μL). The change in signal for each analyte slowed down when as the concentration increased. This could be explained by the consumption of reagent on the strip pads, as reported in a previous study [35]. Therefore, the nonlinear curves were applied in these detection targets. The plots of ketone bodies were well-fitted by a sigmoidal function with an R2 value of 0.9983, as shown below:
y = B o t t o m + T o p B o t t o m / 1 + 10 ^ l o g I C 50 x × H i l l S l o p e
where Bottom is the minimum S parameter, Top is the maximum S parameter, and LogIC50 is the half-maximal concentration of ketone bodies. In the concentration range of 2–60 mM, a linear relationship and high sensitivity were observed between the S parameter and glucose concentration. The linear regression equation was y = 1.949x + 59.36, with a correlation coefficient (R2) of 0.9971. Similarly, the S parameter was linearly and positively correlated with LEU in the range of 15–500 cells/μL. Compared with previous reports with a linear range of 0–350 mg/dL and 5.25–7.5 in glucose and pH, respectively [20], our method has a significantly wider range and a higher sensitivity.
Solutions with glucose concentrations of 2.8 mM, 5.6 mM, 14 mM, 28 mM, and 56 mM were chosen to examine the interday and intraday variations. The interday RSD (n = 5) increased from 3.23% to 5.75%, and intraday RSD increased from 6.12% to 7.28%. The results show that the designed black box can effectively isolate external light, indicating that the optical POCT device had good stability. In a previous paper, a portable urine analyzer powered by a button battery (voltage = 3 V) was reported to continuously work for > 4 h to accommodate more than 1000 tests [19]. In this study, a 5 V lithium battery and a stabilized voltage module (LM2596S) acted as the charging unit to power the LED, providing a stable operating voltage to continuously work for 6 h once charged. Additionally, this method can be completed without the need for large instruments and professional technicians. Furthermore, the device is small and portable, making it suitable for POCT scenarios.

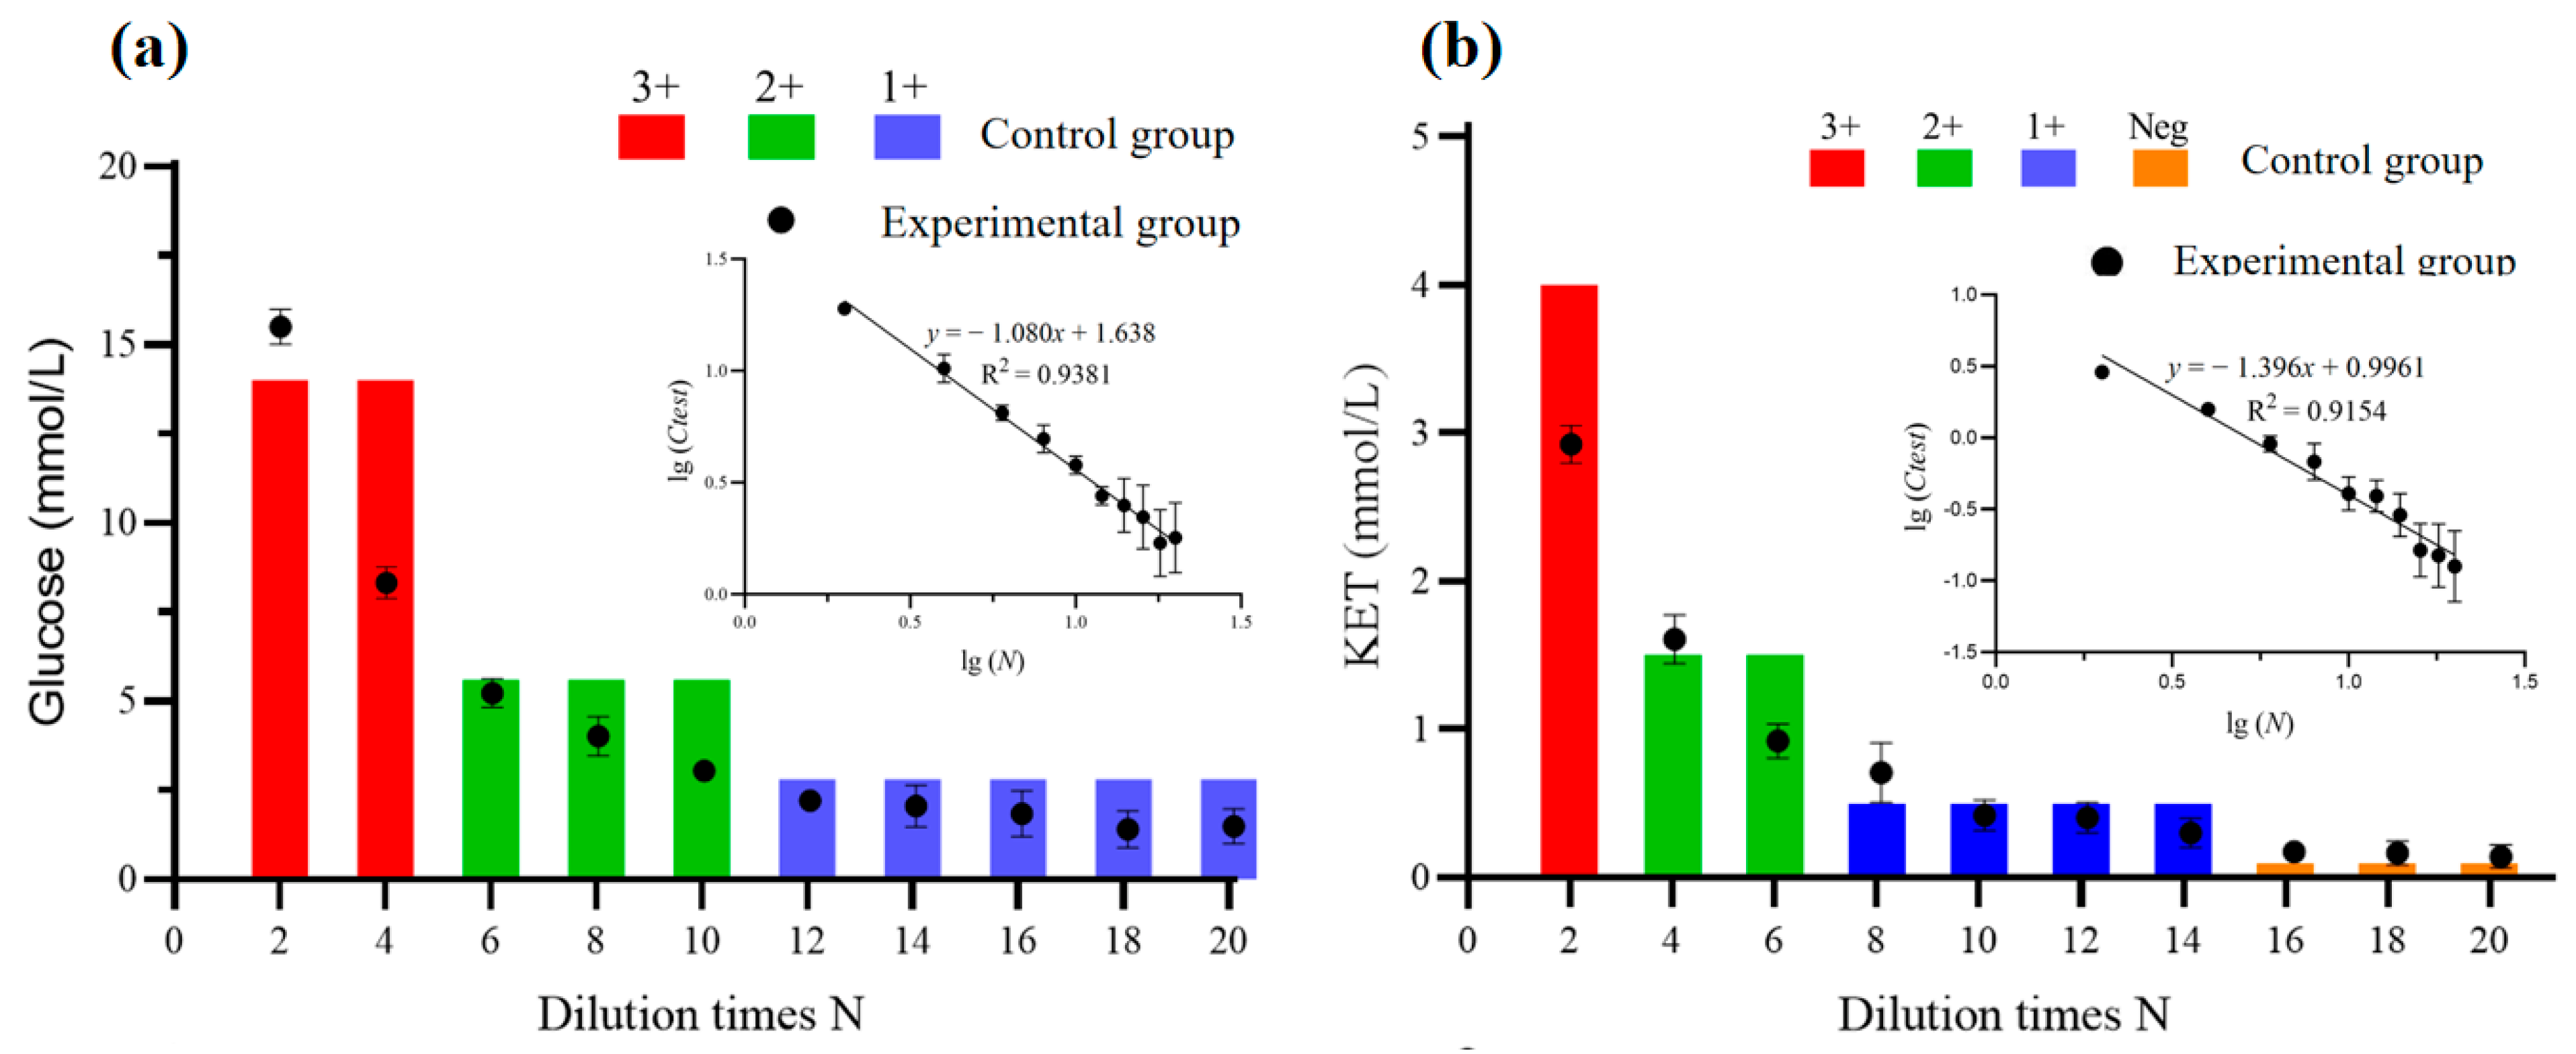
3.5. Determination of the Clinical Samples

For the samples of UQ-11 urine control solutions consisting of highly concentrated glucose, nitrite, ketone bodies, specific gravity, creatinine, calcium chloride, protein, and ascorbic acid, the concentration of a given analysis is defined as Corig, and the concentration of N-fold diluent is defined as Ctest, which satisfies the following relationship:
C t e s t = C o r i g / N
Due to the uncertainty of the value of Ctest, we transform the previous equation to obtain the following relationship between Ctest and the dilution ratio of N:
lg   C t e s t =   lg   C o r i g   lg   N
UQ-11 was diluted 2, 4, 6, 8, 10, 12, 14, 16, 18, and 20 times, as measured by the proposed method, compared with a urinary analyzer (IQ200Sprint, Beckman Coulter Inc., Pasadena, CA, USA) as the gold standard. For example, glucose and ketone bodies exhibited satisfactory consistency between the two methods, as shown in Figure 7a,b, further confirming the effectiveness of sensor optimization and the algorithm. The neg in ketone bodies presented a negative response with a concentration of 0–0.5 mM, and levels “1+, 2+, 3+” were positive responses with concentrations of 1.5, 4.0, 8.0 mM. Information about other analytes is shown in Table S1 (supporting information). The illustration shows a linear relationship between Ctest and the dilution ratio of N, as expected. The limit of detection (LOD) for the glucose sensor and ketone bodies sensor was calculated to be 1.16 mM and 0.33 mM, respectively, based on three times the signal-to-noise ratio; the detailed results are shown in Table 1. Therefore, the proposed method achieved high sensitivity and stability, with potential for the colorimetric analysis of urine test strips.
To further verify the proposed method, 100 urine samples collected from local hospitals were used for clinical analysis. As reported previously [38], the chemical components in urine from different patients lead to color differences, which can be successfully reflected by detection results. In our study, a total of 12 photos were taken to compare the number of different pixels before and after the two photos, and photos with fewest pixels were considered for the following study. Detailed results are shown in Table S2 (Supporting Information), and the accuracies are listed in Table 2. The numbers reflect the degree of coincidence compared with the gold standard, with satisfactory correspondence between the two datasets. Our portable device demonstrated similar performance to that of the hospital instrument. Compared with previously reported studies on the colorimetric detection of urine [17,19,20,21], our device showed a better resolution on concentrations and a shorter detection time, as shown in Table S3 (Supporting Information). The major reason that the matching ratio is not 100% is the urinalysis reagent strip technology itself. Urine dry chemistry analysis is a semi-quantitative analysis method, and there are many interfering materials in urine. As a preliminary screening method, urine dry chemistry analysis cannot achieve measurements with 100% accuracy. Because detection errors occur both with the commercial instrument and our device, the matching ratio of the detecting results is acceptable within the range of 80–100%. The accuracies of the proposed methods perform well, demonstrating that the proposed method is suitable for colorimetric analysis of urine test strips.

4. Conclusions

In this study, a simple and reliable colorimetric method based on an optical POCT device was proposed for multianalyte paper sensing arrays. The proposed color correction algorithm effectively eliminated the influence of external light. Additionally, the H and S parameters were used to extract quantitative analytic information from the digital color images without reference equipment. Glucose-sensing conditions of colorimetry were optimized by regulating lamp brightness, lamp type, lamp angle, and camera height. The detected results indicate that the method was highly accurate for quantitative analysis of each index in urine test strips with increased resolution on concentrations. We established a POCT device for rapid, sensitive, and automatic optical detection, which can potentially be used to assay actual urine samples or for in vitro diagnosis with other strips. As all the components are commercially available and cheap, this represents a suitable application for POCT.

Supplementary Materials

The following supporting information can be downloaded at: https://www.mdpi.com/article/10.3390/photonics9100784/s1, Figure S1: Structure of the optical device; Figure S2: HSV color space matches well with spectroscopic change; Figure S3: Template used for automatic recognition; Figure S4: S vs. time plot showing a kinetic response of a glucose sensor using colorimetry; Figure S5: Pseudocode of the algorithm to determine detection time; Figure S6: Pseudocode of the fast two-dimensional median-filtering algorithm with a time complexity of o(r); Figure S7: Pseudocode of the K-means segmentation algorithm; Figure S8: Pseudocode of the flashing-filtering algorithm; Figure S9: HSV parameters vs. analyte concentrations after image processing under the optimal sensing condition; Figure S10: The Graphical User Interface (GUI) of the software; Table S1: Detailed information for negative responses and positive responses of each analyte; Table S2: Results of real urine sample analysis generated by the proposed colorimetric urinalysis and a hospital instrument; Table S3: Comparison between our method and conventional methods for urine detection.

Author Contributions

Conceptualization, S.F. and J.Z.; data curation, Z.Y.; formal analysis, Z.Y.; funding acquisition, S.F. and J.Z.; investigation, Z.Y; methodology, Z.Y.; project administration, G.C. and S.F.; resources, Z.Y. and G.C.; software, Z.Y.; supervision, G.C.; validation, G.C.; visualization, Z.Y.; writing—original draft, Z.Y.; writing—review and editing, S.F. All authors have read and agreed to the published version of the manuscript.

Funding

The work is sponsored by Shanghai Pujiang Program 21PJ1415000. The authors also gratefully acknowledge the support from the equipment research and development projects of the Chinese Academy of Sciences, ‘On-chip integrated optical biochemical detection key technology research and development team’ (GJJSTD20210006 and YJKYYQ20210049), and the Science and Technology Commission of Shanghai Municipality Project 22xtcx00100. The authors acknowledge our research platform: the State Key Lab of Transducer Technology in Shanghai Institute of Microsystem and Information Technology, Chinese Academy of Sciences.

Institutional Review Board Statement

Not applicable.

Informed Consent Statement

This paper has been approved by the Medical Ethics Committee of the institution.

Data Availability Statement

All data included in this study are available upon request by contact with the corresponding author.

Conflicts of Interest

The authors declare no conflict of interest.

References

  1. Aitekenov, S.; Gaipov, A.; Bukasov, R. Review: Detection and quantification of proteins in human urine. Talanta 2021, 223, 121718. [Google Scholar] [CrossRef] [PubMed]
  2. Ma, L.; Zhang, Z.; Li, X. Non-invasive disease diagnosis using surface-enhanced Raman spectroscopy of urine and saliva. Appl. Spectrosc. Rev. 2020, 55, 197–219. [Google Scholar] [CrossRef]
  3. Tai, W.-C.; Chang, Y.-C.; Chou, D.; Fu, L.-M. Lab-on-Paper Devices for Diagnosis of Human Diseases Using Urine Samples—A Review. Biosensors 2021, 11, 260. [Google Scholar] [CrossRef] [PubMed]
  4. Mapp, I.D.; Davis, L.L.; Krowchuk, H. Prevention of unplanned intensive care unit admissions and hospital mortality by early warning systems. Dimens. Crit. Care Nurs. 2013, 32, 300–309. [Google Scholar] [CrossRef]
  5. Luppa, P.B.; Mueller, C.; Schlichtiger, A.; Schlebusch, H. Point-of-care testing (POCT): Current techniques and future perspectives. TrAC-Trends Anal. Chem. 2011, 30, 887–898. [Google Scholar] [CrossRef]
  6. Zhang, R.-Q.; Liu, S.-L.; Zhao, W.; Zhang, W.-P.; Yu, X.; Li, Y.; Li, A.-J.; Pang, D.-W.; Zhang, Z.-L. A Simple Point-of-Care Microfluidic Immunomagnetic Fluorescence Assay for Pathogens. Anal. Chem. 2013, 85, 2645–2651. [Google Scholar] [CrossRef]
  7. Fu, H.; Yang, J.; Guo, L.; Nie, J.; Yin, Q.; Zhang, L.; Zhang, Y. Using the Rubik’s Cube to directly produce paper analytical devices for quantitative point-of-care aptamer-based assays. Biosens. Bioelectron. 2017, 96, 194–200. [Google Scholar] [CrossRef]
  8. Kang, M.; Kim, E.; Winkler, T.E.; Banis, G.; Liu, Y.; Kitchen, C.A.; Kelly, D.L.; Ghodssi, R.; Payne, G.F. Reliable clinical serum analysis with reusable electrochemical sensor: Toward point-of-care measurement of the antipsychotic medication clozapine. Biosens. Bioelectron. 2017, 95, 55–59. [Google Scholar] [CrossRef] [Green Version]
  9. Hur, J.; Park, H.G.; Kim, M.I. Reagentless colorimetric biosensing platform based on nanoceria within an agarose gel matrix. Biosens. Bioelectron. 2017, 93, 226–233. [Google Scholar]
  10. Choodum, A.; Keson, J.; Kanatharana, P.; Limsakul, W.; Wongniramaikul, W. Selective pre and post blast trinitrotoluene detection with a novel ethylenediamine entrapped thin polymer film and digital image colorimetry. Sens. Actuators B Chem. 2017, 252, 463–469. [Google Scholar] [CrossRef]
  11. Li, F.; He, T.; Wu, S.; Peng, Z.; Qiu, P.; Tang, X. Visual and colorimetric detection of uric acid in human serum and urine using chitosan stabilized gold nanoparticles. Microchem. J. 2021, 164, 105987. [Google Scholar] [CrossRef]
  12. Guo, Y.; Yang, K.; Sun, J.; Wu, J.; Ju, H. A pH-responsive colorimetric strategy for DNA detection by acetylcholinesterase catalyzed hydrolysis and cascade amplification. Biosens. Bioelectron. 2017, 94, 651–656. [Google Scholar] [CrossRef]
  13. Zhou, J.; Xu, X.; Liu, X.; Li, H.; Nie, Z.; Qing, M.; Huang, Y.; Yao, S. A gold nanoparticles calorimetric assay for label-free detection of protein kinase activity based on phosphorylation protection against exopeptidase cleavage. Biosens. Bioelectron. 2014, 53, 295–300. [Google Scholar] [CrossRef]
  14. Yan, X.; Li, H.; Hu, T.; Su, X. A novel fluorimetric sensing platform for highly sensitive detection of organophosphorus pesticides by using egg white-encapsulated gold nanoclusters. Biosens. Bioelectron. 2017, 91, 232–237. [Google Scholar] [CrossRef] [PubMed]
  15. Peng, B.; Chen, G.; Li, K.; Zhou, M.; Zhang, J.; Zhao, S. Dispersive liquid-liquid microextraction coupled with digital image colorimetric analysis for detection of total iron in water and food samples. Food Chem. 2017, 230, 667–672. [Google Scholar] [CrossRef] [PubMed]
  16. Teengam, P.; Siangproh, W.; Tuantranont, A.; Vilaivan, T.; Chailapakul, O.; Henry, C.S. Multiplex Paper-Based Colorimetric DNA Sensor Using Pyrrolidinyl Peptide Nucleic Acid-Induced AgNPs Aggregation for Detecting MERS-CoV, MTB, and HPV Oligonucleotides. Anal. Chem. 2017, 89, 5428–5435. [Google Scholar] [CrossRef] [Green Version]
  17. Hong, J.I.; Chang, B.-Y. Development of the smartphone-based colorimetry for multi-analyte sensing arrays. Lab A Chip 2014, 14, 1725–1732. [Google Scholar] [CrossRef]
  18. Mei, Q.; Jing, H.; Li, Y.; Yisibashaer, W.; Chen, J.; Li, B.N.; Zhang, Y. Smartphone based visual and quantitative assays on upconversional paper sensor. Biosens. Bioelectron. 2016, 75, 427–432. [Google Scholar] [CrossRef]
  19. Ye, J.; Li, N.; Lu, Y.; Cheng, J.; Xu, Y. A portable urine analyzer based on colorimetric detection. Anal. Methods 2017, 9, 2464–2471. [Google Scholar] [CrossRef]
  20. Jalal, U.M.; Jin, G.J.; Shim, J.S. Paper-Plastic Hybrid Microfluidic Device for Smartphone-Based Colorimetric Analysis of Urine. Anal. Chem. 2017, 89, 13160–13166. [Google Scholar] [CrossRef]
  21. Yang, R.; Cheng, W.; Chen, X.; Qian, Q.; Zhang, Q.; Pan, Y.; Duan, P.; Miao, P. Color Space Transformation-Based Smartphone Algorithm for Colorimetric Urinalysis. Acs Omega 2018, 3, 12141–12146. [Google Scholar] [CrossRef] [PubMed]
  22. Perrin, D. Buffers for pH and Metal Ion Control; Springer Science & Business Media: Berlin/Heidelberg, Germany, 2012. [Google Scholar]
  23. Lin, B.; Yu, Y.; Cao, Y.; Guo, M.; Zhu, D.; Dai, J.; Zheng, M. Point-of-care testing for streptomycin based on aptamer recognizing and digital image colorimetry by smartphone. Biosens. Bioelectron. 2018, 100, 482–489. [Google Scholar] [CrossRef] [PubMed]
  24. Chien-Hsuan, K.; Chan-Chiung, L.; Kuan-Hong, C.; Fuu, S.; Lung-Ming, F.; Szu-Jui, C. Microfluidic colorimetric analysis system for sodium benzoate detection in foods. Food Chem. 2021, 345, 128773. [Google Scholar] [CrossRef]
  25. Stubbings, T.C.; Hutter, H. Combining multispectral image information using color. Anal. Chem. 2000, 72, 282A–288A. [Google Scholar] [CrossRef] [Green Version]
  26. Park, H.; Koh, Y.G.; Lee, W. Smartphone-based colorimetric analysis of structural colors from pH-responsive photonic gel. Sens. Actuators B-Chem. 2021, 345, 130359. [Google Scholar] [CrossRef]
  27. Luka, G.S.; Nowak, E.; Kawchuk, J.; Hoorfar, M.; Najjaran, H. Portable device for the detection of colorimetric assays. R. Soc. Open Sci. 2017, 4, 171025. [Google Scholar] [CrossRef] [Green Version]
  28. Zhu, W.; Gong, C.; Kulkarni, N.; Nguyen, C.D.; Kang, D. Smartphone-based microscopes. In Smartphone Based Medical Diagnostics; Elsevier: Amsterdam, The Netherlands, 2020; pp. 159–175. [Google Scholar] [CrossRef]
  29. Hattori, M.; Shirane, S.; Matsuda, T.; Nagayama, K.; Nagai, T. Smartphone-Based Portable Bioluminescence Imaging System Enabling Observation at Various Scales from Whole Mouse Body to Organelle. Sensors 2020, 20, 7166. [Google Scholar] [CrossRef]
  30. Di, W.; Da-Wen, S. Colour measurements by computer vision for food quality control—A review. Trends Food Sci. Technol. 2013, 29, 5–20. [Google Scholar] [CrossRef]
  31. Lott, J.A.; Turner, K. Evaluation of Trinder’s glucose oxidase method for measuring glucose in serum and urine. Clin. Chem. 1975, 21, 1754–1760. [Google Scholar] [CrossRef]
  32. Olofsen, E.; Dahan, A.; Borsboom, G.; Drummond, G. Improvements in the application and reporting of advanced Bland-Altman methods of comparison. J. Clin. Monit. Comput. 2015, 29, 127–139. [Google Scholar] [CrossRef]
  33. Gong, X.; Feng, S.; Qiao, Z.; Chen, Y.-C. Imaging-Based Optofluidic Biolaser Array Encapsulated with Dynamic Living Organisms. Anal. Chem. 2021, 93, 5823–5830. [Google Scholar] [CrossRef] [PubMed]
  34. Cantrell, K.; Erenas, M.M.; de Orbe-Paya, I.; Capitan-Vallvey, L.F. Use of the Hue Parameter of the Hue, Saturation, Value Color Space As a Quantitative Analytical Parameter for Bitonal Optical Sensors. Anal. Chem. 2010, 82, 531–542. [Google Scholar] [CrossRef] [PubMed]
  35. Xiang, J.; Zhang, Y.; Cai, Z.; Wang, W.; Wang, C. A 3D printed centrifugal microfluidic platform for automated colorimetric urinalysis. Microsyst. Technol.-Micro-Nanosyst.-Inf. Storage Process. Syst. 2020, 26, 291–299. [Google Scholar] [CrossRef]
  36. Zhang, B.; Sun, L.; Yu, H.; Xin, Y.; Cong, Z. Wavelet denoising method for laser-induced breakdown spectroscopy. J. Anal. At. Spectrom. 2013, 28, 1884–1893. [Google Scholar] [CrossRef]
  37. Hore, A.; Ziou, D. Image Quality Metrics: PSNR vs. SSIM. In Proceedings of the 2010 20th International Conference on Pattern Recognition, Istanbul, Turkey, 23–26 August 2010; pp. 2366–2369. [Google Scholar] [CrossRef]
  38. Deville, W.L.J.M.; Yzermans, J.C.; van Duijn, N.P.; Bezemer, P.D.; van der Windt, D.A.W.M.; Bouter, L.M. The urine dipstick test useful to rule out infections. A meta-analysis of the accuracy. BMC Urol. 2004, 4, 4. [Google Scholar] [CrossRef]
Figure 1. Schematic illustration of an optical POCT-based colorimetric analysis device for urinalysis of reagent strips via the RGB-to-HSV color conversion method. (a) Sample collection; (b) optical detection based on a POCT device; (c) conservation from RGB color space to HSV color space; (d) image analysis using software installed on Raspberry Pi; (e) physical map of the optical device; (f) diagram of the optical device; (g) expanded views of the optical device designed using SolidWorks software.
Photonics 09 00784 g001
Figure 2. Principle of color correction using a standard color bar. (a) The photographs taken at 1247 lux and 326 lux showed obvious differences in color. (b) After color correction, no obvious difference can be observed. (c) Standard color bar used for color calibration. (d) Color intensity of the strip before and after color correction. (e) Three color calibration curves for R, G, and B parameters were established. Error bars show the standard derivation (n = 3). (f) The standard curve of glucose before and after color correction.
Photonics 09 00784 g002
Figure 3. Optimization of the sensing conditions. Error bars show the standard derivation (n = 3). (a) Glucose-dependent paper sensor images captured by the CSI camera with varying illuminance from LED. (b) S parameter vs. glucose plots measured at six different illuminances. (c) S parameter vs. glucose plots measured with different illumination conditions (FL, LED I-point light, LED II-array light). (d) Schematic illustrations showing different angles and heights for image capture. (e) S parameter vs. angle plots measured at glucose concentrations of 2.8 mM and 56 mM. (f) Comparison of S vs. glucose plots obtained from the images taken at varying distances from the sensor.
Photonics 09 00784 g003
Figure 4. Comparison of results before and after the algorithm process. (a,d) HSV parameters vs. glucose. (b,e) Glucose concentration was analyzed using the proposed method and the glucose oxidase method. The horizontal coordinates represent the true values of the glucose concentration, and the vertical coordinates represent the values measured by the POCT device. (c,f) B&A plots based on colorimetric analysis and GOD.
Photonics 09 00784 g004
Figure 5. Conversion of color intensity to analytical values. (a) The spectra simulated by mixing each RGB spectrum with the same ratios of the displayed colors. (b) The displayed spectra simulated to present only at 550 nm with increased glucose concentration. Neg represents a glucose concentration of 0–0.55 mM. The levels “1+, 2+, 3+, 4+”, as positive responses, represent concentrations of 5.6, 14, 28, and 56 mM, respectively. (c) Plots for H and S values, along with positions 1 to 4.
Photonics 09 00784 g005
Figure 6. Measurement of the HSV values for (a) pH, (b) ketone bodies, (c) protein, (d) glucose, (e) occult blood, and (f) leukocytes with varying concentrations.
Photonics 09 00784 g006
Figure 7. Comparison of the results of the proposed colorimetric urinalysis and those obtained with a hospital instrument for the detection of (a) glucose and (b) ketone bodies.
Photonics 09 00784 g007
Table 1. The sensitivity of each analyte.
AnalyteSensitivity
KET0.33 mM
GLU1.16 mM
PRO0.10 g/L
BLD0.37 cells/μL
pH4.72
LEU9.03 cells/μL
The LOD was evaluated using the standard curves of each analyte and the formula LOD = 3σ/S, where σ is the relative standard deviation of the standard solution, and S is the slope of the standard curve [36]. SNR was estimated for a standard solution of level 1+. The signal and noise values were calculated by a Python code [37]. An SNR value in this study is identified as 36.21.
Table 2. Comparison of the detection results generated by the proposed colorimetric urinalysis and a hospital instrument.
AnalyteNegativePositive
Level1+Level2+Level3+Level4+
KET86.7%80.0%---
GLU90.1%85.7%87.5%83.3%83.3%
PRO84.2%80.1%83.3%80.0%-
BLD91.5%84.0%84.2%88.9%-
pH86.0%----
LEU85.5%81.9%84.2%81.8%-
Publisher’s Note: MDPI stays neutral with regard to jurisdictional claims in published maps and institutional affiliations.

