1. Introduction
The optical frequency comb (OFC), which is composed of a series of equally spaced discrete-frequency components with coherent stable-phase relationships, has always been a research hotspot due to its wide applications including optical precision measurement, optical communication, optical sensing, military, and so on [
1,
2,
3,
4]. At present, OFC-generation technologies are mainly based on mode-locked lasers [
5], non-linear effects in non-linear media [
6,
7,
8,
9], optoelectronic oscillators [
10], and electro-optical modulators [
11]. Among them, OFCs based on non-linear effects in non-linear optical fibers [
6], micro-resonators [
7,
8], and lithium niobate waveguides [
9] have attracted extensive attention because of their advantages of a large number of comb lines and wide spectral range.
A semiconductor optical amplifier (SOA) not only has the advantages of small size and easy integration but also has rich non-linear effects [
12,
13,
14,
15,
16], such as the cross-gain modulation effect, cross-phase modulation effect, and four-wave mixing (FWM) effect. It is widely used in all-optical signal processing, such as all-optical wavelength conversion, all-optical logic gates, 3R regeneration [
14], and comb expansion [
16]. Usually, the injection current of an SOA is a direct current. Although an SOA can be directly modulated by electrical signals, the limited modulation bandwidth of an SOA causes the degradation of modulation performance [
17,
18]; therefore, there are very few studies on the direct modulation of an SOA.
In this paper, a novel OFC generation scheme based on single-tone modulation and the FWM effect in one single SOA is proposed. In this scheme, only one single continuous light beam is input into an SOA, whose injection current is a radio frequency (RF) current. In the SOA, the combination of single-tone modulation and the FWM effect results in a large number of new frequency components. Thus, an OFC with a large number of comb lines can be achieved using this simple scheme. A comprehensive broad-band dynamic model, which takes into account single-tone modulation and the FWM effect in an SOA, is presented. The effects of the amplitude and frequency of the RF modulation current, the input optical power on the number of comb lines, power variation, the average optical power, and the spectral bandwidth of the OFC are investigated in detail.
2. Operation Principle
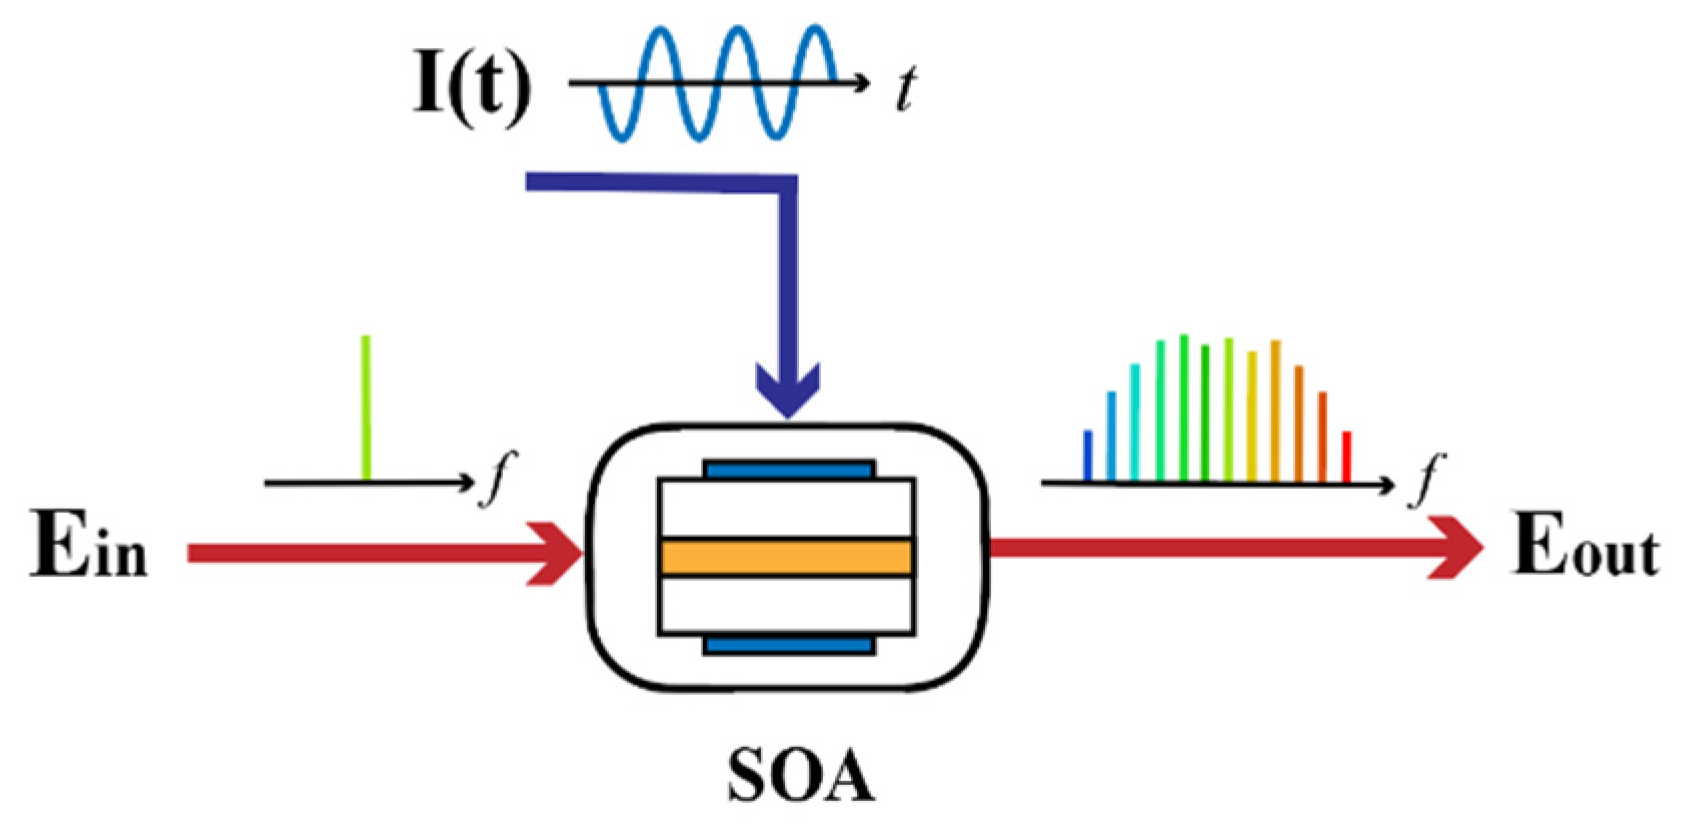
The schematic diagram of the proposed OFC based on single-tone modulation and the FWM effect in a single SOA is shown in
Figure 1. A continuous-wave (CW) light with angular frequency
ωc is input into an SOA, whose injection current is a sinusoidal RF signal
I(
t) with angular frequency
ωm. The polarization direction of the input optical carrier is controlled by a polarization controller to excite the TE mode in the SOA. The injected RF current causes a change in the carrier density of the SOA, which, in turn, changes the gain of the SOA. Therefore, the input CW light is directly modulated by the injected RF current to generate several new frequency components that have the same polarization direction as the input at frequency
ωc + n
ωm, where n = ±1, ±2, ±3, … [
18]. Meanwhile, the FWM effect will occur among these equally spaced lightwaves, resulting in additional new frequency components with the same adjacent-frequency interval
ωm [
15]. Therefore, the combination of single-tone modulation and FWM generates a large number of new frequency components. The optical spectrum produced by single-tone modulation has a Gaussian distribution and the FWM effect can make the power difference between frequency components smaller. Thus, an OFC with frequency interval ω
m can be achieved using this scheme.
3. Broad-Band Dynamic Model
- A.
The traveling-wave equations.
In the numerical model, the SOA is divided into
q subsections. When
q is sufficiently large, the carrier density in each subsection is considered uniform. Although only a CW light is input into the SOA, a large number of optical frequencies are generated due to the single-tone modulation and FWM effect. Assuming that the number of optical frequencies is
n, the traveling-wave equations at frequency
ωj in the subsection
can be expressed as [
15,
19]
where
Aj,i is the normalized slowly varying envelope of the light field, Г is the mode confinement factor,
gj,i (
N) is the material-gain coefficient of the SOA,
Pi = Σ
j|
Aj,i|
2 is the total optical power inside
i subsection,
α is the linewidth enhancement factor,
αint is the loss of the SOA,
Ρsat is saturation power, and coefficients
ηjj’ (
j ≠ j′,
j = 1, 2, … n) represent the non-linear interactions among the mixing waves [
15].
The first term on the right side of Equation (1) represents the gain modulation caused by the modulation current and the loss caused by scattering, absorption, etc.; the second term represents the cross-phase modulation effects between ωj and the others; and the third term represents the FWM effects among lightwaves satisfying the condition of ωj + ωl = ωk + ωm.
The material-gain coefficient of the SOA
gj,i(
N) can be expressed as [
20]
where
ν is the optical frequency,
N is the carrier density,
e is the electron charge,
h is the Planck constant,
ε0 is the vacuum permittivity,
m0 is the free-electron mass,
mc is the effective mass of an electron in the conduction band,
mhh is the effective mass of a heavy hole in the valence band,
c is the speed of light in vacuum,
ng is the refractive index, |
M|
2 is the momentum matrix element,
Eg is the bandgap energy, and
ƒc and
ƒv are the Fermi–Dirac distributions for the conduction and valence bands, respectively. They can be expressed as
where
- B.
The traveling-wave equations for the ASE spectrum.
In the SOA, in addition to optical amplification, there exists amplified spontaneous emissions (ASEs). To calculate the contribution of the ASE spectrum, the whole spontaneous emission spectrum is divided into
M segments. The traveling-wave equations for the ASE spectrum in the wavelength between
λx−1 and
λx can be expressed as [
21]
where
Wx,i(
z, t) is the power spectrum density at wavelength
λx in subsection
I and
gx,i′ is the stimulated emission rate per unit length, and it is given by
- C.
The carrier-density-rate equation.
The carrier density in subsection
i can be described by the rate equation
where
I(
t) =
I0 exp(
iωmt) is the modulation current with angular frequency
ωm;
I0 is the magnitude of the modulation current;
w,
d, and
L are the width, thickness, and length of the active region, respectively;
c1 is the non-radiative recombination coefficient;
c2 is the bimolecular recombination coefficient; and
c3 is the Auger recombination coefficient.
Gj,i =exp(
gj, i L/
q) is the gain in subsection
i.
The first term on the right side of Equation (11) represents the carrier injection caused by the modulated RF current; this means that the gain of the SOA is also modulated and, in turn, the lightwaves in the SOA are modulated. The second term represents the carrier consumption due to spontaneous radiative recombination and non-radiative recombination. The third and fourth terms are the carrier consumptions induced by the stimulated emission for the lightwaves and the ASE spectrum. The ASE affects the carrier density N and the gain coefficient, which, in turn, affects the lightwave modes through traveling-wave equations.
There are two steps in the solution to Equation (11) in our broad-band dynamic model. The first step is to use Connelly’s steady-state model (dN/dt = 0) to calculate the carrier-concentration distribution in the SOA through iteration as the second step’s initial condition. In this step, the injected current of the SOA is a direct current. The second step is to solve the dynamic carrier-density-rate equation (dN/dt ≠ 0). The injected current of the SOA is I(t). Firstly, we convert the differential equation into a difference equation to find the carrier density in the next period. Afterward, we update the carrier density and substitute it into the traveling-wave equations to calculate the optical power of each segment.
4. Simulation Results and Discussion
The proposed OFC based on single-tone modulation and the FWM effect in a single SOA was simulated by using OptiSystem software. In the simulation, the center frequency of the CW light was 193.1 THz, the linewidth was 10 MHz, and the input optical power was 20 dBm. The RF source output a sinusoidal current with an amplitude of 0.2 A and the modulation frequency was 10 GHz. The parameters of the SOA can be found in Reference [
18].
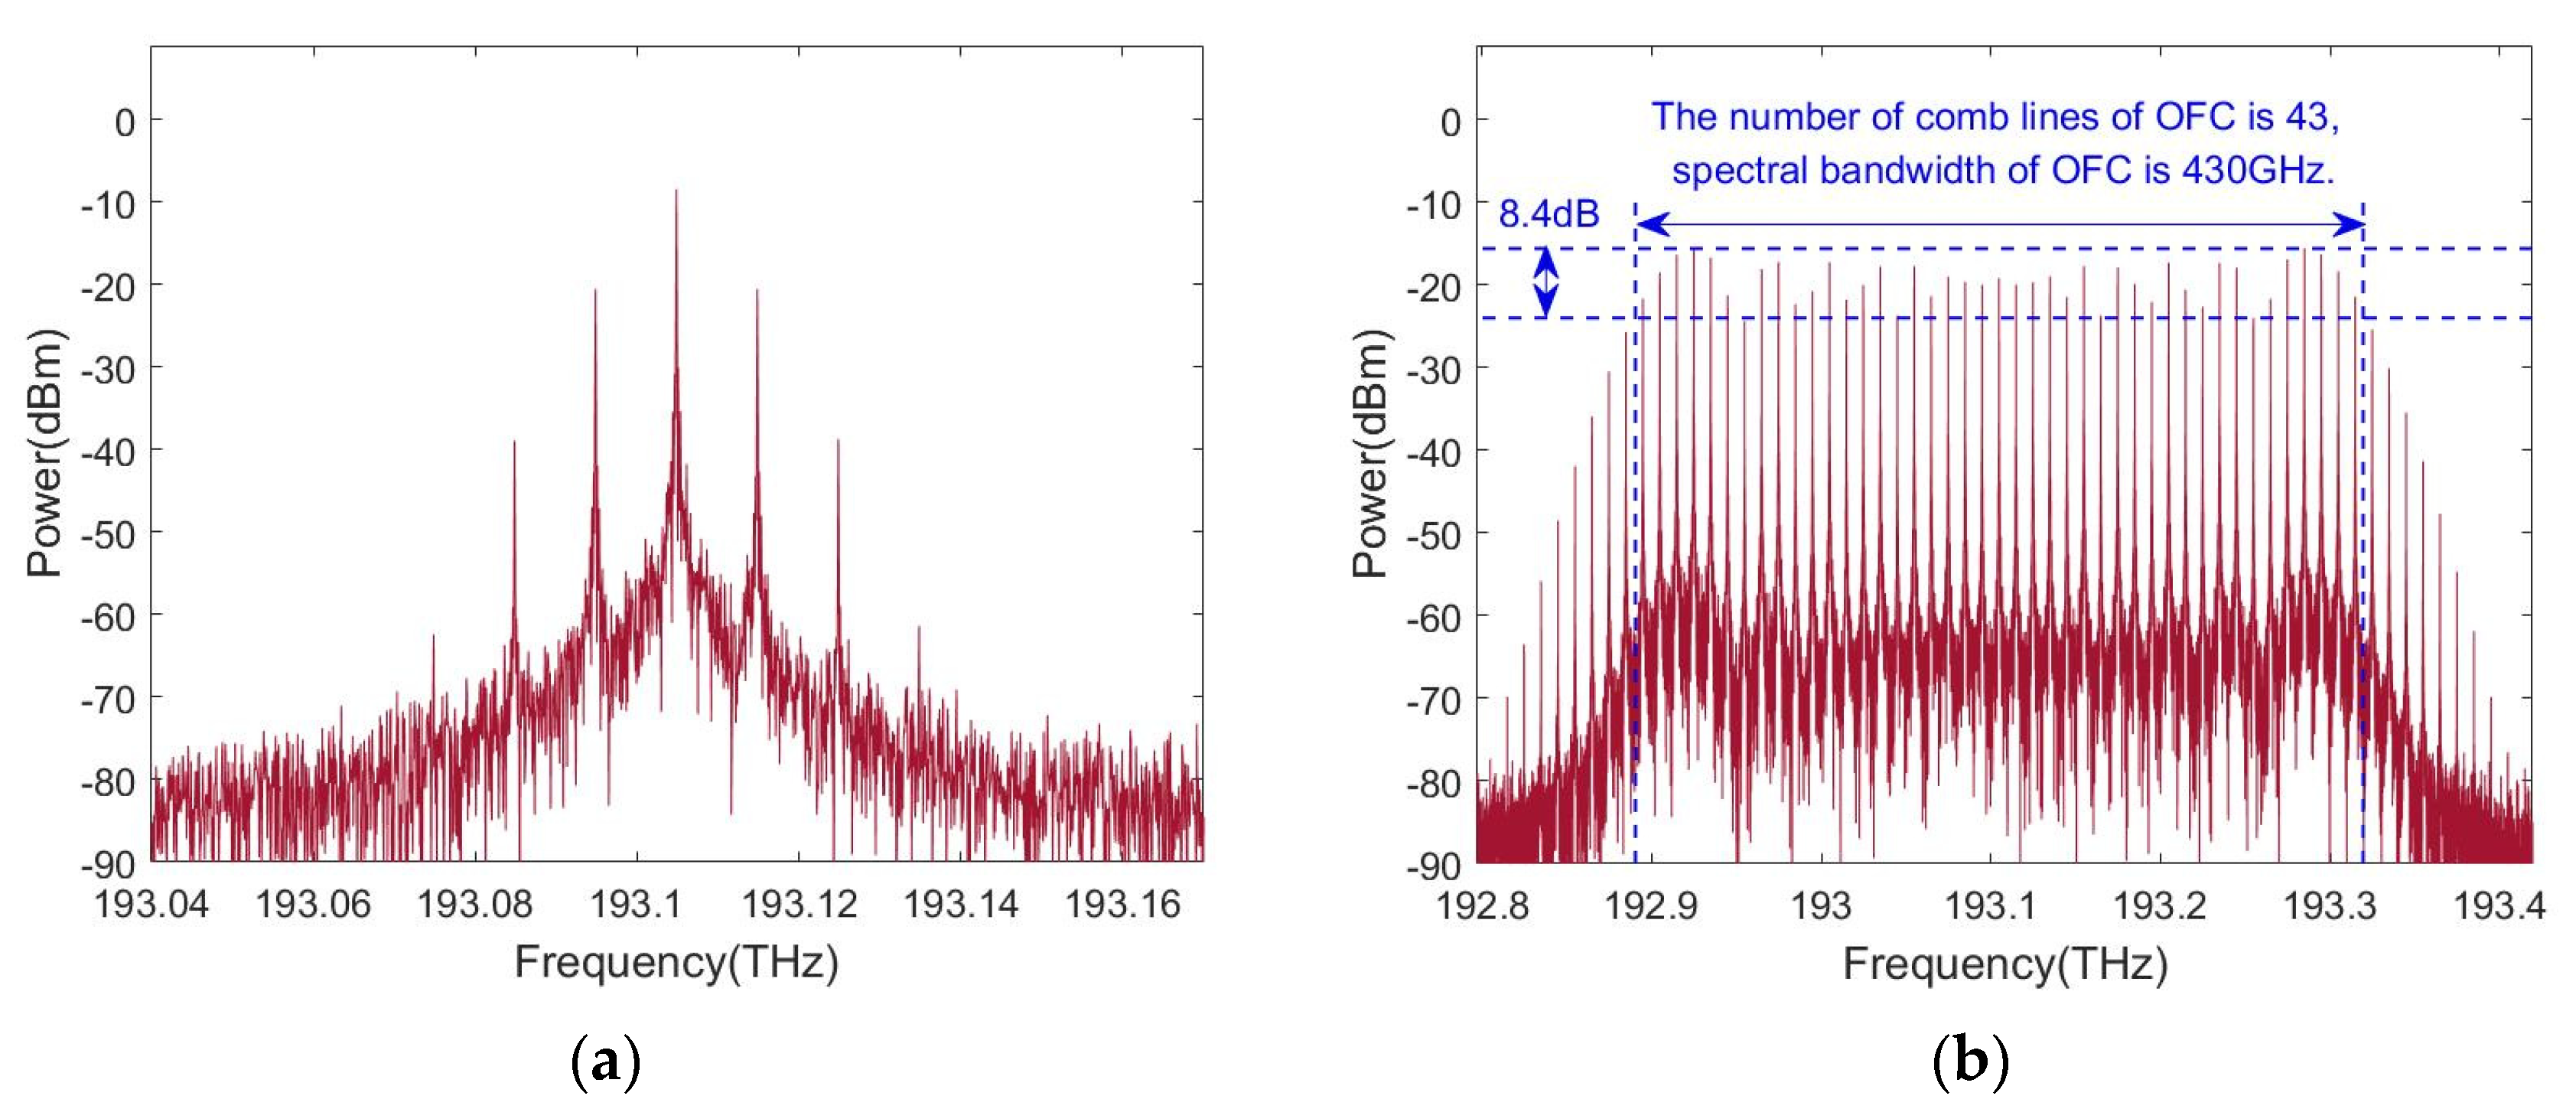
Figure 2a shows the optical spectrum output from the SOA when the FWM effect is ignored. It can be seen that in the SOA, the input CW light is single-tone-modulated by the injected RF current to generate several new frequency components at frequency
ωc + n
ωm.
Figure 2b shows the optical spectrum output from the SOA when the FWM effect is considered. It is clear that when the injected current of the SOA is an RF current, even if only one CW light is input into the SOA, an OFC output can be achieved based on the single-tone modulation and the FWM effect in the SOA. The number of comb lines of the OFC is defined as the number of comb lines in a spectral bandwidth of the OFC, in which the minimum comb-line power is greater than the maximum side-frequency power outside the spectral bandwidth. The power variation is defined as the difference between the maximum and the minimum optical power in the spectral bandwidth of the OFC. The number of comb lines and the spectral bandwidth of the generated OFC are 43 and 430 GHz, respectively. The power variation, the variances of the power variation, and the average power of the OFC are 8.4 dB, 5.75 dB, and −20.08 dBm, respectively. The frequency interval of adjacent-frequency components is 10 GHz, which is equal to the modulation frequency of the injected RF current and is consistent with the theoretical analysis.
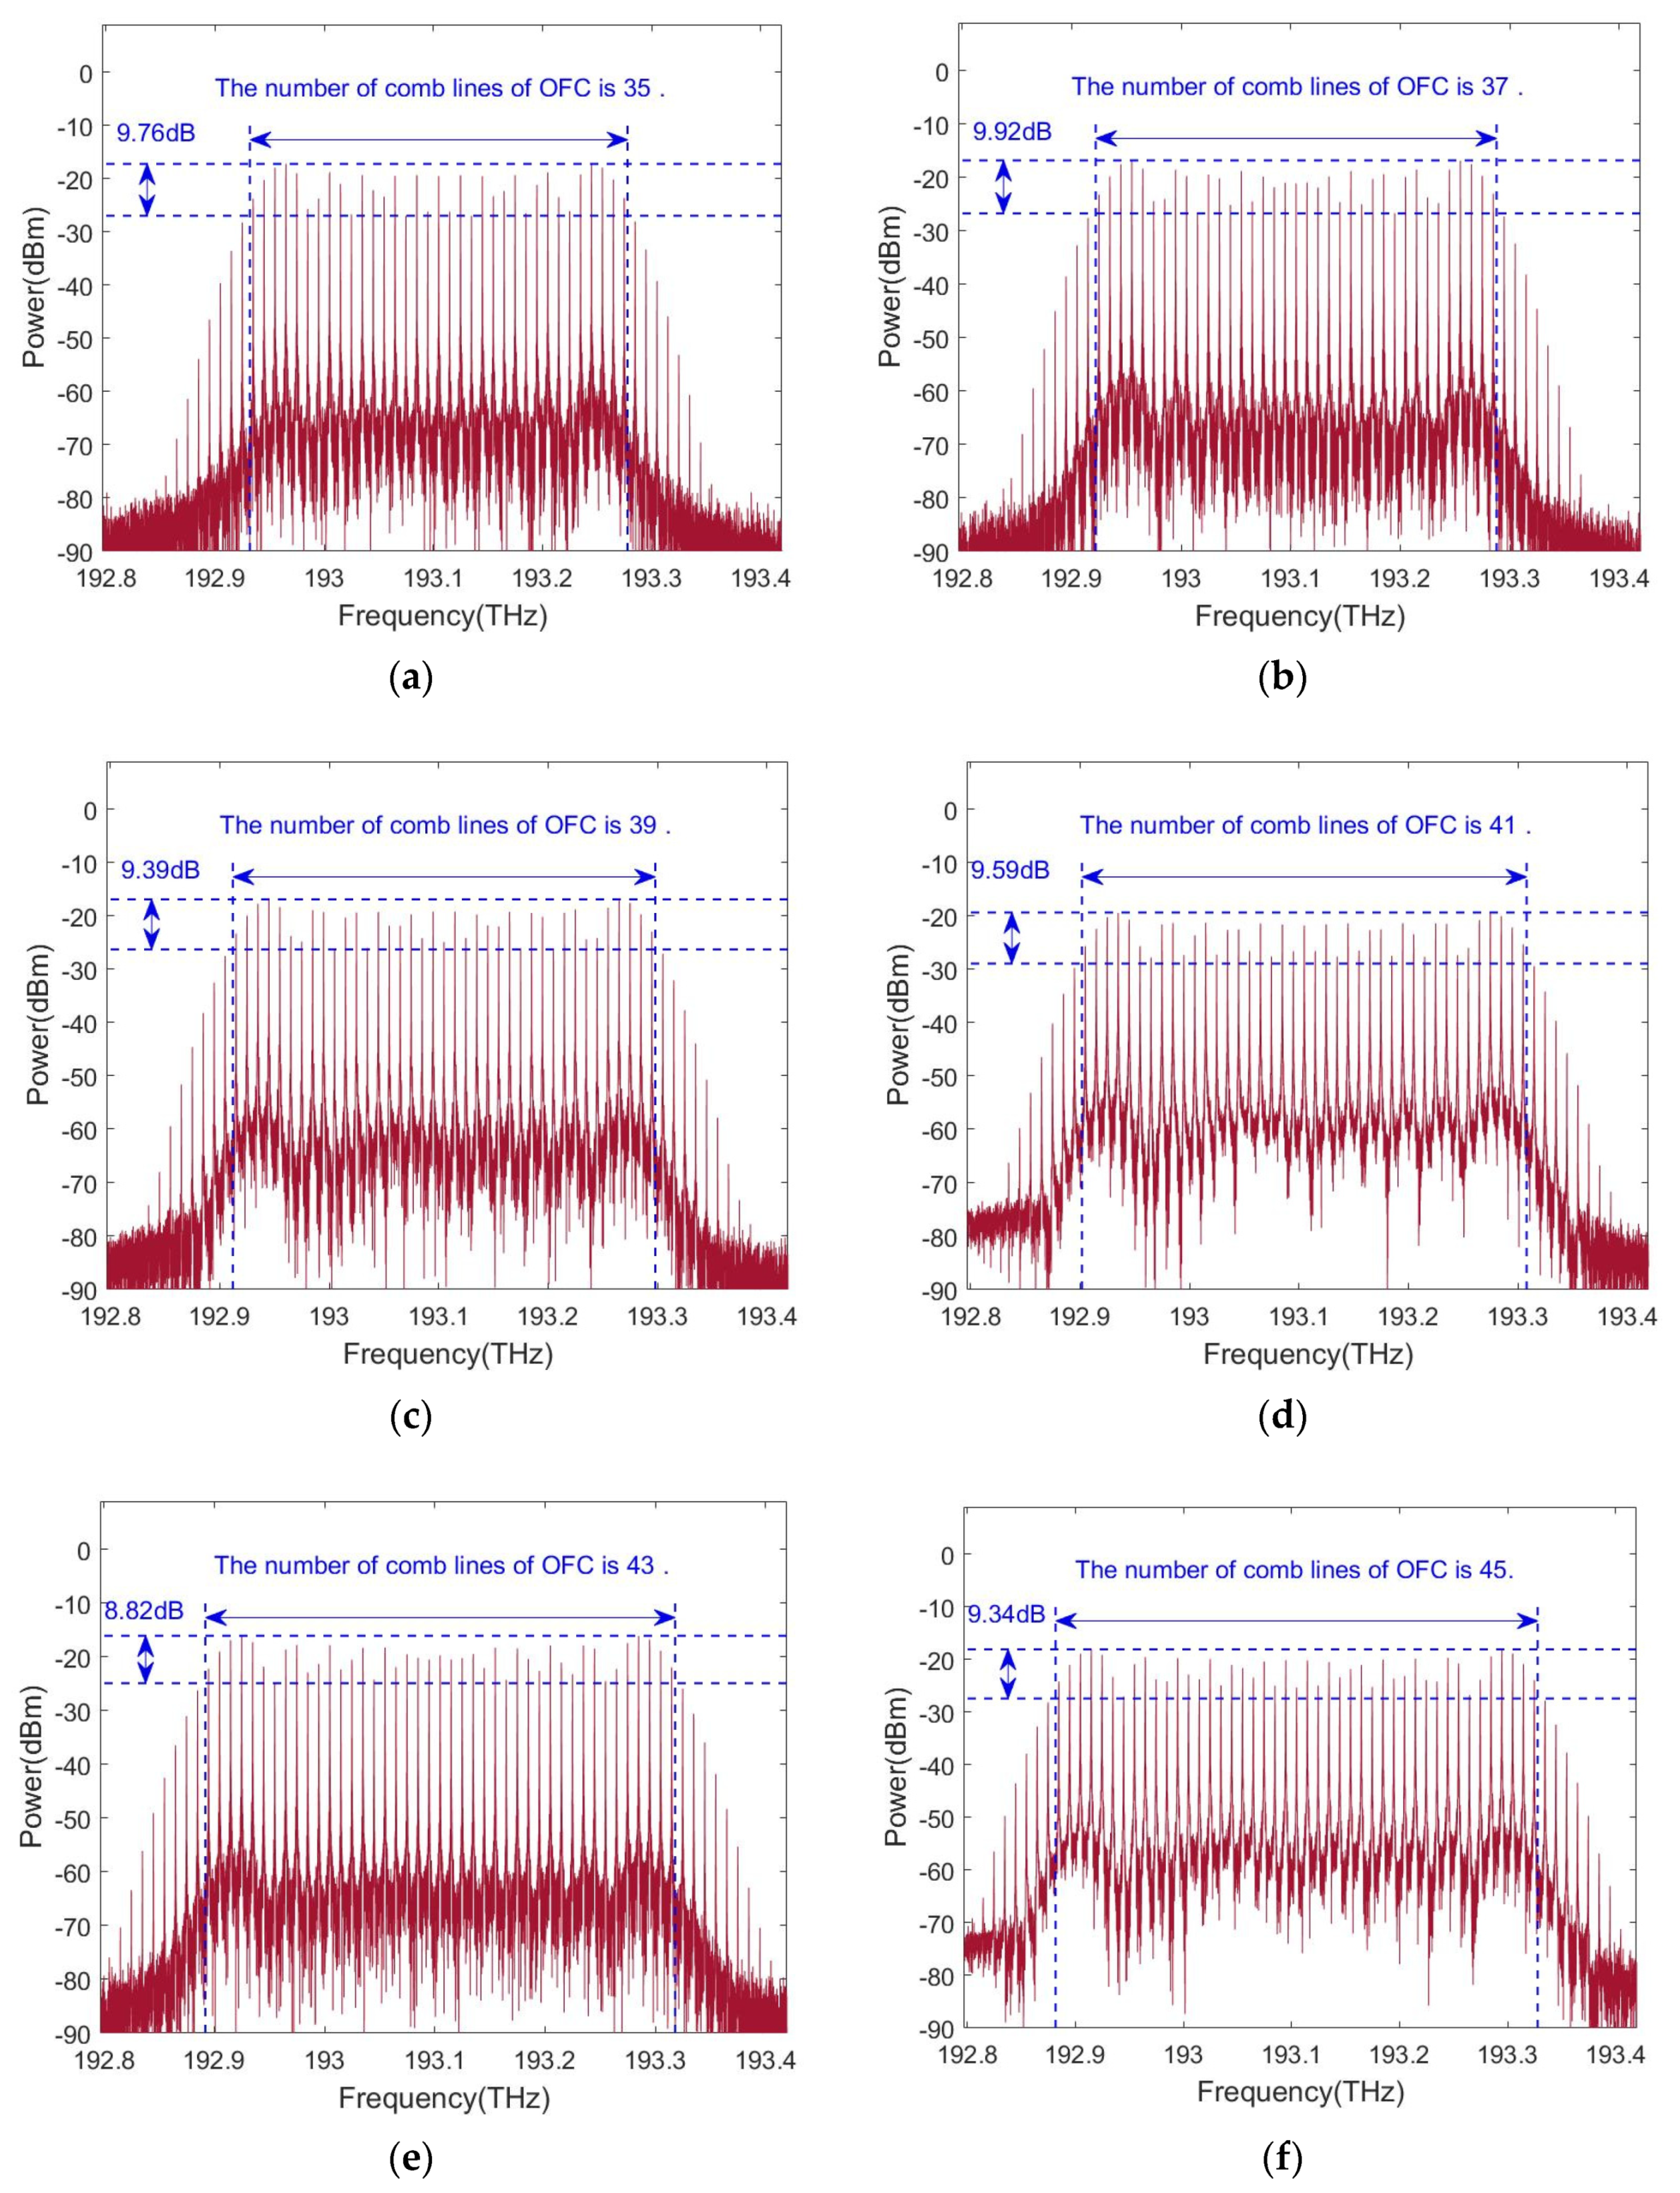
Figure 3 shows the optical spectra of the OFC output from the SOA when the amplitude of the RF-modulated current is 160 mA, 170 mA, 180 mA, 190 mA, 200 mA, and 210 mA. When the modulation-current amplitude increases, the average power of the OFC and the power variation are almost unchanged, while the number of comb lines increases from 35 to 45 and the spectral bandwidth of the OFC increases from 350 GHz to 450 GHz; this is attributed to the fact that the larger the RF-current amplitude, the stronger the single-tone modulation and FWM effect, and the more new frequency components are generated. The variances of the power variation are 8.20 dB, 7.91 dB, 7.4 dB, 6.66 dB, 5.75 dB, and 5.65 dB. Therefore, an OFC with a large number of comb lines can be achieved by increasing the RF-current amplitude. However, the injection current should not be too large because a large amount of heat will be generated in the SOA, which will reduce its working performance and even burn it.
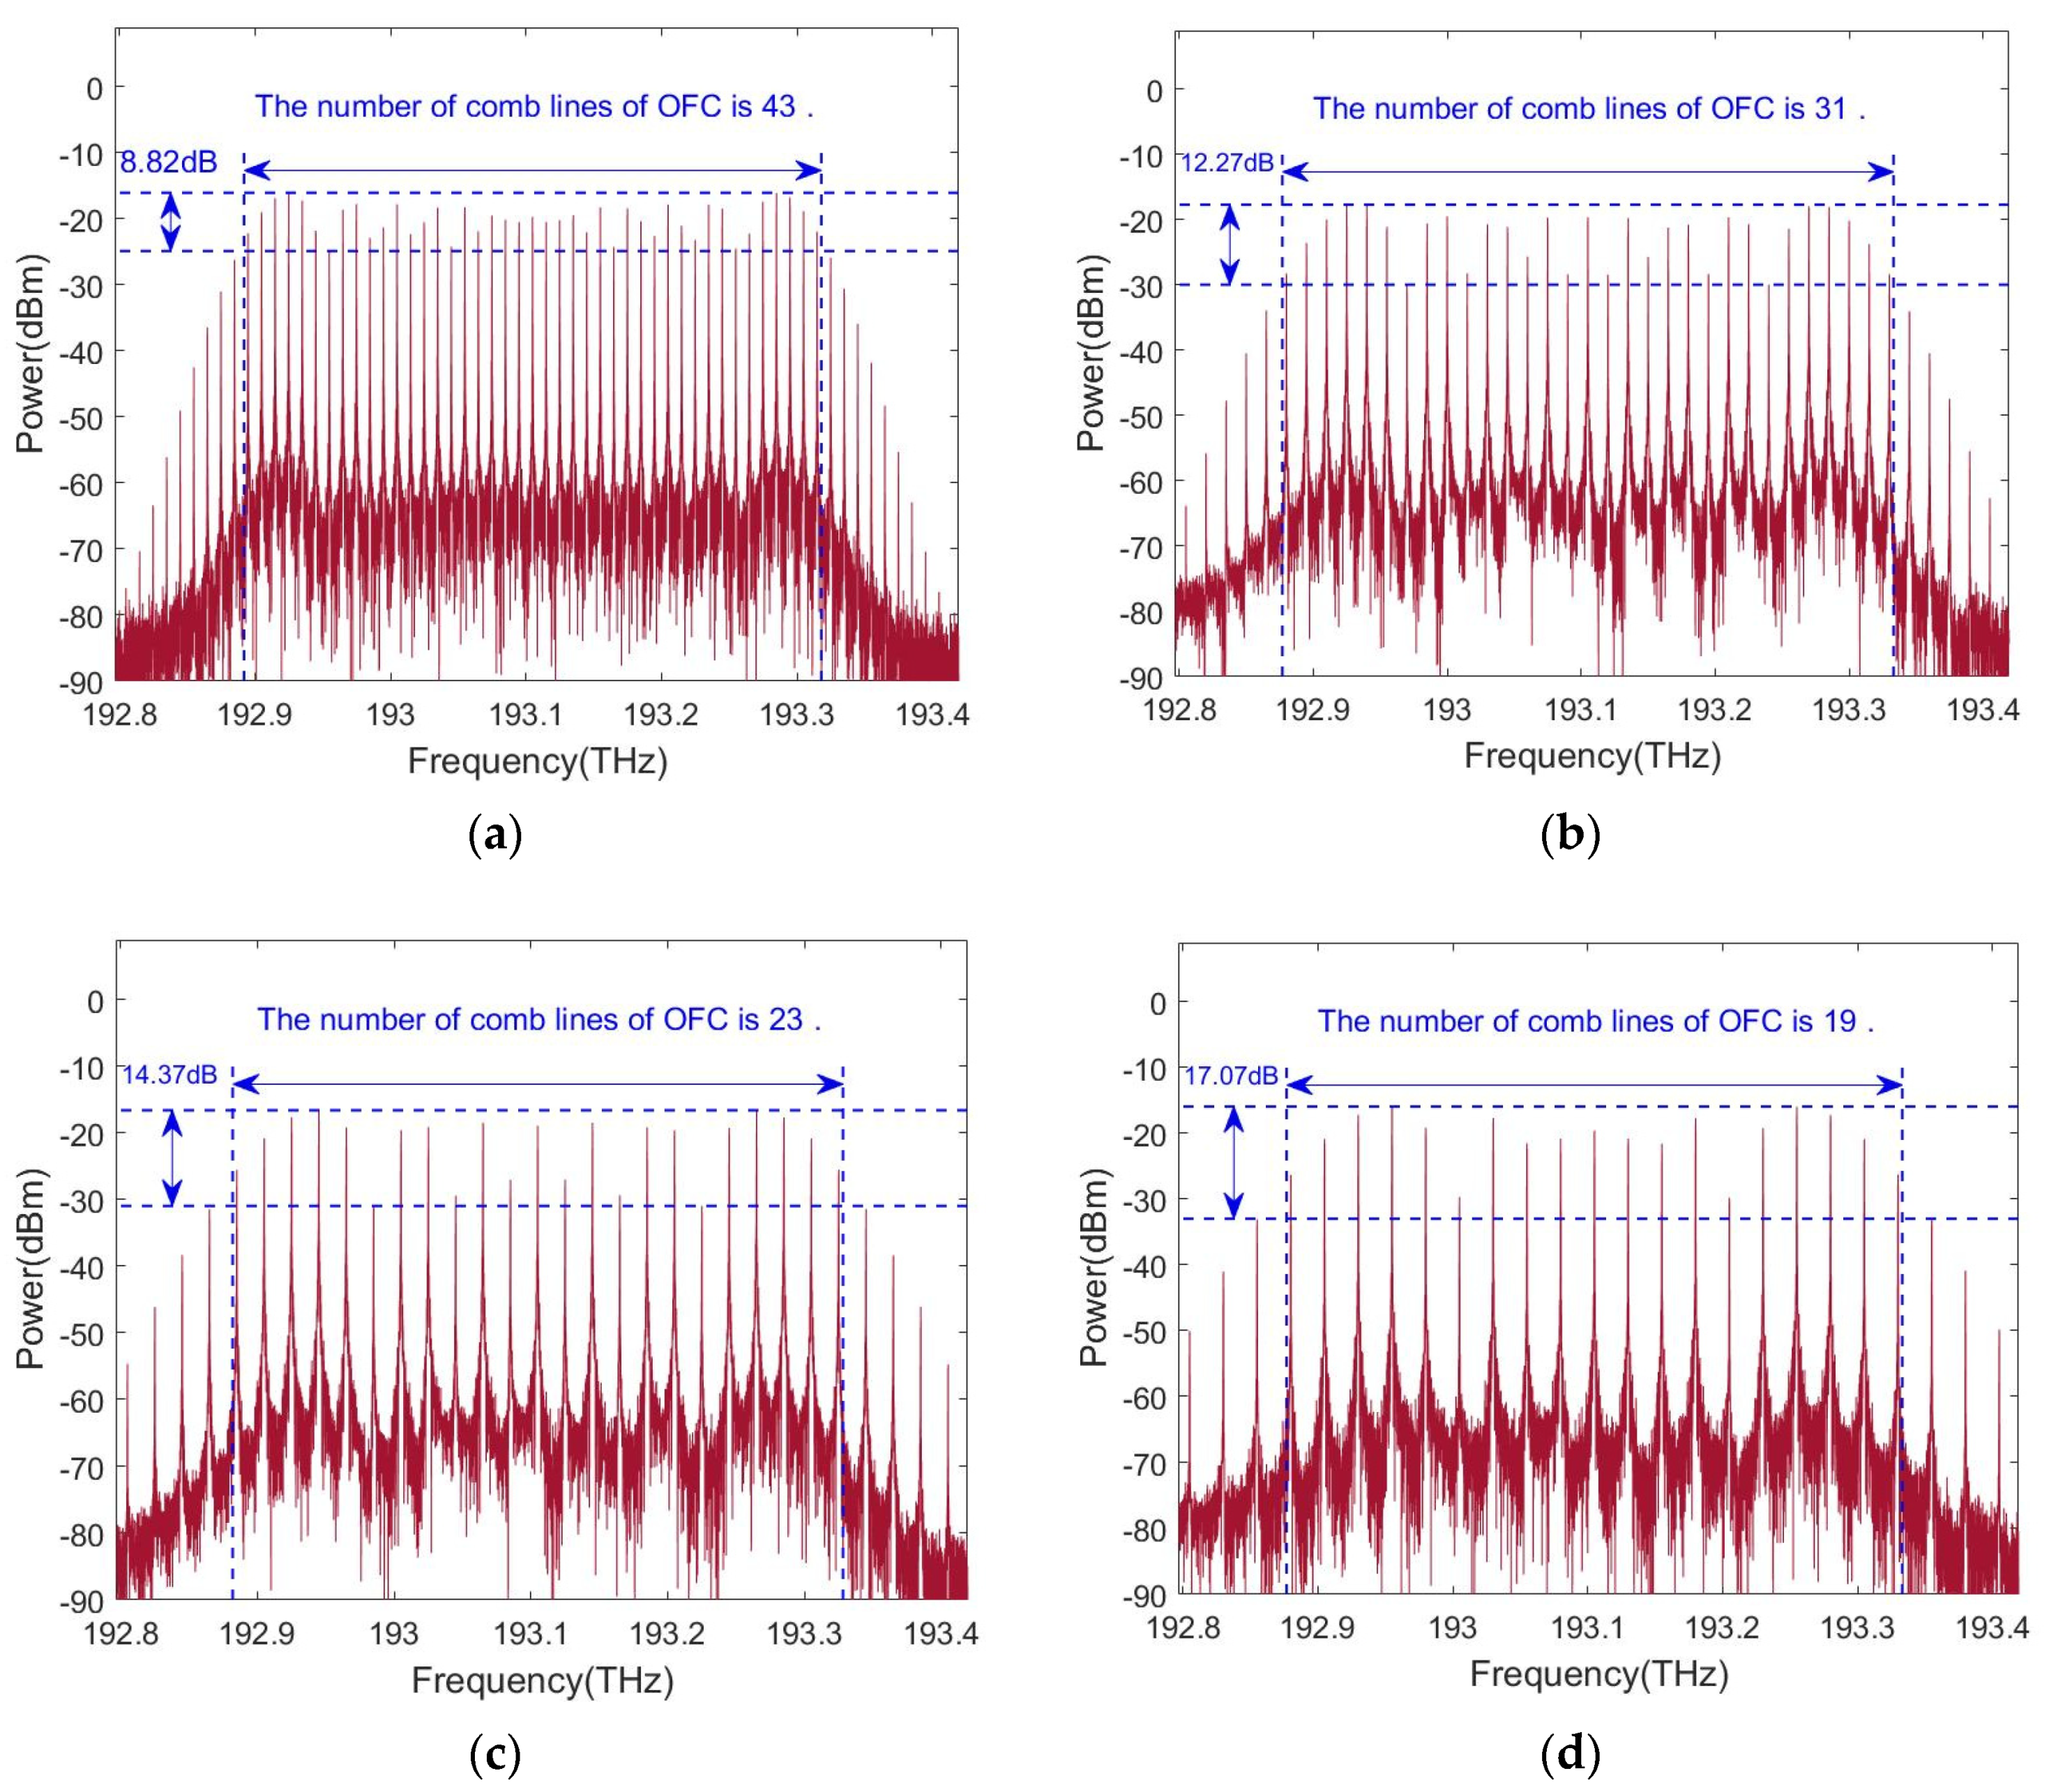
When the modulation frequency of the RF current is 10 GHz, 15 GHz, 20 GHz, and 25 GHz, the optical spectra of the OFC output from the SOA is as shown in
Figure 4. As can be seen, when the modulation frequency increases, the frequency interval of adjacent-frequency components increases, which is always equal to the frequency of the injected RF current. The spectral bandwidth and the average power of the OFC are both almost unchanged because the amplitudes of the RF-modulated current and the input optical power remain unchanged. However, with the increase in the modulation-current frequency, the number of comb lines of the OFC decreases from 43 to 19 and the power variation of the OFC deteriorates from 8.82 dB to 17.07 dB. Since the FWM effect weakens rapidly with the increasing frequency interval, the FWM effect that occurs between new frequency components, generated by single-tone modulation, will become weaker, thereby deteriorating the performance of the OFC. The variances of the power variation are 5.75 dB, 11.63 dB, 16.61 dB, and 26.37 dB, showing an increasing trend. Therefore, by appropriately tuning the modulation-current frequency, an OFC with a tunable frequency interval within a certain range can be realized.
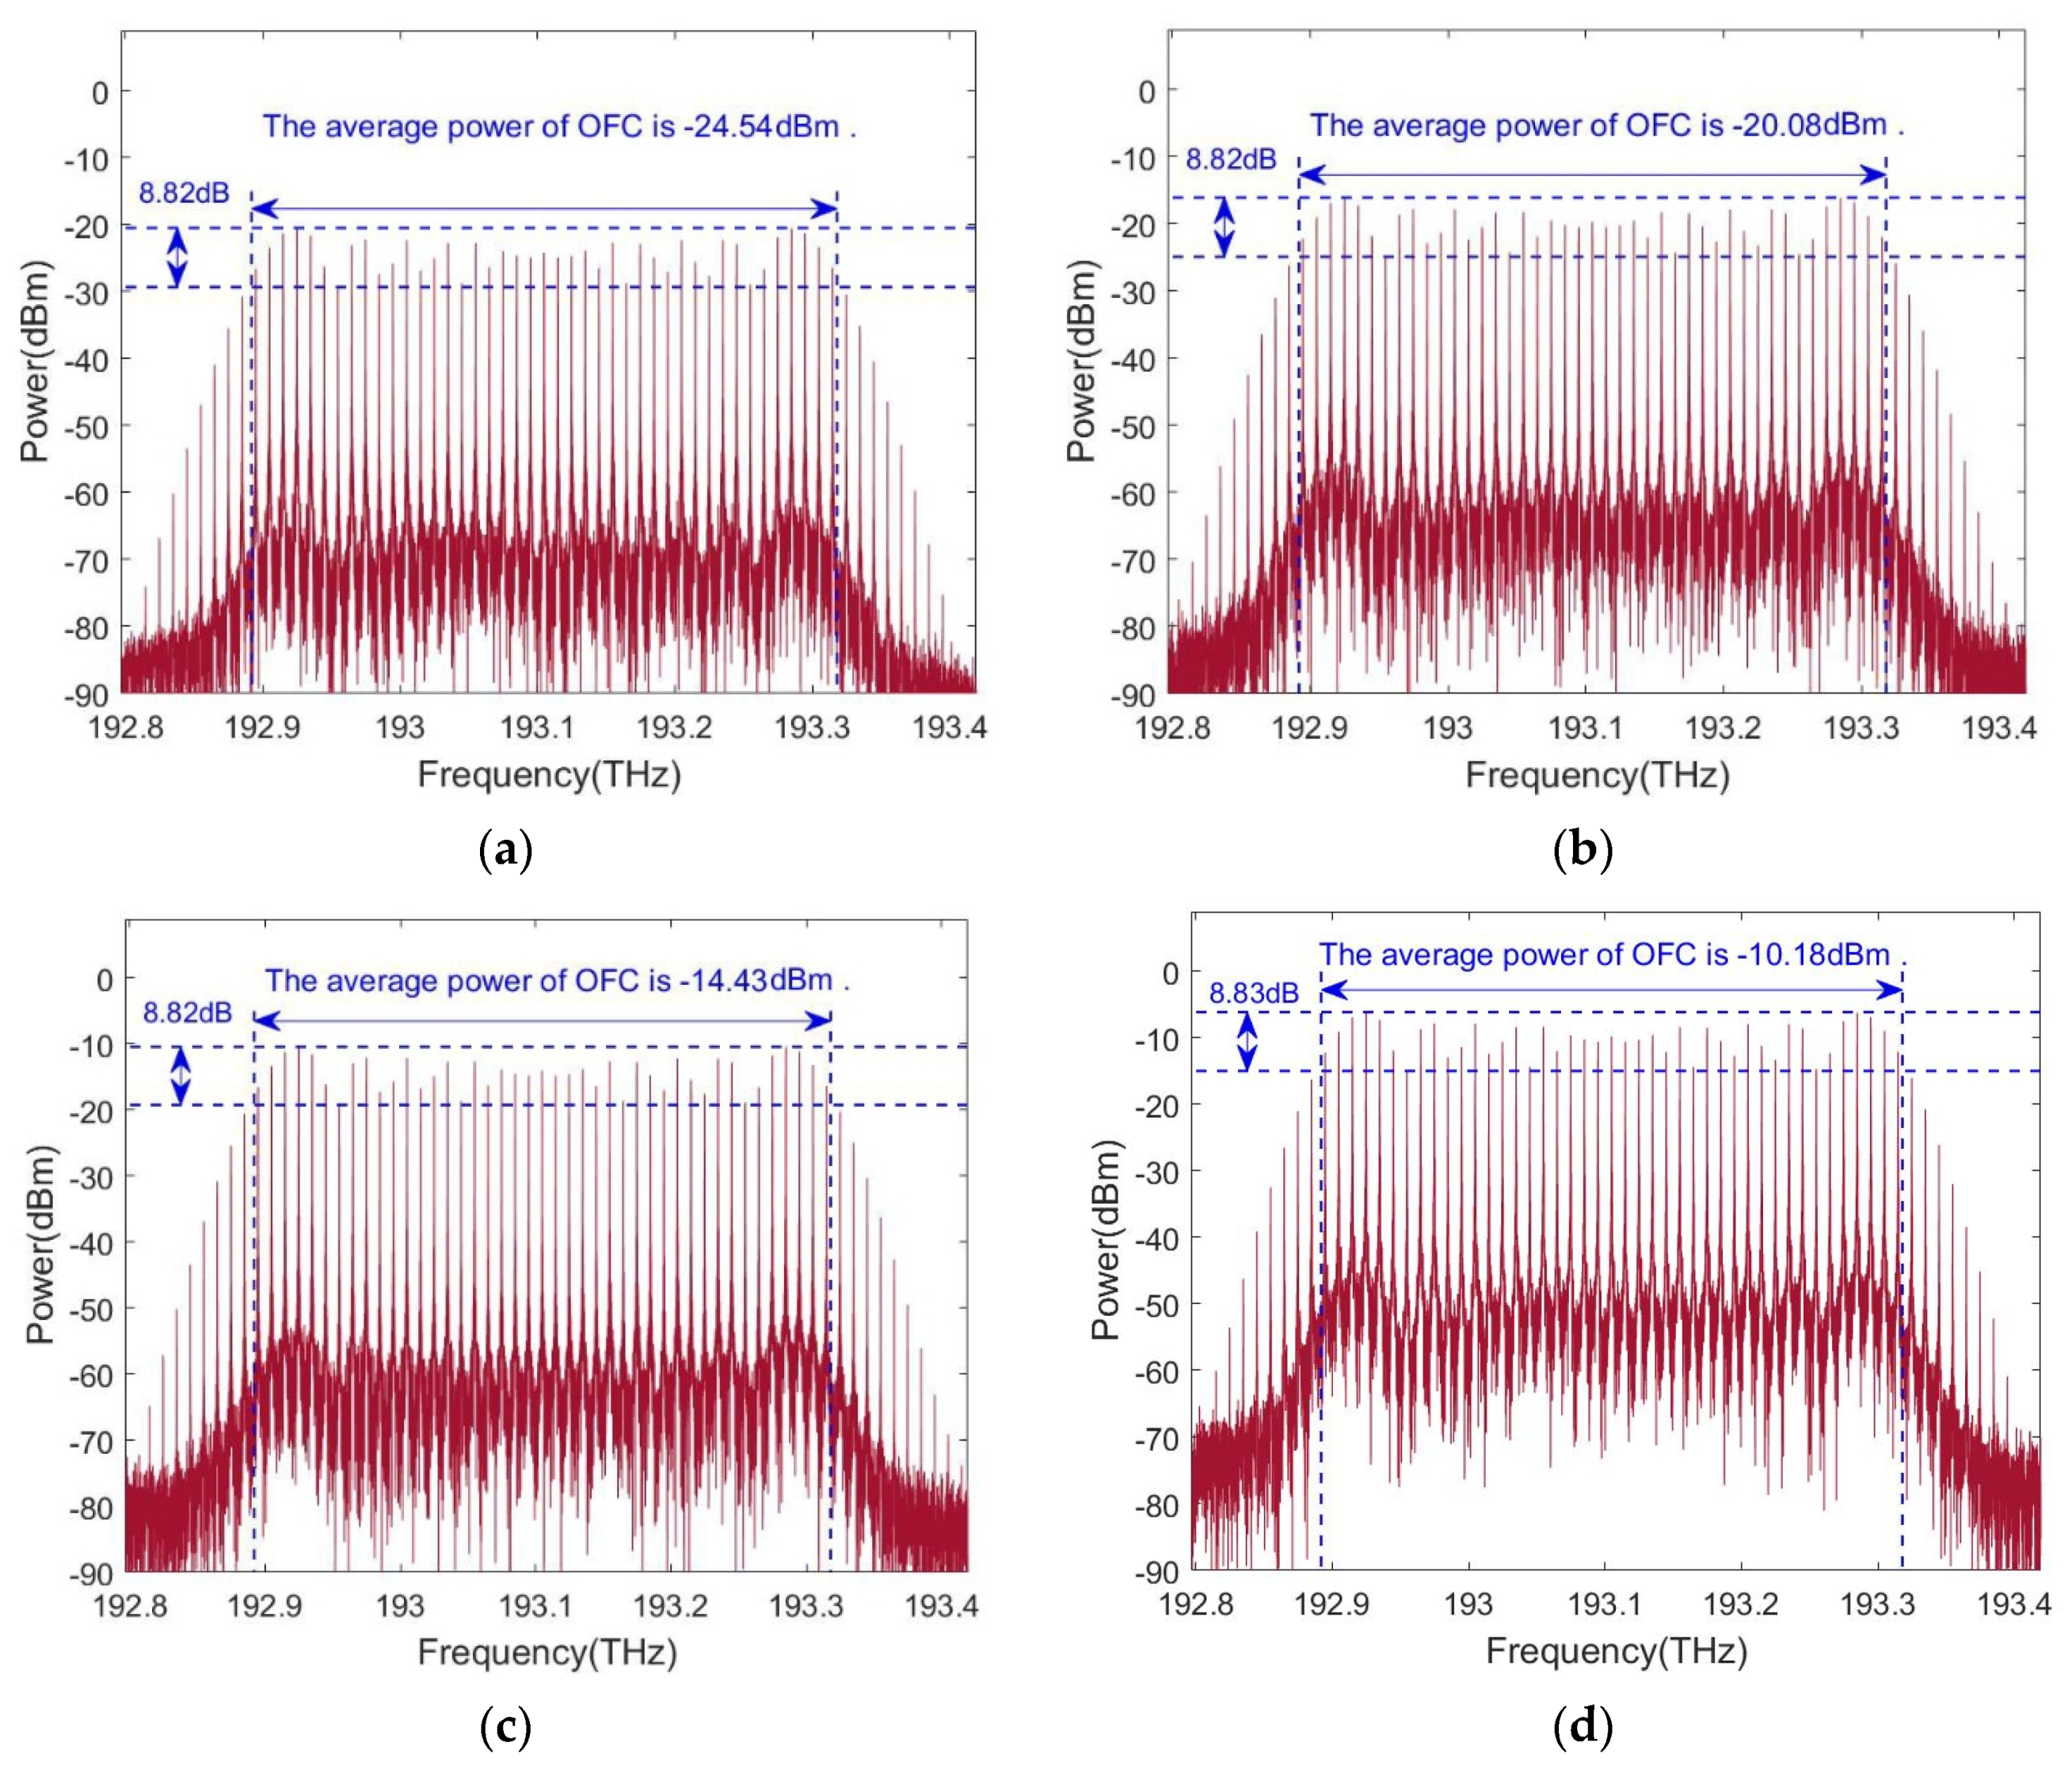
Figure 5 shows the output optical spectra of the SOA when the input power of the CW light is 15 dBm, 20 dBm, 25 dBm, and 30 dBm. It can be seen that when increasing the input power, the number of comb lines, power variation, and spectral bandwidth of the OFC are almost unchanged. The variances of the power variation are 5.77 dB, 5.75 dB, 5.77 dB, and 5.78 dB, which are almost unchanged. However, the average power of the OFC increases from −24.54 dBm to −10.18 dBm. The average noise power also becomes larger. Therefore, the average power of the OFC can be increased by increasing the input optical power of the CW light. However, the input optical power should not be too large; if the input lightwave is too strong, it will damage the anti-reflection film on both ends of the semiconductor chip, causing the SOA to not work properly. In addition, when the input optical power increases to a certain extent, gain saturation in the SOA will occur, which makes the growth rate of the OFC power decrease with the increase in the input optical power.


