1. Introduction
One of the main purposes of space exploration includes exploring the existence of ribonucleic acid (RNA), which is a valuable clue to the origin of life in the RNA world hypothesis [
1] and using nucleic acid sequencing to prove its existence through various theories and feasible methods [
2,
3].
However, when exploring trace rare nucleic acids in space with in-situ life detection, the purity of the nucleic acid samples obtained through extraction/precipitation or adsorption chromatography must be verified with microvolume spectrophotometry to ensure a high success rate of the subsequent nucleic acid sequencing.
Sequencing of nucleic acids requires a series of complicated processes, including DNA/RNA extraction, deletion of undesirable fragments with nucleases, and evaluation of the quality, yield, and purity of the samples. However, issues regarding instrument automation for such processes is beyond the scope of this paper, for the focus of this paper is on the optical design of a microvolume nucleic acid spectrometer.
Commercial off-the-shelf (COTS) microvolume nucleic acid spectrophotometers may be used in assessing the purity of nucleic acids.
Table A1 of
Appendix A lists the key specifications of COTS microvolume nucleic acid spectrophotometers. Most of these spectrophotometers have built-in optical fiber optical paths [
4,
5]; however, aging and excessive fatigue/stress of optical fibers cause reliability problems in those light-weight instruments.
Moreover, the scientific payloads of the space vehicle must ensure reliability during launching and on orbit activities, as well as the ability to withstand extreme temperatures and radiation exposure during launching/operation. Non-optical fiber optical paths and radiation-hardened quantitative microvolume spectrophotometers seem the better solution than existing instruments among the same kind.
This paper introduces the optical design of a radiation-hardened quantitative microvolume spectrophotometer with a non-optical fiber optical path for space exploration instruments. The second section outlines the system description, the optical specifications are described in the third section, and the complete design and simulation analysis of the optical system is described in the fourth section. The fifth section describes the measurement of the actual concentrations, the discussion is described in the sixth section, and the last paragraph concludes the study.
2. System Description
The quantitative measurement of nucleic acids may be performed by measuring the light source transmitted through the nucleic acid sample solution based on the optical characteristics of transmittance. The concentration of nucleic acid in the sample solution can be determined by measuring the transmittance of light of specific wavelengths through the solution. The method of measuring the concentration of sample solution with a fixed length of constant optical path can reduce the problem of data repeatability and reproducibility caused by optical path variation.
The optical density (OD) value of the sample solution at a fixed optical path length can be derived from the logarithmic intensity ratio of the sample solution with the fixed optical path length by using a specific wavelength of light source. The OD value, which is also the absorbance (A), can be expressed as (1) [
6]:
where:
| T: | transmittance, |
| Iₒᵤₜ: | intensity of transmitted light, |
| Iᵢₙ: | intensity of incident light, |
However, in the application of biological measurements of the concentrations of trace rare nucleic acids in the sample solution, the optical system has not only the physical phenomena of transmittance and absorbance, but also other complicated mechanisms of interactions between photons and molecules, such as scattering effects. Therefore, optical models of precise quantitative nucleic acid measurement should meet the following requirements and assumptions:
The irradiating beam passing through the nucleic acid sample solution should be a paraxial optical path.
The wavelength of the incident light spectrum should be within the short, narrow band of the ultraviolet (UV) spectrum (e.g., 230 nm, 260 nm, 280 nm and 320 nm).
The intensity of the incident light source must not be extremely strong, and the concentration of the organic chromophores should not be extremely high.
The absorption spectra of nucleic acid (e.g., DNA and RNA) in the sample solution should be independent of the absorption spectra of impure substances.
It should be assumed that only the non-scattering and non-absorbing photons passing through the nuclear acid sample solution are detected by the sensor.
It should be assumed that the nucleic acid sample solution through which photons from the incident light source pass is a homogeneous medium.
The complicated scattering effects (such as Rayleigh scattering, Mie scattering, and Raman scattering) of the measurement mechanisms can be ignored if the above requirements and assumptions are met, and the Beer–Lambert law (2) can be applied to the determination of nucleic acid concentration in sample solution [
7]:
where:
| ε: | extinction coefficients, |
| c: | concentration of the species in solution, |
| d: | path length of the sample, |
In molecular biology, standard quartz cuvettes with an optical path length of 10 mm were used in conventional spectrophotometers to measure the absorbance of the sample solution¸ and the standard concentration of the sample solution is then deduced. However, it would be impractical to measure the concentration of trace rare nucleic acid with 10-mm quartz cuvettes, for the sample is valuable and difficult to collect. Alternatively, the absorbance (OD value) of the micro-optical path length of the trace rare nucleic acid samples can be measured using quantitative microvolume spectrophotometers, and the OD value of the absorbance corresponding to the quartz cuvette with a standard optical path length of 10 mm can be obtained by the normalized extrapolation method according to the Beer–Lambert law (2).
With several nucleic acid sample solutions of known concentration, a database of the extinction coefficients constants, ε, corresponding to different nuclear acid sample solutions at a specific wavelength, can be obtained (e.g., nearest-neighbor model, base composition model [
8]) by using the Beer–Lambert law (2).
Therefore, when performing spectrophotometric analysis to estimate the concentration of a nucleic acid sample solution with a light source passing through it at the micro-optical path length, the absorption unit (unit OD value) of the standard 10-mm cuvette was converted into concentration conversion factors by referring to the database of extinction coefficient constant, ε, using the Beer–Lambert law (2).
Table 1 shows the extinction coefficient, ε (260 nm), of double-stranded DNA (dsDNA), single-stranded DNA (ssDNA), and single-stranded RNA (ssRNA) corresponding to the wavelength of one absorbance, A (260 nm), and the concentration conversion factors in the standard 10-mm cuvette under a 260-nm light source [
9].
A nucleic acid sample of high purity is required to ensure a high success rate of the subsequent sequencing. A ratio of absorbance at 260 nm vs. 280 nm, approaching 2.1, indicates that the sample is a highly purified RNA preparation, and a ratio approaching 1.8 indicates that the sample is a highly purified DNA preparation. In the presence of contaminants, such as protein, the absorbance at 280 nm would be comparatively high, and a low ratio of A (260 nm)/A (280 nm) approaching 0.57 indicates that the sample is pure protein preparation. A high absorbance at A (230 nm) indicates that the sample is contaminated with phenol or urea, and a high absorbance at A (320 nm) is an indication that the sample is impure and contains particulate contamination [
9,
10].
The quantitative microvolume nucleic acid spectrophotometer, to be used in space exploration, must be reliable during launch and in-orbit activities. Therefore, in addition to using a fixed optical path length to maintain the reliability of the measurement, it is also crucial to avoid using an optical fiber optical path, widely applied in most quantitative microvolume nucleic acid spectrophotometer with all radiation-hardened lens elements in order to ensure the reliability of the measurement system and to meet the requirement of radiation hardness at the same time.
3. Optical Specifications
The optical specifications of the quantitative microvolume nucleic acid spectrophotometer with all radiation-hardened lens elements for space exploration instruments meeting the above assumptions and the applicable range of the solution characteristics of nucleic acid samples to be measured are shown in
Table 2.
The formation of a relatively stable spectrum of xenon flash lamps can provide a light source suitable for sensing and analyzing the light intensity of a multi-channel optical intensity detector with respect to the different wavelengths of the photodiodes within the same short-pulsed flash interval simultaneously.
A custom-designed Köhler illumination system [
12] with pinholes formed a uniform and paraxial optical path in the sample area of the nucleic acid to be measured, so as to meet the light source requirements and assumptions applicable under the Beer–Lambert law (2). A 2-μL aliquot of the nucleic acid sample was filled between two parallel plates of quartz glass with a fixed optical path length of 0.5 mm to form a cylindrical micro-cuvette chamber with a footprint diameter greater than 2 mm, so that the uniform and paraxial light sources of the aforementioned pinholes passed through the sample area [
14,
15].
Photons carrying the information (e.g., transmittance, absorption, non-scattering) of the nucleic acids in the sample area were then projected separately to the sensors; photodiode channels I to IV, with full width at a half-maximum (FWHM), 12-nm coating performance of the band-pass filter (BPF) at the channels (Ch.) of various wavelengths (e.g., Ch. I: 230 nm, Ch. II: 260 nm, Ch. III: 280 nm, Ch. IV: 320 nm).
4. Optical Design and Simulation
According to the optical specifications of
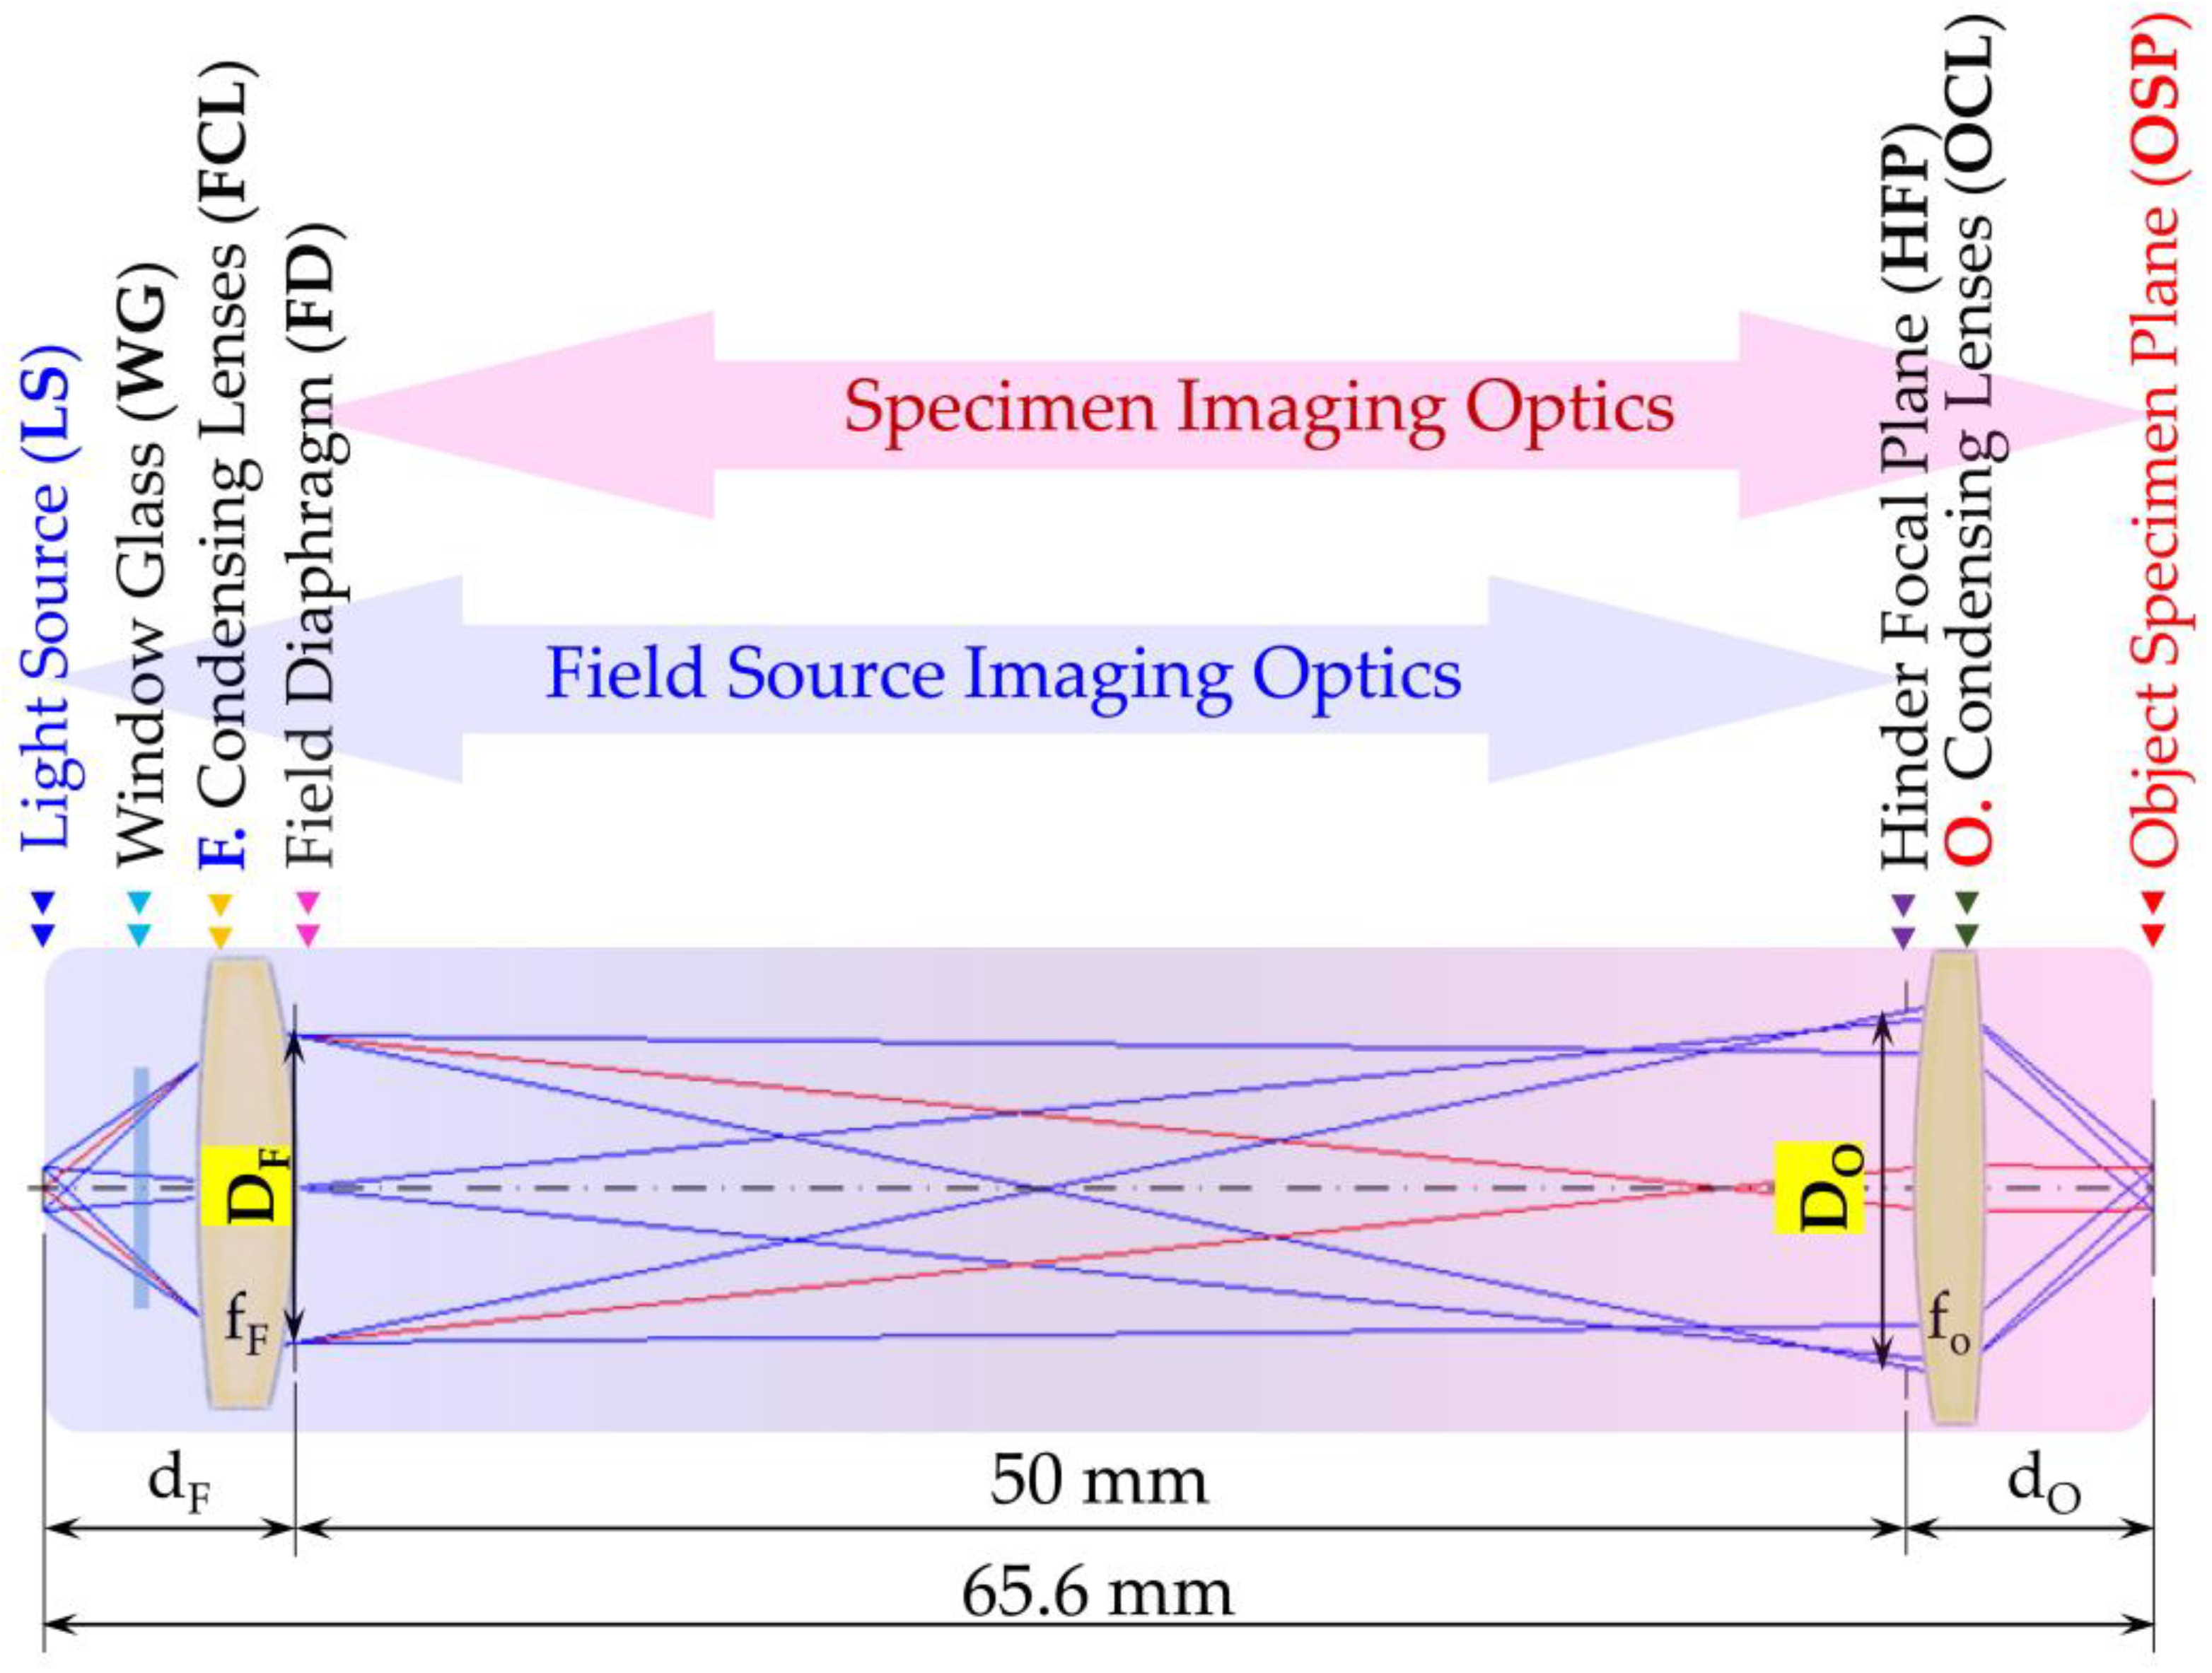
Table 2, the light source that passed through the nucleic acid sample solution must be an illumination-optics system with a uniform diameter in the range of 2 mm. The output light source specification was NA ≈ 0.57, and the preset distance between the field diaphragm and hinder focal plane of xenon flash lamp was 50 mm. The first-order optical layout of the Köhler illumination system parameter was obtained [
12]. The paraxial optical layout of the illumination optics system, as shown in
Figure 1, consists of field-source imaging optics and specimen imaging optics.
Taking the first-order optical layout as the initial design condition, the sequential ray-tracing design is optimized by using the optical design program Synopsys CODEV
® [
16].
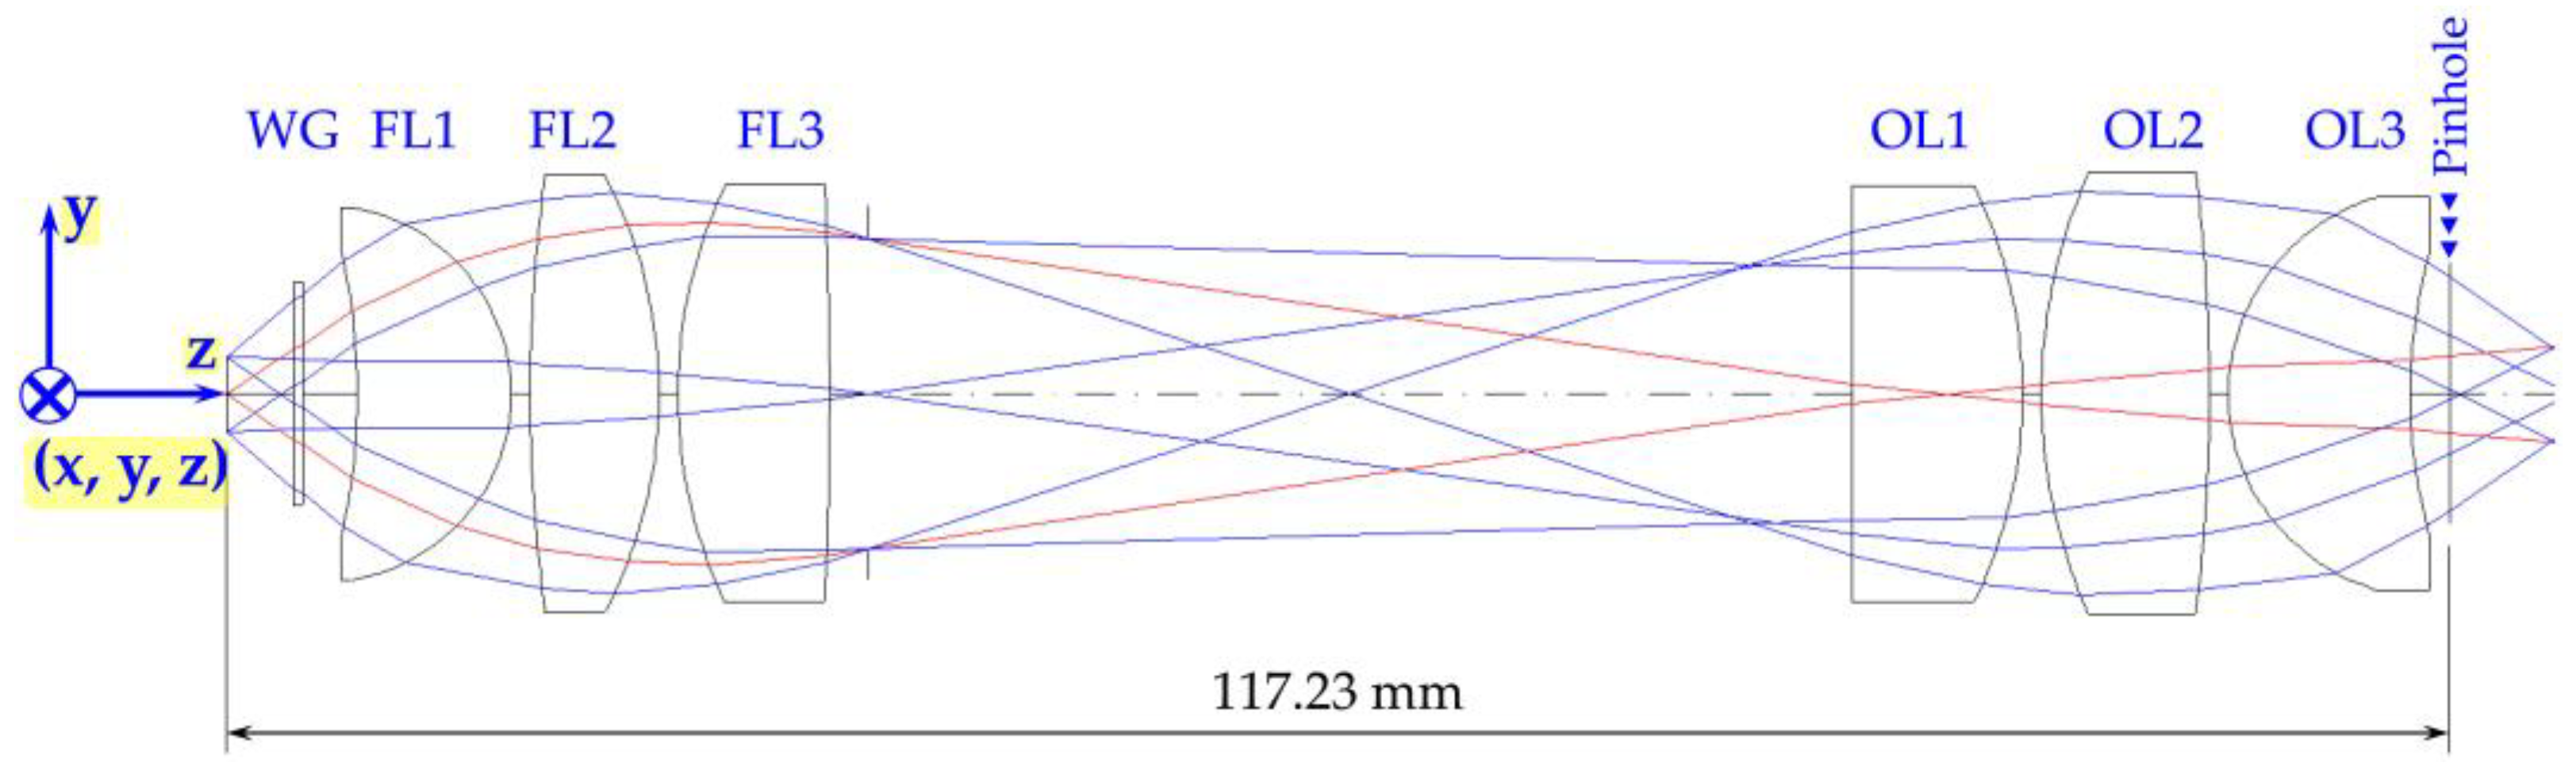
Figure 2 shows the optical layout of the Köhler illumination optics design. The illumination system was composed of six elements. Radiation-hardened glass materials were used in the design to withstand the radiation environment; synthetic-grade fused silica (SUPRASIL 3001) optical glass material with relatively high transmittance at short UV wavelength was also employed [
17].
Table 3 lists the parameters of the Köhler illumination optical system with optimized design results. The optical design program, Synopsys LightTools
®, was used to optimize the non-sequential ray-tracing design based on the optimized design results of sequential ray tracing [
18]. This allowed the illumination system to pass the sample area of the nucleic acid to be tested and a paraxial optical path with a uniform illumination area of 2 mm in diameter was formed to fulfil the light source requirements and assumptions applicable under the Beer–Lambert law (2).
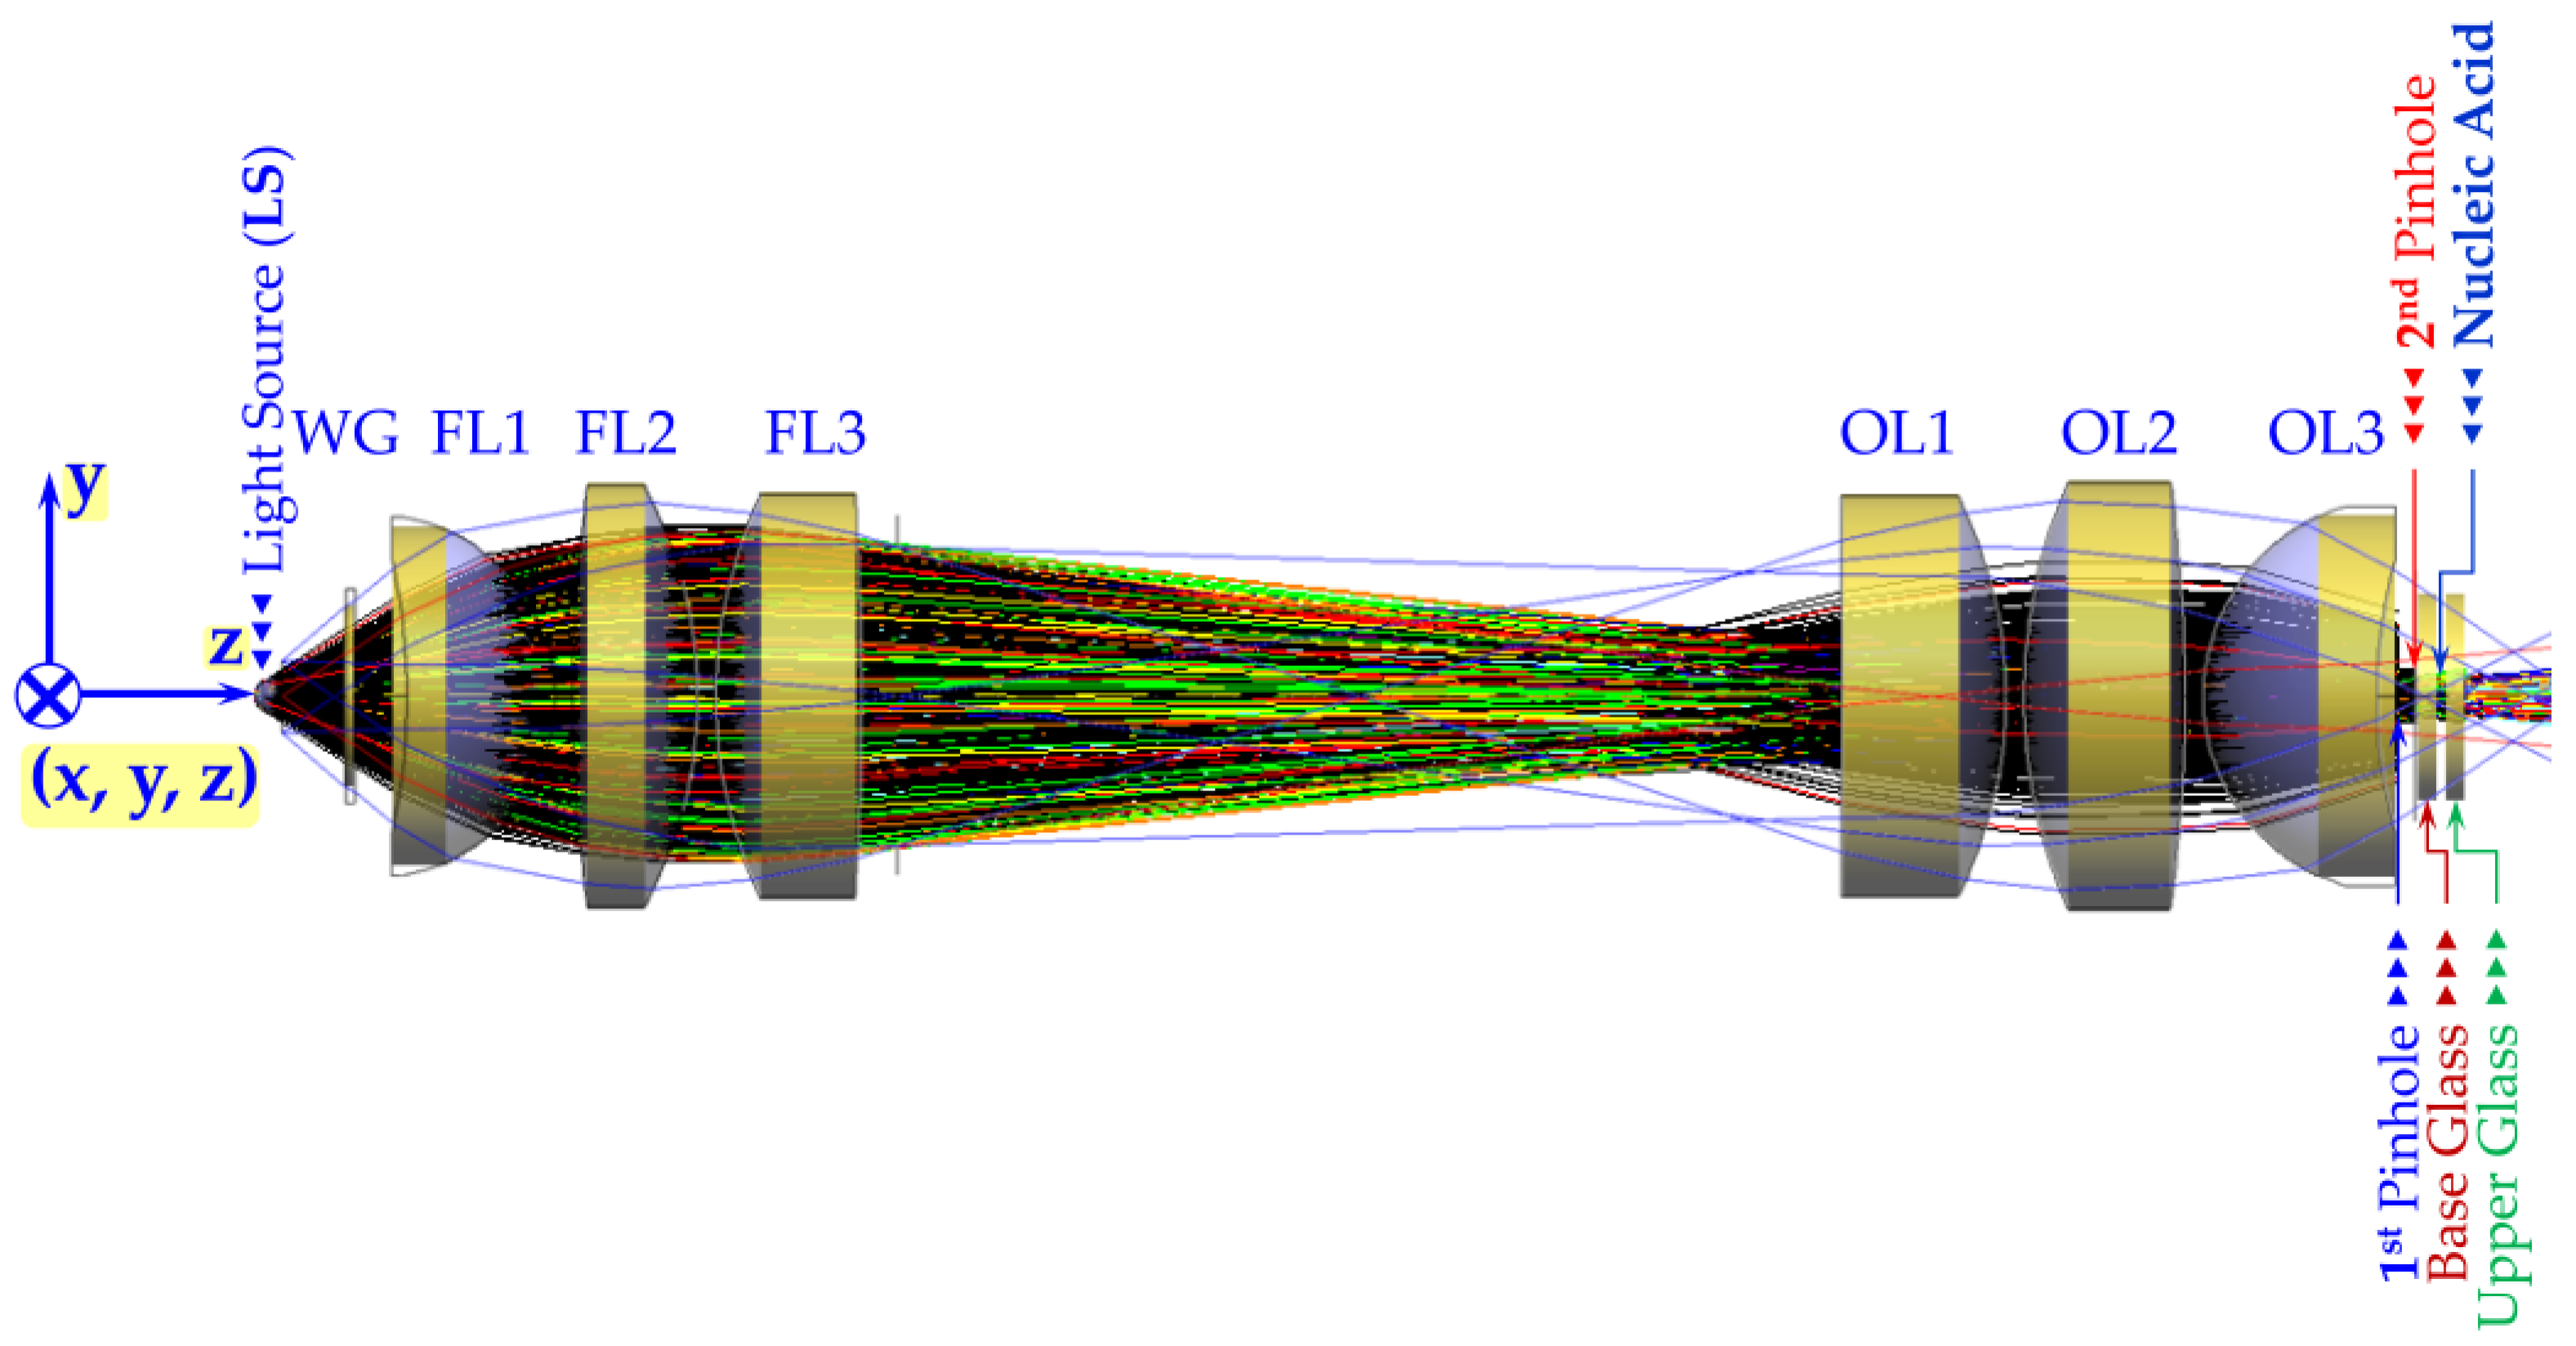
Figure 3 shows the layout of optimized non-sequential ray-tracing optical design and simulation of the Köhler illumination system. The light source is passed through the illumination optical system described in
Table 3, and most of the undesired off-axis large-angle ray tracing was obstructed by a set of two pinholes behind it;
Figure 3 shows a superimposed image of
Figure 2. The remaining light source passes through nucleic acid sample, filling in the gap of the optical path length, and forming a uniform illumination area between the two parallel, flat, quartz glass plates (e.g., base glass and upper glass), equipped with opening and closing mechanisms (not shows in the diagram) for filling samples.
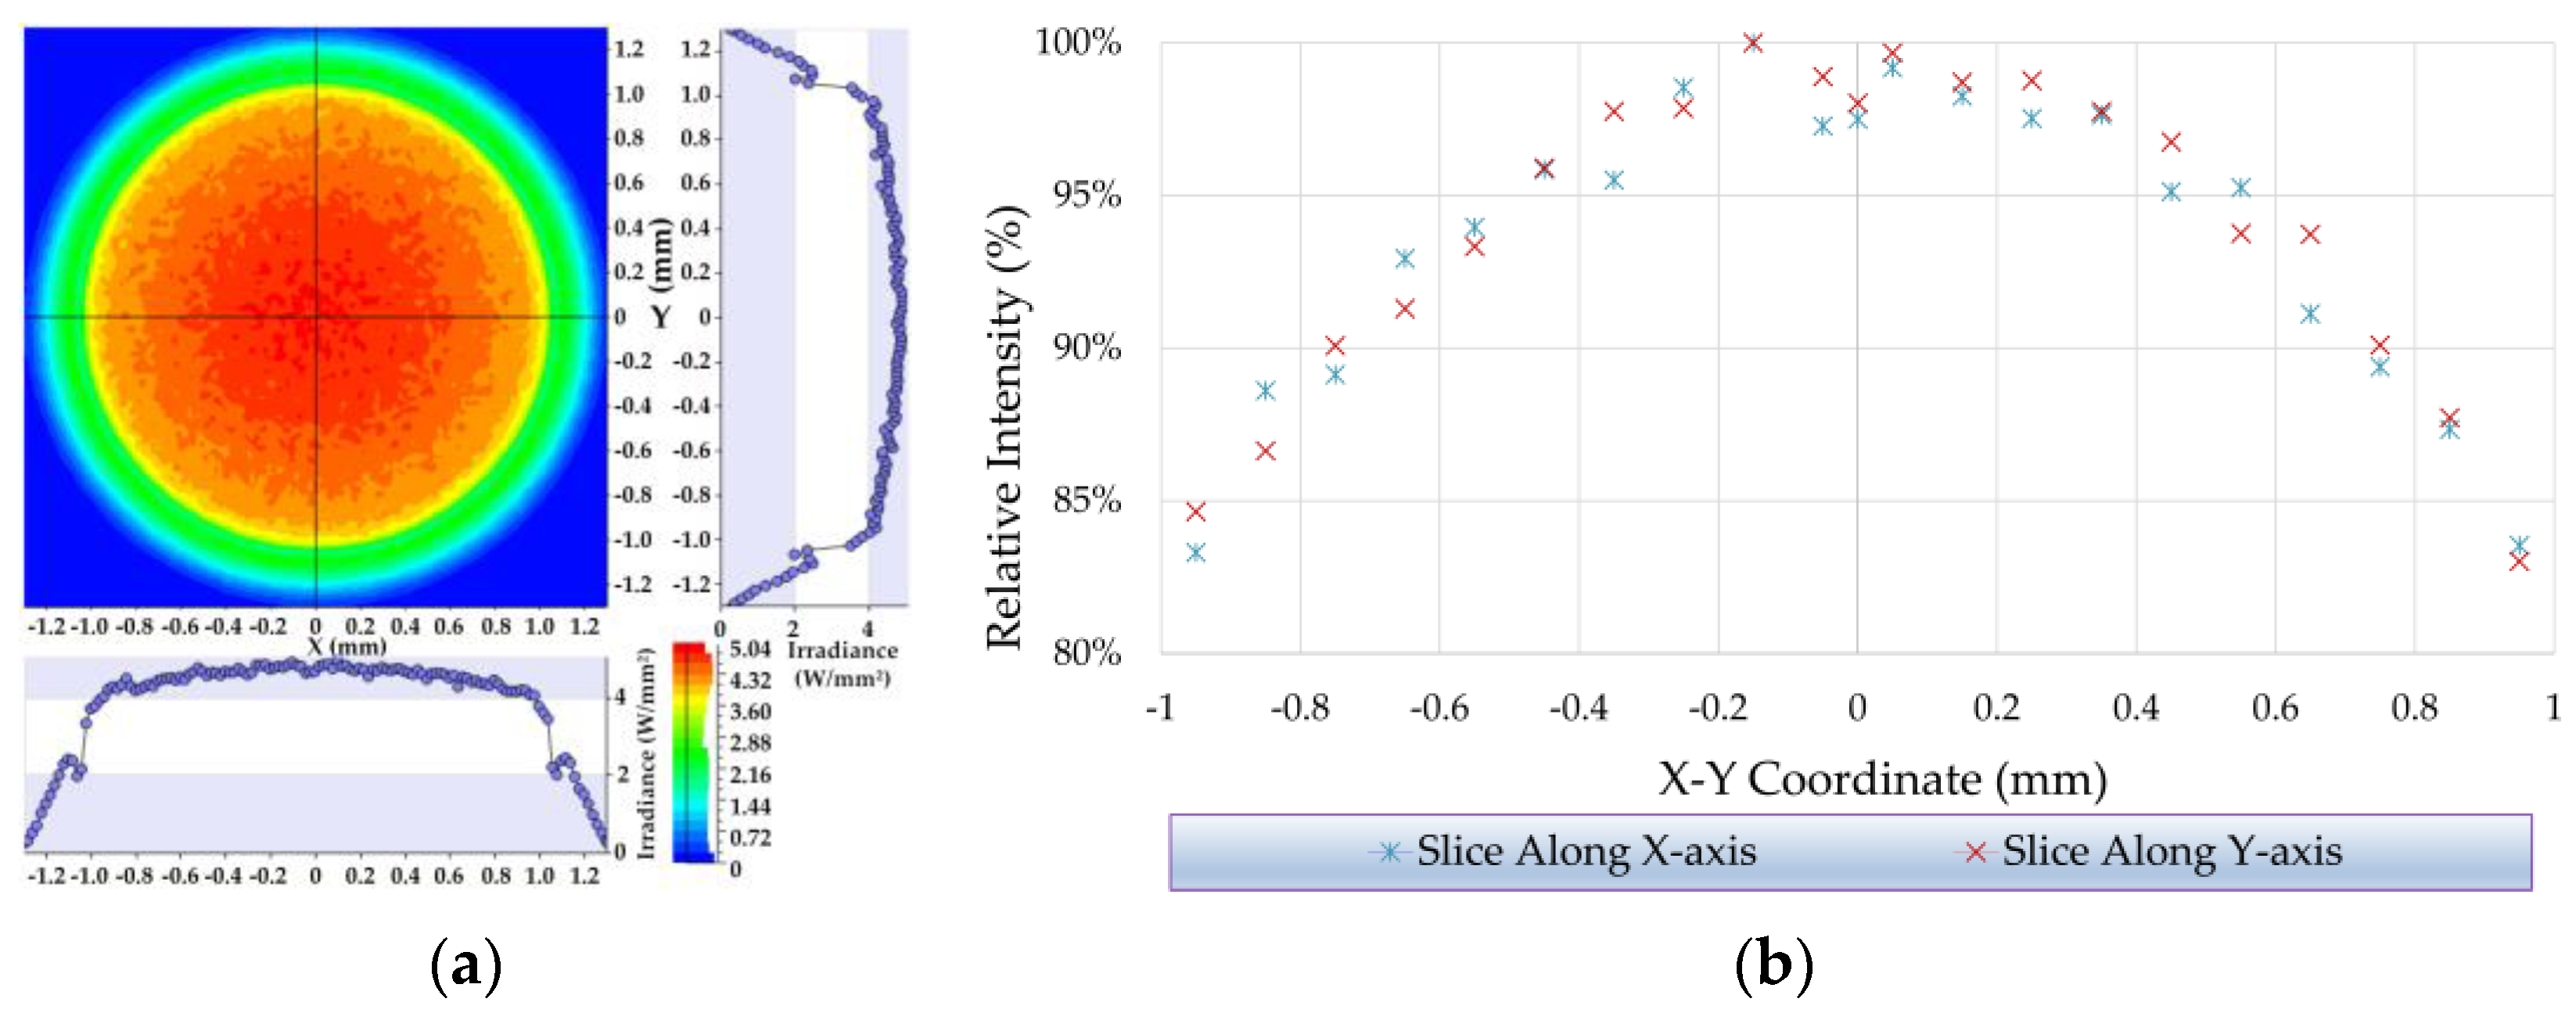
Figure 4a shows the simulated irradiance at the specimen plane and
Figure 4b the relative intensity across the optical axis. The relative intensities within the range of 2 mm in diameter of the sample area were all greater than 80%.
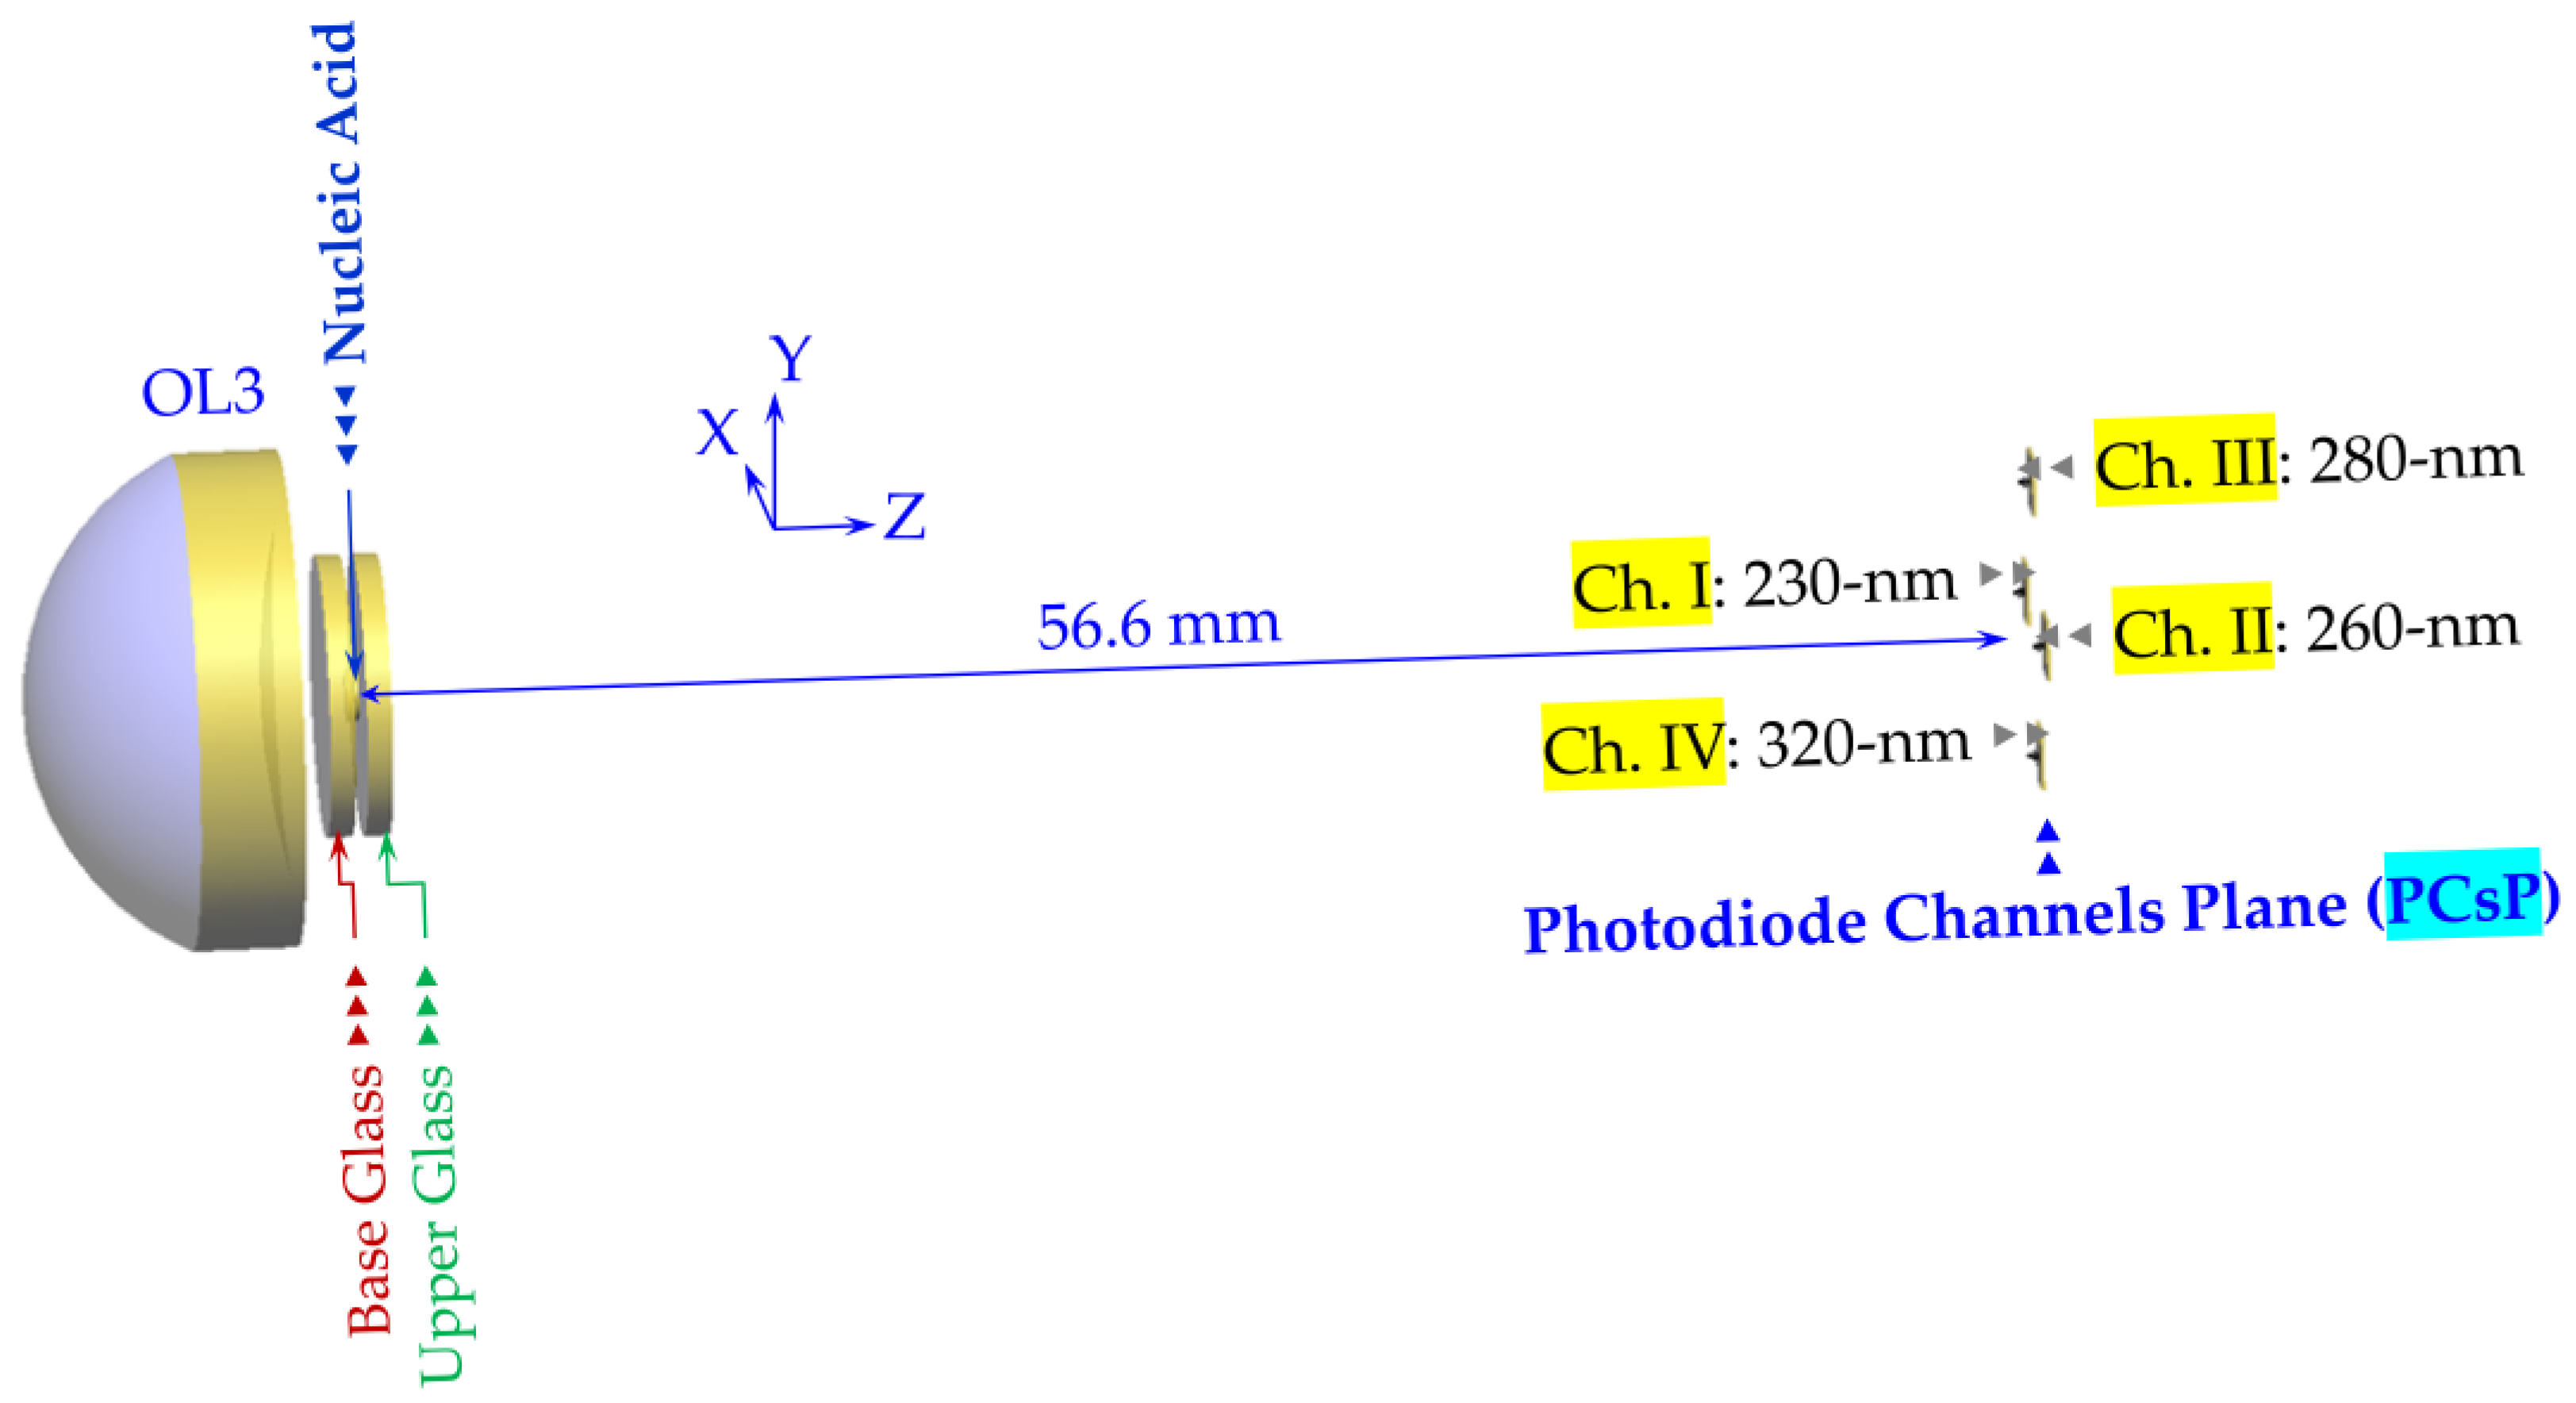
The above-mentioned light source passing through the nucleic acid sample was projected to the sensors of each wavelength channel in the light path, equivalent to a reversed pinhole camera.
Figure 5 shows a three-dimensional non-isometric view of the optimized optical layout of such reversed pinhole camera, in which the photodiode channels I to IV are coplanar and symmetrical to the optical axis (Z axis) and are set in the photodiode channels plane (PCsP), 56.6 mm away from the sample of the nucleic acids.
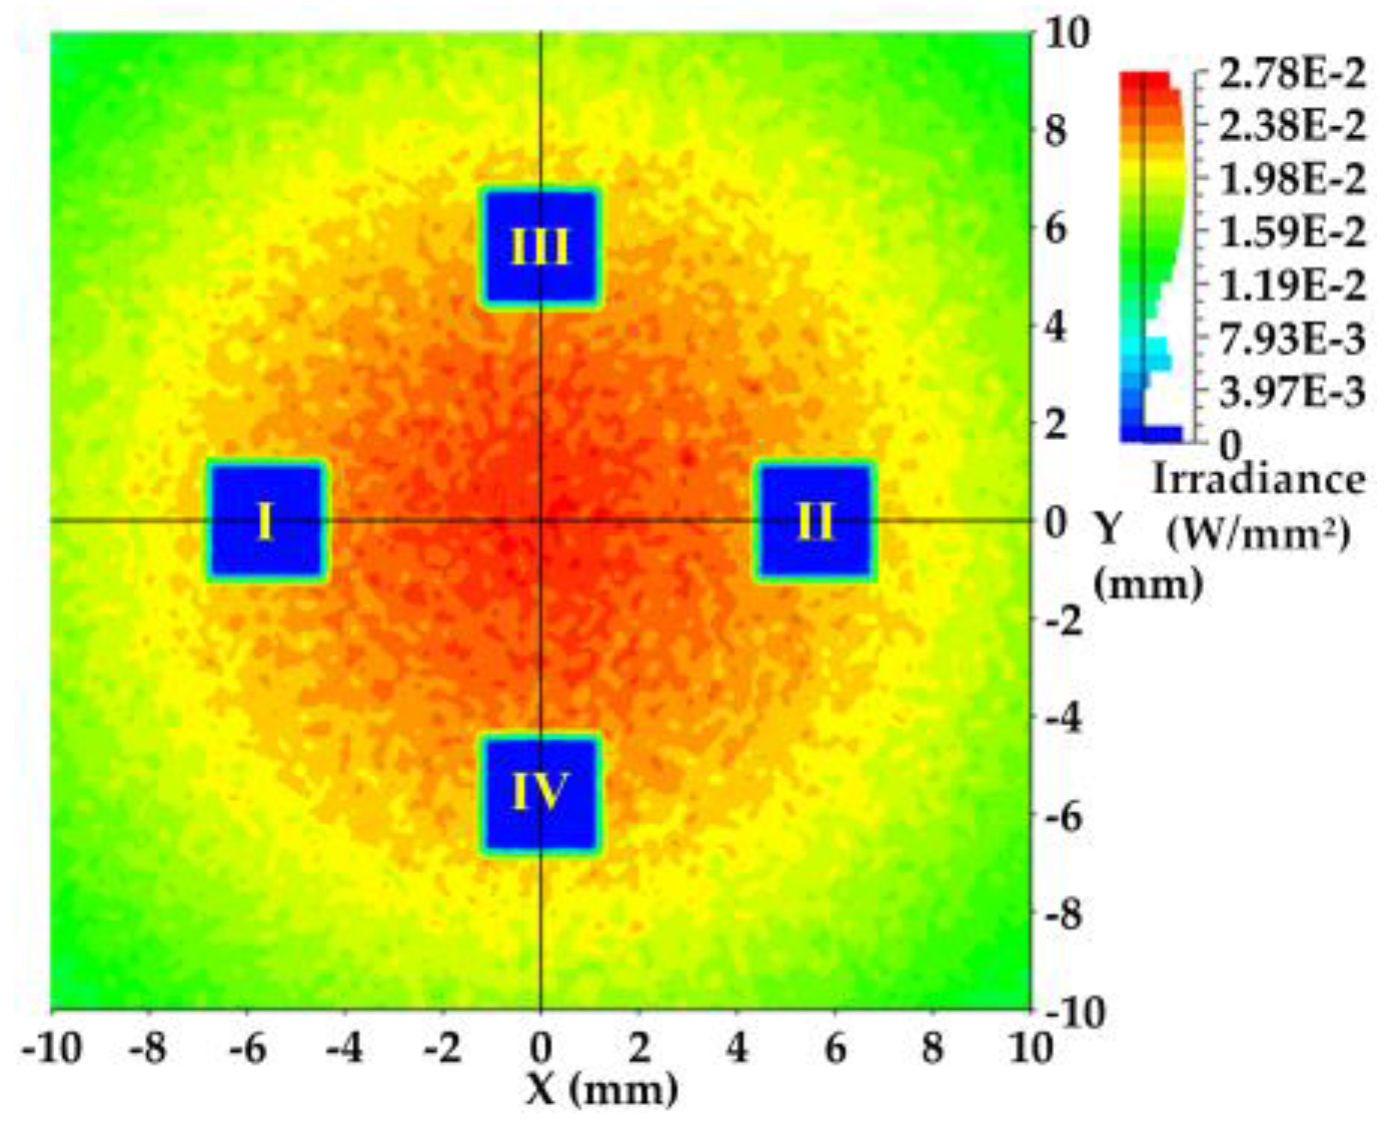
Figure 6 shows the relative position of the photodiode channels’ I to IV layouts on the PCsP and the result of the simulated irradiance. The obstructed areas with the noted text ‘I’, ‘II’, ‘III’, and ‘IV’ and an irradiance of zero are shown as the positions of the photodiode channels I to IV layout, respectively.
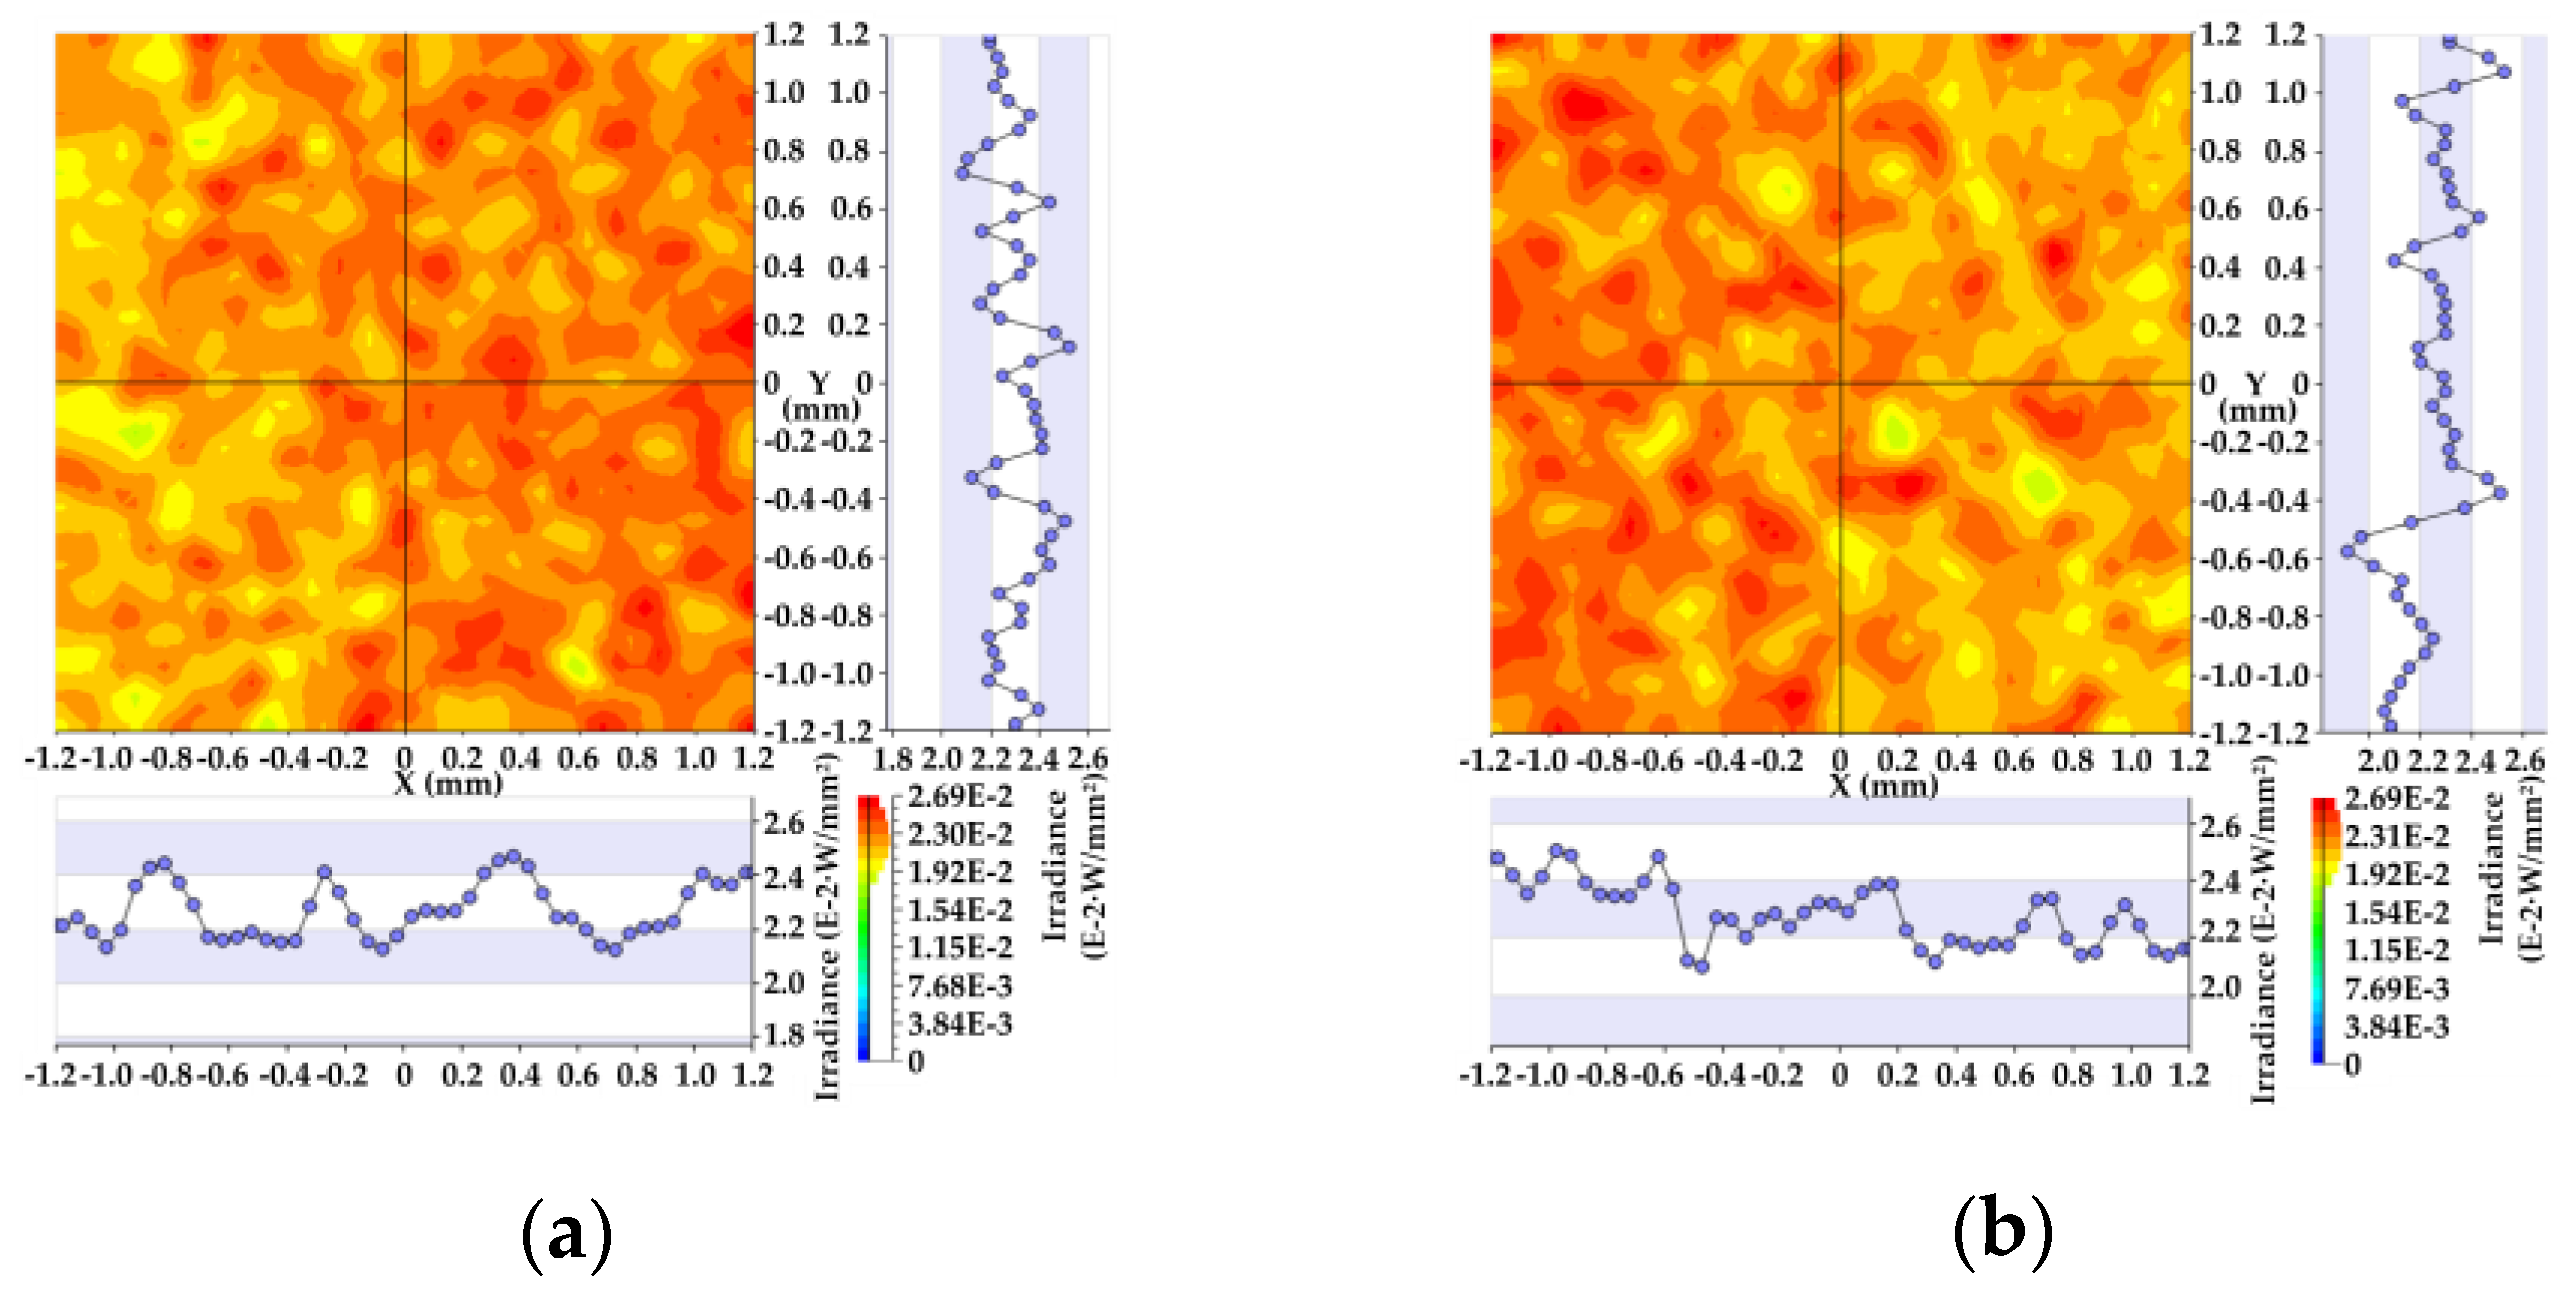
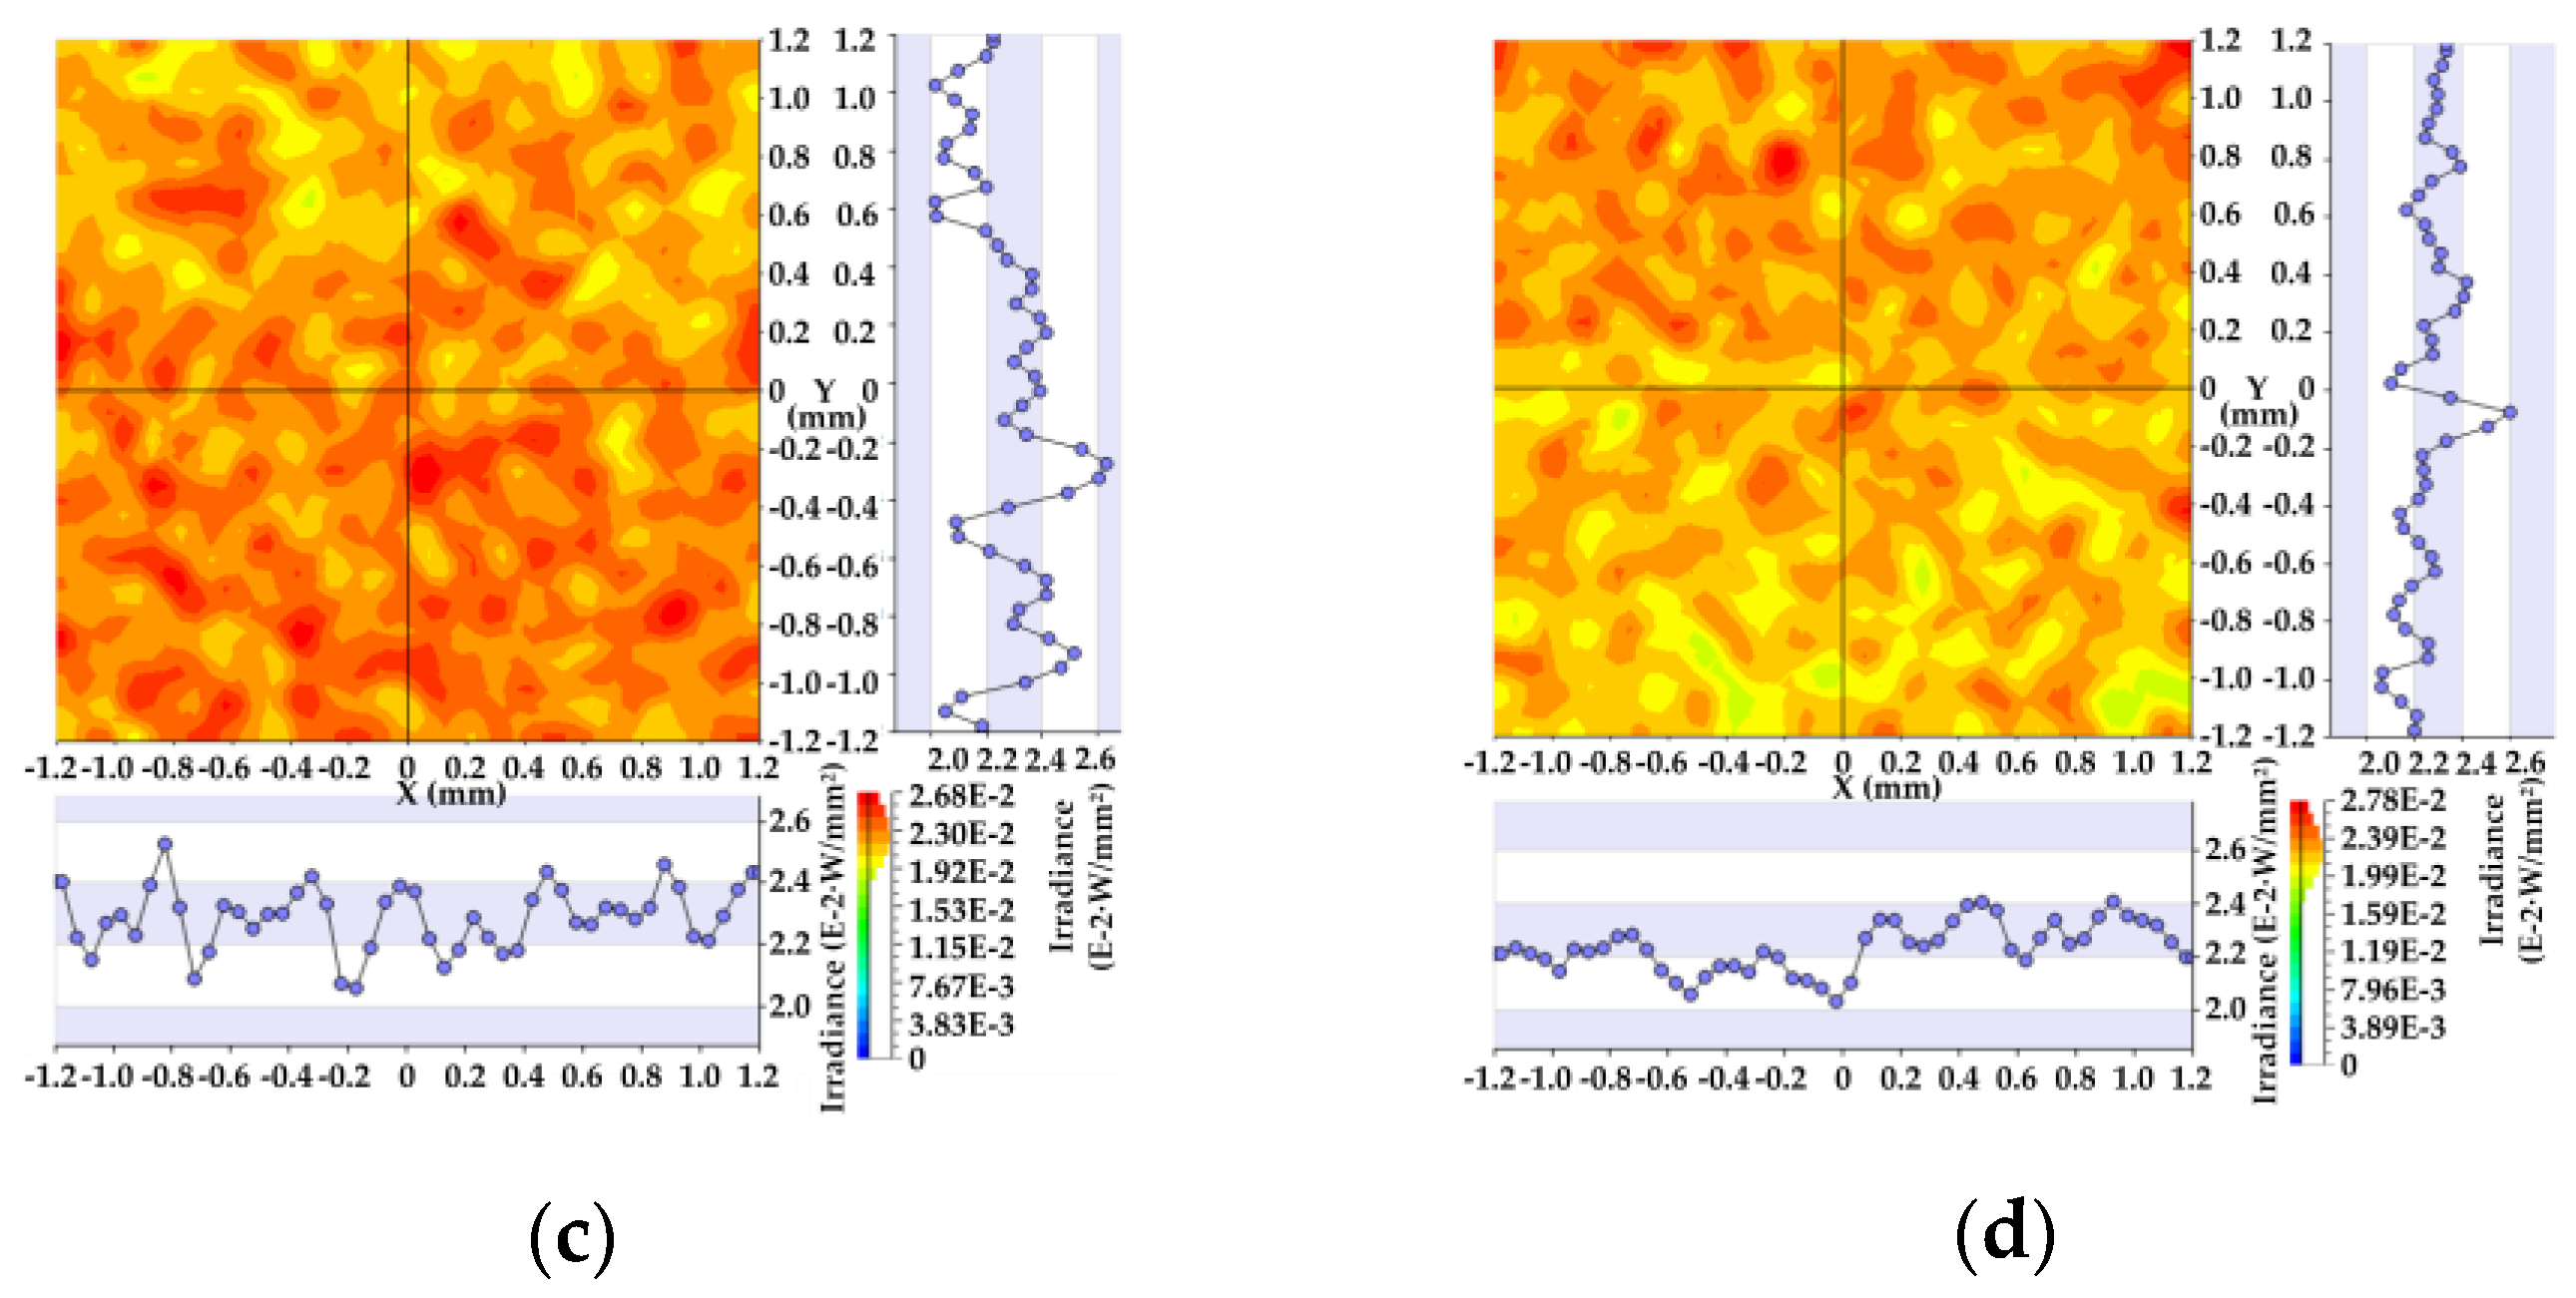
Figure 7a–d displays the results of simulated radiance on each of the sensing areas of photodiode channels I to IV.
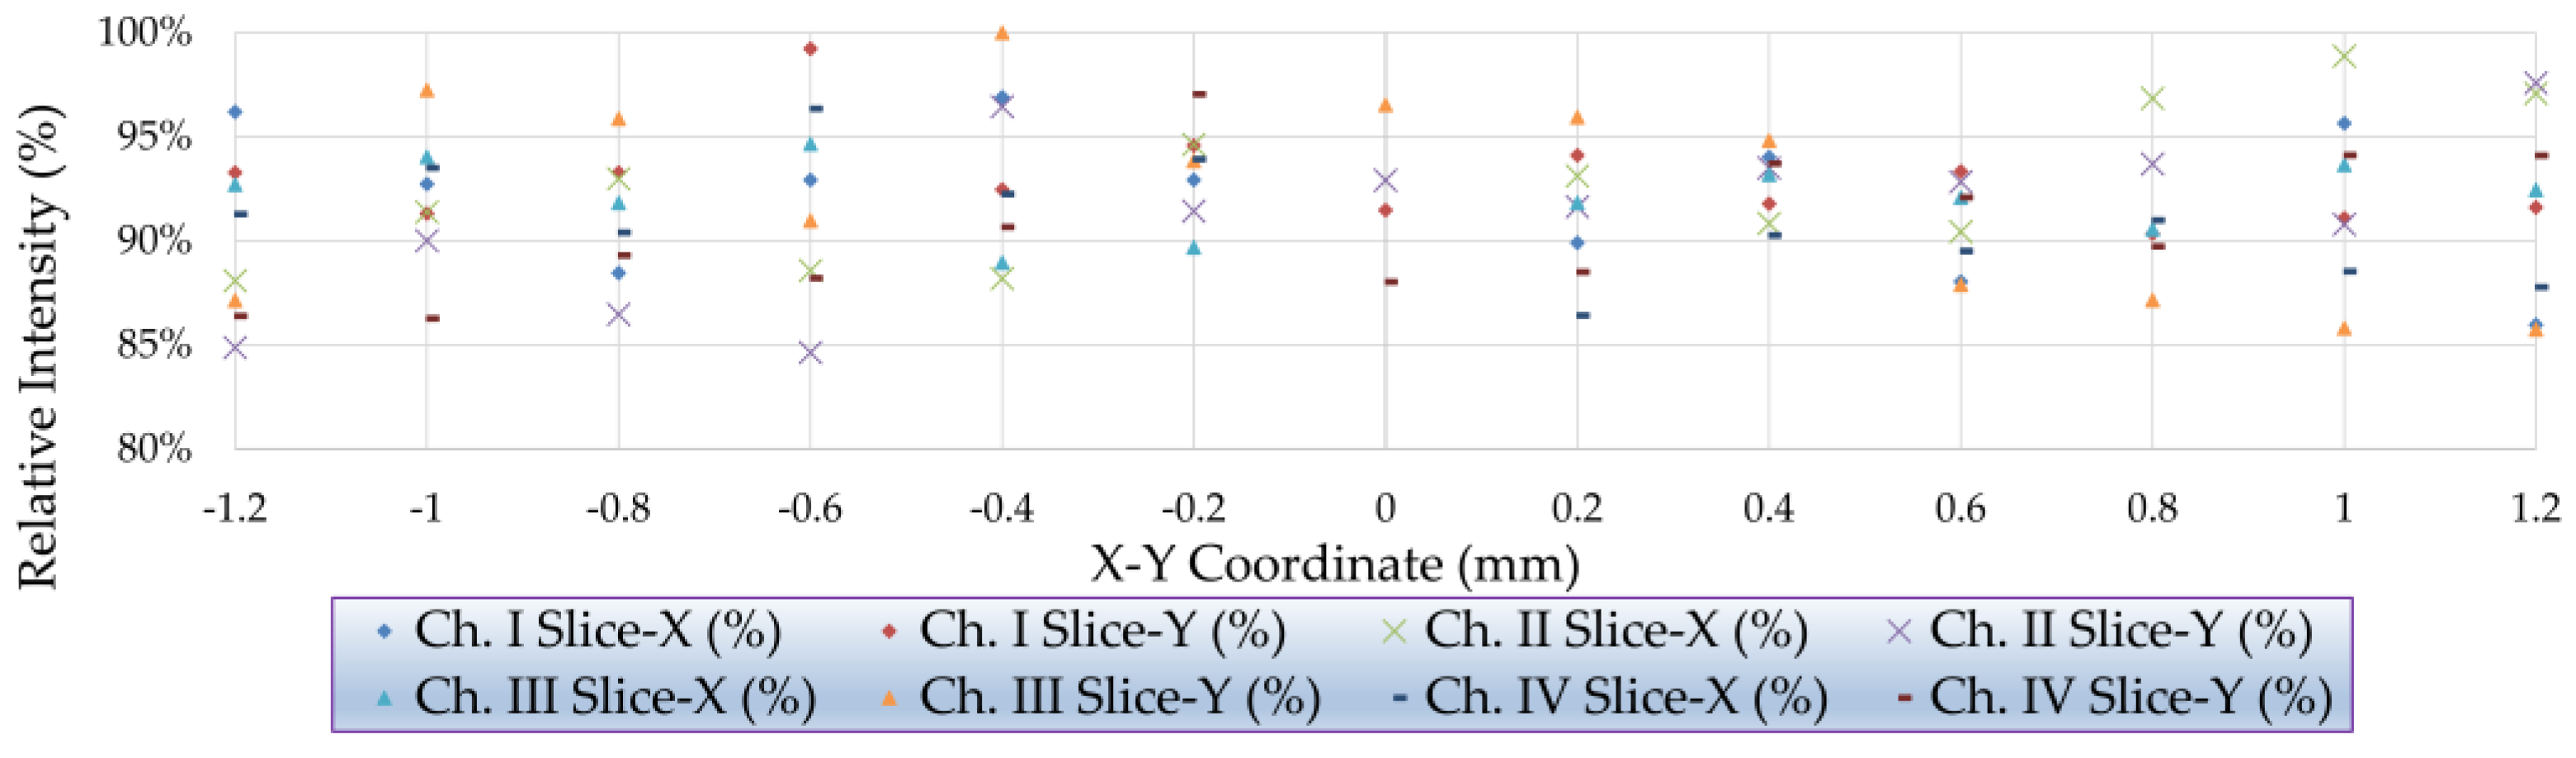
Figure 8 shows that the relative intensity across the photodiode sensing area is greater than 80% within the 1.2-mm square of each channels’ sensing area.
The results show that the relative intensity of the light source and the sensing area of each channel of the photodiode are more than 80%, which enables the quantitative microvolume nucleic acid spectrophotometer with all radiation-hardened lens elements to provide satisfactory repeatability and reproducibility; it also makes the instrument easy to calibrate.
5. Results
As shown in the above-mentioned
Figure 5, an OTO photonics Inc., SE1020C-50-DUVN Czerny–Turner spectrometer [
19] was placed in the PCsP to capture the transmission spectrum to verify the spectral comparison between the original xenon flash lamp, the transmitted light through water, and the standard RNA 600-ng/μL specimen with different band pass filters. As shown in
Figure 9, the light source of the original xenon flash lamp passes through pure water’s spectrum through the Y-axis ordinate at the right, and the other measurement results correspond to the Y-axis ordinate at the left. The ratio of A (260 nm)/A (280 nm) is 2.015, which means that the sample solution is pure RNA. The concentration of this RNA sample was deduced to be around 674.47 ng/μL, which had a deviation of approximately 12% compared with the standard concentration value of 600 ng/μL. This deviation was related to the real combination effects of the integrated components of the opto-mechatronics system (e.g., the transmission spectra, coating spectra of the optical elements, quantum efficiency of photodiodes, signal-to-noise ratio of the electronics devices and element/alignment allowable tolerances of the opto-mechanical assembly). By using the RNA sample solution within the ranges of known standard concentrations, those deviations were calibrated with numerical methods for linear curve fitting prior to shipping the instrument.
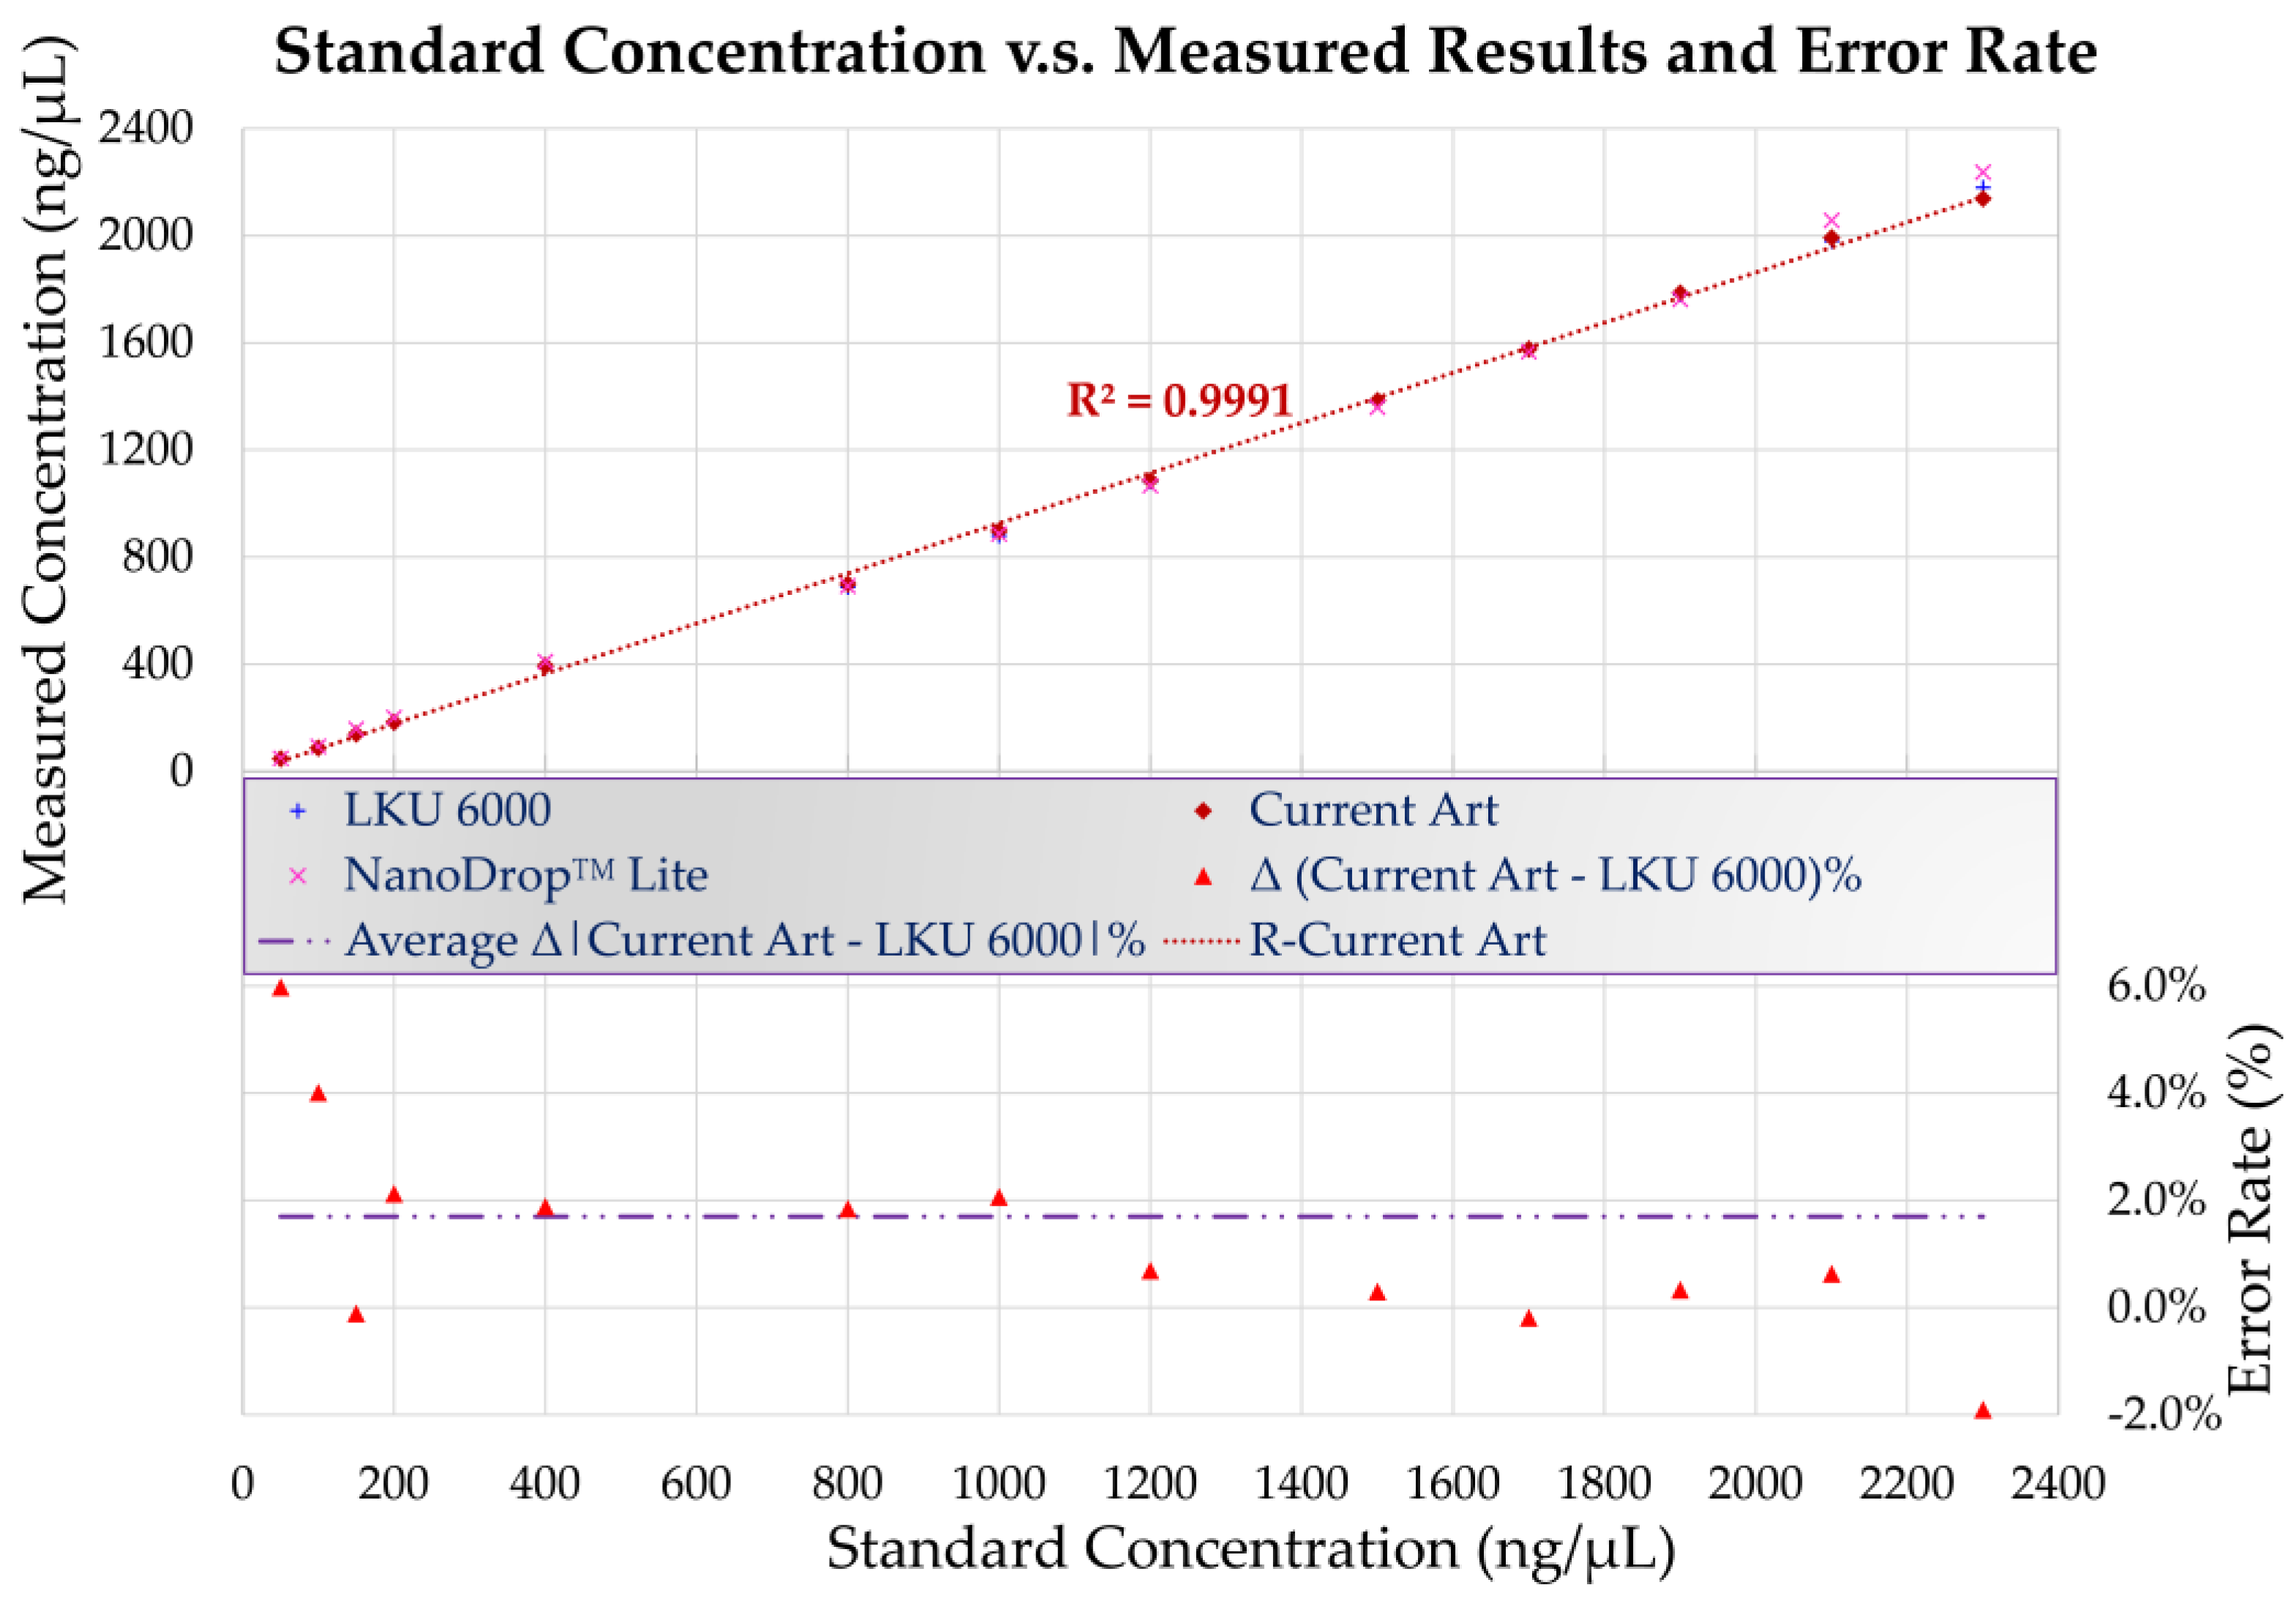
Figure 10 displays the calibrated and measured values of the standard RNA samples with reasonable known concentrations, between 50 ng/μL and 2300 ng/μL, using a LINKO LKU-6000 ultraviolet-visible (UV-VIS) spectrophotometer, NanoDrop™ Lite, and the quantitative microvolume nucleic acid spectrophotometer with all radiation-hardened lens elements for space exploration presented in this study. The comparison results of the measurements are shown as error rate in % in the Y-axis ordinate at the lower right. The results indicated that the error rate of this optical system design method of this study was between −2% and 6%, as compared with the measured values using LINKO LKU-6000 when the concentrations of the RNA samples ranged from 50 ng/μL and 2300 ng/μL, and the average absolute error rate was less than 2%.
6. Discussion
The result reveals two key findings. First, by using radiation-hardened synthetic-grade fused silica glass in the optical system, the microvolume nucleic acid spectrophotometer has a relatively high transmittance at short UV wavelengths. This design is also more robust under excessive fatigue/stress and radiation environments, as compared with most COTS microvolume nucleic acid spectrophotometers that adopt internal optical fiber optical path designs. Second, within a reasonably calibrated working range, the accuracy level of the optical system in this study is comparable to that of most of the COTS microvolume nucleic acid spectrophotometers listed in
Table A1 of
Appendix A. The average absolute error rate of the optical system for standard RNA samples within the concentration range of 50 ng/μL and 2300 ng/μL range was less than 2%.
The detection accuracy of the measured results of this optical system design method can be further improved by optimizing the opto-mechatronics systems, such as the stability governing of the transmission spectra, the coating spectra of optical elements, the quantum efficiency of potential better photodiodes, the signal-to-noise ratio improvement of the electronic devices, and reducing the range of element/alignment allowable tolerances in the opto-mechanical assembly.
7. Conclusions
This paper reports the optical system design of a quantitative microvolume nucleic acid spectrophotometer with all radiation-hardened lens elements for space exploration. In this system, a xenon flash lamp, photodiode channels of four wavelengths, and radiation-hardened optical glass materials were used; synthetic-grade fused silica SUPRASIL 3001 optical glass material with relatively high transmittance at short UV wavelength was also adopted in the design. By applying Köhler illumination in the design, the six-element illumination optics meet the requirements and the assumptions of applicability under the Beer–Lambert law. The results of the simulation and analysis showed that the relative intensity within the range of 2 mm in dimeter of the sample area, as well as that across each channel of the photodiode sensing area, were both greater than 80%. When this instrument and LINKO LKU-6000 UV-VIS spectrophotometers were used to measure standard RNA solutions at concentrations between 50 ng/μL and 2300 ng/μL, the error rate was between −2% to 6% and the average absolute error rate was less than 2%. The non-optical fiber optics design proposed in this study is more suitable for the application environment of space exploration compared with other, similar designs.


