Article

High-Sensitivity Optical-Resolution Photoacoustic Microscopy with an Optical-Acoustic Combiner Based on an Off-Axis Parabolic Acoustic Mirror

1
Ministry-of-Education Key Laboratory of Modern Acoustics, Department of Physics, Collaborative Innovation Center of Advanced Microstructures, Nanjing University, Nanjing 210093, China
2
Nanjing Polytechnic Institute, Nanjing 210048, China
3
Department of Ophthalmology, The First Affiliated Hospital of Nanjing Medical University, Nanjing 210029, China
*
Authors to whom correspondence should be addressed.
These authors contributed equally to this work.
Photonics 2021, 8(4), 127; https://doi.org/10.3390/photonics8040127
Submission received: 23 March 2021 / Revised: 8 April 2021 / Accepted: 14 April 2021 / Published: 18 April 2021
(This article belongs to the Special Issue Photoacoustic Imaging for Biomedical Applications)

Abstract

:
Optical-resolution photoacoustic microscopy (OR-PAM) is a promising noninvasive biomedical imaging technology with label-free optical absorption contrasts. Performance of OR-PAM is usually closely related to the optical-acoustic combiner. In this study, we propose an optical-acoustic combiner based on a flat acoustic reflector and an off-axis parabolic acoustic mirror with a conical bore. Quantitative simulation and experiments demonstrated that this combiner can provide better acoustic focusing performance and detection sensitivity. Moreover, OR-PAM is based on the combiner suffer low optical disorders, which guarantees the good resolution. In vivo experiments of the mouse brain and the iris were also conducted to show the practicability of the combiner in biomedicine. This proposed optical-acoustic combiner realizes a high-quality optical-acoustic confocal alignment with minimal optical disorders and acoustic insertion loss, strong acoustic focusing, and easy implementation. These characteristics might be useful for improving the performance of OR-PAM.

1. Introduction

Photoacoustic (PAI) imaging is a promising noninvasive biomedical imaging technology and has been rapidly developed in recent years [1,2,3,4,5,6,7,8]. Optical-resolution photoacoustic microscopy (OR-PAM) is one form of the PAI inheriting its characteristics and is useful in both preclinical and clinical research [9]. In OR-PAM, the tissue is irradiated usually by a focused short-pulsed laser beam to achieve a thermal and acoustic impulse response, which is called the photoacoustic (PA) effect [10,11,12]. PA wave is received by the ultrasonic transducer, and transferred into a computer to form the images of the tissues. OR-PAM could achieve images with a resolution of micron-scale or even submicron-scale level and a penetration depth of up to one millimeter [13]. Moreover, it is unique among optical microscopy technologies for its label-free detection of optical absorption with a relative sensitivity of 100% [14]. Hence, OR-PAM has shown great potentials in various biomedical applications, such as brain imaging [2,5,15,16], breast cancer imaging [3], animal embryo imaging [4,17], cell imaging [18,19,20], and microcirculation imaging [6,21,22,23,24,25,26,27,28,29,30].
Usually, an OR-PAM system involves an optical-acoustic combiner to achieve the optical-acoustic confocal alignment. An early design of the combiner is composed of two prisms sandwiching a thin layer of silicone oil [31]. Then, its improved version is made of a rhomboid prism and a right-angle prism, which overcomes the series of acoustic insertion loss induced by the transforming from longitudinal-mode wave to shear-mode wave at the interface [17,32]. Customized ring-shaped focused ultrasonic transducer with a central hole to pass the optical beam is also designed to achieve optical-acoustic confocal alignment [2,20]. Furthermore, optically-transparent focused ultrasound transducers could be considered as its advanced solution [33,34] to make PAM highly integrated, and it will have great potential when the processing costs is reduced. A parabolic acoustic mirror was combined with an optical lens that has a large optical numerical aperture (NA) together to realize a submicron-resolution reflection-mode OR-PAM [23]. This combiner aimed to achieve a large optical NA, and showed good acoustic potential. Additionally, another kind of combiner is arranging a thin glass plate or perforated acoustic mirror to redirect the ultrasonic beam propagating in water to a focused ultrasonic transducer, and a confocal laser beam can pass through the transparent glass plate [26,27] or the central hole [28] to achieve confocal alignment. In a word, performance of OR-PAM is closely related to the optical-acoustic combiner. A good combiner usually requires low optical disorders, low acoustic insertion loss, strong acoustic focusing, to ensure superior optical resolution, good PA excitation efficiency, and high acoustic detection sensitivity.
In this study, we propose an optical-acoustic combiner composed of a flat acoustic reflector and an off-axis parabolic acoustic mirror (OPM) with a conical bore. The optical beam can be undistorted focused on the sample through the conical bore. The OPM provides strong acoustic focusing with a large acoustic NA. To realize the large acoustic NA, the structure of the parabolic mirror used in our study is different from the reported one [23]. Additionally, in order to facilitate the placement of the transducer, we have designed a sound path with two reflection in the combiner. In comparison to the other methods, the entire acoustic propagation path from the source to the transducer in our combiner is in the water, which ensures low insertion loss and a better detection sensitivity. Additionally, the proposed combiner does not rely on customized ultrasound transducer. Commonly used commercial transducers are suitable. We demonstrated the advantage and practicality of the proposed design by using numerical simulations, phantom measurement, and in vivo imaging experiments.

2. Materials and Methods

2.1. Experimental Setup

The Nd:YAG laser (EXPL-532-2Y, Spectra-Physics Inc., Santa Clara, CA, USA) worked at a wavelength of 532 nm and the repetition rate was set at 10 kHz. Haemoglobin has strong optical absorption near 532 nm, and this laser will benefit imaging the microvascular network in tissue. The laser beam was coupled into a single mode optical fiber via a free-space-to-fiber coupler. The output light was collimated and guided into the combiner. The photodiode (PDA10A-EC, Thorlabs, Inc., Newton, NJ, USA) monitored the intensity and the stability of the laser beam. Its output was also served as a trigger for PA signal detection. The ultrasonic coupling was through water. The detected PA signals were amplified by a low noise amplifier (SA-915D1, NF Corporation, Yokohama, Japan) with a gain of 46 dB and digitized by the DAQ card (NI 5761, National Instruments Corporation, Austin, TX, USA) at a sampling frequency of 250 MHz. The samples were scanned by a 2D motorized translational stage (M-VP-25XA, Newport Corporation, Irvine, CA, USA) to achieve the PA images.
In the optical-acoustic combiner, the light was focused on the sample by an objective with the NA of 0.10. PA signals were detected by a flat ultrasonic transducer (A319S, Olympus Corporation, Tokyo, Japan) with a center frequency of 15 MHz, and a relative bandwidth of 47% at −6 dB. Ultrasound with low frequency has much smaller attenuation than that with high frequency. The home-made OPM (details of its size is discussed in Section 3.1) was made of aluminum alloy, with an acoustic impedance approximately 7.0 × 10⁶ N s/m3. We firstly had the aluminum alloy computerized numerical control (CNC) machined according to our design diagram. Then, the parabolic surface of the OPM was polished to improve the reflection performance. Huge acoustic impedance mismatch between aluminum and water (approximately 1.48 × 10⁶ N s/m3) promises highly efficient acoustic reflections at the water–aluminum interface.

2.2. Animal Preparation

We used Balb/c mice for the in vivo studies. The mice were around 8 weeks and approximately 30 g. After being anesthetized through a vaporized isoflurane system, the scalp of the mice were carefully removed and the skull was preserved before imaging experiment. The concentration of isoflurane gas used during the experiments was 3%. Our experiments were performed in a temperature-controlled room. During the experiment, the mice lay in a constant-temperature blanket, the temperature of which was controlled and monitored to be between 35.5 °C and 36.5 °C. A small animal oximeter (MouseOx Pulse Oximetry System, Starr Life Sciences, Oakmont, PA, USA) was used to monitor the heart rates, respiration, and oxyhemoglobin saturation. After the imaging experiments, the mouse was sacrificed using a standard procedure. All the animal procedures were performed in accordance with institutional guidelines and approved by the First Affiliated Hospital of Nanjing Medical University.

3. Results and Discussion

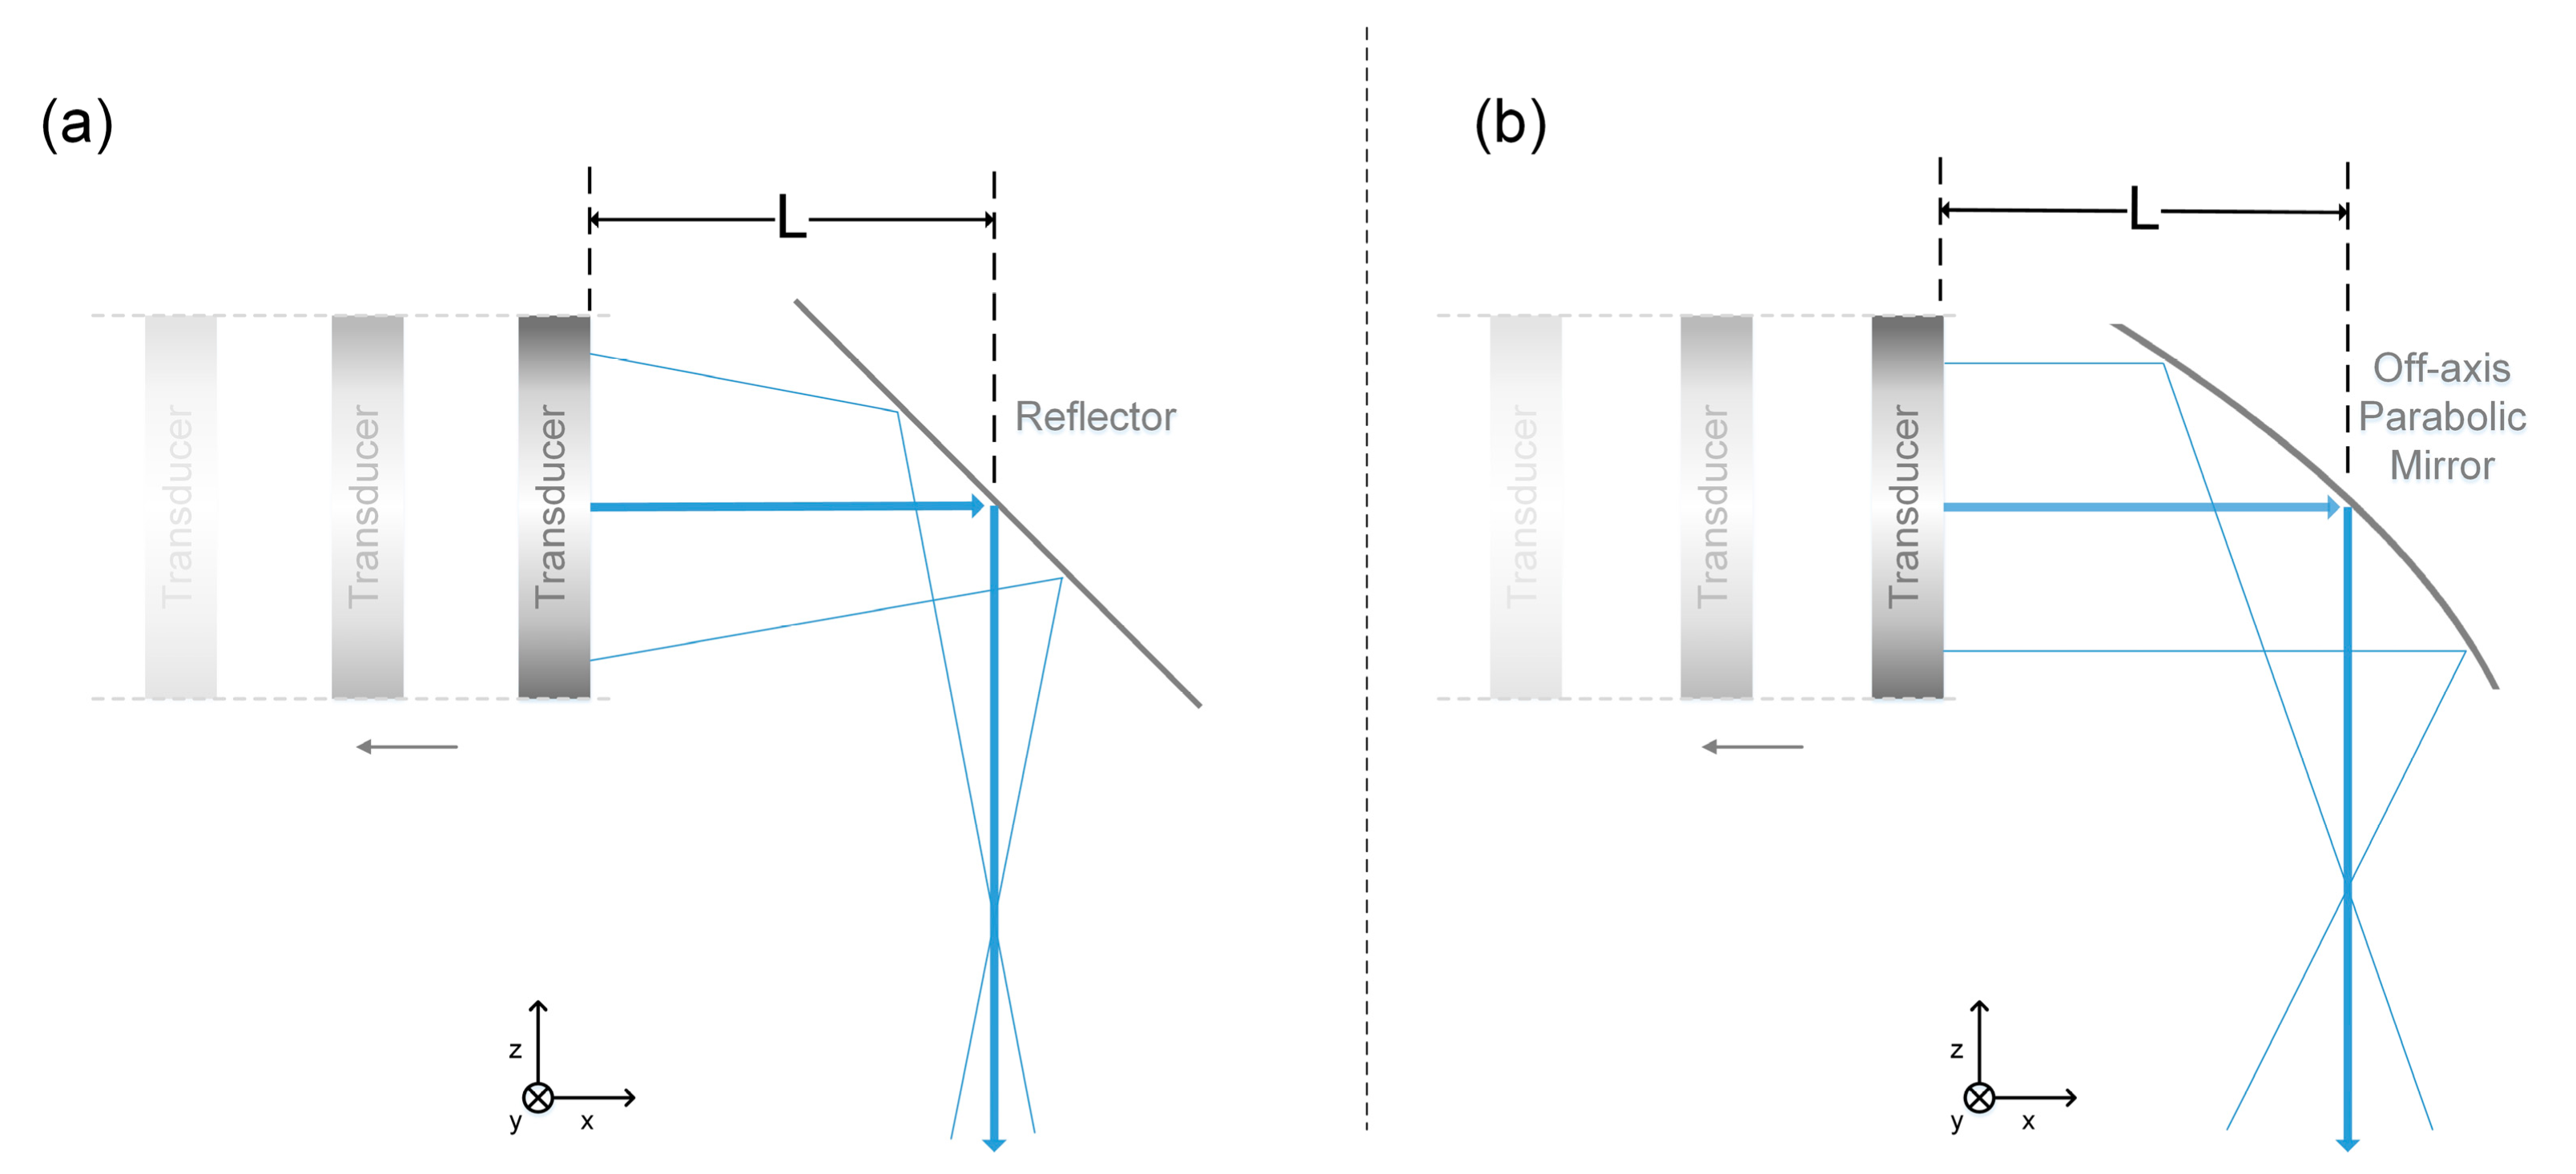
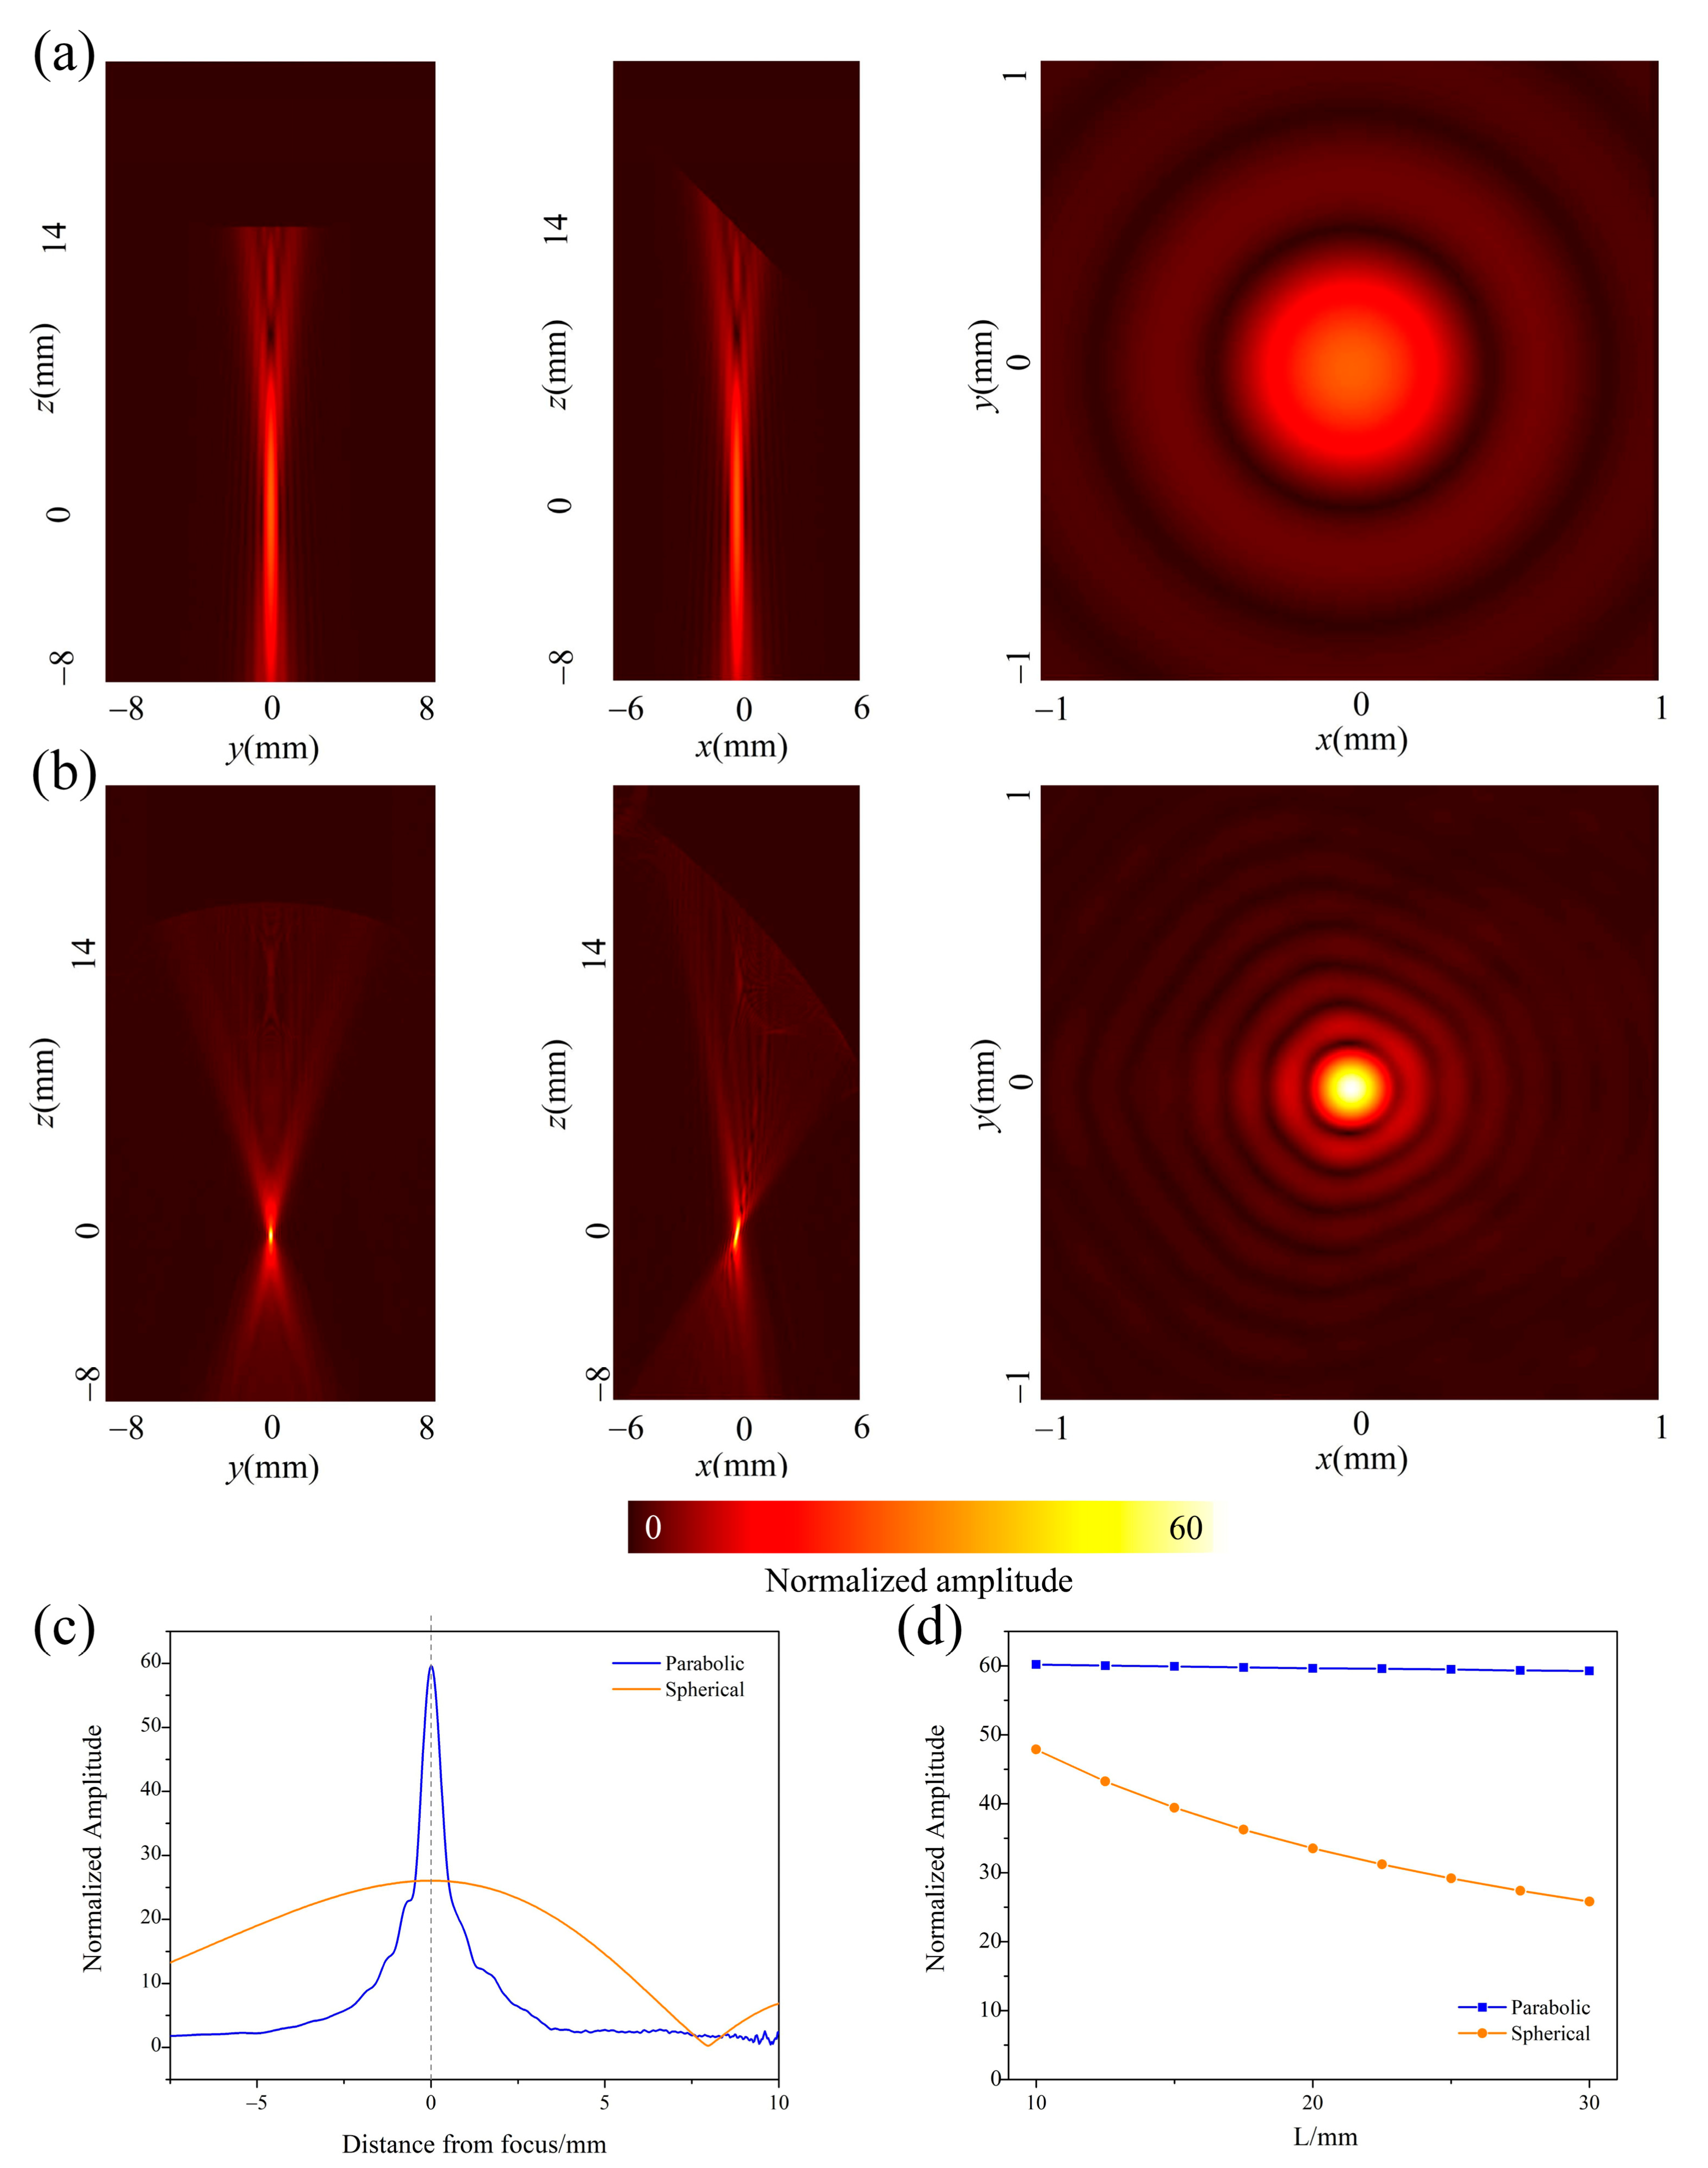
3.1. The Optical-Acoustic Combiner Based on the OPM

Figure 1 gives the schematic map of the OR-PAM and the design of the optical-acoustic combiner. The emitting laser was coupled and focused on the sample through the combiner, exciting a PA wave. The excited PA wave was redirected in the combiner and received by the ultrasonic transducer. The photodiode monitored the intensity and the stability of the laser beam. Its output was also served as a trigger for PA signal detection. The detected PA signals were amplified and digitized by the data acquisition (DAQ) card. Scanning the sample by a 2D motorized translational stage, images can be extracted from the detected PA signals.
The design of the optical-acoustic combiner is given in the red dashed box in Figure 1. The combiner was composed of a flat acoustic reflector and an OPM with a conical bore. The incident laser beam was focused on the sample, through the conical bore in the OPM. The PA wave was generated from the laser’s focal spot and emitted toward the surrounding media. The focal point of the OPM was overlapped with the optical focal spot. The divergent PA wave from the focus was reflected by the OPM and turned into a collimating beam. Then, the collimating ultrasonic beam was redirected by the flat acoustic mirror placed toward the OPM, and finally received by an unfocused immersion ultrasonic transducer. The purpose of the confocal alignment was to improve the sensitivity of OR-PAM. At the optical focal point, the maximum optical absorption happens and the strongest PA signal was generated. At the acoustic focal point, i.e., OPM focal point, the ultrasound transducer had the maximum detection sensitivity. Therefore, overlap between OPM focal point with optical focal spot will maximize the PAM image sensitivity. This combiner promises high efficiency of PA excitation and detection, benefitting from the optical-acoustic confocal alignment.
Figure 2 illustrates the profile map of the OPM. In the following simulation and experiments, an unfocused ultrasonic transducer with a diameter of 16 mm (the nominal element size is 12 mm) was used to detect PA signals. Based on the dimension of the ultrasonic transducer, the OPM was designed as a diameter of D = 16 mm, which was the same as that of the transducer. The parent focal length (PFL) of the parabolic surface was PFL = 8.5 mm, and the off-axis distance (OAD) between the focal point and the bottom of the OPM was OAD = 6 mm. The reflected focal length (RFL), i.e., the distance between the center of the OPM and the focal point, was RFL = 14 mm. Moreover, the system specifications are presented in Table 1.
Numerical simulations were applied to examine the acoustically focusing ability of the combiner. We computed the sound pressure with the Rayleigh Integral in MATLAB (R2019b, Mathworks, Natick, MA, USA). Figure 3 shows the two different schemes to achieve acoustic focusing. One was achieved by a spherically focused ultrasonic transducer and a flat acoustic reflector [28]. Another one was achieved by an unfocused transducer and the proposed combiner. The surface sensitivity of the transducer was set as the same with each other. The two transducers had the same element size of 12 mm and the same central frequency of 15 MHz. Moreover, the focuses were both fixed at the same position (14 mm below the central axis). During this process, the flat acoustic mirror and the focus remains stationary and the transducer’s position was adjusted along the central axis of the OPM to fix the focus at the same position. This meant that the focus was maintained 14 mm under the central axis. The distance L between the transducer and the mirror center was 10 to 30 mm in the following simulation. For the spherically focused transducer, its focal length varied from 24 mm to 44 mm, in order to keep consistent with the set position. The surrounding media is water, in which the speed of sound is 1500 m/s.
Figure 4 compares the acoustic focusing performance of two schemes. Figure 4a illustrated the predicted detection sensitivity achieved by a spherically focused transducer and a flat acoustic reflector. Figure 4b gives the detection sensitivity achieved by the OPM with a flat transducer. It was seen that the focal spot achieved by the scheme one was much bigger than that achieved by the proposed scheme. Additionally, its focal intensity was much weaker than the proposed scheme, as shown in Figure 4c. It meant that the proposed method had stronger acoustic focusing ability. It was said that the proposed combiner has better receiving sensitivity than the scheme of the focused transducer and the flat acoustic reflector. This was because the proposed combiner had a larger acoustical NA, as shown in Figure 3.
Additionally, we also predicted the situation when the transducer is far away from the reflector. For the scheme composed of a focused transducer and a flat acoustic reflector, the focal length must be increased in order to maintain the focal position. The results showed the sensitivity at the focus was decreased as the distance L was increased, as shown in Figure 4d with the solid dots. However, for the proposed combiner, as the transducer was far away from the OPM, the intensity at focus almost remained stable, even when the distance L was increased from 10 to 30 mm. This was because the ultrasonic beam excited from the focus of the OPM was reflected and redirected into a collimated beam. The collimated beam meant that the receiving transducer could be placed at any position of the central axis, which brings much convenience while designing the combiner scheme.
The proposed combiner has the following characteristics. First, the ultrasonic beam propagating path in this combiner is only in water. The ultrasonic beam does not transmit through any acoustic lens or other solid separators. It prevents the acoustic energy loss due to the acoustic impedance mismatching or the longitudinal-shear mode transforming at the liquid–solid interface. Therefore, this design guarantees low insertion loss. Second, the combiner achieves the acoustic focusing using the OPM, instead of acoustic lens. The OPM can provide a larger NA than the focused transducer. Therefore, the combiner has stronger acoustic focusing ability and better receiving sensitivity. Third, the ultrasonic beam is approximately collimated after being reflected by the OPM. It is convenient to settle a flat transducer or flat acoustic mirror in the combiner to redirect and receive the ultrasonic beam. Fourth, the combiner does not bring any additional optical element in the optical path, which promises low optical disorders. These characteristics would be useful in improving the performance of OR-PAM.

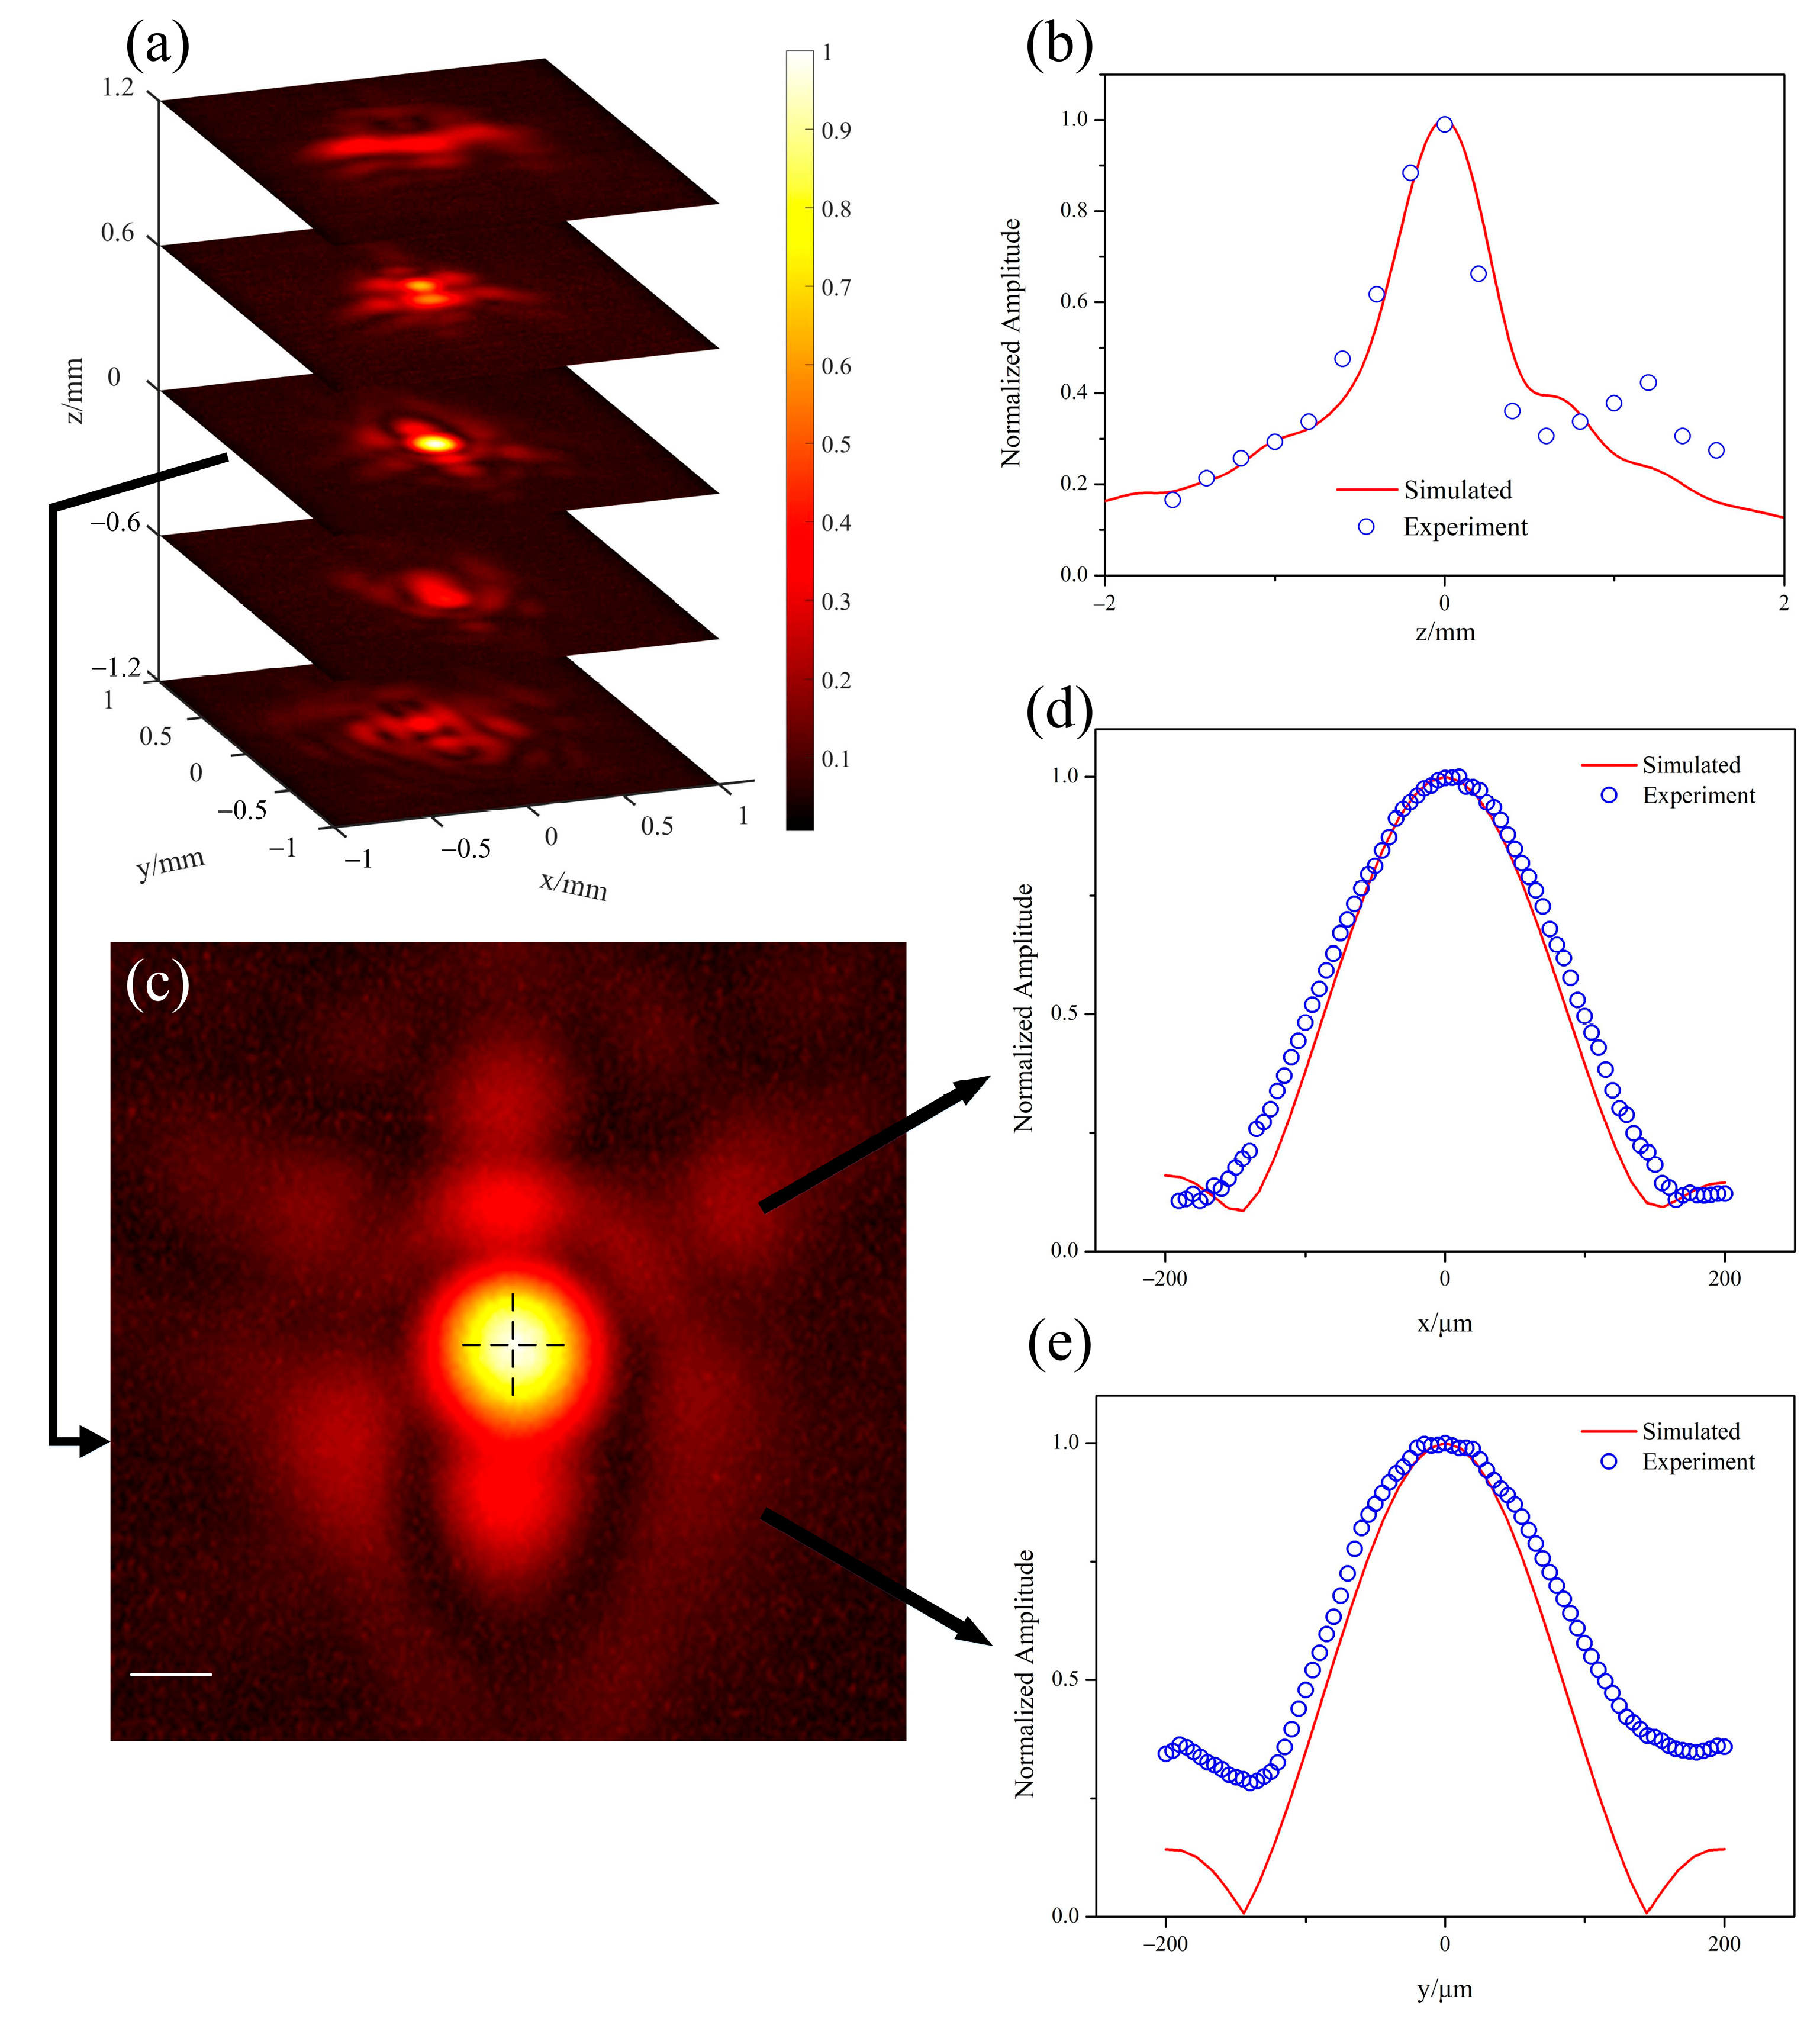
3.2. System Performance

The performance of the proposed optical-acoustic combiner was tested by phantom experiments. The experimental setup used for the performance test and imaging experiments is presented in Figure 1. The optical-acoustic confocal alignment was achieved before experiments. First, we carefully designed and customized the combiner and the parabolic mirror. The ultrasound transducer can be stably fixed in the combiner and the position of the acoustic focal spot can be approximately estimated according to the design. Second, by illuminating unfocused laser (not through the combiner) on a particle, we generated a point acoustic source. We could determine the position of the acoustic focal point, by adjusting the combiner in x, y, z direction until maximizing the received signal, which is similar to the experiments given in Figure 5. Third, we moved the acoustic focal spot to a black tape and adjust the position of the incident laser beam (through the combiner) until maximizing the receiving signal. Then, we can say that the confocal alignment is achieved.
In the first experiment, we examined the ability of ultrasonic focusing of the combiner. The imaging target is a single polyester particle with a diameter of approximately 100 μm. We separated the single microsphere and then taped it on a cover glass. There was some interspace between the tape and the microsphere and we filled it with distilled water. Laser beam with a diameter approximately 5 mm was directly illuminating on the micro-particle from below, through a mirror under the target, but not through the combiner. Whereas, generated PA signals were detected through the ultrasonic transducer in the combiner. The combiner was moved by the 2D motorized translational stage. Then, images of the micro-particle were obtained by scanning the sample along the x-y plane with a step size of 5 μm. By changing the depth of the combiner in the z direction and repeating the scanning processes, a series of images were obtained. Since laser was unfocused and fixed in this experiment, the image quality depended on the acoustic focusing of the combiner. The diameter of the particle was small enough to be approximately estimated as a point source. Therefore, these images can be used to approximately evaluate the acoustic focusing performance of the combiner. A total of 18 images were obtained from 2.1 mm above the focus to 3.3 mm below it, with an axial (z-direction) interval of 0.3 mm.
Figure 5a demonstrates 5 layers around the focal plane, from 1.2 mm below the focus to 1.2 mm above the focus. Figure 5b compares the focusing condition along the acoustic axis, where the blue empty dot is measured in the experiment and the red solid line is predicted by numerical simulations. Figure 5c gives the image obtained on the focal plane. Figure 5d,e plot two cross sections of the acoustic focus along x and y direction, with their simulated results. The full width at half maximum (FWHM) of the profile in the image was only approximately 183 μm in x direction and only approximately 151 μm in y direction, which was close to the simulated data at the focus in the two directions. The small focal size implied strong acoustic focusing ability and high receiving sensitivity. These experimental results demonstrate the proposed combiner can provide efficient acoustic focusing and is in good agreement with the theoretical predictions, which means strong acoustic focusing.
In the second phantom experiments, we tested the resolution of the OR-PAM with the proposed optical-acoustic combiner. A bunch of carbon fibers were used as imaging objects. We took the fibers with a diameter of approximately 7 µm, placed it on a cover glass, randomly separated them with distilled water, and taped them to the cover glass with optically clear adhesive tape. The scanning step was 1 μm. Figure 6a shows the maximum amplitude projection (MAP) image of carbon fibers. The OR-PAM system obtained the geometric shape, size, and position of the carbon fibers clearly. Figure 6b is the normalized cross-sectional profile (the blue empty dots) of the carbon fiber image indicated by the arrow in Figure 6a. We took logarithm of the PA value along x direction, and applied the ordinary least squares method to get the fitting curve. By applying this Gaussian curve fitting to the profile data (red solid line), we can estimate that the FWHM along the x direction was approximately 13.2 μm. The green dashed rectangle marked an area with higher PA amplitude, which means samples in this area were closer to the optically focal plane. By choosing 20 profiles in the green dashed box and implementing curve fitting, it was shown that the FWHM had a mean value ± standard deviation of 12.8 ± 1.8 μm. The angle between the fiber and the x-direction was approximately 57.0°, so the diameter of the fiber was 9.6 μm. Considering the diameter of the fiber was approximately 7 μm, the lateral resolution of the imaging system was estimated as 2.6 μm according to the Rayleigh criterion. Taking account of the NA = 0.13 of the objective lens in water and the laser wavelength λ = 532 nm, the lateral resolution of the OR-PAM system could be theoretically estimated as 0.51λ/NA = 2.04 μm. It was shown that the lateral resolution of our OR-PAM system was close to the theoretical resolution. This phantom imaging result demonstrated the OR-PAM system was able to image biological tissues such as microvasculatures (approximately 5 μm) clearly.

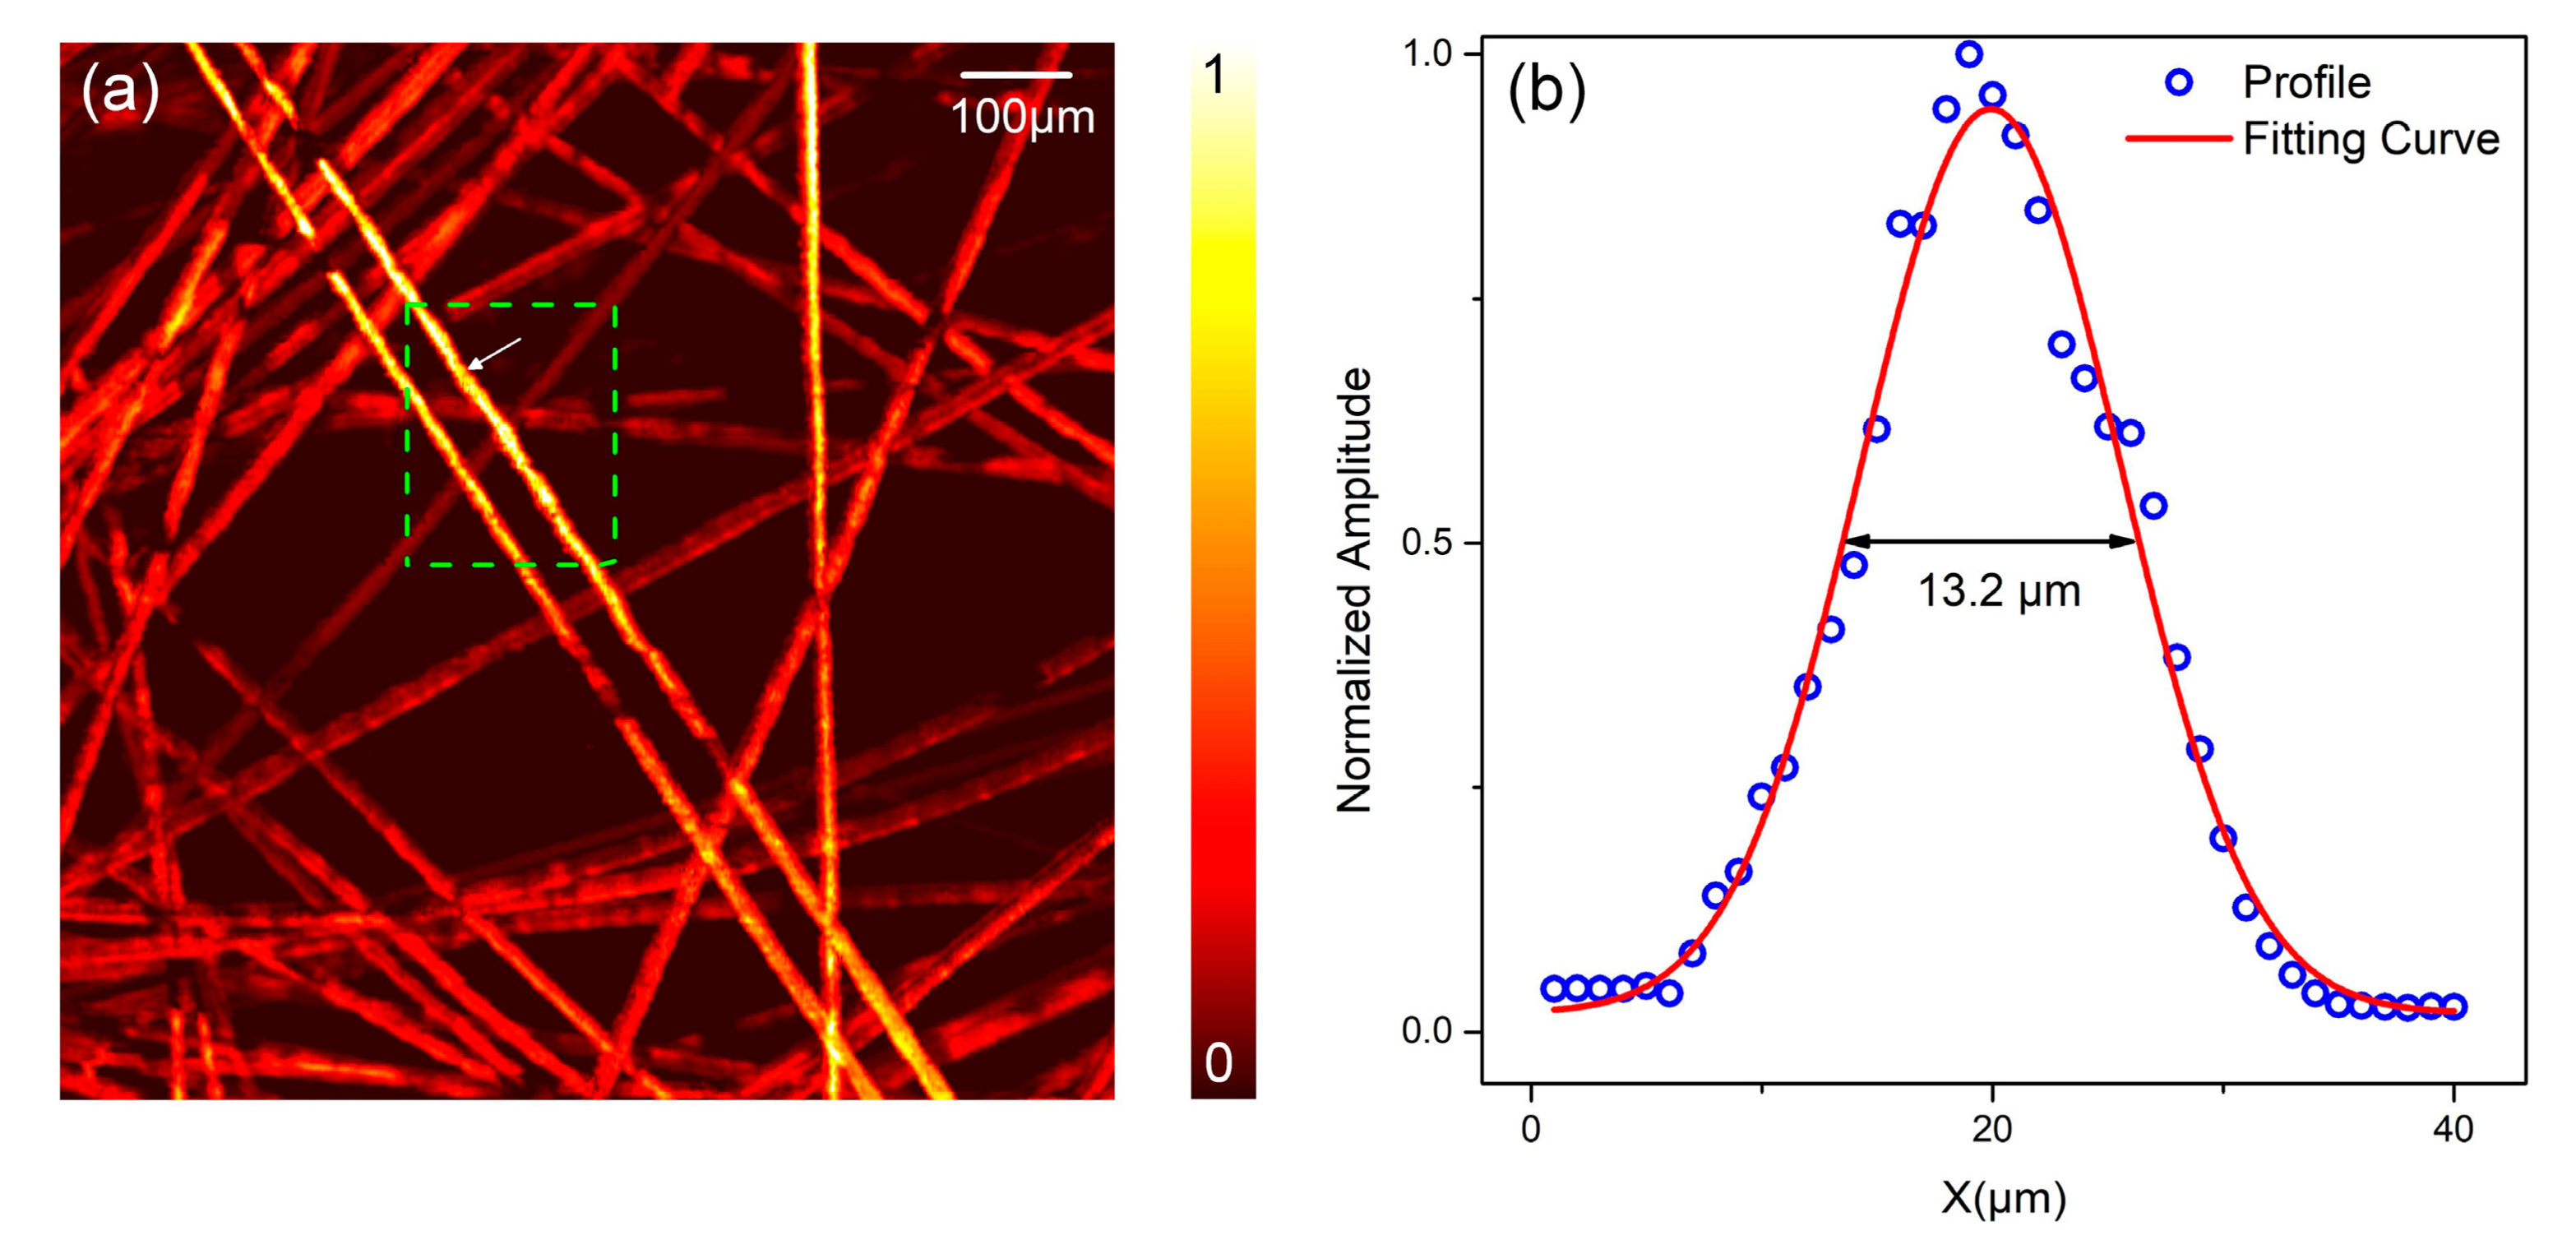
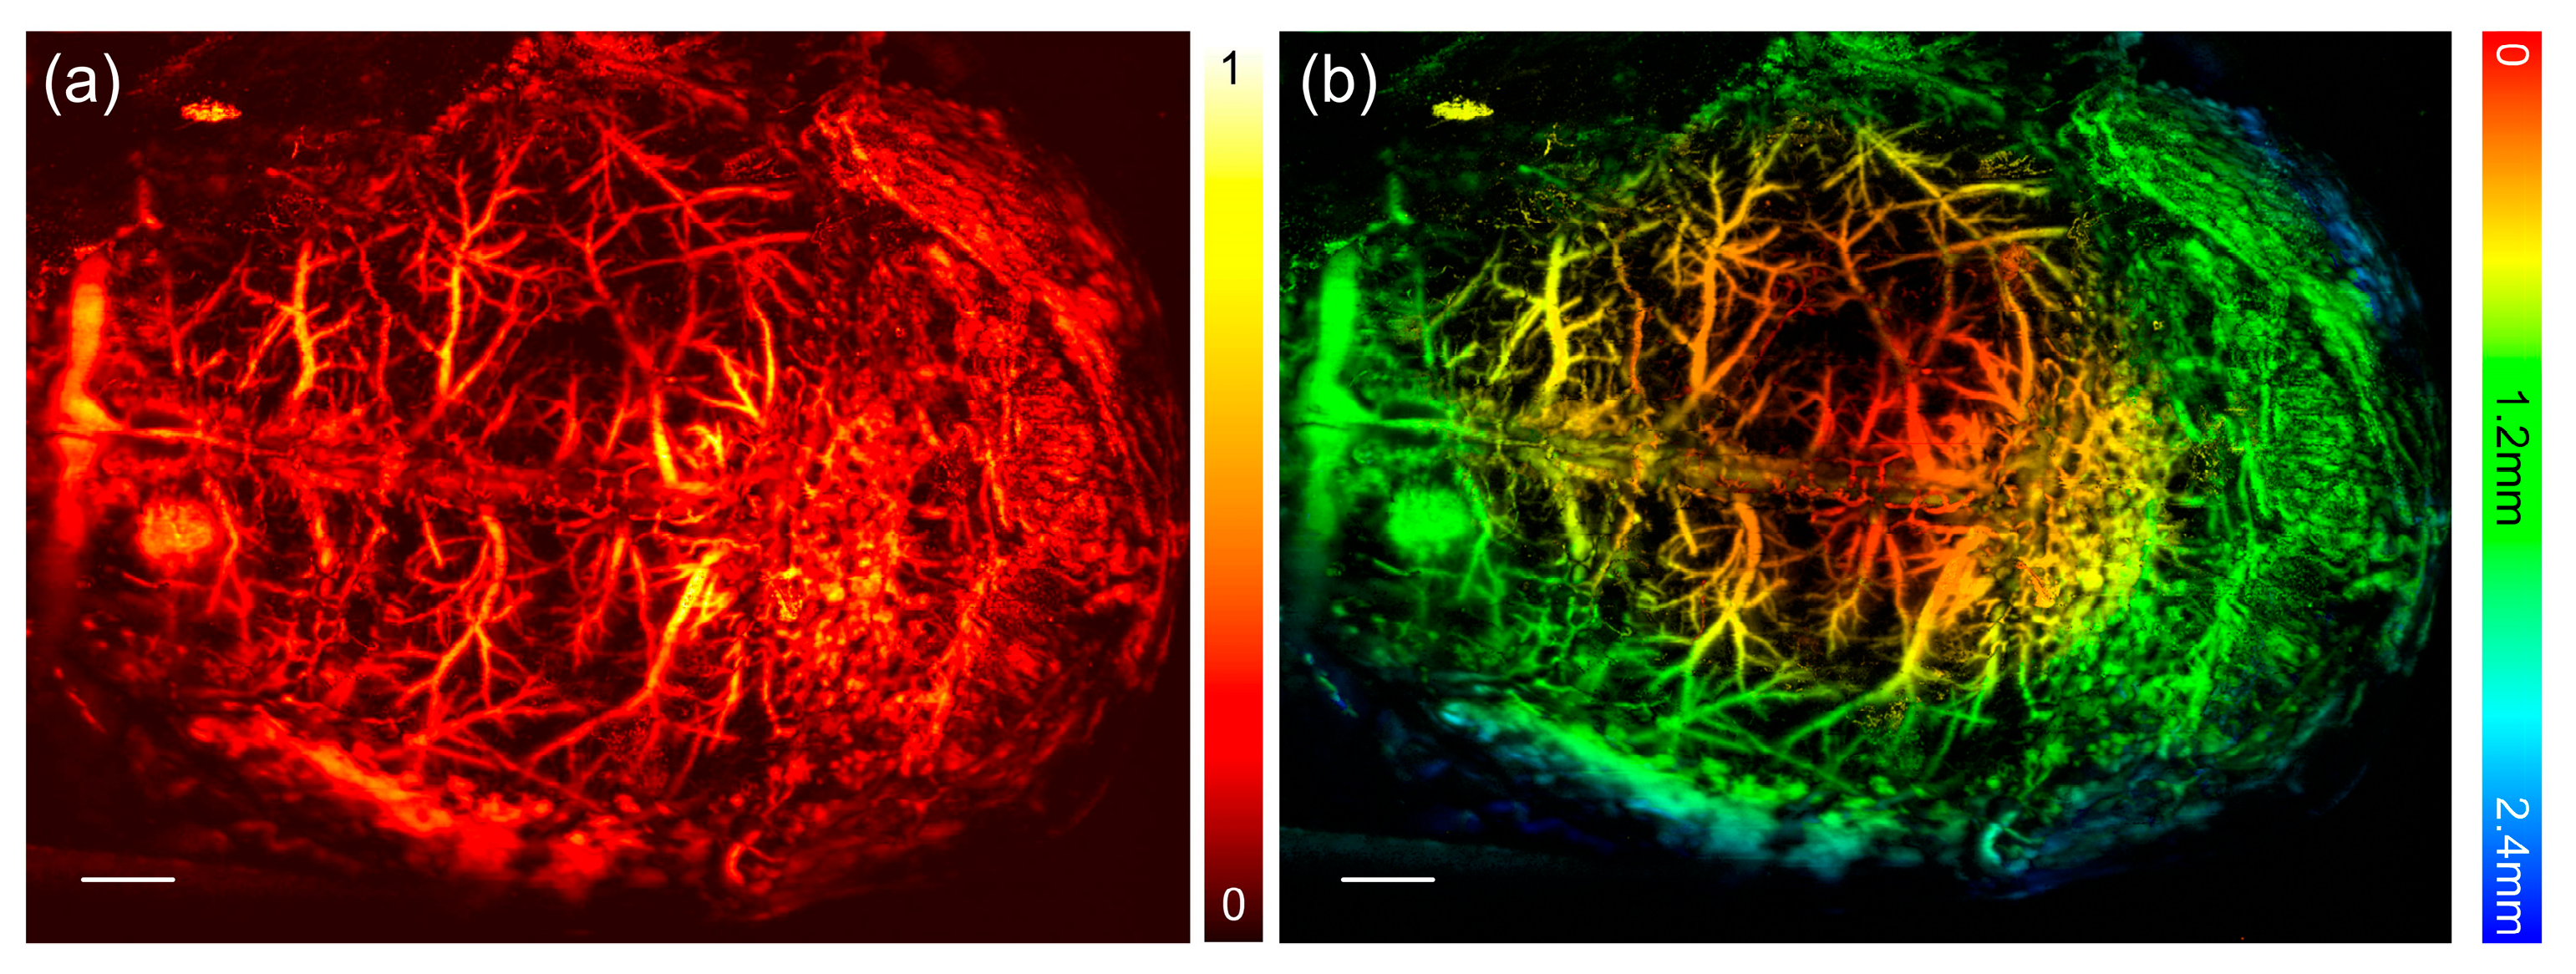
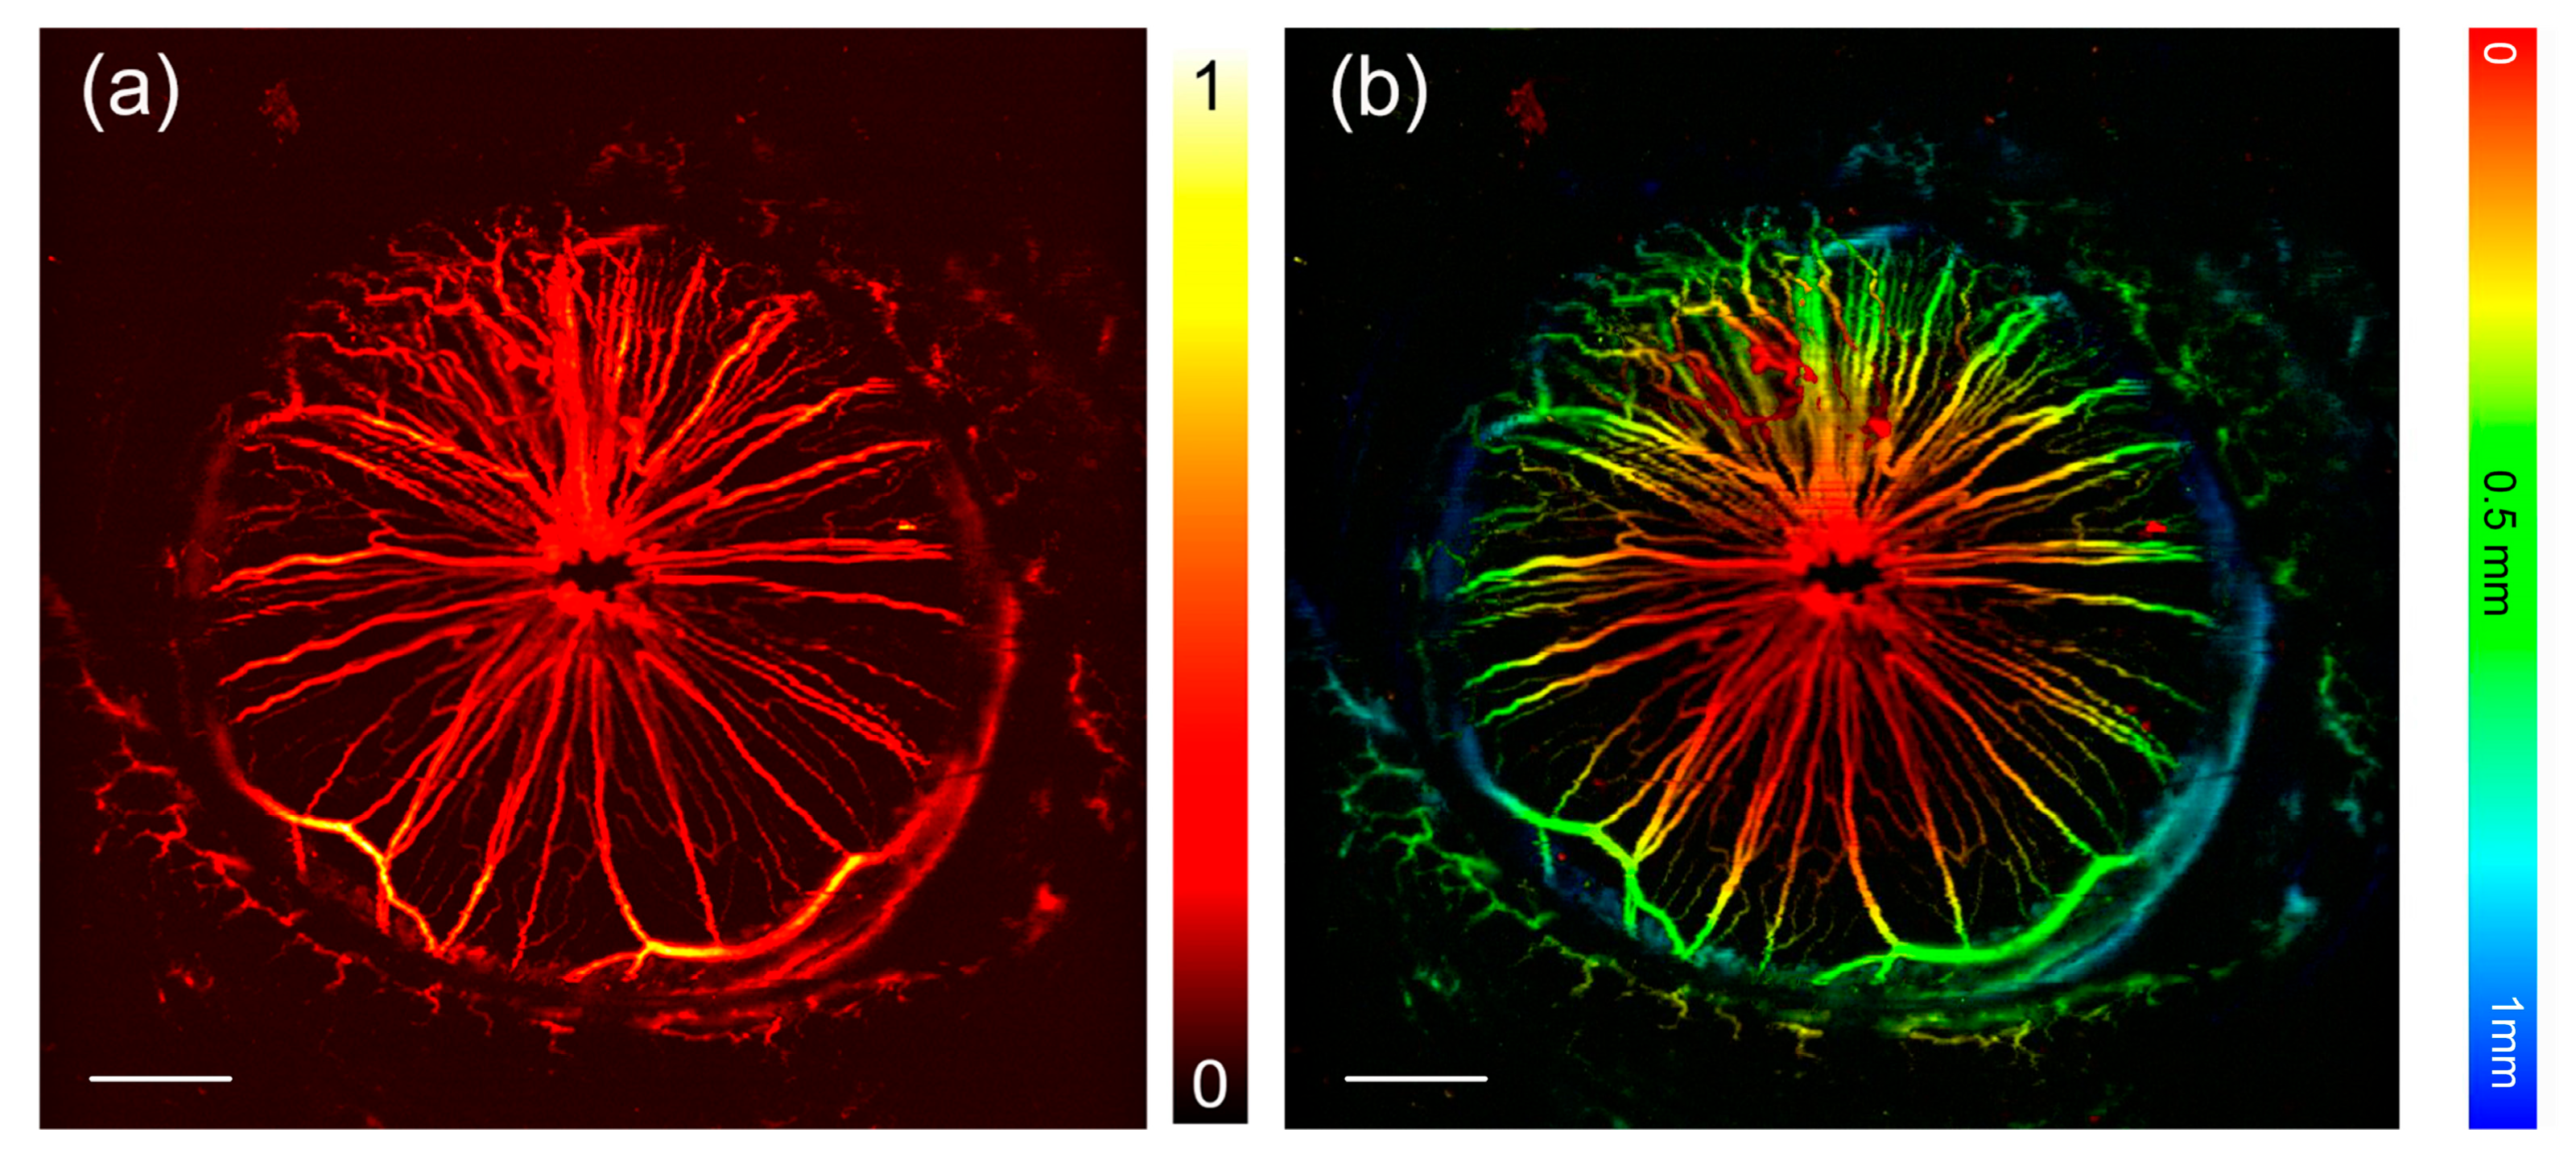
3.3. In Vivo Imaging Experiments

Finally, we applied our OR-PAM system for in vivo imaging of the brain and the iris of live mice to examine its practicability and potential in biomedicine. During the in vivo experiments, the energy of the laser at the sample was around 80 nJ per pulse.
Figure 7 gives the PA image of the brain of a live mouse. The scalp was removed, but the skull was preserved before imaging experiment. The imaging area of 10 × 13 mm was scanned point-by-point with a step size of 10 μm, that is, the scanning brain image consists of 1000 × 1300 pixels. A denser scanning can take full advantage of the resolution. In our study, considering the diameter of microvasculature was approximately 10 μm, we used the step size of 10 μm. The total scanning time was about 16 min for in-vivo 10 × 13 mm area. As shown, the vasculatures are clearly demonstrated in the MAP image. Encoding depth information through extracting the time delay of the PA signal at each position, we also achieved an imaging of the depth information in the brain area. The red and yellow areas represent the superficial layer, and the green and blue areas represent the deeper layer. Through the PA imaging, the superficial layer and a little deeper layer with high contrast and good resolution are shown in the image.
Figure 8 gives PA image of the iris of a live mouse. The region of interest was 4 × 4 mm and is scanned with a step size of 5 μm. As shown in Figure 8a, microvasculatures of the iris and the surrounding tissues can be clearly observed. Also, extracting the time delay of the PA signal at each position, an image encoded the depth information is given in Figure 8b. In the figure, the main body of the radial vascular network and branch microvasculatures distributed in the outer ring of the iris is clearly shown.
Generally, the system with the proposed optical-acoustic combiner achieved high-quality images of the brain and the iris of live mice. Benefitting from high detective sensitivity and low optical disorders, the obtained images had good contrast and resolution. Both the MAP images and depth-encoded images revealed abundant details. Microvasculatures could be clearly observed. These in vivo experiments demonstrated the practicability of the OR-PAM system with the proposed optical-acoustic combiner.
In comparison to the other methods, the proposed method has the following advantages. First, since the proposed system has a large acoustic NA, it has a smaller acoustic focal spot. In other words, the system is able to detect weaker signals at the acoustic focus. Second, since the acoustic propagation path in combiner is only through water and there is no other solid structure attenuating the propagation, the combiner has low insertion loss. The above two advantages promise good detection sensitivity. Third, the proposed combiner doesn’t rely on customized ultrasound transducer. Commonly used commercial transducers are suitable. Additionally, benefiting from the good sensitivity, the system might have potential to achieve better imaging depth.
The scanning time of the system could be reduced by increasing the motion speed and laser repetition frequency, or enlarging the scanning step. Moreover, the size of the combiner is limited by the volume of the selected transducer. To achieve a larger acoustic NA and a long working distance, the element size of the transducer has a minimum size limit, and this can be improved. Potential applications of the OR-PAM could be clinical diagnostic imaging of eye, including choroid and retina, and the microscopic imaging of superficial and thin tissues like microvasculatures at the extremity.

4. Conclusions

The performance of an OR-PAM system is usually closely related to its design of the optical-acoustic combiner. In this study, we proposed an optical-acoustic combiner based on an OPM and a flat acoustic reflector to achieve a high-performance OR-PAM system. We examined the acoustic focusing ability of the proposed optical-acoustic combiner by using quantitative numerical simulations and the experimental measurements. The results showed that the proposed combiner has a larger acoustic NA. Moreover, the entire ultrasonic propagation path is only through water. These characteristics of this combiner promise good detection sensitivity. Then, it was demonstrated that this imaging system has a spatial resolution of about 2.6 μm by imaging carbon fibers. Finally, in vivo imaging of the mouse brain and the iris demonstrated the practicability and potentials in biomedicine. In summary, the proposed optical-acoustic combiner based on the OPM could be useful for improving the performance of OR-PAM. Compared to other methods of improving the acoustic sensitivity, the proposed combiner could realize a large acoustic NA, and avoid impedance mismatch due to the propagation path of pure reflection mode in water. In future, more efforts will be made to realize a faster imaging speed.

Author Contributions

X.Z. performed photoacoustic measurements and data analysis. Y.L. performed the theoretical calculations. J.Y. participated in the discussion of experimental results. C.T. conceived the project and designed the research. Z.H., S.Y., and Q.L. participated in the animal experiments. X.L. discussed research results. All authors contributed to critical reading of the manuscript and discussion. All authors have read and agreed to the published version of the manuscript.

Funding

This work was supported by the National Natural Science Foundation of China (12027808, 11874217, 11834008, 81900875 and 81770973); Natural Science Foundation of Jiangsu Province (BK 20181077).

Data Availability Statement

The data presented in this study are available on request from the corresponding author.

Acknowledgments

Not applicable.

Conflicts of Interest

The authors declare no conflict of interest.

Ethical Statements

The study was conducted in accordance with the Declaration of Helsinki, and the protocol was approved by the Ethics Committee of Nanjing Medical University.

References

  1. Hai, P.; Imai, T.; Xu, S.; Zhang, R.; Aft, R.L.; Zou, J.; Wang, L.V. High-Throughput, Label-Free, Single-Cell Photoacoustic Microscopy of Intratumoral Metabolic Heterogeneity. Nat. Biomed. Eng. 2019, 3, 381–391. [Google Scholar] [CrossRef] [PubMed]
  2. Wong, T.T.W.; Zhang, R.; Zhang, C.; Hsu, H.-C.; Maslov, K.I.; Wang, L.; Shi, J.; Chen, R.; Shung, K.K.; Zhou, Q.; et al. Label-Free Automated Three-Dimensional Imaging of Whole Organs by Microtomy-Assisted Photoacoustic Microscopy. Nat. Commun. 2017, 8, 1386. [Google Scholar] [CrossRef] [PubMed]
  3. Wong, T.T.W.; Zhang, R.; Hai, P.; Zhang, C.; Pleitez, M.A.; Aft, R.L.; Novack, D.V.; Wang, L.V. Fast Label-Free Multilayered Histology-like Imaging of Human Breast Cancer by Photoacoustic Microscopy. Sci. Adv. 2017, 3, e1602168. [Google Scholar] [CrossRef] [PubMed] [Green Version]
  4. Yang, J.; Gong, L.; Xu, X.; Hai, P.; Shen, Y.; Suzuki, Y.; Wang, L.V. Motionless Volumetric Photoacoustic Microscopy with Spatially Invariant Resolution. Nat. Commun. 2017, 8, 780. [Google Scholar] [CrossRef]
  5. Guo, B.; Chen, J.; Chen, N.; Middha, E.; Xu, S.; Pan, Y.; Wu, M.; Li, K.; Liu, C.; Liu, B. High-Resolution 3D NIR-II Photoacoustic Imaging of Cerebral and Tumor Vasculatures Using Conjugated Polymer Nanoparticles as Contrast Agent. Adv. Mater. 2019, 31, 1808355. [Google Scholar] [CrossRef]
  6. Guggenheim, J.A.; Li, J.; Allen, T.J.; Colchester, R.J.; Noimark, S.; Ogunlade, O.; Parkin, I.P.; Papakonstantinou, I.; Desjardins, A.E.; Zhang, E.Z.; et al. Ultrasensitive Plano-Concave Optical Microresonators for Ultrasound Sensing. Nat. Photonics 2017, 11, 714–719. [Google Scholar] [CrossRef]
  7. Yamaleyeva, L.M.; Sun, Y.; Bledsoe, T.; Hoke, A.; Gurley, S.B.; Brosnihan, K.B. Photoacoustic Imaging for in Vivo Quantification of Placental Oxygenation in Mice. FASEB J. 2017, 31, 5520–5529. [Google Scholar] [CrossRef] [Green Version]
  8. Park, E.-Y.; Park, S.; Lee, H.; Kang, M.; Kim, C.; Kim, J. Simultaneous Dual-Modal Multispectral Photoacoustic and Ultrasound Macroscopy for Three-Dimensional Whole-Body Imaging of Small Animals. Photonics 2021, 8, 13. [Google Scholar] [CrossRef]
  9. Jeon, S.; Kim, J.; Lee, D.; Baik, J.W.; Kim, C. Review on Practical Photoacoustic Microscopy. Photoacoustics 2019, 15, 100141. [Google Scholar] [CrossRef]
  10. Yao, J.; Wang, L.V. Photoacoustic Microscopy: Photoacoustic Microscopy. Laser Photonics Rev. 2013, 7, 758–778. [Google Scholar] [CrossRef]
  11. Strohm, E.M.; Moore, M.J.; Kolios, M.C. Single Cell Photoacoustic Microscopy: A Review. IEEE J. Sel. Top. Quantum Electron. 2016, 22, 137–151. [Google Scholar] [CrossRef]
  12. Sun, Y.; Jiang, H.; O’Neill, B.E. Photoacoustic Imaging: An Emerging Optical Modality in Diagnostic and Theranostic Medicine. J. Biosens. Bioelectron. 2011, 2, 1000108. [Google Scholar] [CrossRef]
  13. Wang, L.V.; Yao, J. A Practical Guide to Photoacoustic Tomography in the Life Sciences. Nat. Methods 2016, 13, 627–638. [Google Scholar] [CrossRef]
  14. Wang, L.V.; Hu, S. Photoacoustic Tomography: In Vivo Imaging from Organelles to Organs. Science 2012, 335, 1458–1462. [Google Scholar] [CrossRef] [Green Version]
  15. Liu, W.; Shcherbakova, D.M.; Kurupassery, N.; Li, Y.; Zhou, Q.; Verkhusha, V.V.; Yao, J. Quad-Mode Functional and Molecular Photoacoustic Microscopy. Sci. Rep. 2018, 8, 11123. [Google Scholar] [CrossRef]
  16. Yao, L.; Xi, L.; Jiang, H. Photoacoustic Computed Microscopy. Sci. Rep. 2015, 4, 4960. [Google Scholar] [CrossRef] [Green Version]
  17. Huang, D.; Huang, Y.; Qiu, Q.; Wang, K.; Li, Z.; Yao, Y.; Liu, G.; Zhao, Q.; Chen, X. Three-Dimensional Label-Free Imaging of Mammalian Yolk Sac Vascular Remodeling with Optical Resolution Photoacoustic Microscopy. Photoacoustics 2020, 17, 100152. [Google Scholar] [CrossRef]
  18. Wu, S.; Tao, C.; Zhang, X.; Lu, F.; Liu, X. Simultaneous Scattering-Absorption Dual-Modal Cell Imaging in a Single Shot by a Transmission-Mode Photoacoustic Microscope. Opt. Lett. 2020, 45, 5832. [Google Scholar] [CrossRef]
  19. Cai, D.; Wong, T.T.W.; Zhu, L.; Shi, J.; Chen, S.-L.; Wang, L.V. Dual-View Photoacoustic Microscopy for Quantitative Cell Nuclear Imaging. Opt. Lett. 2018, 43, 4875. [Google Scholar] [CrossRef] [Green Version]
  20. Yao, D.-K.; Maslov, K.; Shung, K.K.; Zhou, Q.; Wang, L.V. In Vivo Label-Free Photoacoustic Microscopy of Cell Nuclei by Excitation of DNA and RNA. Opt. Lett. 2010, 35, 4139. [Google Scholar] [CrossRef] [Green Version]
  21. Rao, B.; Leng, X.; Zeng, Y.; Lin, Y.; Chen, R.; Zhou, Q.; Hagemann, A.R.; Kuroki, L.M.; McCourt, C.K.; Mutch, D.G.; et al. Optical Resolution Photoacoustic Microscopy of Ovary and Fallopian Tube. Sci. Rep. 2019, 9, 14306. [Google Scholar] [CrossRef] [PubMed] [Green Version]
  22. Park, K.; Kim, J.Y.; Lee, C.; Jeon, S.; Lim, G.; Kim, C. Handheld Photoacoustic Microscopy Probe. Sci. Rep. 2017, 7, 13359. [Google Scholar] [CrossRef] [PubMed]
  23. Zhang, C.; Maslov, K.; Hu, S.; Chen, R.; Zhou, Q.; Shung, K.K.; Wang, L.V. Reflection-Mode Submicron-Resolution in Vivo Photoacoustic Microscopy. J. Biomed. Opt. 2012, 17, 020501. [Google Scholar] [CrossRef] [PubMed]
  24. Kang, H.; Lee, S.-W.; Park, S.-M.; Cho, S.-W.; Lee, J.Y.; Kim, C.-S.; Lee, T.G. Real-Time Functional Optical-Resolution Photoacoustic Microscopy Using High-Speed Alternating Illumination at 532 and 1064 Nm. J. Biophotonics 2018, 11, e201700210. [Google Scholar] [CrossRef]
  25. Tian, C.; Zhang, W.; Mordovanakis, A.; Wang, X.; Paulus, Y.M. Noninvasive Chorioretinal Imaging in Living Rabbits Using Integrated Photoacoustic Microscopy and Optical Coherence Tomography. Opt. Express 2017, 25, 15947–15955. [Google Scholar] [CrossRef]
  26. Qi, W.; Jin, T.; Rong, J.; Jiang, H.; Xi, L. Inverted Multiscale Optical Resolution Photoacoustic Microscopy. J. Biophotonics 2017, 10, 1580–1585. [Google Scholar] [CrossRef] [Green Version]
  27. Chen, Q.; Xie, H.; Xi, L. Wearable Optical Resolution Photoacoustic Microscopy. J. Biophotonics 2019, 12, e201900066. [Google Scholar] [CrossRef]
  28. Zhang, X.; Ding, Q.; Qian, X.; Tao, C.; Liu, X. Reflection-Mode Optical-Resolution Photoacoustic Microscopy with High Detection Sensitivity by Using a Perforated Acoustic Mirror. Appl. Phys. Lett. 2018, 113, 183706. [Google Scholar] [CrossRef]
  29. Qiu, T.; Yang, J.; Pan, T.; Pan, T.; Peng, C.; Jiang, H.; Luo, Y. Assessment of Liver Function Reserve by Photoacoustic Tomography: A Feasibility Study. Biomed. Opt. Express 2020, 11, 3985–3995. [Google Scholar] [CrossRef]
  30. Dai, X.; Yang, H.; Jiang, H. In Vivo Photoacoustic Imaging of Vasculature with a Low-Cost Miniature Light Emitting Diode Excitation. Opt. Lett. 2017, 42, 1456. [Google Scholar] [CrossRef]
  31. Maslov, K.; Zhang, H.F.; Hu, S.; Wang, L.V. Optical-Resolution Photoacoustic Microscopy for in Vivo Imaging of Single Capillaries. Opt. Lett. 2008, 33, 929. [Google Scholar] [CrossRef]
  32. Hu, S.; Maslov, K.; Wang, L.V. Second-Generation Optical-Resolution Photoacoustic Microscopy with Improved Sensitivity and Speed. Opt. Lett. 2011, 36, 1134. [Google Scholar] [CrossRef] [Green Version]
  33. Park, S.; Kang, S.; Chang, J.H. Optically Transparent Focused Transducers for Combined Photoacoustic and Ultrasound Microscopy. J. Med. Biol. Eng. 2020, 40, 707–718. [Google Scholar] [CrossRef]
  34. Fang, C.; Hu, H.; Zou, J. A Focused Optically Transparent PVDF Transducer for Photoacoustic Microscopy. IEEE Sens. J. 2020, 20, 2313–2319. [Google Scholar] [CrossRef]
Figure 1. Schematic diagram of optical-resolution photoacoustic microscopy (OR-PAM) setup. FC: fiber coupling, SMF: single mode fiber, CL: collimating-mirror, BS: beam splitter, PD: photodiode, DAQ: data acquisition. Dotted box gives the details of the optical–acoustic combiner. OL: objective lens, OPM: off-axis parabolic acoustic mirror, UT: ultrasonic transducer, FR: flat acoustic reflector.
Photonics 08 00127 g001
Figure 2. Profile map of the OPM, CA: central axis, D: diameter; OAD: off-axis distance; PFL: parent focal length; RFL: reflected focal length.
Photonics 08 00127 g002
Figure 3. Two kinds of acoustic focusing schemes. (a) A spherically-focused transducer combined with a flat acoustic reflector. (b) A flat transducer combined with the OPM.
Photonics 08 00127 g003
Figure 4. Simulation of acoustic focusing performance of the combiner. The amplitude of the acoustic field is normalized to the amplitude at the transducer surface. (a) Acoustic field near the focus of a spherically-focused transducer [the scheme in Figure 3a]. (b) Acoustic field near the focus of the proposed combiner [the scheme in Figure 3b]. (c) Comparison of the acoustic field along the axis, where L is 30 mm. (d) Normalized amplitude at the focus with various distance L, and L is the distance between the transducer and the mirror center.
Photonics 08 00127 g004
Figure 5. Measurement of acoustic field experiment of the combiner. (a) Five images around the focus. (b) Normalized acoustic pressure along the acoustic axis, where blue empty dots represent experiment results and the red solid line is the simulative data. (c) The image obtained on the focal plane. Two black dashed lines marked profiles at the focus along x direction and y direction. The white scale bar in the figure represents 200 μm. (d,e) Profiles along x direction and y direction in (c).
Photonics 08 00127 g005
Figure 6. Imaging of the carbon fiber. (a) MAP image of the carbon fibers. The green dashed rectangle is the sampling region. (b) Profile along the x-direction of the carbon fiber, indicated by the white arrow in (a). MAP: maximum amplitude projection.
Photonics 08 00127 g006
Figure 7. PA imaging of the brain vasculatures of a mouse through an intact skull. (a) The normalized MAP image of the brain vasculature. (b) The depth-encoded image of the brain vasculatures. The scale bar in the figure represents 1 mm. PA: photoacoustic.
Photonics 08 00127 g007
Figure 8. PA imaging of the iris of a live mouse. (a) The normalized MAP image of the iris. The eyelid around is also imaged. (b) The depth-encoded image of the iris and surrounding tissues. The scale bar (the white solid line) in the figure represents 500 μm.
Photonics 08 00127 g008
Table 1. The system specifications of the proposed OPM.
Off-Axis Distance [mm]Diameter of OPM [mm]RFL of OPM [mm]PFL of OPM [mm]
616148.5
Publisher’s Note: MDPI stays neutral with regard to jurisdictional claims in published maps and institutional affiliations.

