1. Introduction
Photonic crystal fibers (PCFs) have recently gained prominence in research and have been implemented in sensing applications due to the special characteristics of these photonic fibers [
1]. Numerous sensing application such as biosensing, gas sensing, chemical sensing and temperature sensing have already been proposed in [
1,
2,
3,
4,
5]. Possible applications in biosensing and chemical sensing have provoked its use in medical science and chemical industry, which have resulted in a large number of researchers taking a keen interest to increase sensitivity of the PCFs for different liquids, chemicals and gases.
General structure of a PCF consists of a core at its center which are enclosed by a cladding. Material for the PCF is often made from pure silica, whilst its cladding consists mostly of air holes that runs along the major fiber axis to provide a low refractive index region beyond the core. Total internal reflection of the light guidance techniques is utilized in PCFs, and this tends to result in improved efficiency [
4]. Structural design of a PCF is very flexible. Manipulation of parameters and turning of propagation properties of the fiber can be done, and may involve changing its shape, size and position of air holes, diameter, refractive index, type of lattice and lattice pitch [
6]. Furthermore, through application of different geometrical shape structure of the air holes such as hexagonal, octagonal, decagonal and elliptical arrangement, may result in a different guiding property and potentially produce a better outcome. Varying properties of light source by altering frequency, intensity, wavelength, phase, polarization state of light and so on, may also improve the characteristics of the PCF [
7]. Moreover, the existence of air holes in PCFs may provide light propagation on air and allows the possibility of infiltrating the holes with liquid or gas; which may lead to a controlled interaction between light and sample, in order to create new sensing application outside the range of other standard optical fibers [
5]. With respect to the design, PCFs can be designed for practical sensing application in environmental, biomedical and industry sectors.
Multiple studies have proposed different PCF designs and configurations for different sensing applications and assessed their different waveguide parameters. The first PCF structure for liquid sensing was presented in 2006 by Cordeiro et al. [
8], which implement an open core that may be selectively filled with liquid whilst keeping the cladding holes unfilled. It was an experimental research to test the production of PCF for selective filling and sensing applications. Consequently, Ademgil and Haxha [
9] introduce a hexagonal PCF with 3 cladding layers and 7 air holes in the core for liquid detection of ethanol, water and benzene, and have assessed its sensitivity, birefringence and confinement loss. However, relatively low relative sensitivity values of 24%, 22% and 25% are obtained for ethanol, water and benzene at 1.3 µm wavelength, respectively. Furthermore, other optical parameters such as dispersion and nonlinearity, which are essential properties of PCF design have not been analyzed. A group of researchers [
10] proposed liquid sensing PCF, with sensitivities of 49.17% for ethanol, 48.85% for water and 49.29% for benzene at wavelength of 1.33 μm. Apart from relative sensitivity, confinement loss and birefringence have also been analyzed. The design is composed of a circular lattice, 3 layers cladding hole and 16 infiltrated holes acting as its core. This indicates that the structure is complex, which would bring upon difficulty in the fabrication process of the fiber. Another liquid-based PCF sensor has been introduced by Ademgil and Haxha [
11], with sensitivity values of 8%, 5% and 9% for ethanol, water and benzene, respectively. The PCF is intended to operate at operating wavelength of 1.3 μm and is composed of hexagonal shaped cladding and core; with 3 rings cladding holes and 3 core holes. Confinement loss and birefringence have also been analyzed. Despite having a non-complex design, the PCF produces low sensitivities for each liquid analyte. Ahmed and Morshed [
12] propose a PCF structure that consists of five cladding rings with a hexagonal layout and a centralized nine core holes for the purpose of liquid sensing. The design focuses on ethanol, water and benzene as test analytes. However, despite high relative sensitivities of 46.87%, 45.05%, and 47.35% for ethanol, water and benzene, respectively, only relative sensitivities and confinement loss properties of the PCFs were assessed; insufficient to construct a good judgment on the PCF functionality for sensing application. A five rings cladding hexagonal porous PCF has been proposed by Sen et al. [
13], and sensitivity and confinement loss for three liquid analytes: ethanol, water and benzene have been analysed. Relative sensitivity values of 57.18%, 57.0% and 57.27% are obtained for ethanol, water and benzene at 1.33 μm, respectively. However, it is noted that the porous PCF designs is relatively complex, which is a hurdle in the fabrication process, as well as insufficient waveguide properties have been evaluated to account for their reasonable sensitivity of analyte detection. Then, Ahmed et al. [
14] report a sensitivity of 56.75%. 52.07% and 58.86% for ethanol, water and benzene respectively, with five rings cladding hole in an octagonal structure and nine core holes in square configuration. The design demonstrates a fair relative sensitivity due to the elaborative core configuration, but fabrication for actual sensing application has been shown to be elaborate and impractical. Islam et al. [
15] propose a liquid analyte sensor for ethanol, water and benzene; with a proposed structure of three cladding layers of air holes and seven core holes. Nonlinearity and sensitivity of the PCF have been analyzed. Relative sensitivity values of 53.22%, 48.19% and 55.56% for ethanol, water and benzene, respectively, at 1.33 μm operating wavelength have been demonstrated. Besides sensitivity, the PCF structure has only assessed nonlinear coefficient for all the liquid analytes, which is an inadequate quantity of properties to explain the efficacy of the PCF in liquid sensing application. At the very least, it is also important to quantify confinement loss, chromatic dispersion and birefringence. In addition to liquid sensing, reference [
16] structures a hexagonal three rings PCF with 19 infiltrated core holes for ethanol detection with relative sensitivity of 34%, with confinement loss also evaluated. Despite the complex 19 core holes design, the PCF demonstrates a relative low sensitivity and low efficiency.
Generally, all the structures from these studies [
9,
10,
11,
12,
13,
14,
15,
16] have complex structures; with a large number of cladding holes implemented (some of which have more than 10 core air holes) as well as complex arrangement and intricate alignment. Such design would be difficult to fabricate when it comes to manufacturing for practical use. Therefore, a simple PCF structure is needed; which balances important performance characteristics of the PCF with simple fabrications. The proposed design consists of 36 cladding air holes in three rings and three liquid-infiltrated elliptical holes in a horizontal arrangement in the core. The design is demonstrated for liquid sensing device and it has been shown that the design is able to achieve optimal results of low chromatic dispersion, low confinement loss, small effective area and high birefringence, high nonlinearity, high relative sensitivity, and large power fraction. The effect of variations in operating wavelength from 0.6 µm to 1.8 µm has also been studied carefully. Relative sensitivity values for water, ethanol and benzene are 62.60%, 65.34% and 74.50%, respectively, and nonlinear coefficient values have also been assessed, at 1.3 µm wavelength.
2. Design
A proposed liquid sensing hexagonal photonic crystal fiber (PCF) has been designed, with transverse cross-sectional view presented in
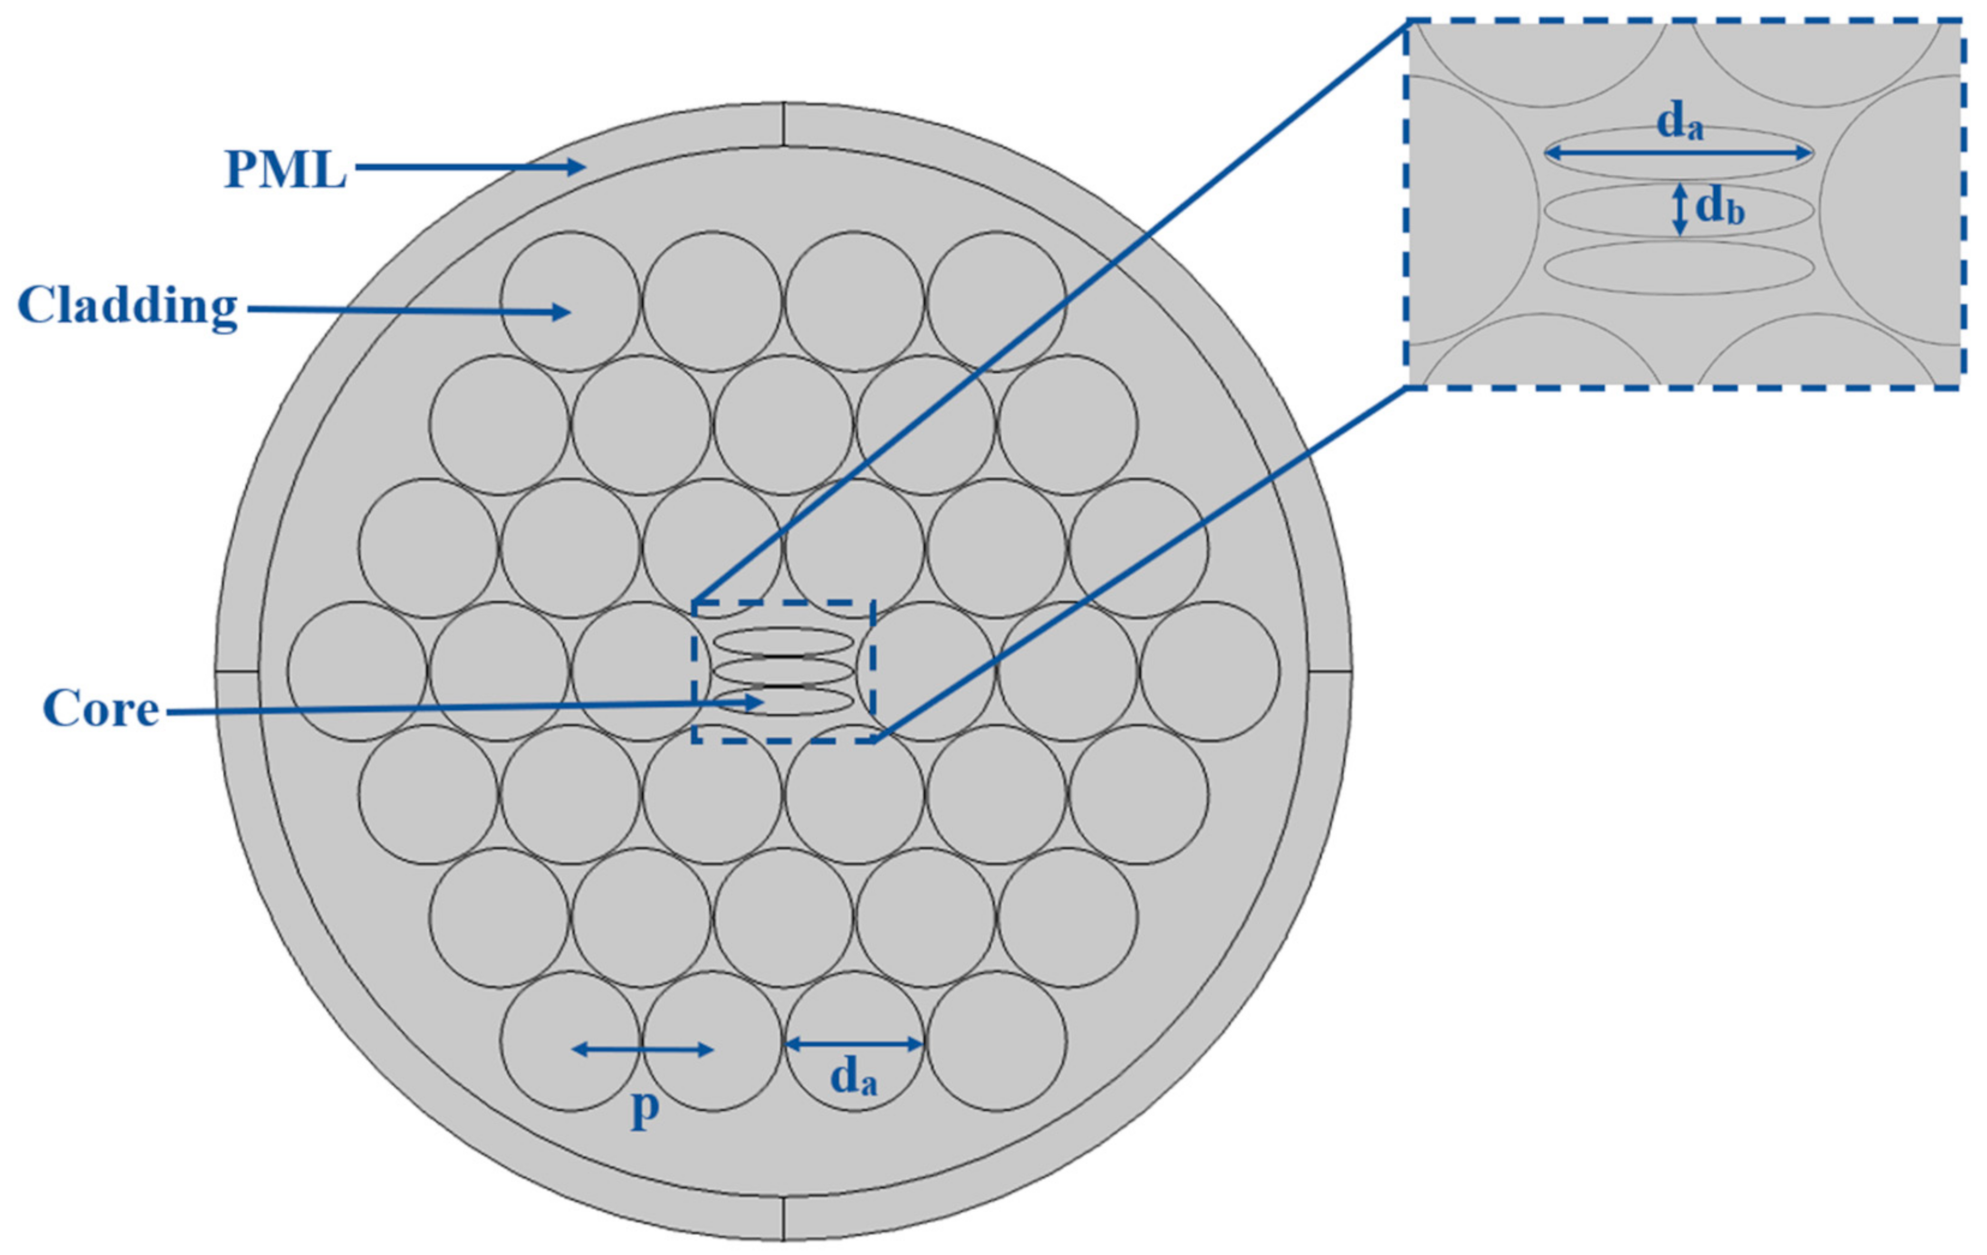
Figure 1, which consists of three layers: liquid-infiltrated elliptical core, air hole cladding and the Perfectly Matched Layer (PML). The core is the central portion that carries light within the fiber, whilst the cladding is the member that surrounds the core which serves to confine light within the core region. The PML is the outer layer which acts as a prevention for light reflecting back into the cladding by the means of absorption of the leaked wavelength. The main factor in determining the design of the proposed PCF is the ease of manufacture, and it is mostly based on the number of rings in the cladding and the core structure of the design. Generally, the more the cladding rings imposed on the fiber, the more difficult it is to fabricate. Moreover, the more complex the design of the core, the more difficult it is to manufacture the fiber.
The core consists of three (3) elliptical holes of similar diameter organized in a horizontal arrangement, positioned one below the other; with the major and minor axis of the elliptical core holes denoted as da and db, respectively. This core structure is designed to break the geometrical symmetry of the fiber, and hence, introduces high birefringence. For the cladding, it consists of three circular cladding rings that are closely arranged in a hexagonal manner with a total of 36 equal-sized air holes. The diameter of each circular air hole is the same as the major axis of the elliptical hole i.e., both are da. Distance between centers of neighboring cladding air holes is its pitch, given by p. PML is imposed outside the cladding region to perfectly anti-reflect straying waveguide onto the fiber. This structural shape of the proposed PCF is derived from the desire to design a fiber that would be easy to manufacture. As such, circular and elliptical holes are chosen as these are deemed to be relatively easy to fabricate. Pitch size and diameter of these holes are varied prior to finalizing the design, in order to select optimal dimensions.
The hexagonal PCF sensor is structured with cladding air holes having a uniform diameter of da = 1.6 µm. A single cladding air hole is removed from the center, in order to insert three (3) ellipses air holes, which act as the core of the model. The air holes are arranged with pitch distance of p = 1.633 µm. Each elliptical hole is constructed with x-semiaxis of da = 1.6 µm and y-semiaxis of db = 0.32 µm. The middle elliptical hole is placed directly at the center and the other similar holes are positioned on top and below the middle hole. These core holes allow different liquid analyte to be injected in them. The total fiber diameter is 13.06 µm, and the PML is optimized to be 10% of the cladding diameter to meet the boundary condition.
3. Methodology
A full vector finite element method (FEM) has been used for the numerical analysis of the proposed PCF model in COMSOL Multiphysics software version 5.5. The process of FEM utilizes the Maxwell wave equation and imposes a boundary condition on the PML in order to analyze the structure. FEM divides the geometry of the model into smaller segments of hundred thousand parts for the purpose of simulation, giving 30,909 mesh vertices, 58,288 triangular elements, 3554 edge elements and 164 vertex elements. The element area ratio is 2.324 × 10⁻⁴, whilst total mesh area is 134 µm2. This simulation method has the ability to solve and offer full analysis of various PCF and complex models. Different equations are employed to simulate the guiding properties of the different real-life parameters in the photonic crystal fiber structure.
Analysis has been performed on a fixed range of wavelengths, from 0.6 to 1.8 µm. The PCF design is proposed for liquid sensing application; allowing various liquid to be infiltrated into the fiber for detection. However, for the purpose of this paper, three (3) different types of liquid analytes: ethanol, water and benzene, have been selected and tested for sensing application using the proposed PCF.
Table 1 below shows the refractive indices of each analyte and silica at the respective wavelengths [
16,
17,
18,
19].
Optical properties of the proposed PCF design are evaluated to distinguish its effectiveness and its potential practical usage. The main properties investigated are birefringence, relative sensitivity, power fraction, confinement loss, chromatic dispersion, effective area and nonlinear coefficient.
The background material is made of silica and supplementary core holes are injected with different liquid. The effective refractive indices
neff can be modeled using the Sellmeier equation [
20]:
where
λ is the operating wavelength and
B(
i = 1,2,3) and
C(
i = 1,2,3) are Sellmeier coefficients of the specific material.
Birefringence
B is the difference between the refractive indices of two orthogonal polarization; x-polarization and y-polarization, and it is defined as [
21,
22]:
where
is the effective refractive index of x-polarization and
is the effective refractive index of y-polarization.
To understand the functionality of the proposed PCF, relative sensitivity is calculated. Relative sensitivity
r can be defined as [
22,
23]:
where
nr is the refractive index of the sensed material,
neff is the modal refractive index and
f is the total power fraction.
Power fraction is the measure of the amount of power flowing through the PCF at a specific fiber region and it reveals information on power distribution in the radial direction. According to the Poynthing’s theorem, power fraction
f can be defined as [
22,
23,
24]:
where
Ex and
Ey are the transverse electric fields of the guided mode, and
Hx and
Hy are the magnetic fields of the guided mode.
Leakage of light from the core to the outer region cladding is known as confinement loss which is caused by the PCF’s structural parameters. Confinement loss
Lc of the mode is found from the imaginary part of the complex effective index and is defined as [
21,
25,
26]:
where
λ is the operating wavelength and
is the imaginary part of effective mode index.
Dispersion
D is the measure of the light guiding capabilities of the fiber, which is defined as [
21,
26]:
where
λ is the operating wavelength,
c is the speed of light in vacuum and
Re[neff] is the real part of effective refractive index.
Effective area
Aeff is the area of the fiber that covers transverse dimension of the fiber, and is defined as [
25,
26,
27]:
where E is the transverse electric fields of the guided mode.
Nonlinearity
γ, termed as nonlinear coefficient, is closely related to the effective area of the fiber. It is the measure of the ability of the fiber to confine high intensity light [
28], and can be defined as [
23,
26]:
where
λ is the operating wavelength, and
n2 is the nonlinear refractive index.
4. Results and Discussion
The proposed PCF has been designed for sensing analytes and the performance of the proposed structure is analyzed by considering different parameters including birefringence, relative sensitivity, chromatic dispersion, confinement loss, effective area, nonlinear coefficient and power fraction for ethanol, water and benzene. The overall simulation and analysis have been done by filling the three analytes; whose refractive index are shown in
Table 1 [
16,
17,
18,
19], in the elliptical holes of the core region for a wide range of wavelength from 0.6 to 1.8 μm.
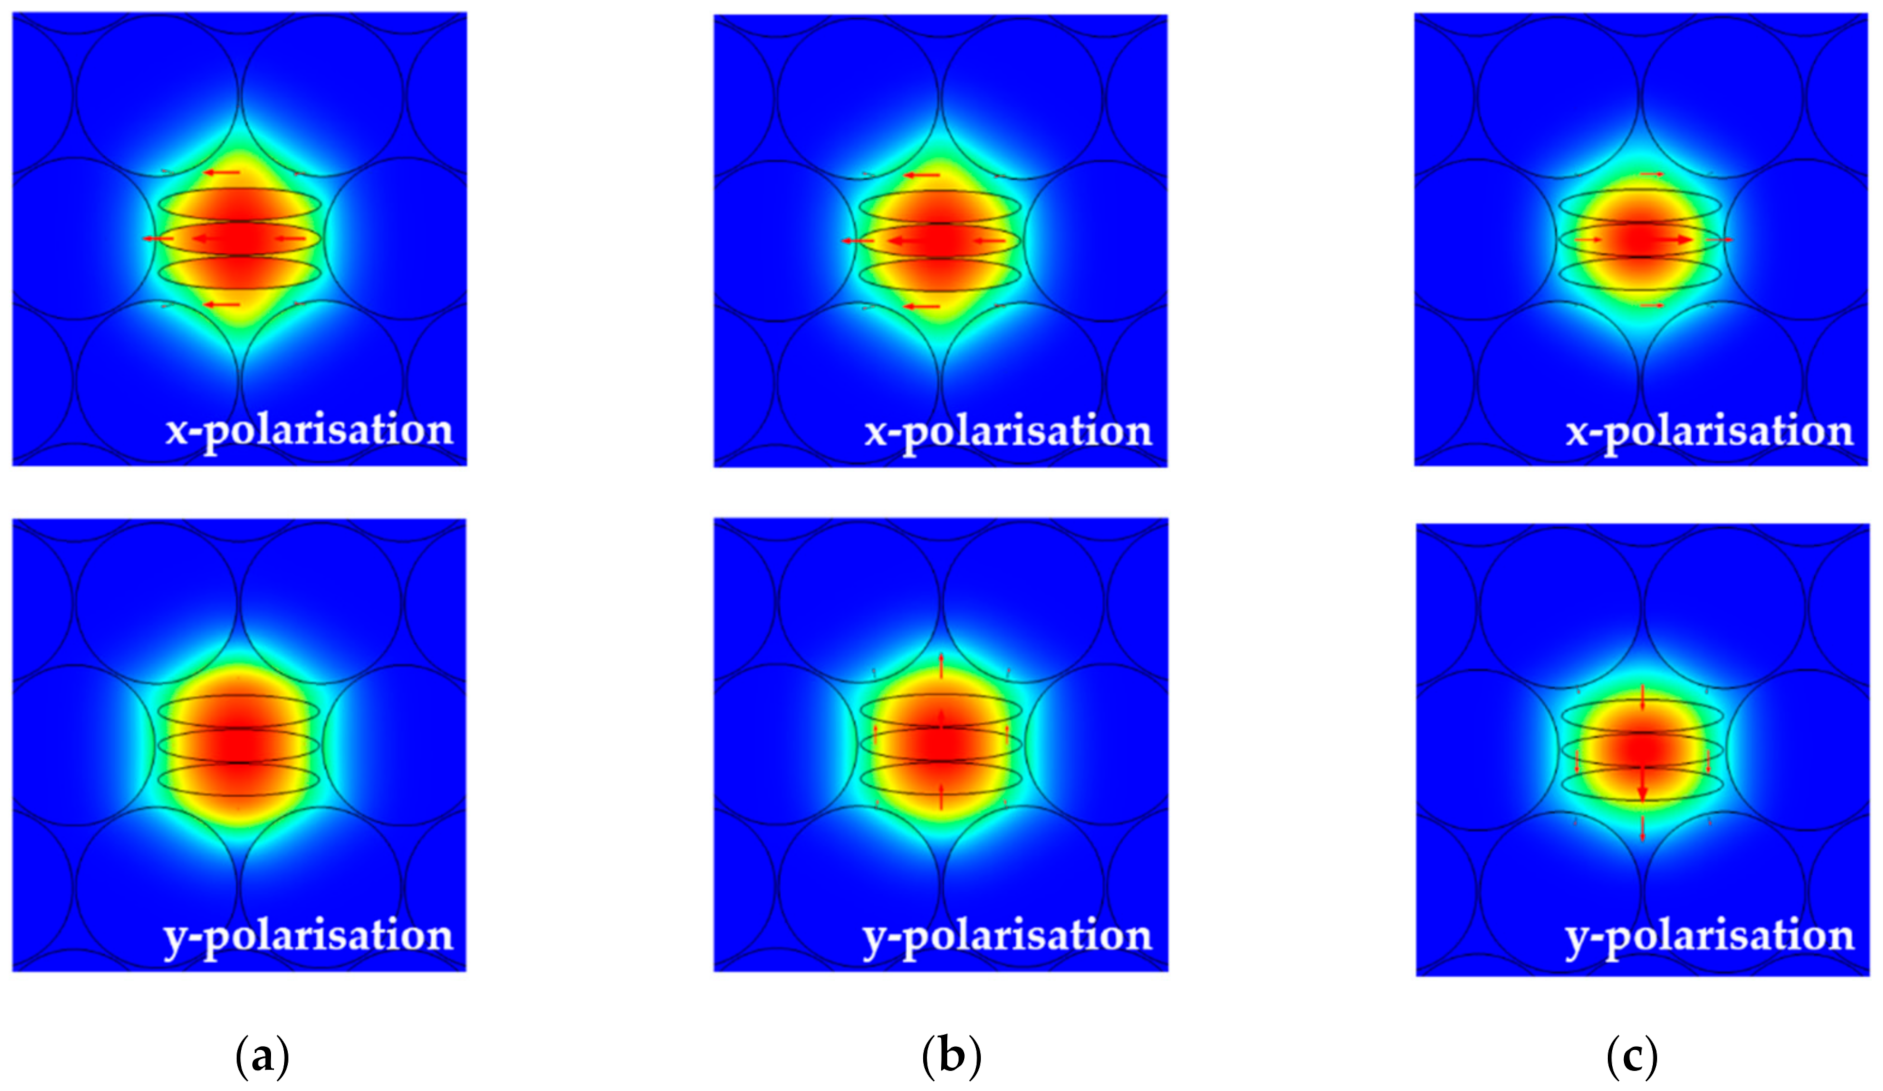
Figure 2 shows the mode profile for the different liquid analytes at 1.3 μm operating wavelength for x- and y-polarization. The figure shows that the interaction of light occurs through the core region where the analyte is present. The figure also shows that the mode field is tightly confined at the core, for the different analytes.
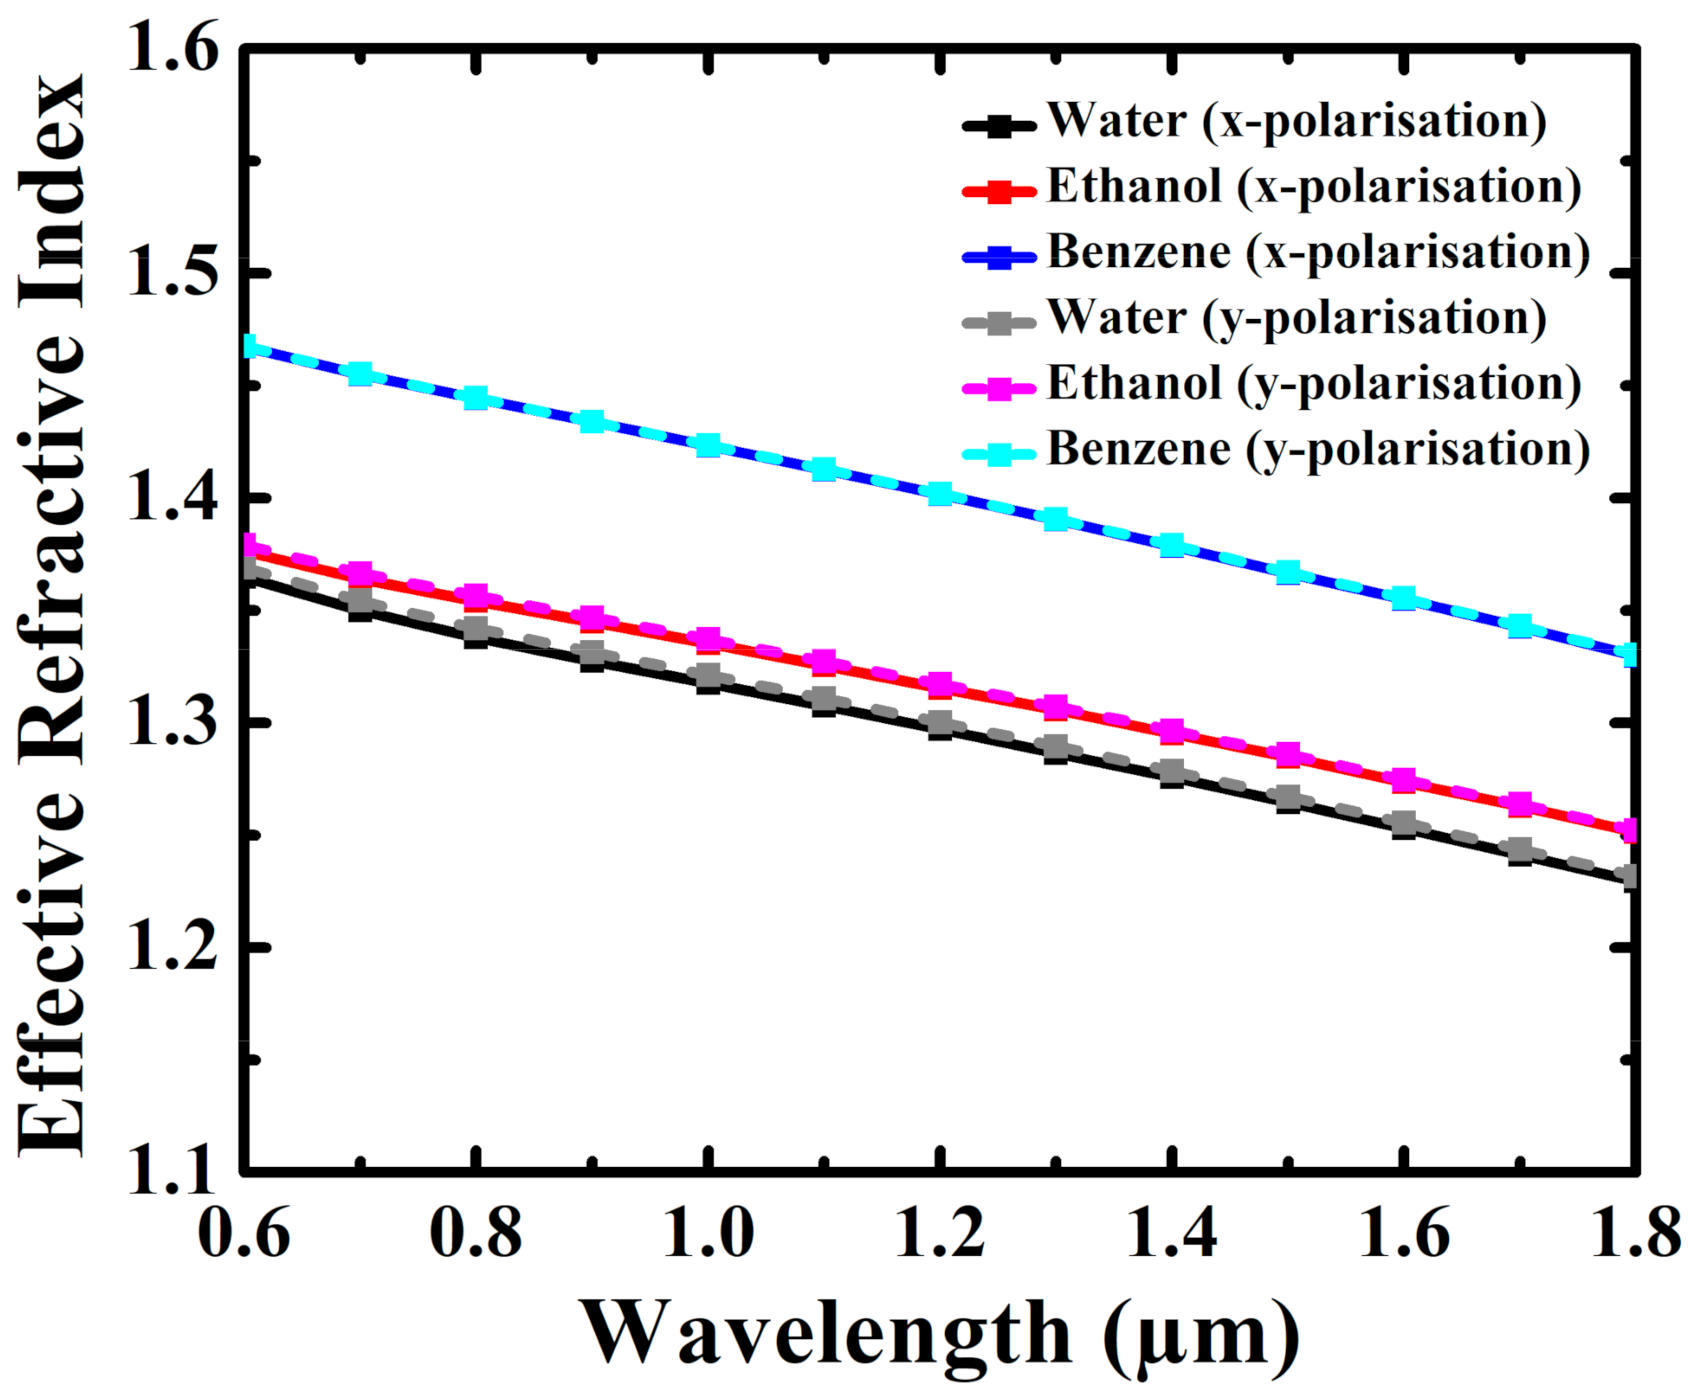
Effective refractive index of different analytes for the PCF structure is illustrated in
Figure 3. It reveals that effective refractive index linearly decreases with respect to increase in wavelength. Lower wavelength corresponds to higher frequency, and electromagnetic signal often prefers to propagate through the higher refractive indexed region. Refractive index of benzene is highest as compared to water and ethanol, and consequently, effective refractive index is higher for benzene than other analytes.
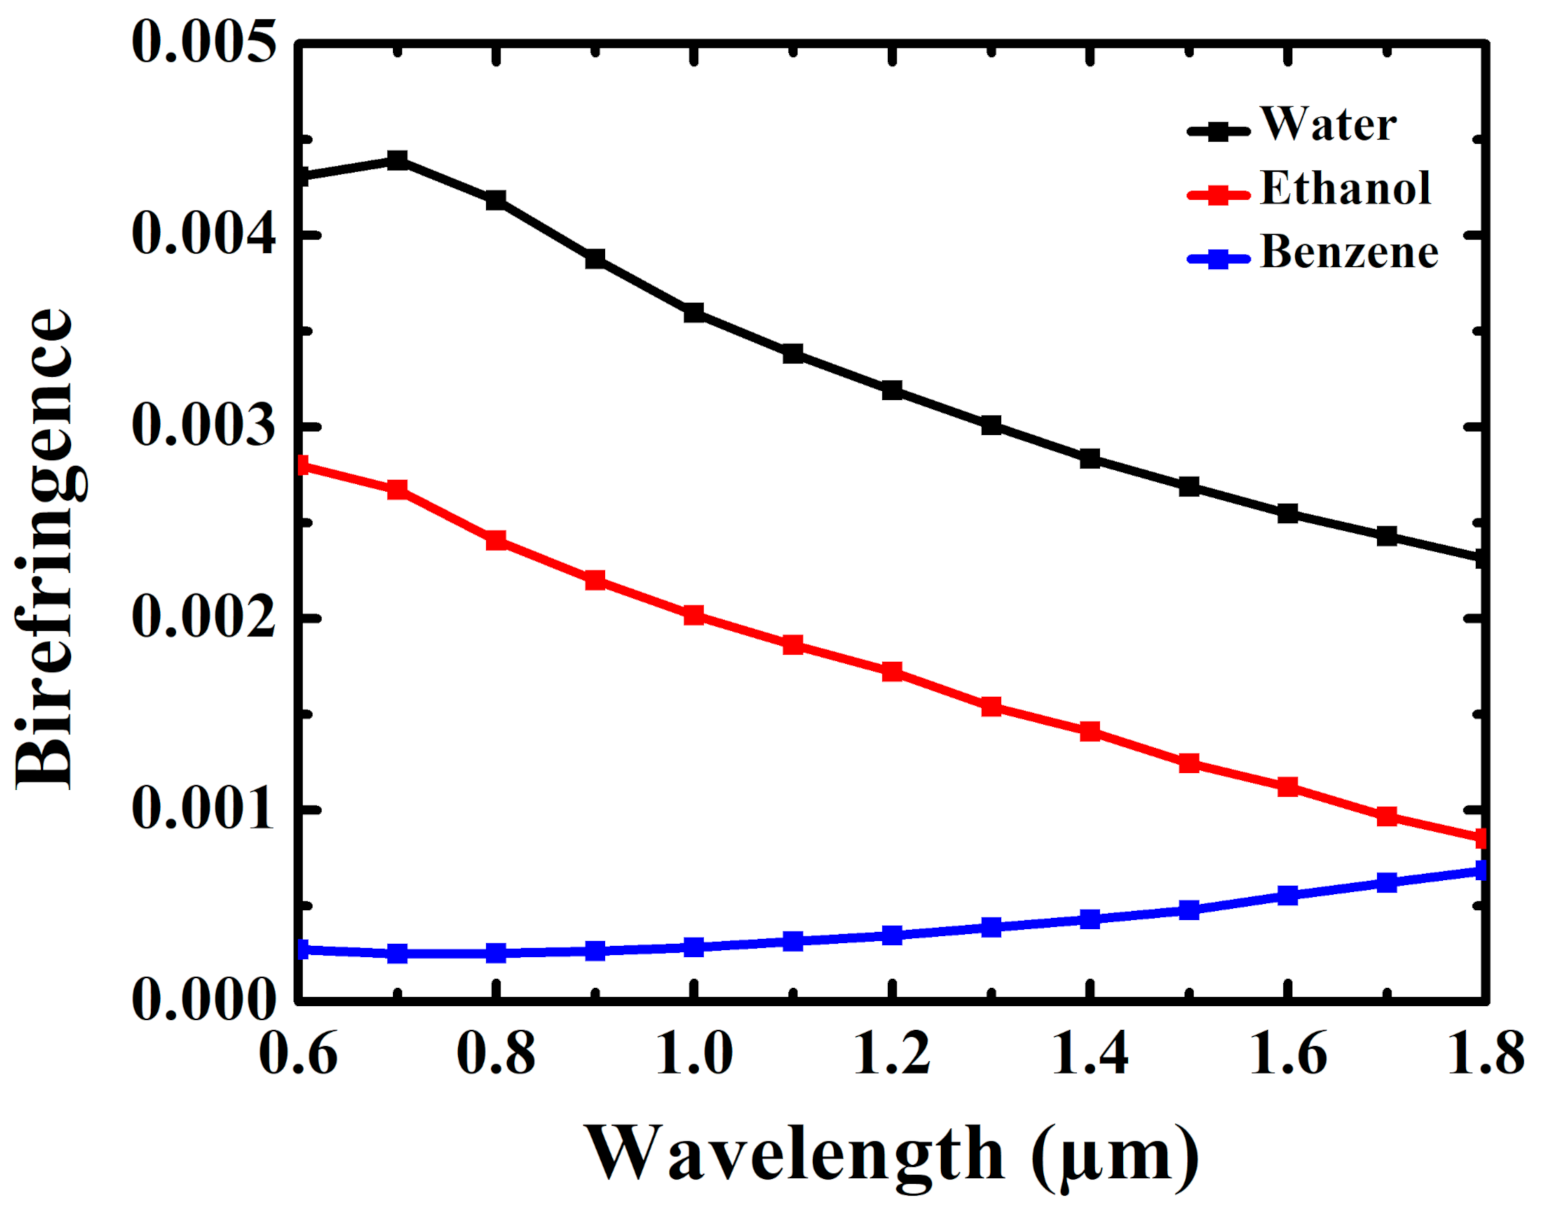
Figure 4 shows birefringence of the proposed PCF with respect to different wavelength. It can be seen that the birefringence of ethanol and water decrease with an increase in wavelength from 0.6 to 1.8 μm. However, for benzene, birefringence slightly increases with an increase in wavelength. At a wavelength of 1.3 μm, birefringences are 0.00301, 0.00154 and 0.000386 for water, ethanol and benzene, respectively. Birefringence for ethanol and water are just about higher than in references [
10,
11]. Effective refractive indexes for each analyte in the x-polarization and y-polarization are closed to one another, and hence, birefringence of each sensing liquid is relatively small, since it is merely the difference between the effective refractive index in x- and y-polarization.
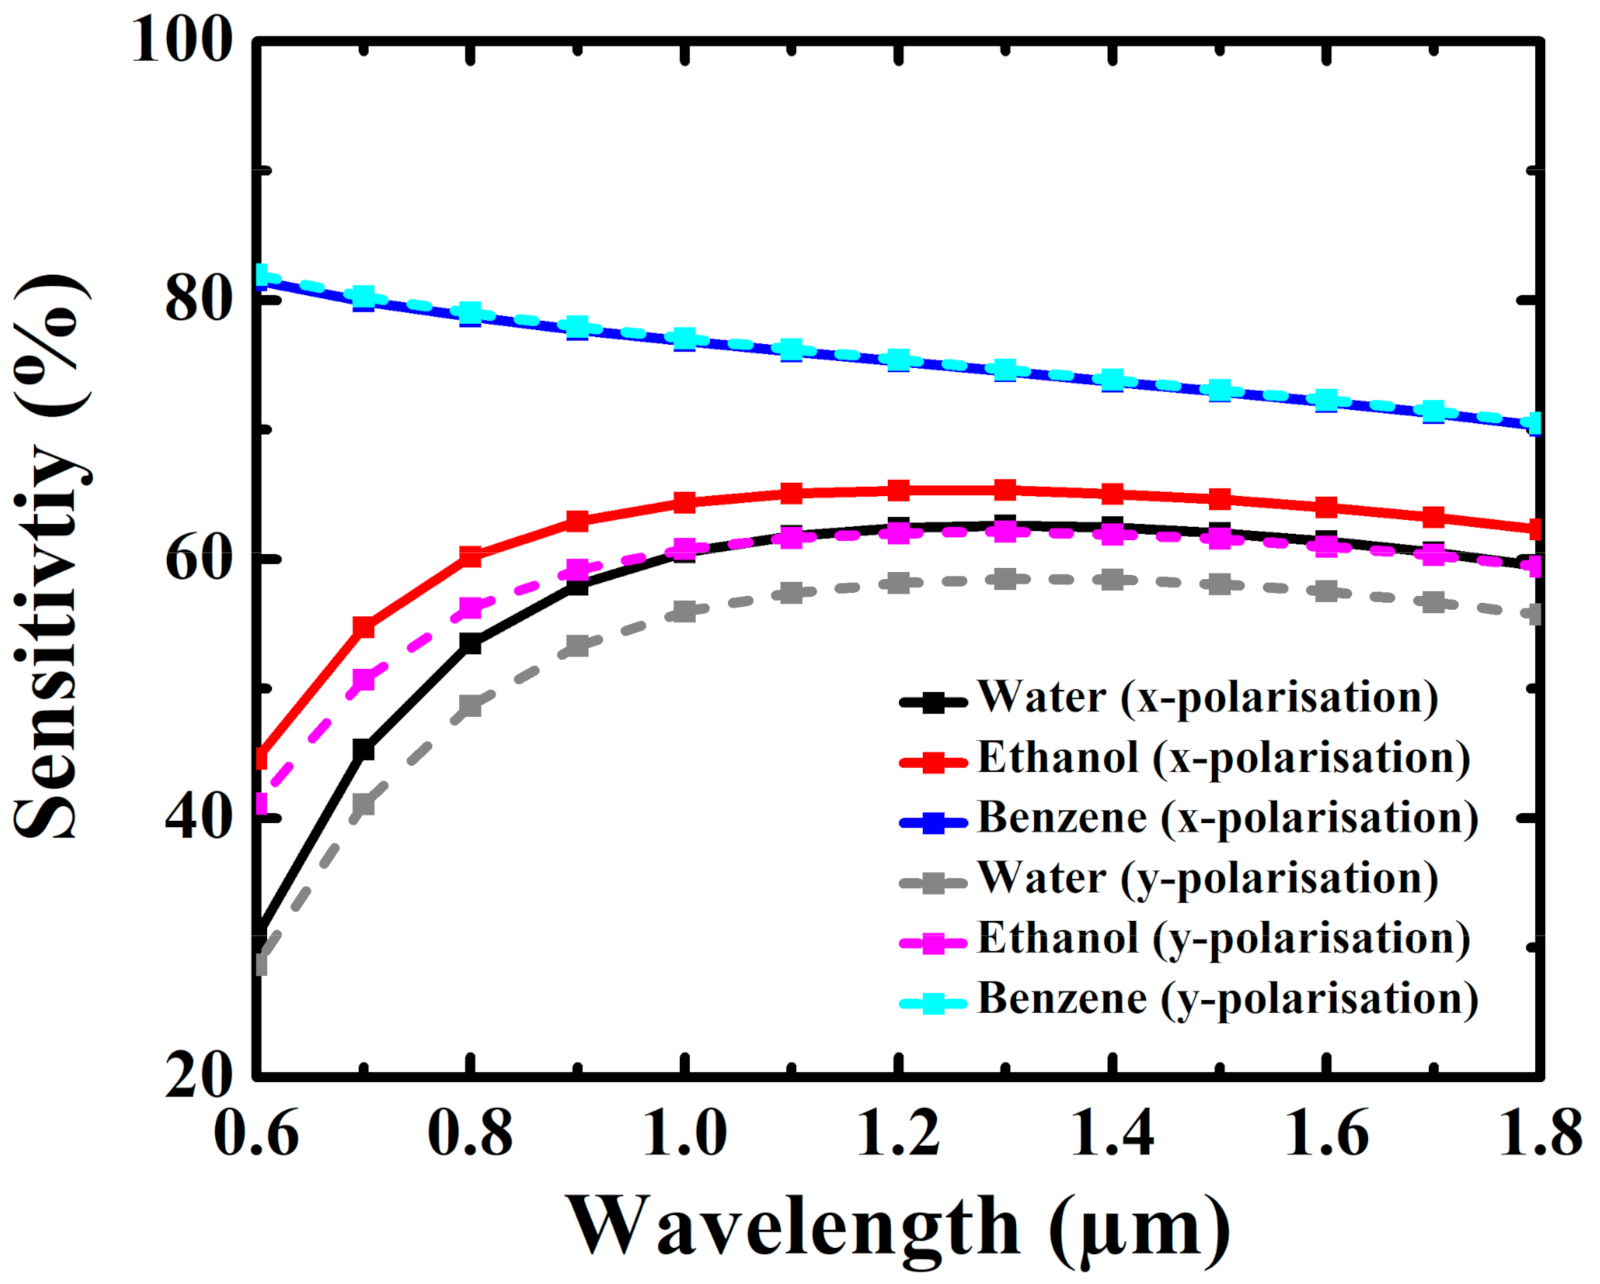
Figure 5 shows the relationship between relative sensitivity of the proposed PCF and operating wavelength for ethanol, water and benzene. It can be observed that the sensitivity for ethanol and water increase with respect to wavelength until 1.0 μm, before subsequently flattening and then, slightly decreasing as wavelength is increased even further. However, for benzene, relative sensitivity slowly decreases as wavelength increases. Relative sensitivity is a measure of how much light intensity interacts with the sensing liquid, which depends on the core design and refractive index of the liquid. Sensitivity of the proposed PCF is taken at wavelength of 1.3 μm in x-polarization as it is notably the highest value. The relative sensitivity for water, ethanol and benzene are 62.60%, 65.34% and 74.50%, respectively, which are higher than the sensitivities reported in references [
9,
10,
11,
12,
13,
14,
15,
16]. Moreover, since sensitivity values are higher in the x-polarization, other waveguide parameters are taken at this x-polarization axis as well.
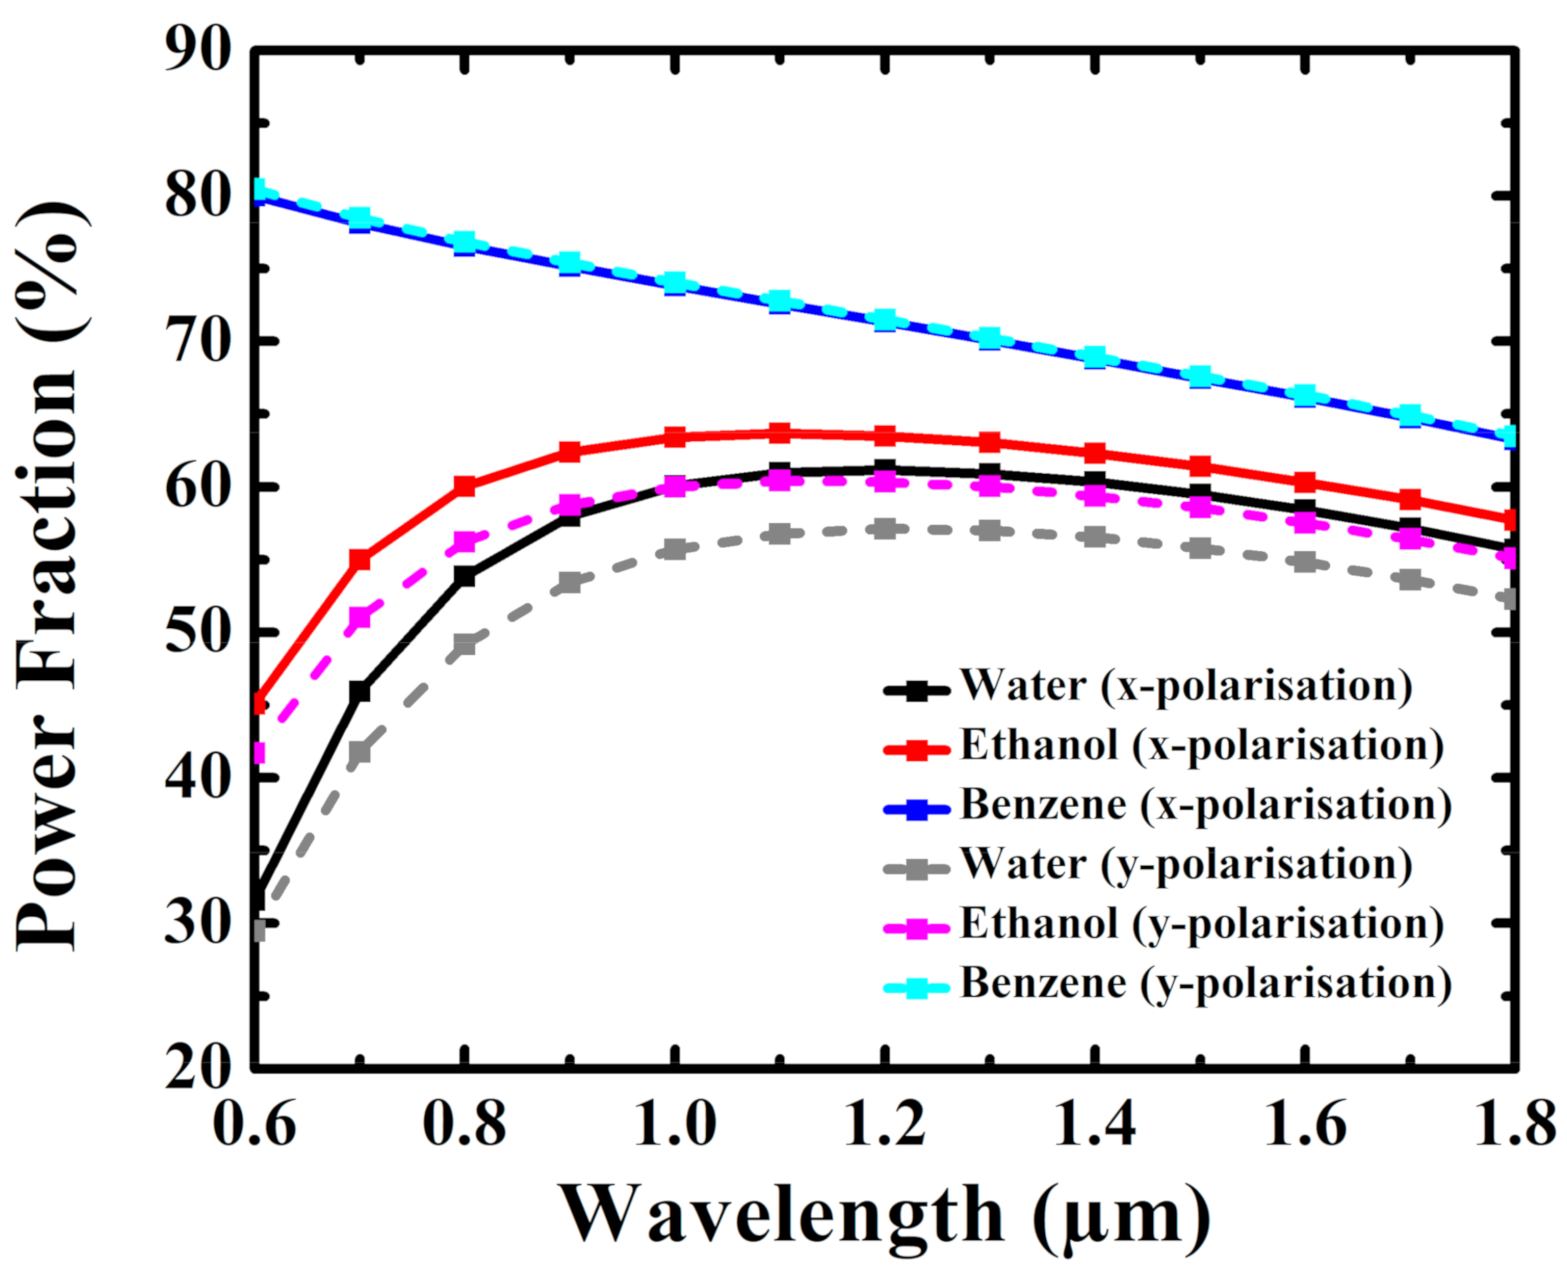
Figure 6 demonstrates the relationship between power fraction and operating wavelength for water, ethanol and benzene. It can be observed that the power fractions for ethanol and water increase with respect to wavelength until 1.0 μm, before subsequently flattening and then, moderately decreasing. However, power fraction of benzene decreases as wavelength increases. Relative sensitivity at 1.3 μm for water, ethanol and benzene are 60.90%, 63.06% and 70.07% respectively.
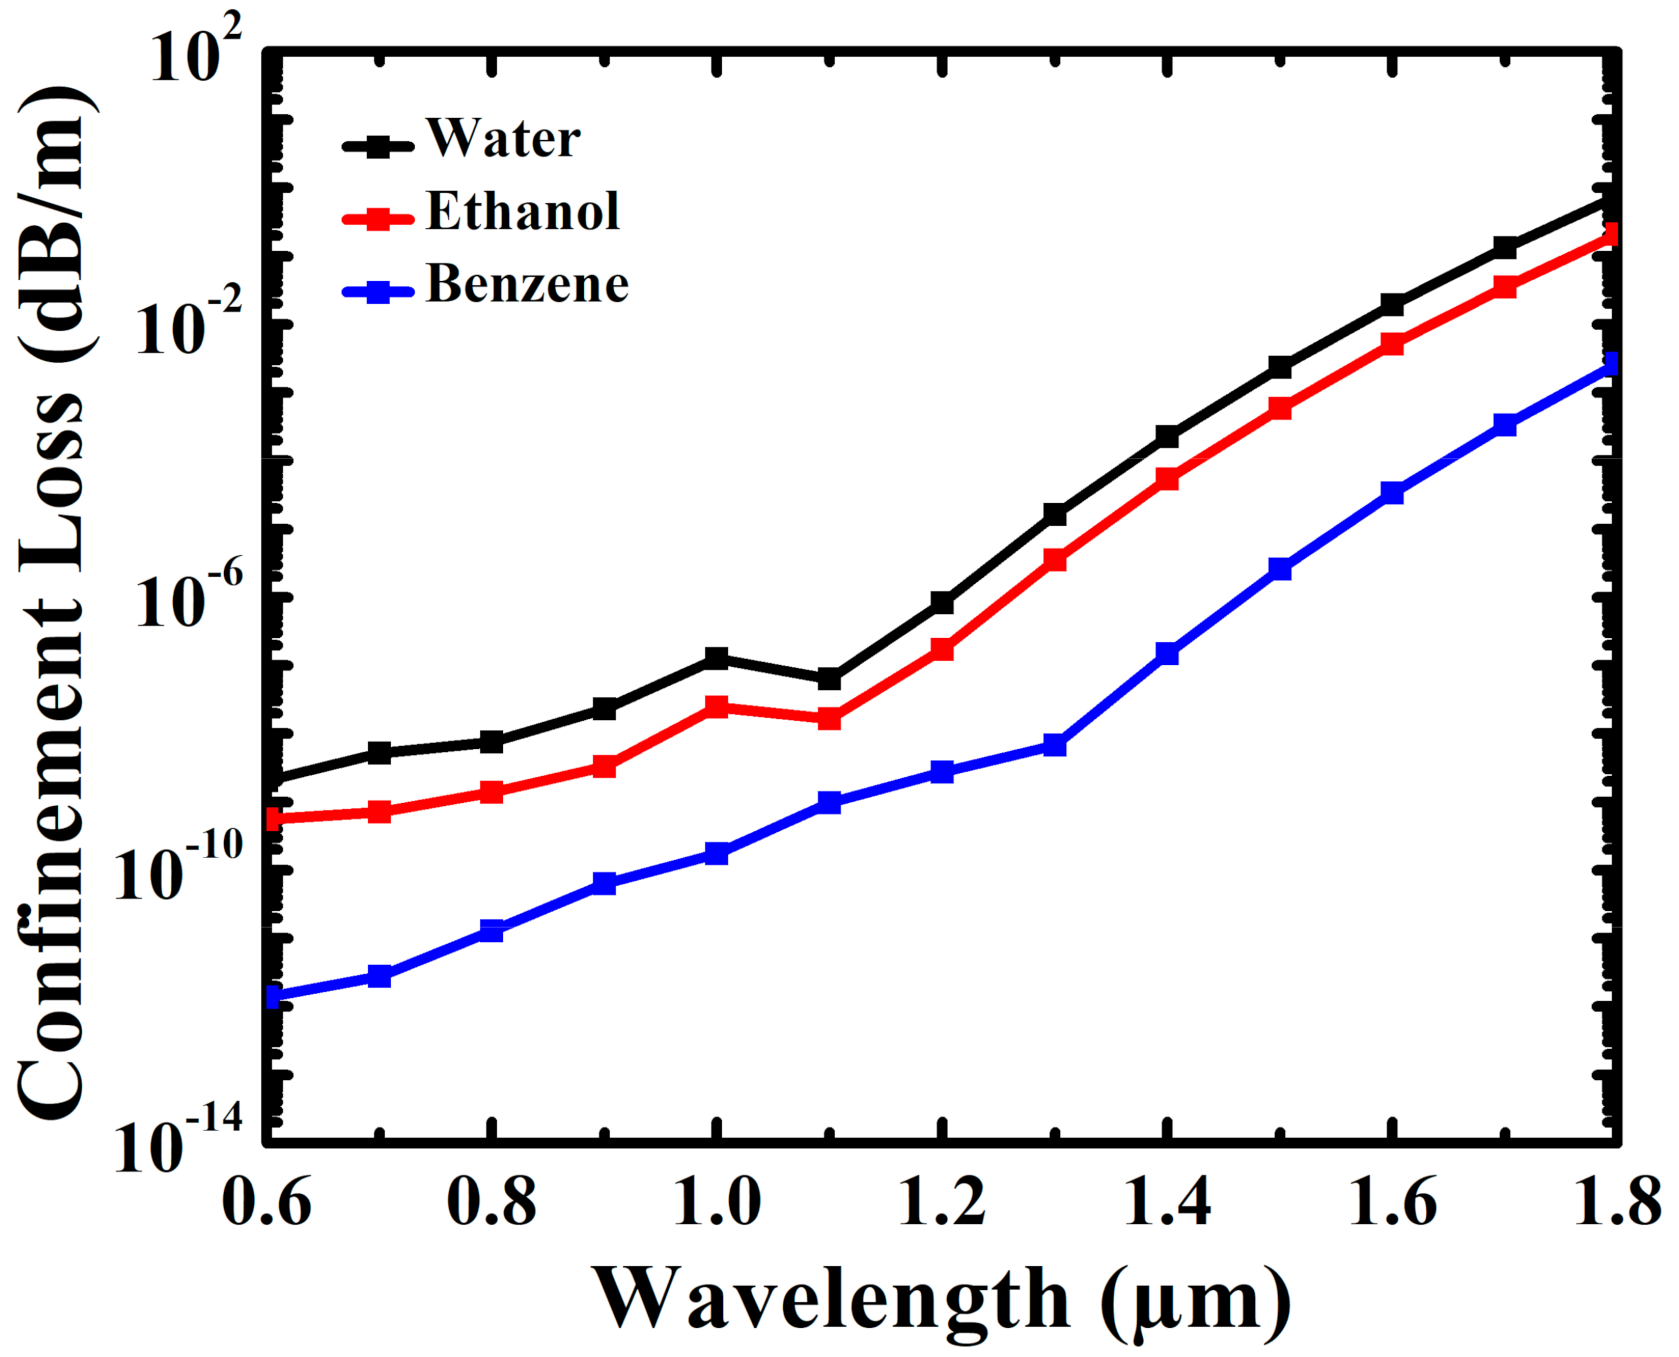
Figure 7 shows the relationship between confinement loss of the proposed PCF and wavelength for water, ethanol and benzene. For all the three liquids, confinement losses generally increase, with more light leaking out of the core into the cladding, as wavelength is increased. It can be seen that the confinement loss of benzene has a slightly lower value, as compared to ethanol and water. At operating wavelength of 1.3 μm, confinement losses are 1.63 × 10
−7 dB/m for water, 3.55 × 10
−8 dB/m for ethanol and 6.76 × 10
−11 dB/m for benzene.
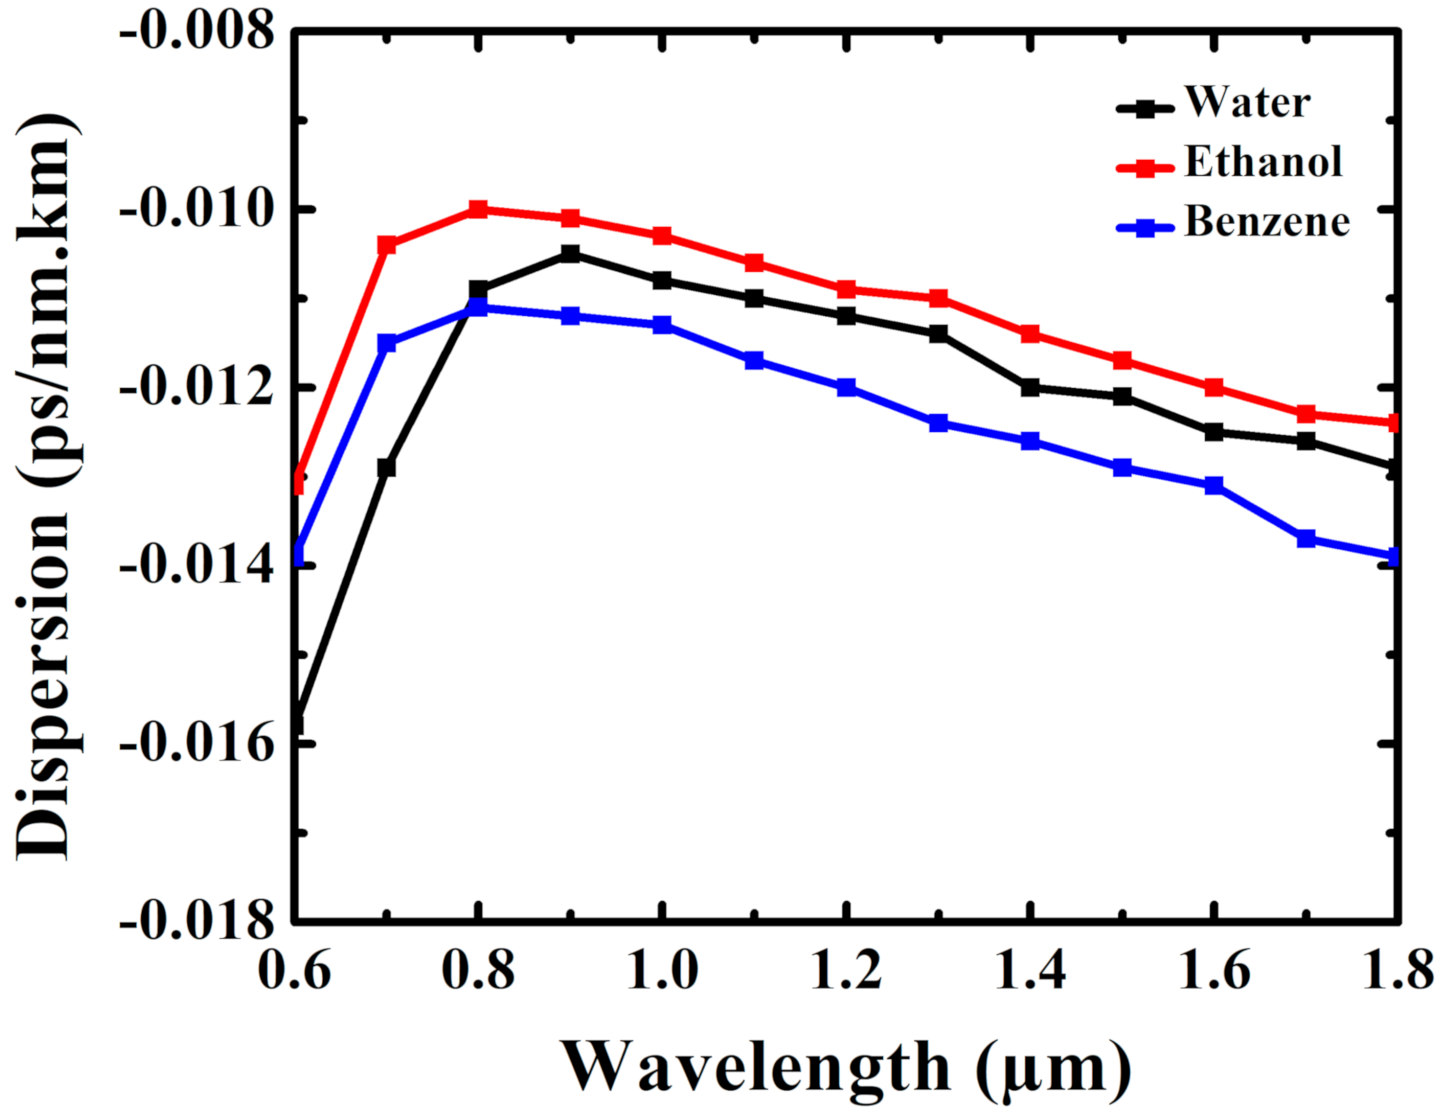
Figure 8 illustrates the relationship between chromatic dispersion of the proposed PCF and operating wavelength for ethanol, water and benzene. From the chromatic dispersion graph, it is observed that the obtained chromatic dispersion values are very low for all the analytes. Moreover, the dispersions variation of each operating wavelength for the different sensing liquid are very closed to one another. The value of dispersions at 1.3 μm wavelength are −0.0114 ps/nm.km for water, −0.0110 ps/nm.km for ethanol and −0.0124 ps/nm.km for benzene.
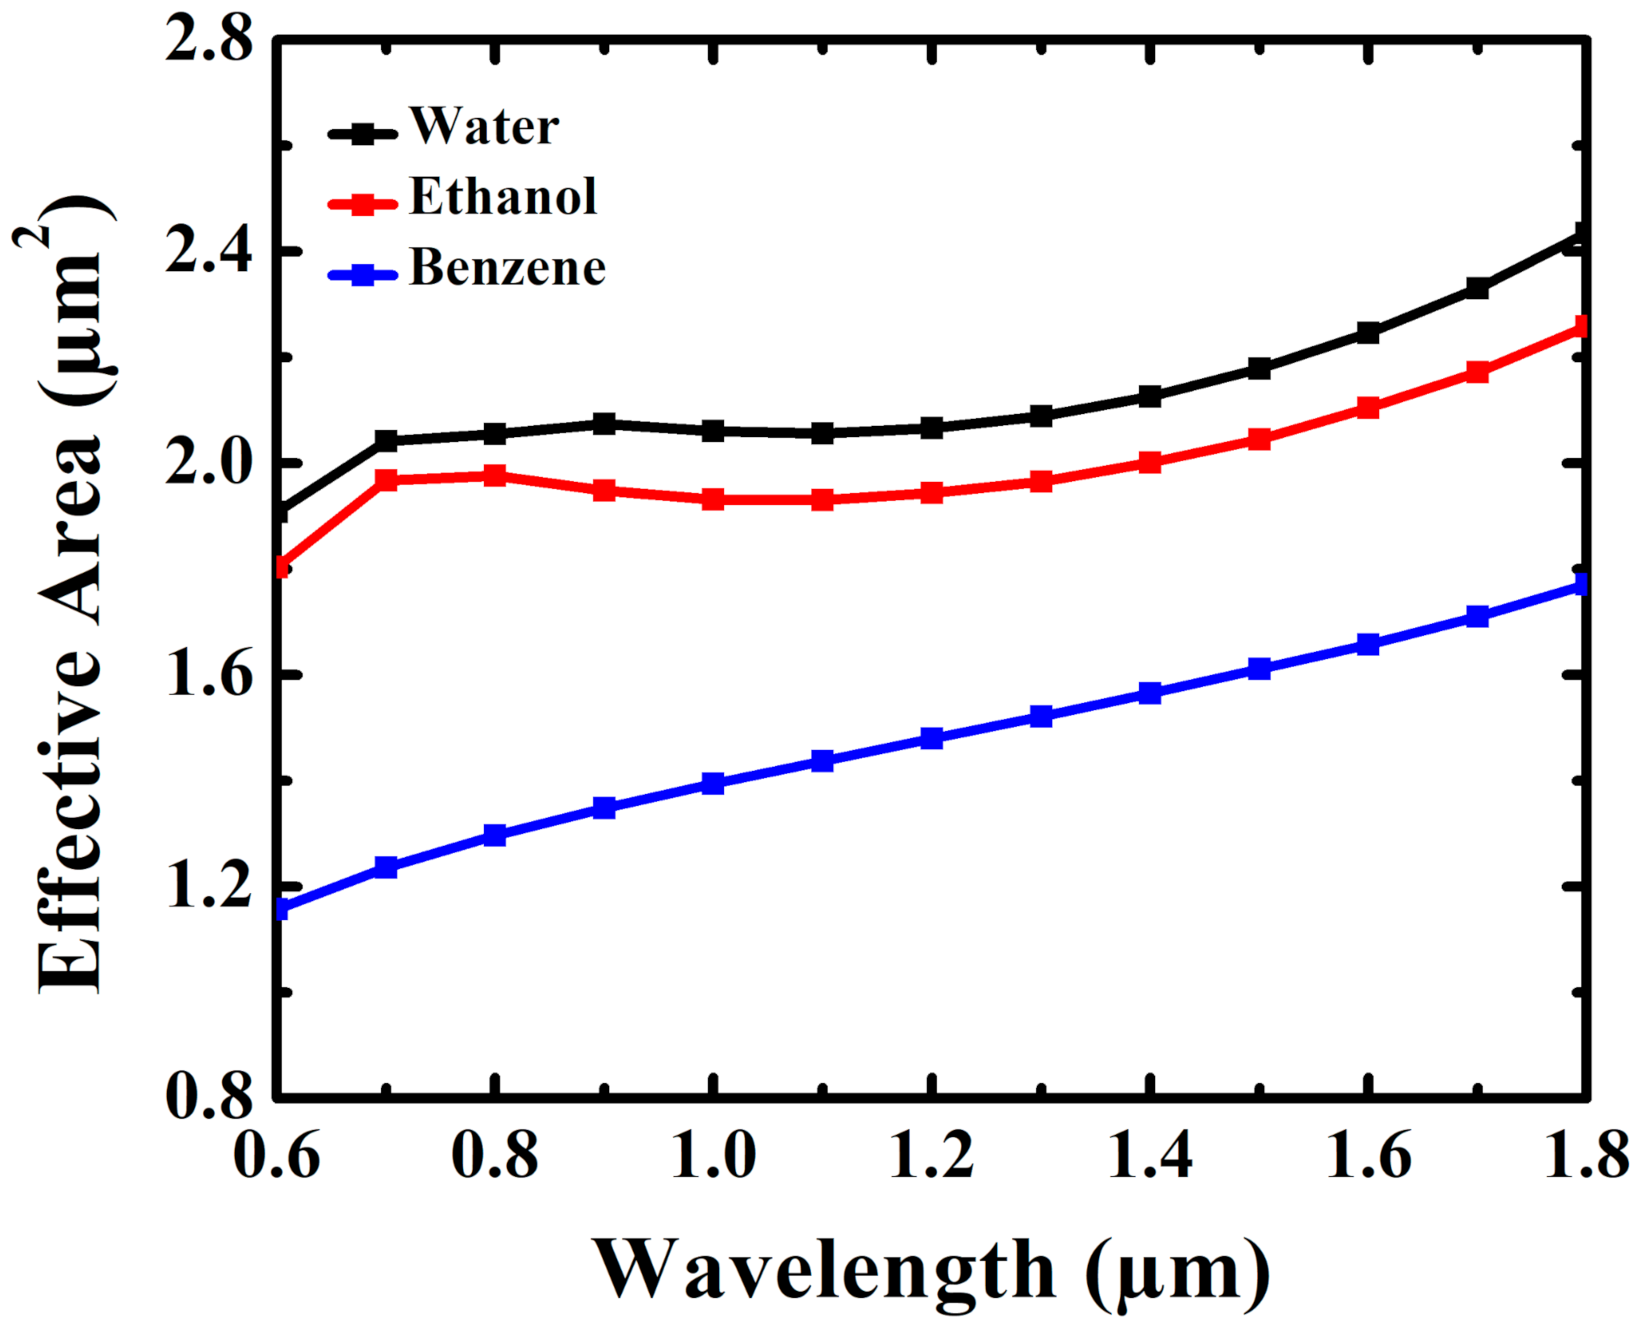
Figure 9 illustrates the relationship between effective area and wavelength of the proposed PCF. Effective area moderately increases with an increase in operating wavelength. Since effective area represents the quantitative measure of transverse electric fields, it increases with an increase in wavelength. It can be observed that benzene has the lowest effective area, compared to ethanol and water. At wavelength of 1.3 μm, effective area of water, ethanol and benzene are 2.089 μm
2, 1.965 μm
2, and 1.521 μm
2, respectively.
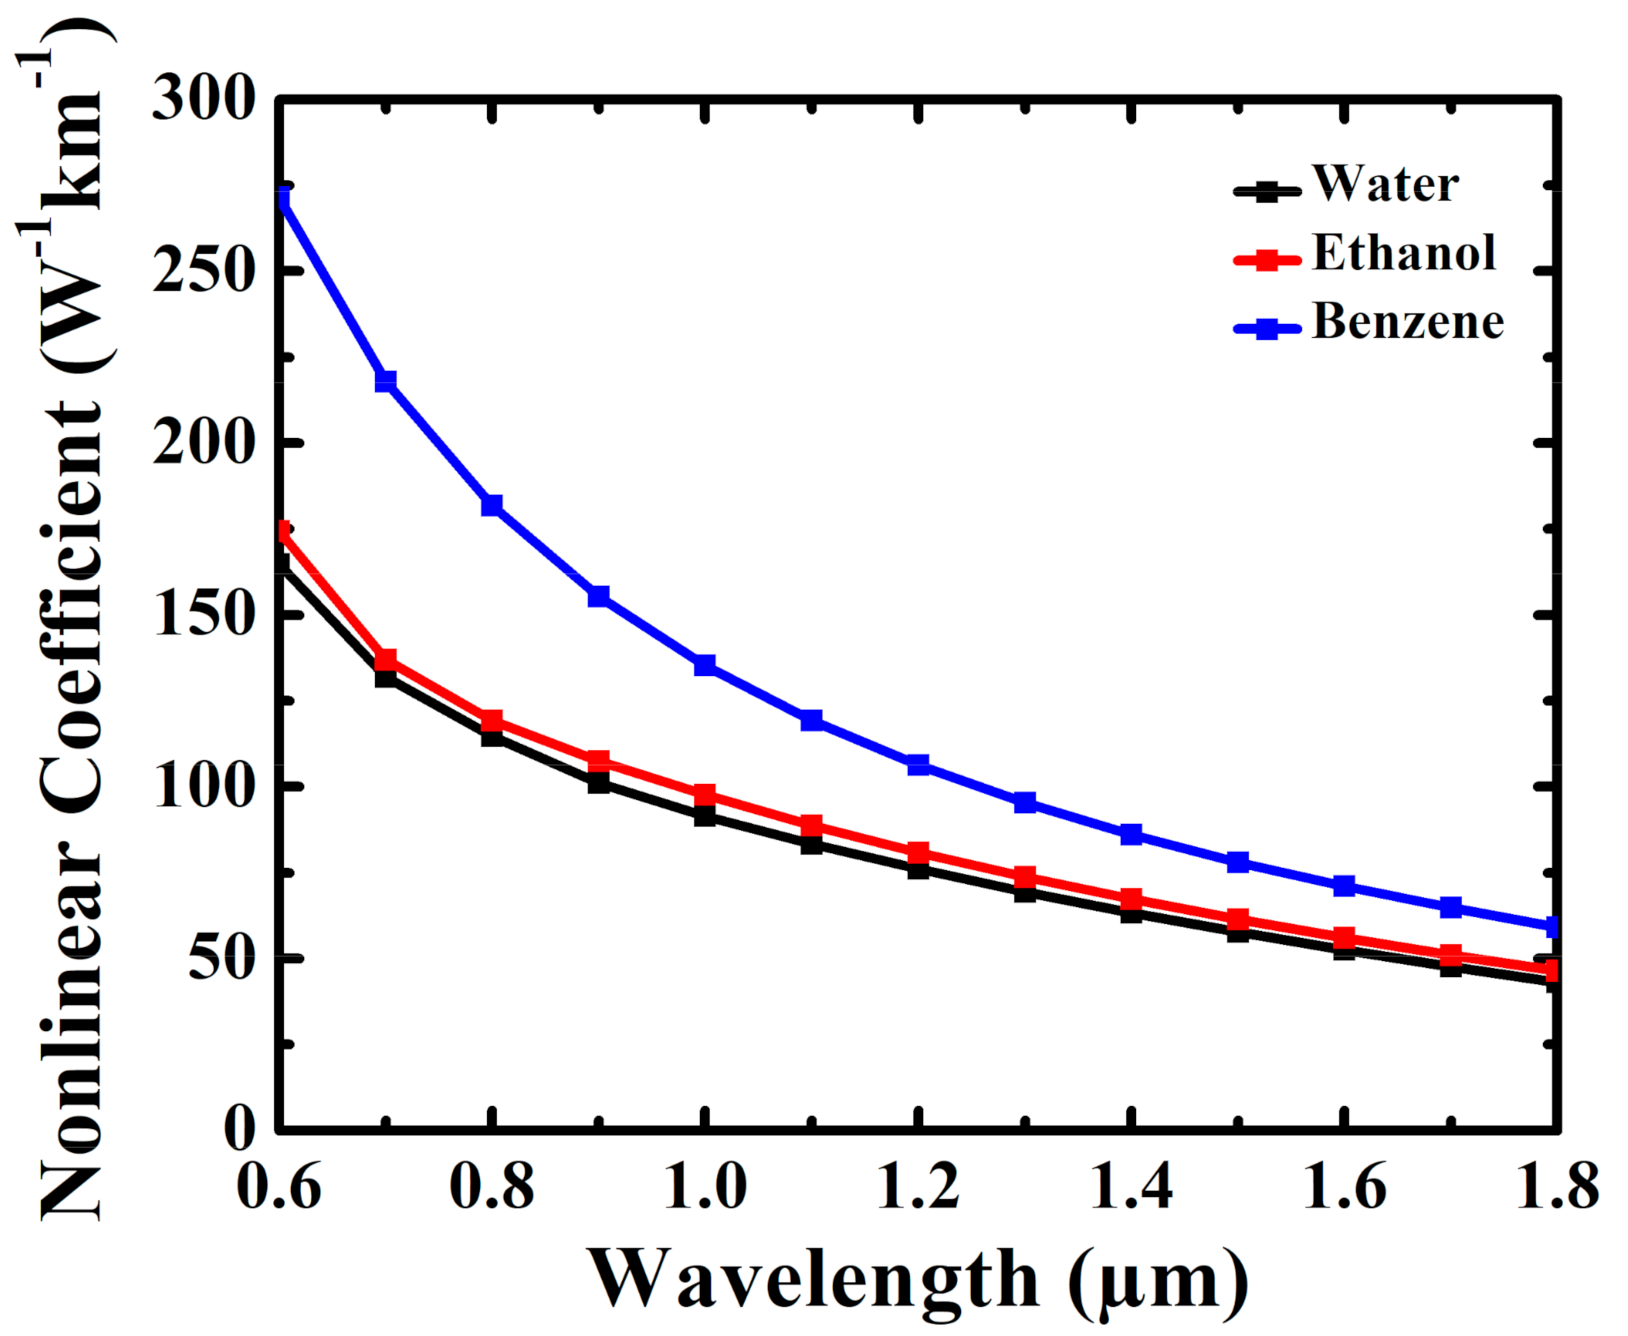
Figure 10 demonstrates the relationship between nonlinear coefficient of liquid analytes and wavelength. It can be seen that ethanol, water and benzene exhibit almost similar behavior; with nonlinear coefficient generally decreasing as operating wavelength is increased. Nonlinearity and effective area are inversely proportional to one another, and hence,
Figure 9 and
Figure 10 exhibit an expected opposing behavior. Benzene has a slightly higher nonlinear coefficient amongst the other liquids with value of 95.4 W
−1 km
−1 at a wavelength of 1.3 μm. Nonlinearity coefficients for ethanol and water are 73.8 W
−1 km
−1 and 69.4 W
−1 km
−1, respectively. These nonlinear coefficients are relatively higher than in references [
14,
15].
A comparison between the proposed fiber and prior liquid infiltrated PCF is presented in
Table 2. It can be observed from the table that the proposed PCF demonstrates the highest relative sensitivity and nonlinear coefficient for all the liquid analytes.
The proposed PCF is designed for the purpose of liquid sensing application and it was formulated with a relatively simple design; with only three core air holes and three rings of air holes in the cladding. With such non-complex design, it is relatively easy and cheap to fabricate with the current advancement in fabrication technologies. Despite these advantages, sensitivity of the proposed PCF has been shown to be higher value than many PCFs with a more complex design; such as that given in references [
9,
10,
11,
12,
13,
14,
15,
16]. Furthermore, it has also been shown to have a low confinement loss than most of the prior PCFs; with the confinement loss already sufficiently low for the liquid sensing application under consideration. It is noted that although confinement loss of the proposed PCF is relatively higher than references [
12,
13,
14], the proposed PCF is much simpler; with the PCFs in references [
12,
13,
14] having a far more complex designs with five cladding rings and larger number of core air holes.
Technological advancement in fabrication techniques have made it possible to manufacture complex and non-complex PCF designs. Several advanced fabrication techniques that may be considered include the extrusion method, stack and draw, drilling and sol-gel casting [
29,
30,
31,
32]. To fabricate the proposed PCF, design feasibility is a needed criterion. A tolerance analysis is carried out by varying global parameters of the PCF design; its pitch size and diameter of the cladding and core holes and examine the effect of their variations from the optimum parameters. An analysis on the proposed PCF due to variations of the global parameters in the order of ±1% and ±2% from the optimum parameters, is shown in
Table 3, at
λ = 1.3 µm wavelength. It can be seen that relative sensitivities change in the order of less than ±0.08%, ±1.1% and ±1.1% for water, ethanol and benzene, respectively, for variation of up to ±2% from the optimum parameters, whilst nonlinear coefficient changes in the order of less than ±3.8%, ±3.8% and ±3.4% for water, ethanol and benzene, respectively, for variation of up to ±2% from the optimum parameters. Despite these variations, it is noted that the resultant relative sensitivity and nonlinear coefficient are still better than those reported in
Table 3.
In terms of sensor application, the core holes need to be infiltrated with an unknown liquid analytes: either water, ethanol and benzene. The infiltration of liquid into the PCF core can be accomplished by methods as reported in previously related research studies [
8,
33,
34,
35]. One of the commonly known technique that has been introduced to experimentally infiltrate liquids into the PCF core, is the selective air hole filling technique [
33]. This technique is capable of injecting liquids into micro-structure holes in a fiber such as core or cladding holes. Other different methods to accomplish the infiltration of analytes into the core air holes include methods as proposed by various researchers such by Cordeiro et al. [
8], Huang et al. [
34] and Xiao et al. [
35].
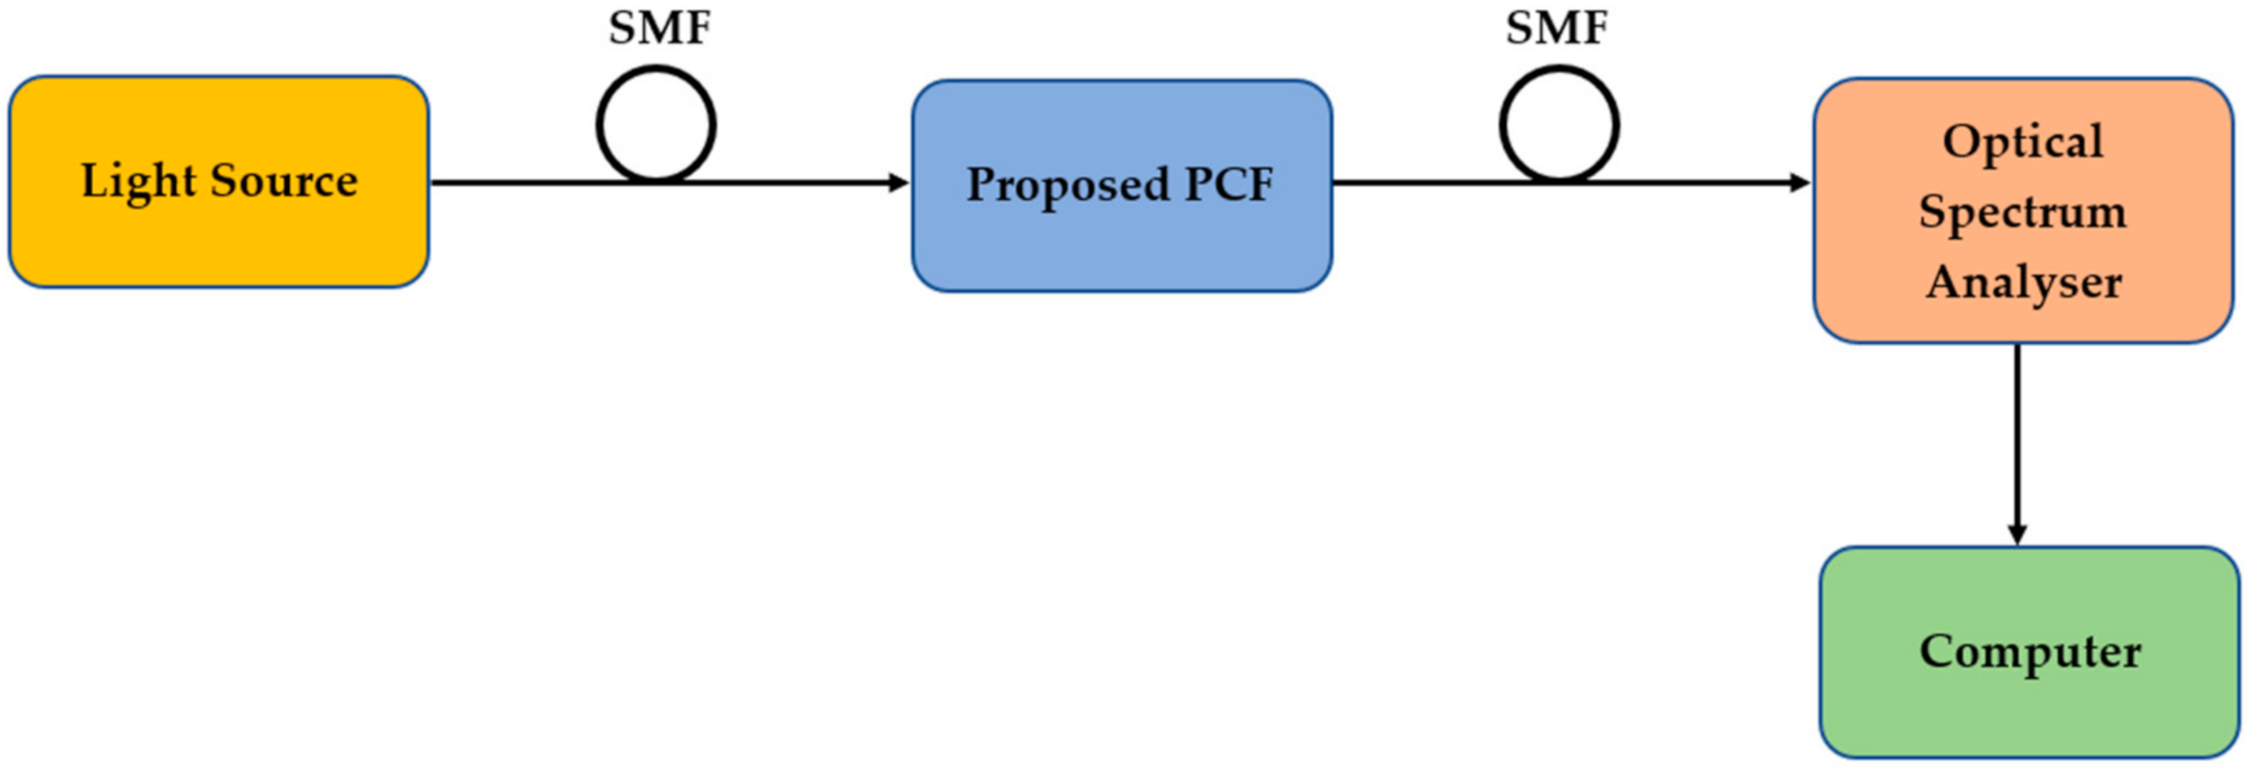
Figure 11 demonstrates a schematic diagram of an experimental characterization setup for the sensing application of the proposed PCF, suggested by Rifat et al. [
36]. It includes a light source, single mode fiber (SMF), Optical Spectrum Analyser (OSA) and a computer. Incident optical light is transmitted from a light source and it is induced on the proposed PCF sensor through a SMF. After a sufficient period of light-material interaction, the OSA is used to monitor the output which is then analyzed using the connected computer. The computer analysis can be used to observe the change in the optical properties stated in the manuscript for the different infiltrated liquid at specific operating wavelengths.

 ,
, 


