Article

Focusing and Wavefront Splitting of an Extreme Ultraviolet Laser with a Tubular Optical Element

1
National Key Laboratory of Science and Technology on Tunable Laser, Harbin Institute of Technology, Harbin 150001, China
2
State Key Laboratory of Precision Measuring Technology & Instruments, Laboratory of Micro/Nano Manufacturing Technology (MNMT), Tianjin University, Tianjin 300072, China
*
Authors to whom correspondence should be addressed.
Photonics 2023, 10(6), 629; https://doi.org/10.3390/photonics10060629
Submission received: 28 April 2023 / Revised: 19 May 2023 / Accepted: 23 May 2023 / Published: 29 May 2023
(This article belongs to the Special Issue XUV and X-ray Free-Electron Lasers and Applications)

Abstract

:
A capillary discharge extreme ultraviolet laser is focused and wavefront split at 46.9 nm by a tubular optical element. The reflectivity at 46.9 nm is both simulated and measured to be higher than 90% with a slight optical aberration. The operating principle of the tubular element for focusing and wavefront splitting is discussed. Dense and intense grating-like fringes with a period of ~150 nm are achieved. The method used in this work allows nano-scale processing with extreme ultraviolet laser at single-shot exposure mode.

1. Introduction

Extreme ultraviolet (EUV) lasers are promising tools for dense plasma diagnosis, element identification, high-precision micro/nano-processing and biological imaging [1,2,3,4]. However, the focusing and other complex light field regulations are challenging problems in the EUV field since the EUV lasers are easily absorbed by materials and the refraction coefficient is close to 1 [5]. Therefore, the optical elements widely used in optical range are hardly applied to EUV lasers. In this domain, reflective and diffractive type elements are generally employed. Multi-layers coated on typical reflective faces are helpful in achieving an acceptable reflectivity and optical aberration [6]. For the wavelength range of 35–50 nm, Sc/Si multi-layer is suitable. The reflectivity at a normal incidence can reach 50% [7]. Fresnel zone plate (FZP) based on the beam diffraction could focus the laser into smaller scale, which is dependent on the fabrication of the plate. For a 46.9 nm laser, the FZP could create a focused spot with a diameter of 82 nm with the third-order diffraction [3], and the power of the spot focused by FZP could reach 1 × 10¹⁰ W/cm2 [8]. FZP can also be integrated into the EUV laser generation system (in-situ focusing) [9], which is able to focus 11 eV photons down to a waist radius of 150 nm with numerical apertures of up to 0.35, even though the tight focusing, the limited size of the aperture and the low diffraction efficiency make FZP less effective since most of the output laser energy is wasted. Wavefront division and amplitude division interferometer achieved by Lloyd mirror or transmission diffraction grating are also utilized with extreme ultraviolet laser to create the light field consisting of dense interference fringes [10,11,12]. To adjust the angle between the two interfered laser beams, the period of the fringes could reach 55 nm. However, the intensity of the interfered laser beams is quite low. The fringes depth of only several nanometers could be created onto highly sensitive photoresist with hundreds of laser shots exposure, which is not efficient for nano-scale laser processing. In our previous work, a toroidal bare mirror is used to focus the EUV laser [13,14]. The reflectivity reaches 90% because of the grazing incidence. What’s more, the mirror is hardly damaged by the laser and the accompanying ejected plasma since there is no tender layer coating on the mirror. However, the apparent optical aberration brought by the grazing incidence reduces the intensity of the focused spot.
In this work, a tubular optical element is used to focus and perform wavefront splitting with a capillary discharge EUV laser. The element has a higher reflectivity and a smaller optical aberration than that of the toroidal mirror. Interferential lithography is performed by adjusting the location of the element. In this case, the high-contrast dense nano-scale grating-like periodic structures can be created by single shot exposure of the EUV laser.

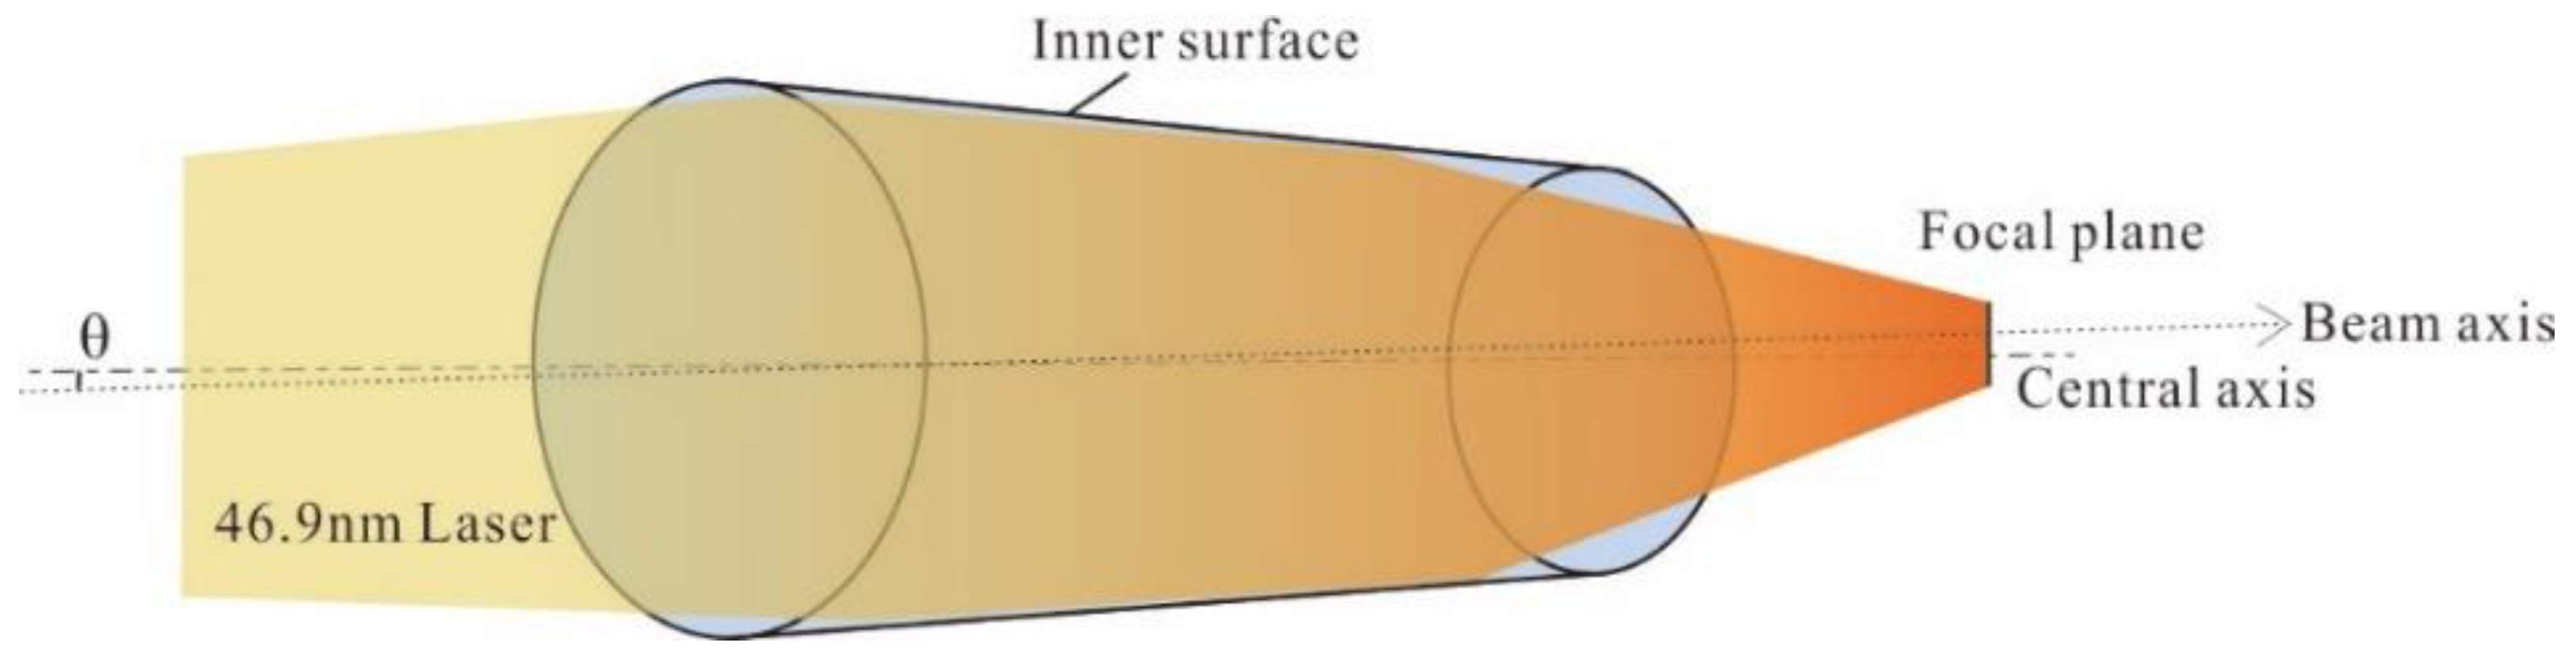
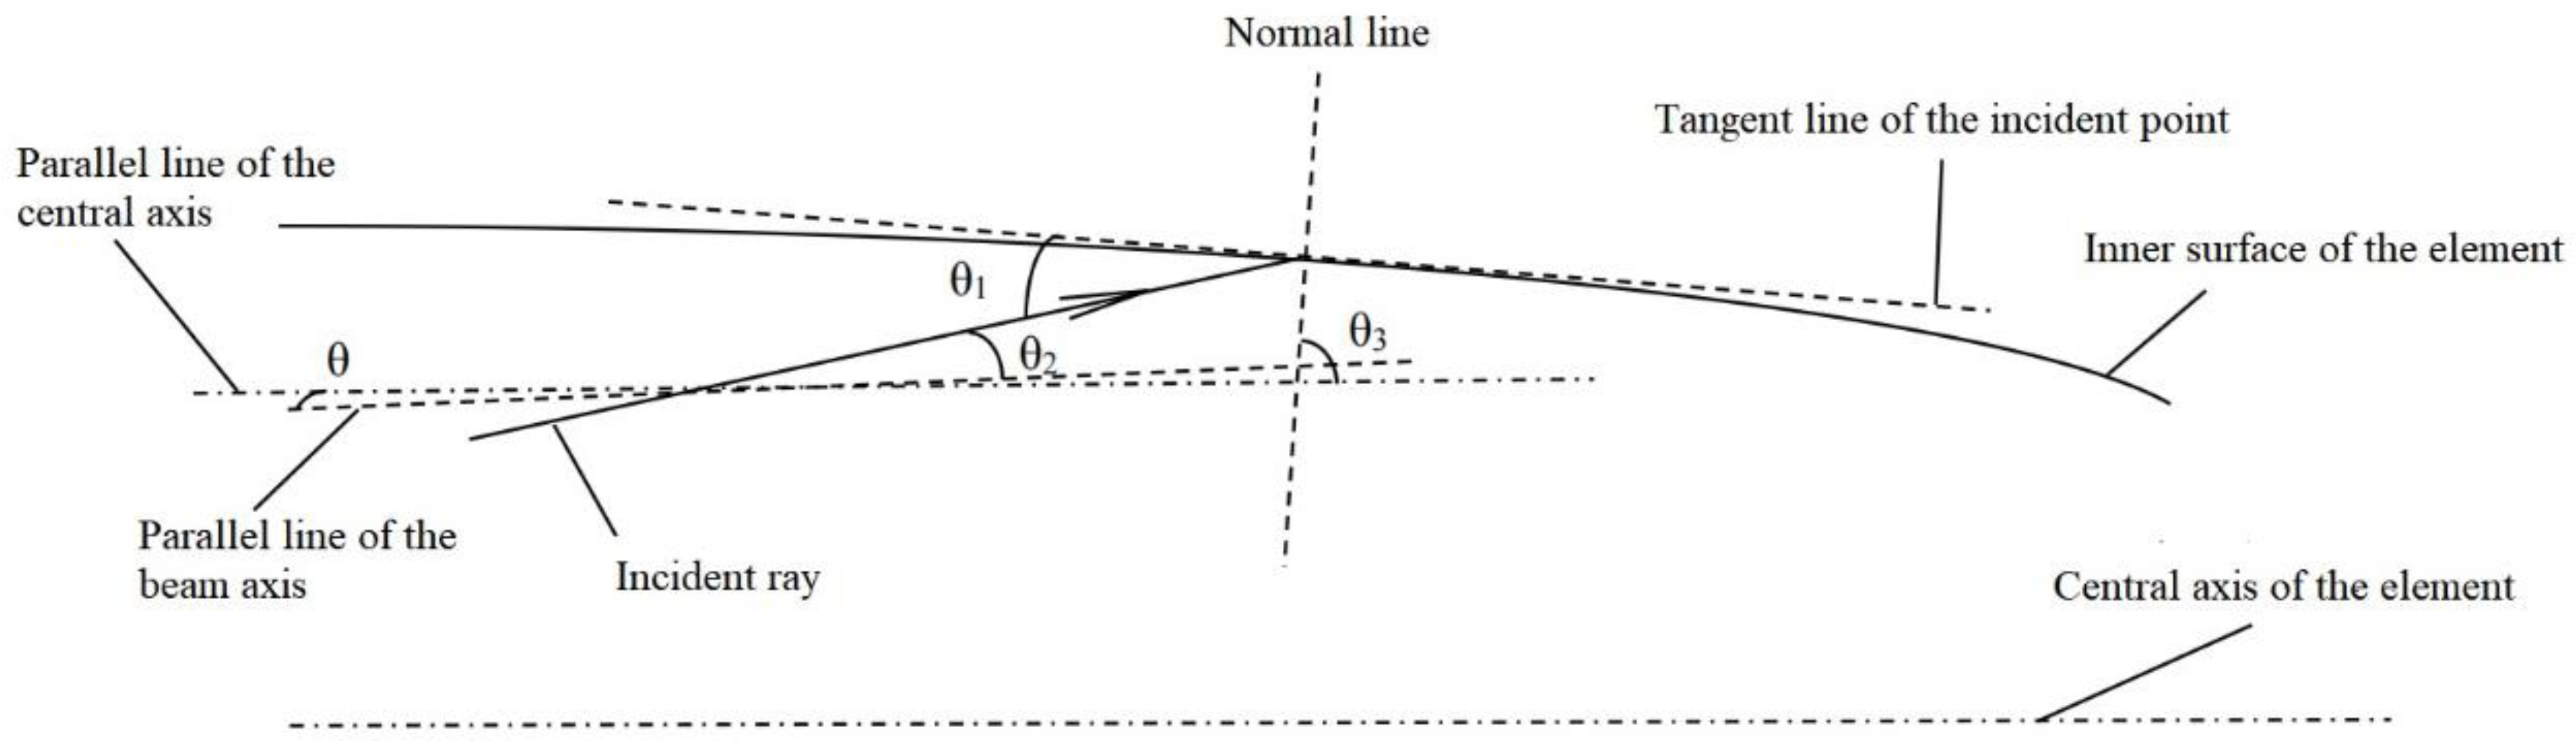
2. Materials and Methods
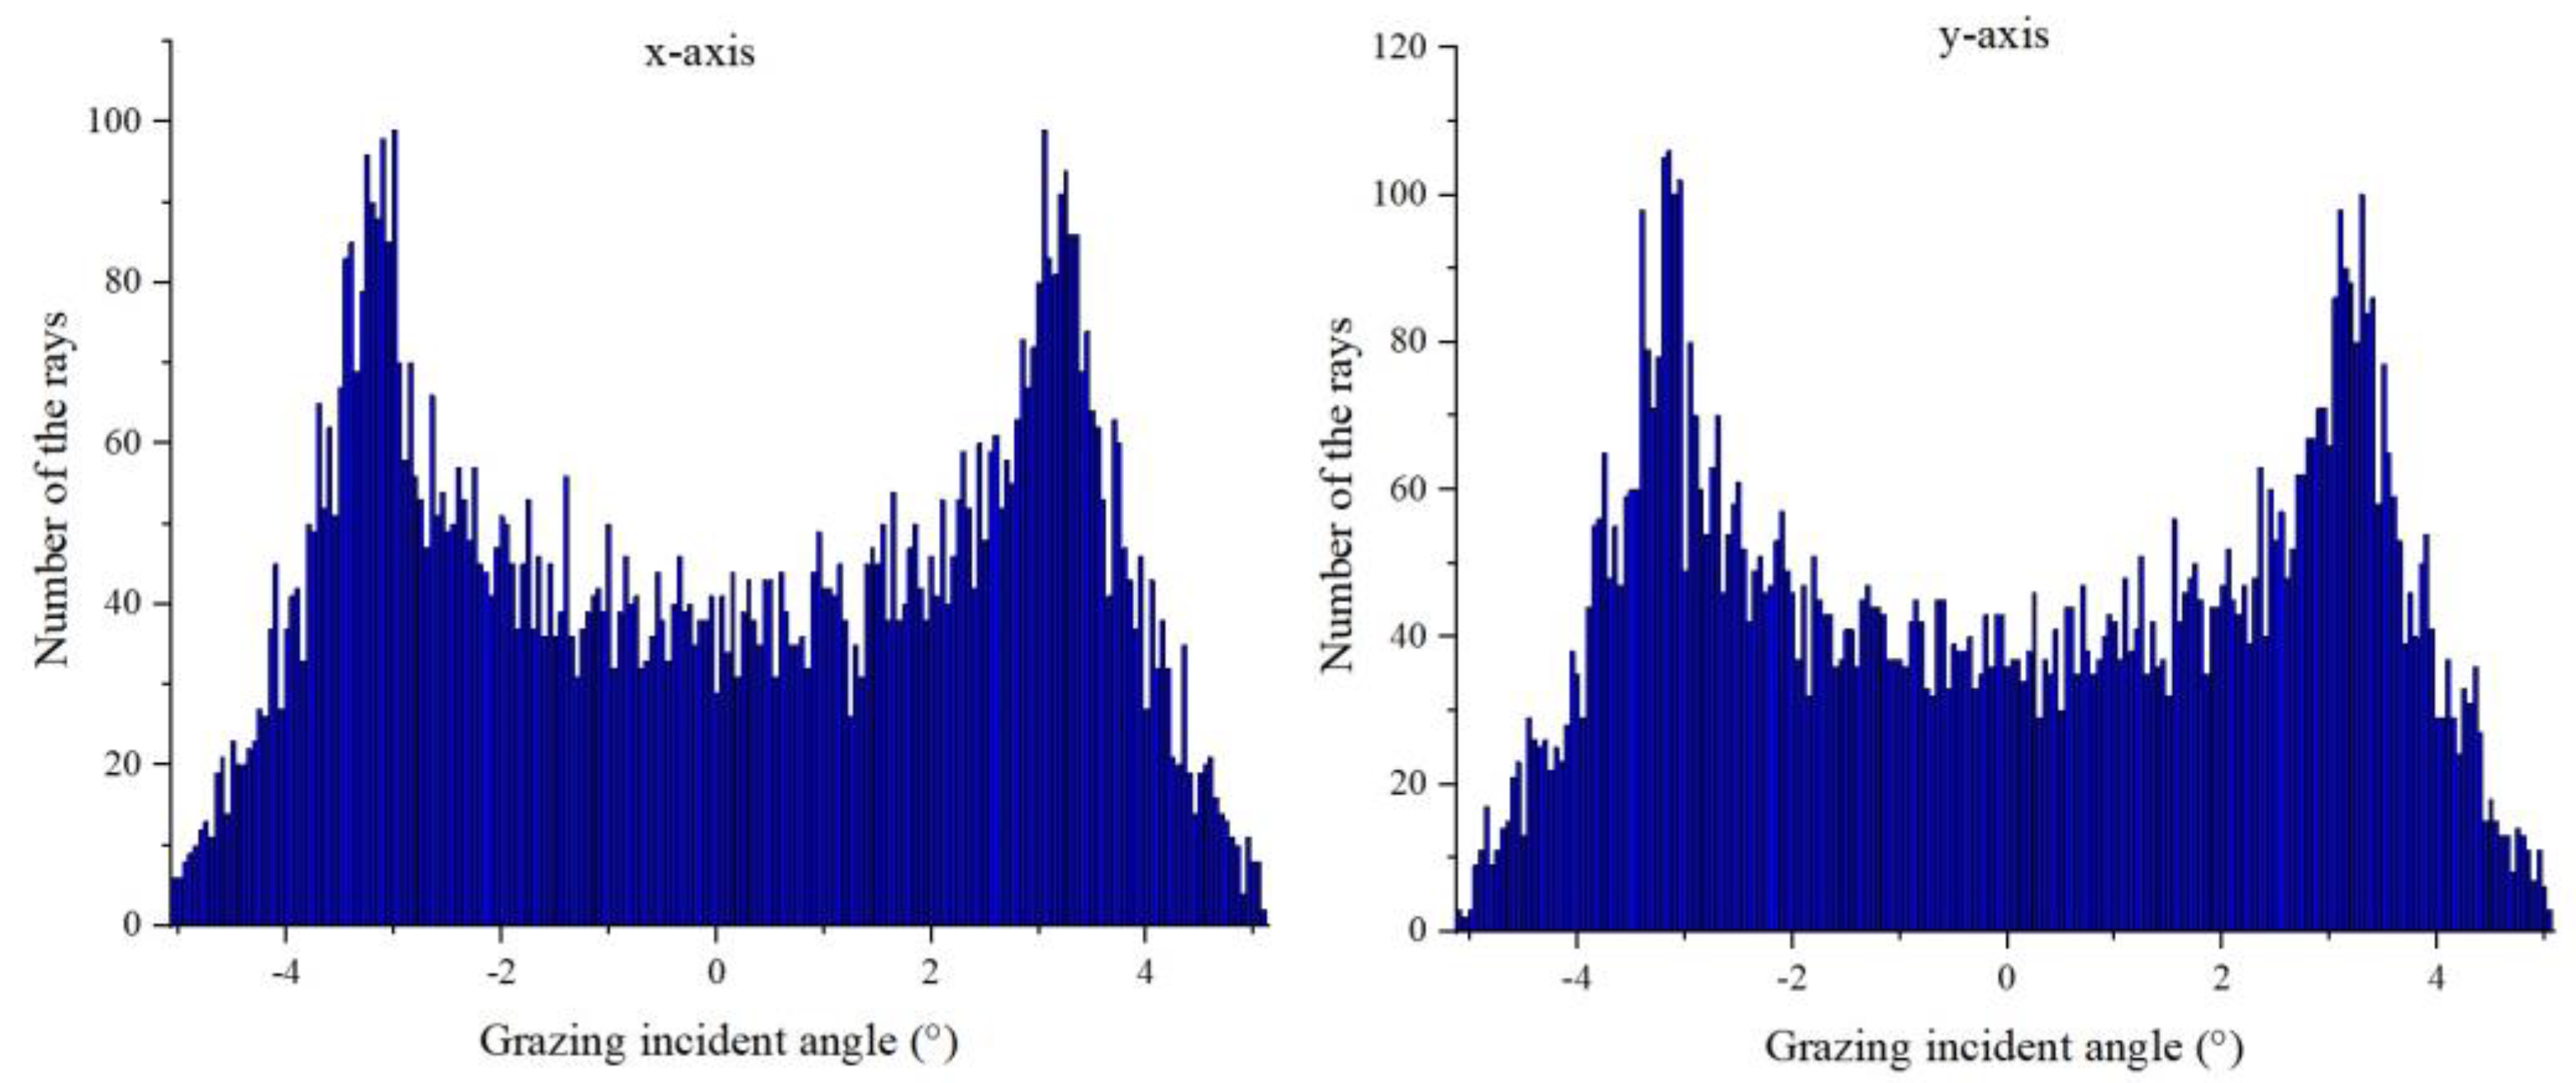
The radiation source used in this work is a capillary discharge extreme ultraviolet laser self-developed by Harbin Institute of Technology at a wavelength of 46.9 nm [15,16]. The gain medium is a z-pinched plasma column with high density and high temperature generated by a mixed gas of Ar and He excited by a fast current pulse. The duration of the laser is ~1.5 ns. The relative energy of the laser is measured by an X-ray diode (XRD) upon photo-electrical effect. The absolute energy of the 46.9 nm laser could be calculated by the XRD signal as follows:
E = E p h V d t T q e R e 1 R r e f
A = h c R e 1 R r e f
where E is the absolute energy of the laser; V d t is the integration of the XRD signal; T is the attenuation of the whole energy measurement system; Eph is the photon energy at 46.9 nm; qe is the quantum efficiency of the Au cathode of the XRD; Rref is the reflectivity of the Au cathode; and R is the resistance of the circuit. If the XRD and its circuit remains the same, the value of ‘A’ is a constant, and qe is a function of “A” which could be written as qe(A). To measure the absolute energy of the laser, qe should be calibrated. The whole XRD measurement system is calibrated on Dalian Coherent Light Source (DCLS) at a wavelength of 53 nm, and qe is calculated to be 0.13 A/μJ. Then, the absolute energy of 46.9 nm laser is ~250 μJ.
The schematic diagram of the tubular optical element is shown in Figure 1, which is machined by ultraprecision diamond turning on copper [17]. The inner face of the tube is described by a parabolic function as follows:
R 2 z = R 0 2 1 + 2 z tan ϕ
where R0 = 2.5 mm is the radius of the small end of the tube; R is the radius of the cross-section at “z” (z ∈ [0, 30], unit: mm); and ϕ = 2°. θ is the angle between the beam axis and the central axis. If θ = 0, theoretically, the 46.9 nm laser is only focused into a small point at the focal plane of the tubular element. If θ ≠ 0, then the wavefront of the 46.9 nm laser beam will be split. In this case, the interference of 46.9 nm laser occurs and the focused interference fringes are detected near the focal plane. Therefore, the laser could be focused and interfered at the same time with a slight optical aberration and a high reflectivity since most of the rays are incident to the inner surface of the tubular element at a grazing incidence.
The incidence situation of the laser beam is shown in Figure 2. As in Figure 1, θ is the angle between the beam axis and the central axis. One typical incident ray is depicted to describe the process of the focusing and interfering. θ1 is the angle between the incident ray with the tangent line of the incident point. If the ray in Figure 2 is the outermost ray of the laser beam, then θ1 refers to the divergence angle of the laser. θ2 is the angle between the incident ray with the beam axis. θ3 is the angle between the normal line of the incident point with the central axis of the tubular optical element. Then, the three angles meet the relationship below:
90 θ 1 + ( θ 2 + θ ) + ( 180 θ 3 ) = 180
It means the light distribution at the focal plane, which is the result of the ray trajectories, is determined by the face form of the inner face (described by θ3), the beam divergence (described by θ1) and the misalignment between the beam axis and the central axis of the tube. What’s more, based on Formula (4), the reflectivity of the laser beam could be estimated by calculating the range of θ1, and the number of the rays refer to each θ1.

3. Results

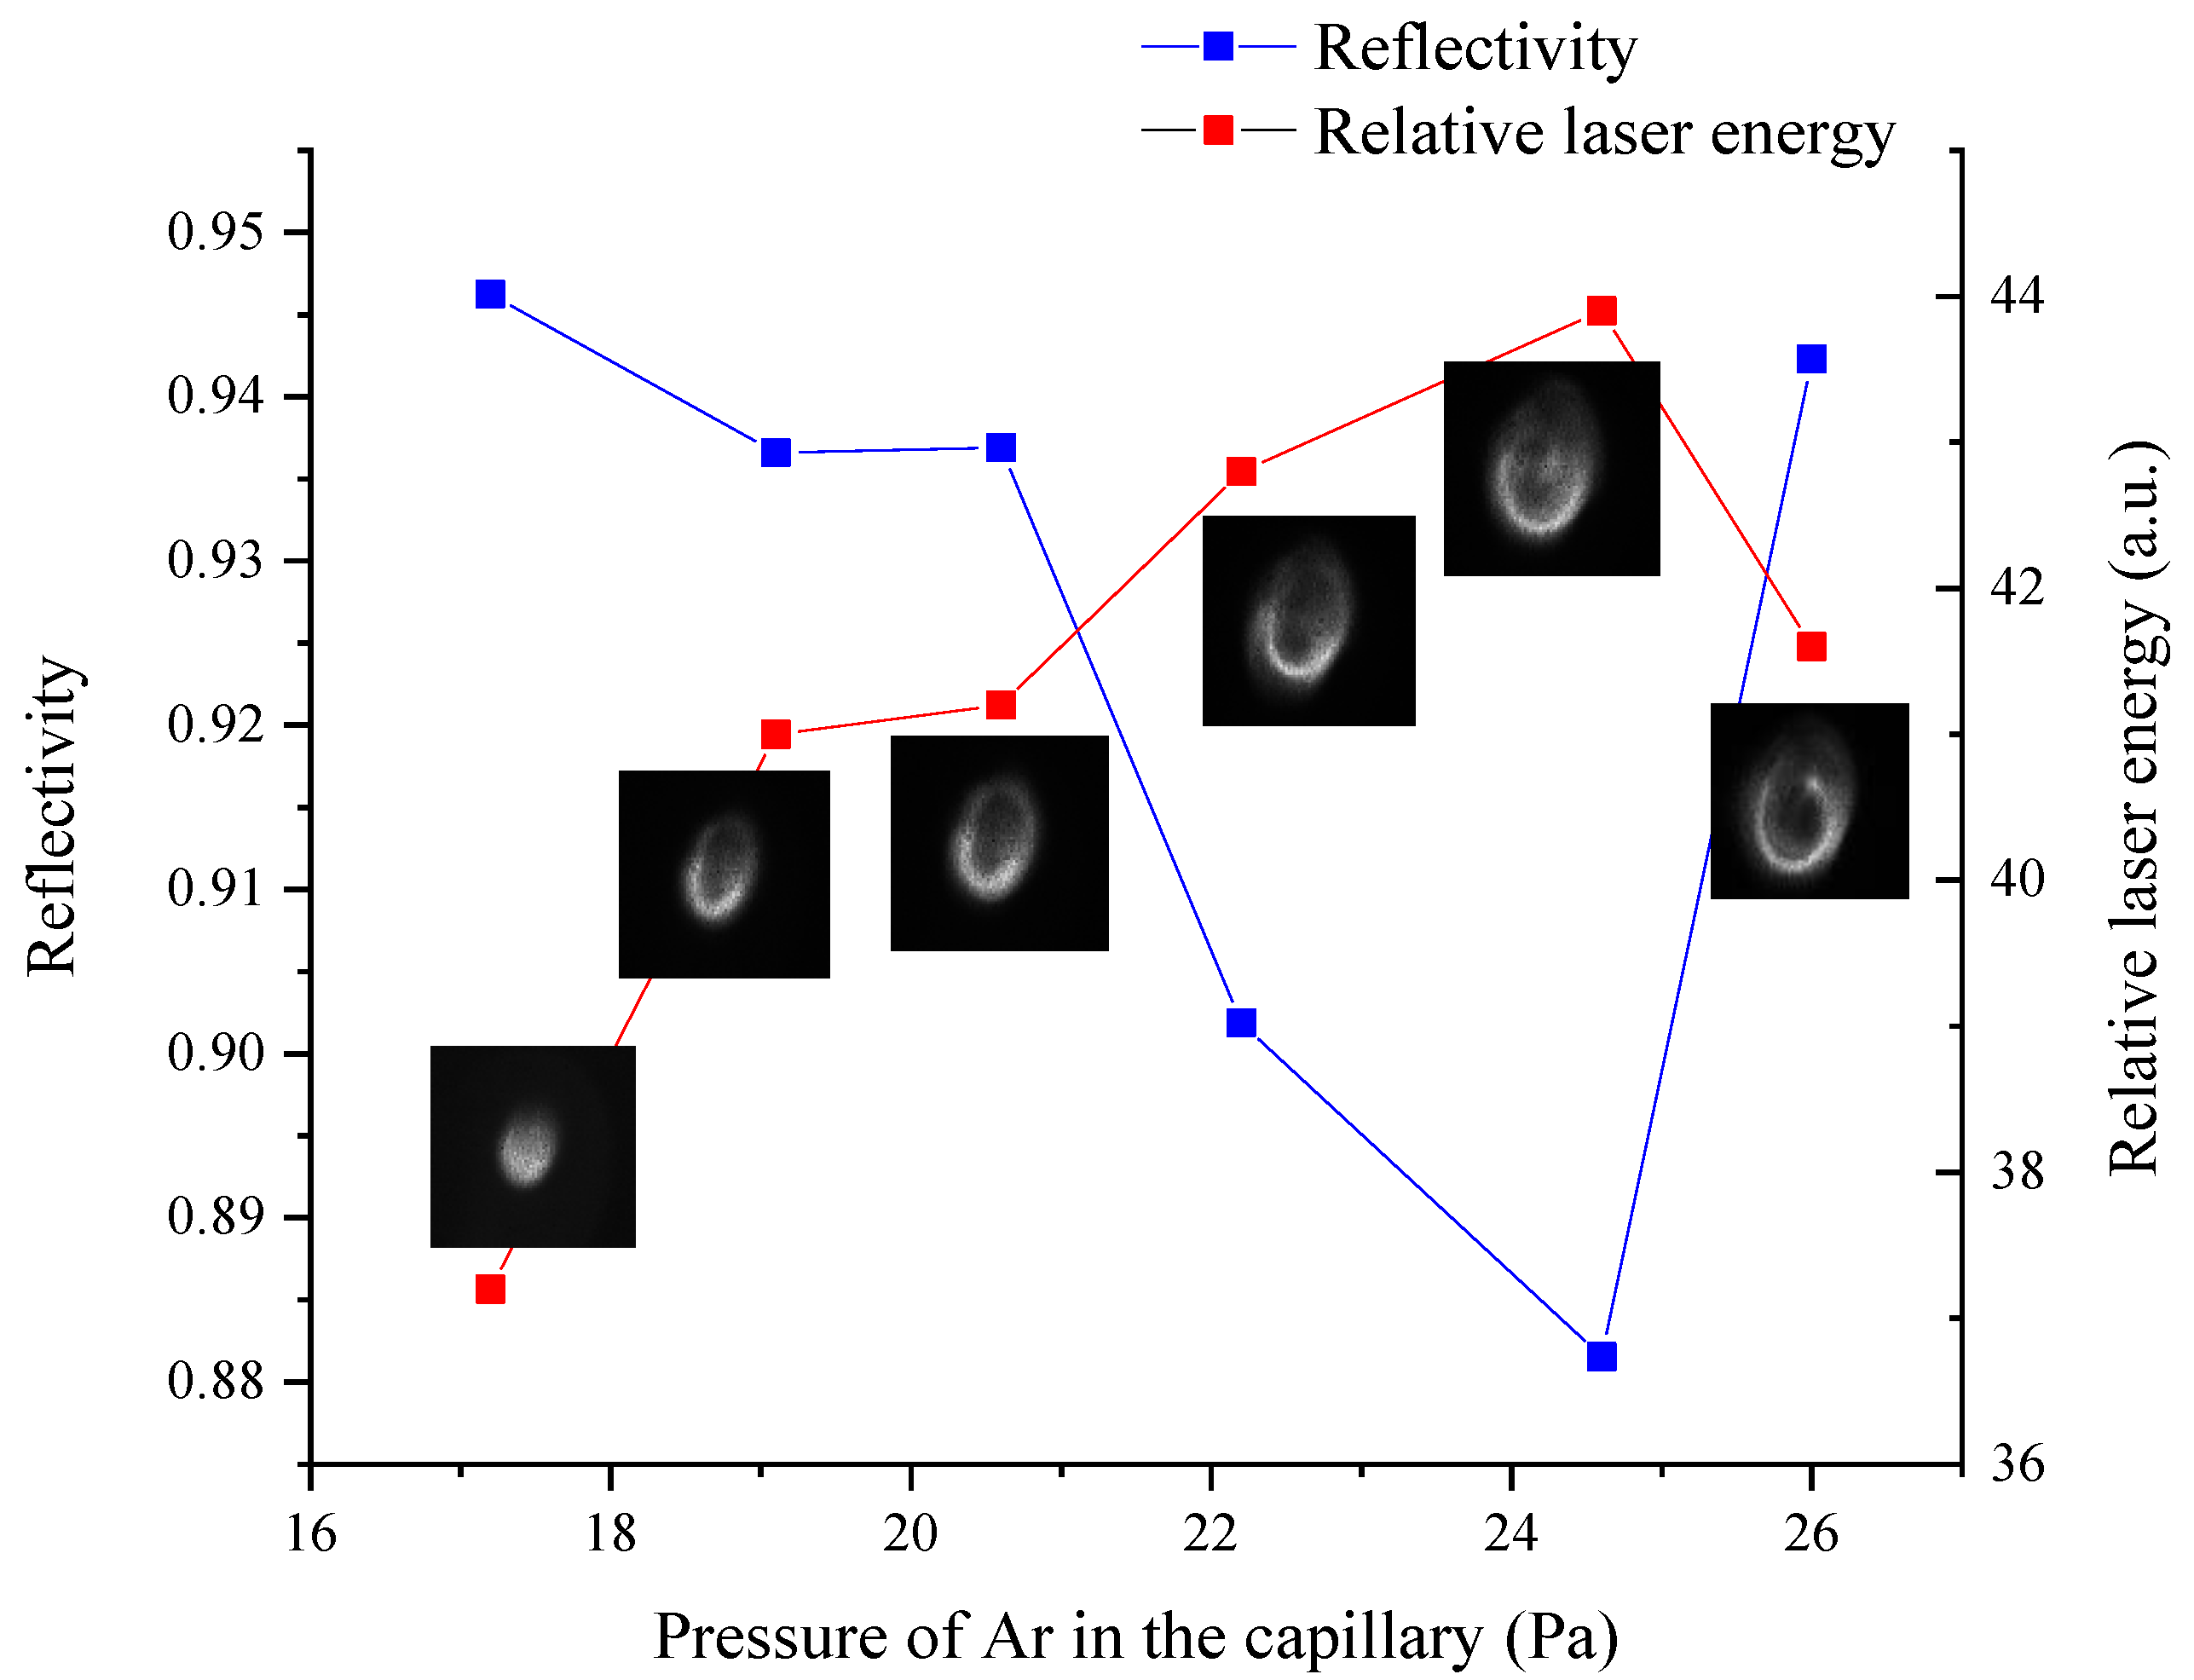
3.1. The Reflectivity Measurement

Figure 3 is the reflectivity of 46.9 nm laser measured experimentally at different grazing incident angles from 2° to 10°. A copper plate, which is made of the same material as the tubular optical element, is used to reflect the 46.9 nm laser. The plate is located on a rotating stage to change the grazing incident angle to the laser. The laser energy before and after the reflection is measured by XRD. The data shown in Figure 3 presents quite a high reflectivity at the grazing incidence. When the grazing incident angle is smaller than 4°, the reflectivity exceeds 90%. This high reflectivity at 46.9 nm at the grazing incidence indicates the feasibility of the tubular element applied to extreme ultraviolet range. The anormal reflectivity data at the grazing incident angle of 3° is supposed to be caused by the fluctuation of the 46.9 nm laser.
The x-axis and y-axis distribution of the rays at different grazing incident angles under the situation of θ = 0 is simulated by ZEMAX software. Figure 4 shows that most of the rays are concentrated at the grazing incident angle of 5°, and a peak appears at the angle between 3° and 4°. The simulated reflectivity of the tubular element at 46.9 nm could be expressed as follows:
R = 1 N θ 1 n θ 1 R θ 1
where N is the whole number of the rays involved in the simulation and nθ1 and Rθ1 are the number of the rays and the reflectivity at the grazing incident angle of θ1. The calculation is under the assumption that each ray carries the same energy. The reflectivity data shown in Figure 3 is used as Rθ1. However, because of the situation that the longitudinal length of the beam covering the copper plate is longer than the length of the copper plate with the grazing incidence angle from 0 to 2°, the reflectivity data in this range is not measured in the experiment. The missing data is filled up as follows. Firstly, the total reflection angle of copper at 46.9 nm is calculated to be 0.44°. Therefore, from 0 to 0.44°, the reflectivity is treated as 1. Secondly, to make a conservative estimation, in the range from 0.44° to 2°, the reflectivity is set as the reflectivity of 2°. Then the reflectivity in the range from 2° to 10° is interpolated according to the measured reflectivity data. With the treatment above, R is calculated to be 97.6%.
The reflectivity of the tubular element at 46.9 nm is experimentally measured under different lasing condition. According to the lasing mechanism of capillary discharge extreme ultraviolet laser, the energy distribution of the laser spot and the output energy, which could impact the measured reflectivity value, are varied with the pressure of the mixed gas of Ar and He filled in the capillary. The data in Figure 5 shows that the reflectivity of the tubular element at 46.9 nm is from 88.2% to 94.6%. The output energy of 46.9 nm laser reaches the highest at the pressure of 24.6 Pa, where the reflectivity of 46.9 nm laser is the lowest. This phenomenon could be explained by two reasons.
Firstly, there is a saturation effect of the XRD measurement in some cases. In one case, the so-called “Child-langmuir” space charge effect could cause the saturation of XRD [18]. The maximum XRD signal is determined by the Child-Langmuir space charge limited flow, which can be described by the following formula:
I = 2.34 × 10 6 A V 3 2 d 2 a m p e r e s
where A is the detector area in cm2; V is the applied Bias voltage of XRD in volts; and d is the anode cathode spacing in cm. According to the parameters of the XRD system we used in this work, the saturation current is 0.67 A, refer to the saturation voltage value (which is the ‘relative laser energy’ value shown in Figure 5) is 33.5 V. From Figure 5, the maximum voltage reaches 44 V, which means the saturation effect occurs and affects on the accuracy of the measurement. The other case is the fluence of the incident radiation. Basically, if there are too many photons incident into quite a small area of the cathode, there will not be enough electrons ionized and ejected to describe the real energy of the laser. For an area of 200 μm × 200 μm, there are 8 × 10¹⁰ Au atom at most (the cathode of the XRD is Au cathode). According to the first and second ionization energy of Au, it will cost 0.4 μJ to ionize two electrons of each Au atom in this area, which is much lower compared with the incident laser energy. In Figure 5, the lowest relatively appears at the condition where the output laser energy is the highest. That is quite reasonable since higher output laser energy brings higher fluence of the focused laser irradiated on the Au cathode, which means the saturation effect is severer and the relative focused laser energy is more underrated. In this case, the reflectivity is measured to be lower.
Secondly, according to the energy distribution of the laser spot shown in Figure 5, the diameter of the laser spot varies with the laser energy. At the pressure of 24.6 Pa, the laser spot is bigger compared with the laser spots at other pressure conditions. There may be a portion of the laser beam blocked away from the tubular element, and it does not enter the inner surface, which causes a decrease of the reflectivity. Even so, the reflectivity of the tubular element at 46.9 nm is quite acceptable compared with other optical elements used in this wavelength [19,20,21]. For FZP, the reflectivity of the first diffraction is only 10%; the third diffraction is only 10% of the first diffraction. For multi-layer mirrors, as mentioned in the “Introduction” section, the maximum reflectivity for 46.9 nm radiation at a normal incidence can reach 50%. Normally, the reflectivity is in the range of 30–50%, which is much higher than FZP but still not a satisfactory value, let alone the easy heat generation and heat accumulation, which cause the degeneracy of the mirror. Ir mirror for EUV radiation focusing provides an even lower reflectivity of 15%. It can be noticed that the measured reflectivity is slightly lower than the reflectivity calculated by Formula (5). This could be explained by the light scattering by the inner surface with a higher roughness than that of the copper plate and the fact of θ ≠ 0 in the real experimental situation. The latter causes an extended range of θ1, according to Formula (4). In this case, more rays refer to a lower reflectivity and cause a decrease on the overall reflectivity of the laser beam.

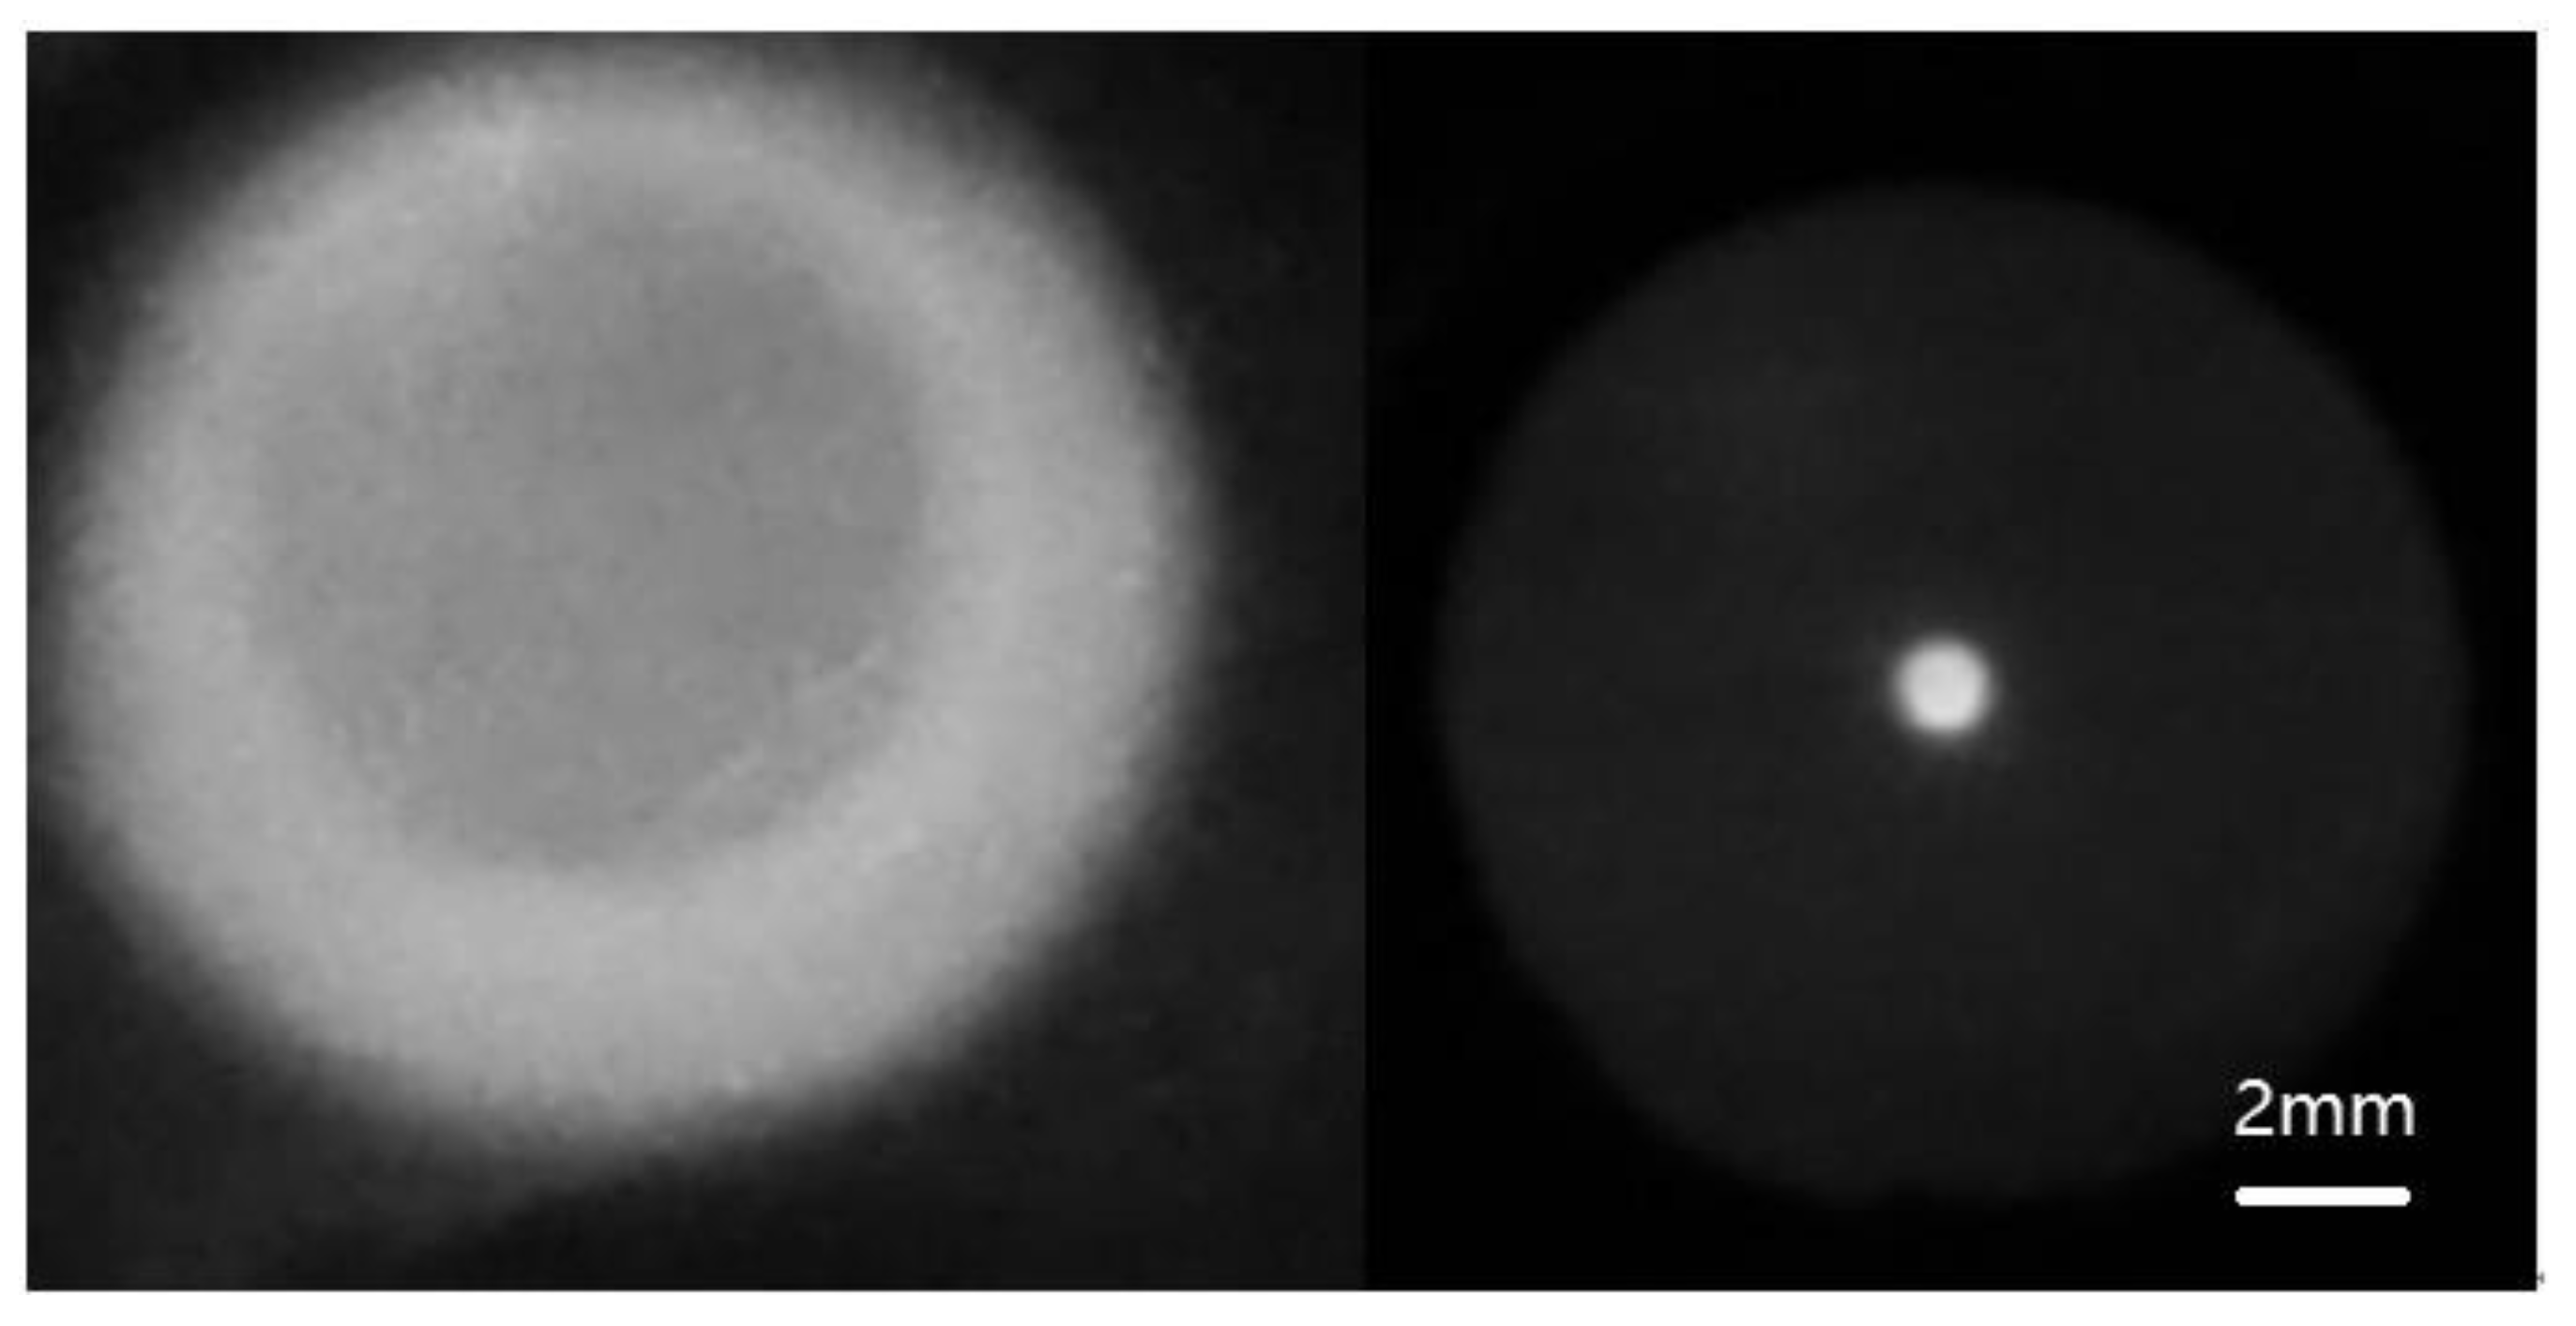
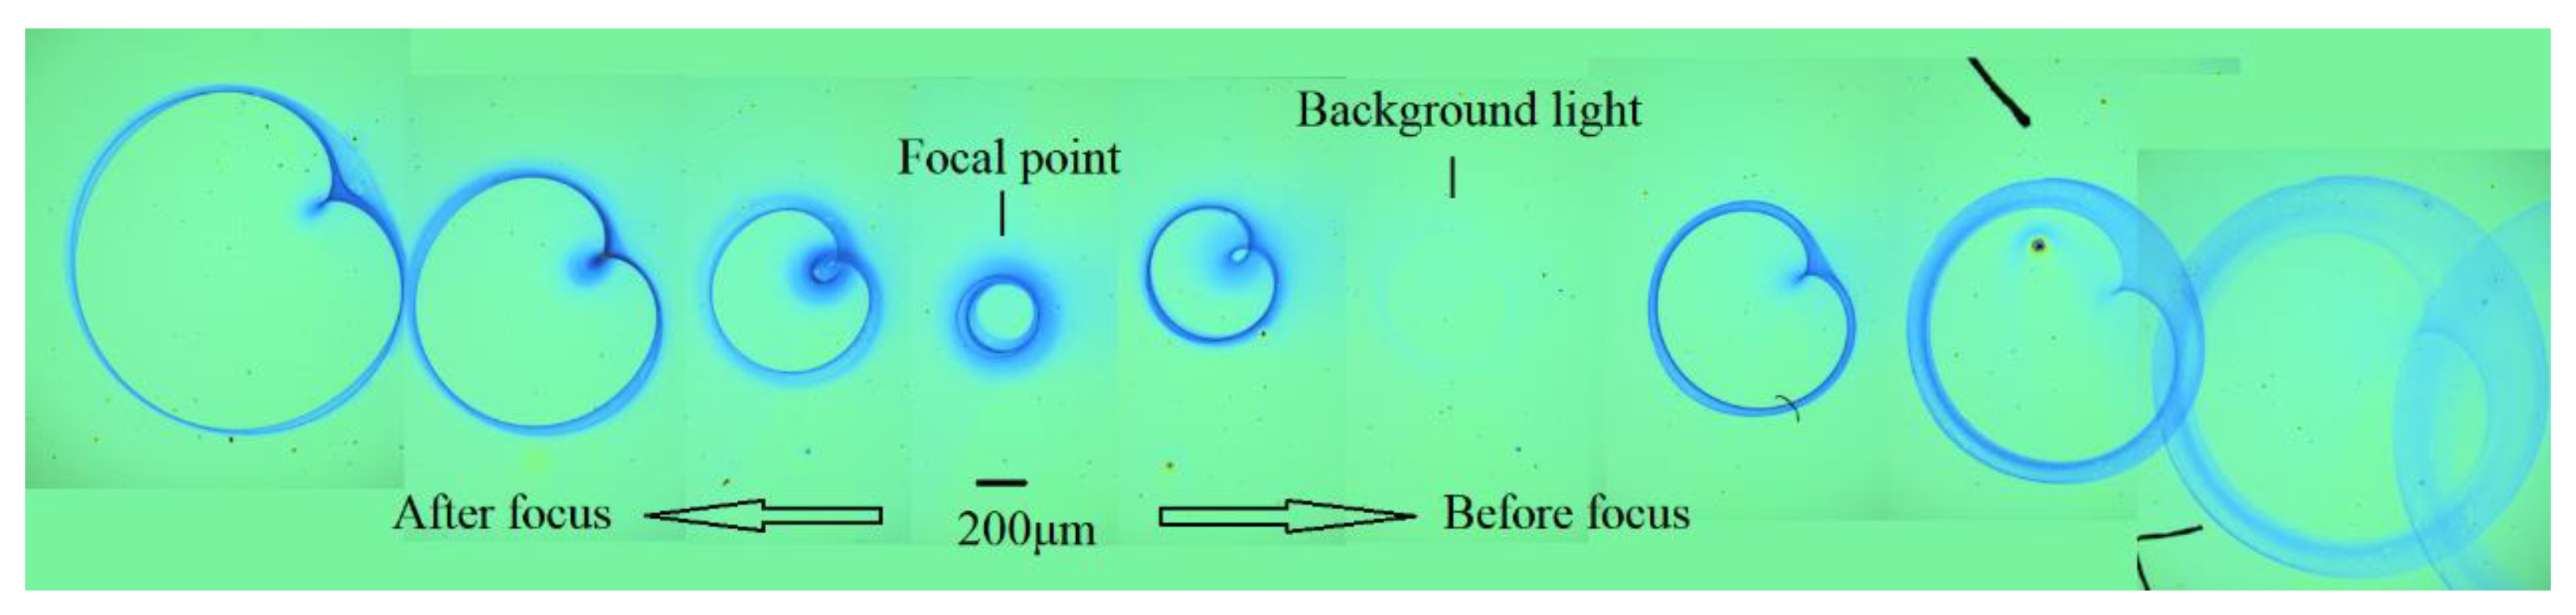
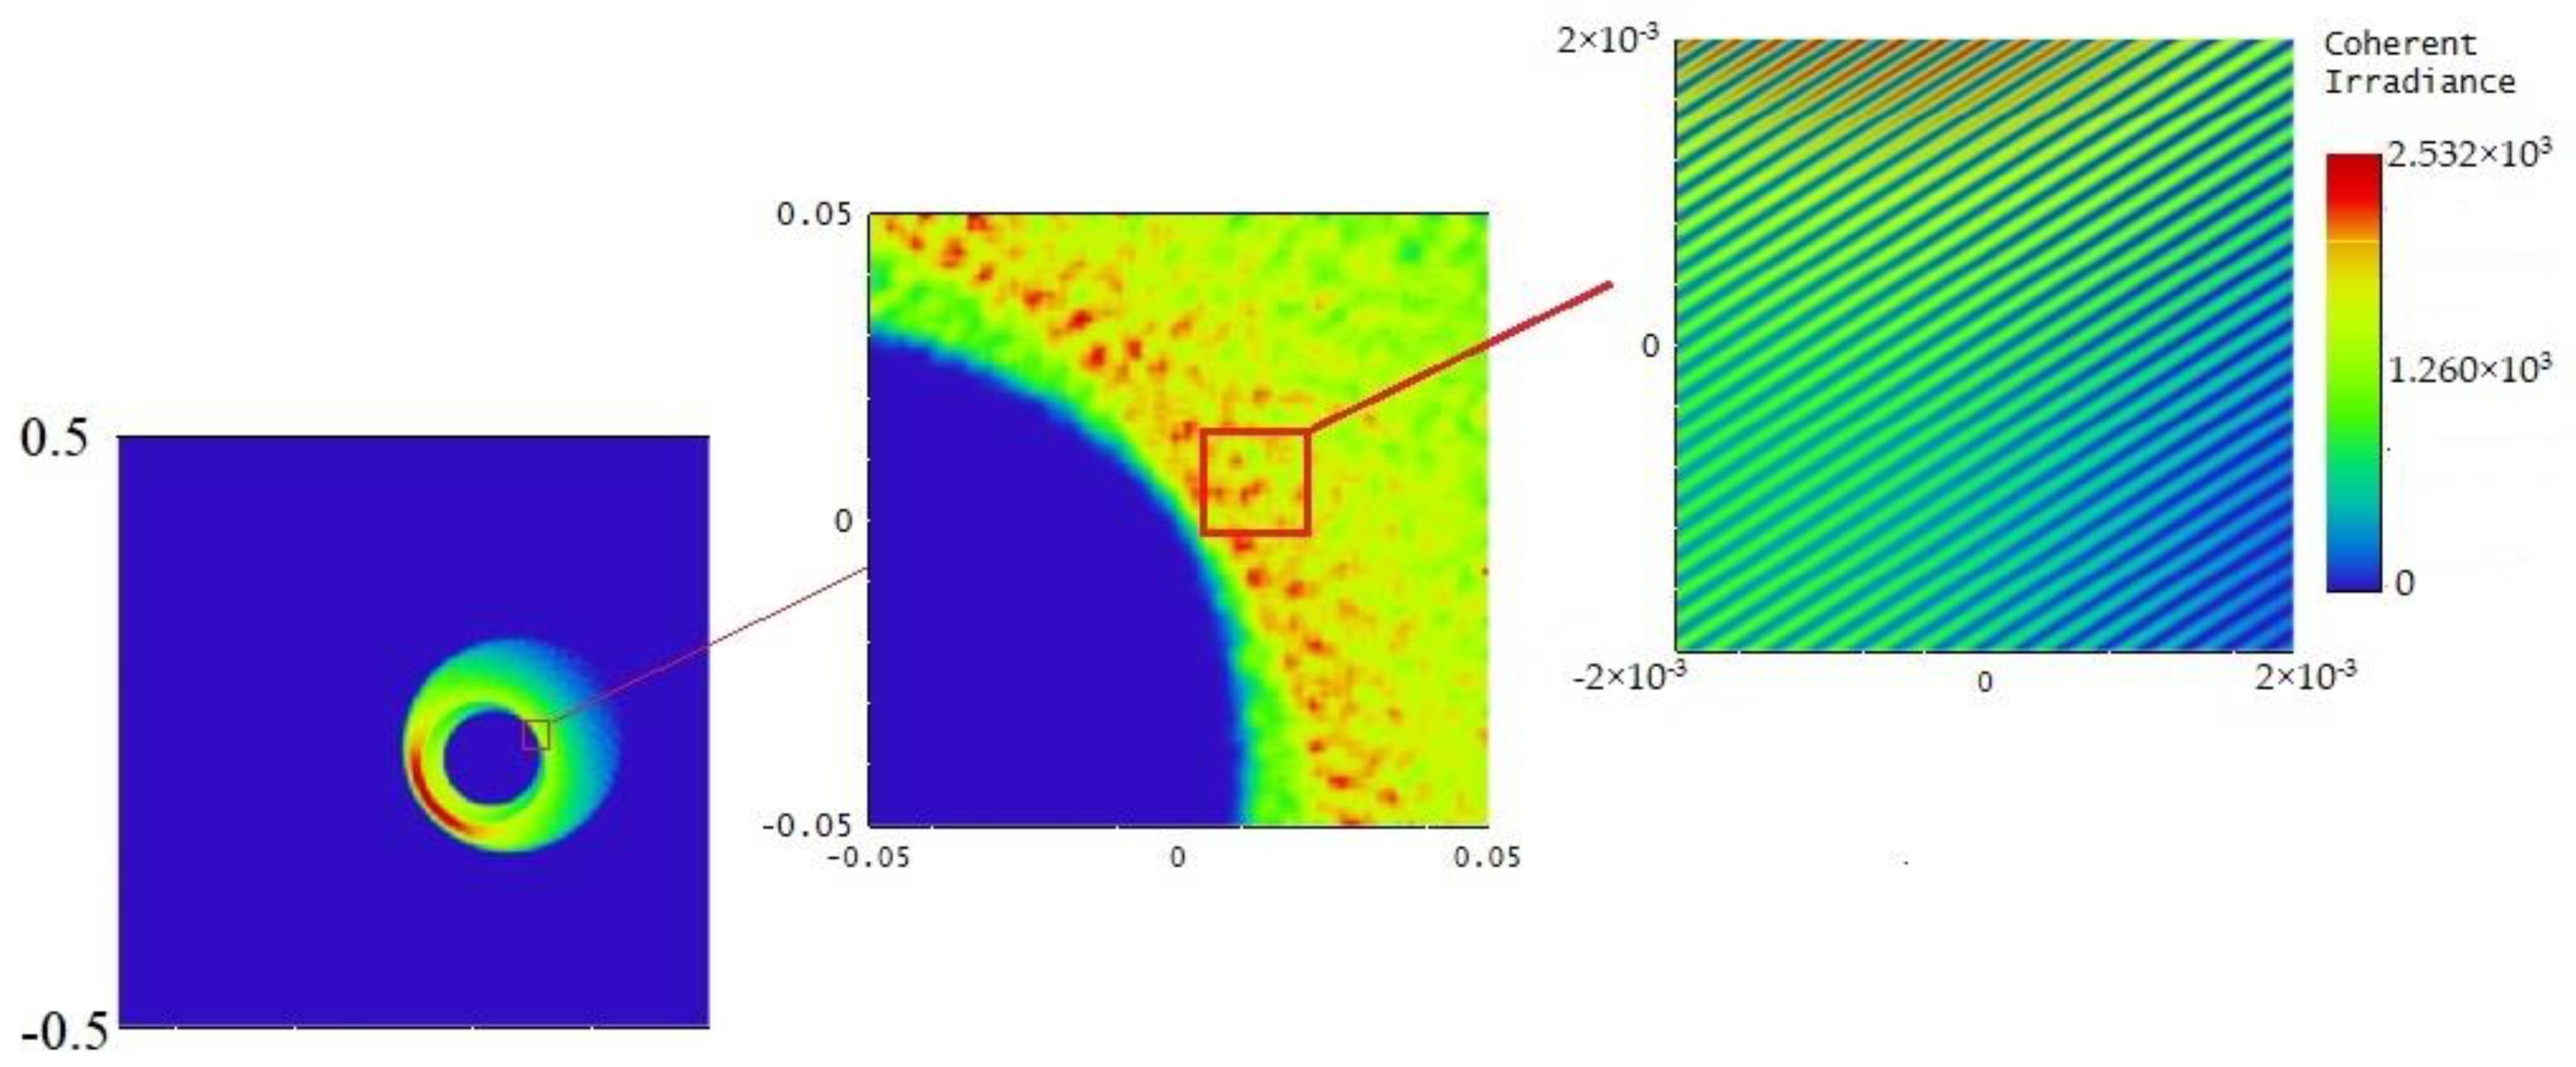
3.2. The Focusing and Interfering of 46.9 nm Laser

A Ce:YAG scintillator is used to catch the focused 46.9 nm laser spot, as shown in Figure 6. The left spot is the spot caught after the tubular element but far away from the focal plane. The right one is the laser spot caught at the focal plane. It is obvious that the 46.9 nm is tightly focused by the tubular element. To detect the detail characteristics, the focused 46.9 nm laser spot is recorded by PMMA (molecular weight of 950 k) with single shot exposure. In Figure 7, the diameter of the spot is decreasing when the position of PMMA is approaching the focal plane. The tubular element is positioned at θ = 0.3° tilted to x-axis and θ = 0.2° tilted to y-axis. Then the wavefront of 46.9 nm laser is split and interfered. The diameter of the focused spot at focal plane is about 330 μm. The “background light” position marked in Figure 7 refers to the background light spot recorded at the same position along the beam axis with the first one on its left. This result is to prove that the other patterns shown in Figure 7 are recorded by 46.9 nm laser, not the background light accompanying the 46.9 nm laser output.
The detail of the focused spot is detected by atomic force microscopy (AFM) and shown in Figure 8. Clear and intense interference fringes with a period of ~150 nm is detected, indicating the wavefront splitting of 46.9 nm laser by the tubular element. The wavefront splitting is simulated by ZEMAX software and shown in Figure 9. The fringes are caught by the detector at coherent irradiance mode. The period of the fringes is ~143 nm, which is quite close to the measured value shown in Figure 8. From the cross-section profile shown in Figure 8, the depth of the fringes is not exactly uniform. There are mainly two reasons that cause this phenomenon. Firstly, from Figure 5 in the manuscript, the energy distribution of the original laser spot is not perfectly symmetrical. That is normal for a capillary discharge laser since the gain medium of the laser is an instantaneously formed plasma column, which could not be formed perfectly symmetrical. With this laser spot, the focus spot has an overall uneven energy distribution. Secondly, with this asymmetric original laser spot and the angle “θ” in Figure 2, the intensity distribution of the splitting beams is different. That could also cause the depth difference. The period of the fringes is also not as uniform as the simulated one. That is mainly because of the diffraction of the beam. When the laser enters and exits out from the tubular element, the edge rays are diffracted by the element. Therefore, when the beam’s interference occurs, the diffraction effect is also involved and causes the period difference of the interference fringes.
The superiority of this tubular element is that it could focus and split the EUV laser at the same time, which means it can generate focused interference fringes. That’s why the clear fringes in Figure 8 could be recorded with only single laser pulse exposure. For the previous research on the interference of 46.9 nm laser [10,11,12], no matter the wavefront splitting or the amplitude division, hundreds of EUV laser pulses are needed to radiate at the same position to generate interference fringes. The output energy of the EUV laser is on the same order of magnitude with the energy of the laser used in this work. Therefore, the main reason for this big difference is that the optical elements could not focus and split the laser together in the previous work. With this tubular element, interference fringes with adjustable period could be processed on various materials with only single laser pulse, which provide the laser micro/nano-processing method with high efficiency.
The period of the interference fringes could be described by the following formula:
d = λ 2 sin φ
where λ is the wavelength of the radiation source and φ is the angle related to the two interfered beams, which is determined by the angles in Formula (4). According to the period of the fringes and the wavelength of 46.9 nm, φ is calculated to be 9.5°. To make the period of the fringes smaller, the angle of the interference beams “φ” after the reflection by the inner surface should be decreased. That means, the inner surface form, the incidence angle, the angle between the beam axis and the axis of the element and even the divergence of the incident beam should be considered together to reduce “φ”. To make the fringes more intense, the focus of the element should be tighter. Generally, tighter focus means bigger grazing incident angle, which will decrease the whole reflectivity of the beam and make the fringes less intense. Therefore, if one expects more intense fringes with smaller periods, there are several contradictions that need to be solved and balance points that need to be found. If the inner surface form and the incidence situation of 46.9 nm could be optimized, more intense interference fringes with smaller periodic are expected, which is quite a promising method to create nano-scale grating-like periodic structures with extreme ultraviolet lasers.

4. Conclusions

In this work, a tubular optical element is used to focus 46.9 nm laser and to make intense interference fringes generated by wavefront splitting. The reflectivity of the optical element exceeds 90% with a slighter optical aberration compared with other optical elements used in extreme ultraviolet at a grazing incidence. Grating-like nanostructures with a periodic of ~150 nm is achieved processing on PMMA with quite high contrast. The results indicate that 46.9 nm laser is quite a suitable radiation source to be used in laser nano-processing, and the focusing of the interference fringes allows 46.9 nm laser interferometry lithography to be operated with single-shot exposure mode.

Author Contributions

Conceptualization, H.C.; methodology, H.C.; software, Z.W.; validation, S.W.; formal analysis, H.A.; investigation, Z.W.; resources, J.W. and Y.Z.; data curation, Z.W.; writing—original draft preparation, H.C.; writing—review and editing, H.C.; supervision, Y.Z.; project administration, H.C.; funding acquisition, H.C. and J.W. All authors have read and agreed to the published version of the manuscript.

Funding

This research was funded by the National Natural Science Foundation of China, grant number 62005066 and 52035009.

Institutional Review Board Statement

Not applicable.

Informed Consent Statement

Not applicable.

Data Availability Statement

Data available on request due to restrictions, e.g., privacy or ethical.

Acknowledgments

The authors gratefully acknowledge the Dalian Coherent Light Source (DCLS) for support and assistance.

Conflicts of Interest

The authors declare no conflict of interest.

References

  1. Rocca, J.J.; Hammarsten, E.C.; Jankowska, E.; Filevich, J.; Marconi, M.C.; Moon, S.; Shlyaptsev, V.N. Application of Extremely Compact Capillary Discharge Soft X-ray Lasers to Dense Plasma Diagnostics. Phys. Plasmas 2003, 10, 2031–2038. [Google Scholar] [CrossRef]
  2. Kuznetsov, I.; Filevich, J.; Dong, F.; Woolston, M.; Chao, W.; Anderson, E.H.; Bernstein, E.R.; Crick, D.C.; Rocca, J.J.; Menoni, C.S. Three-Dimensional Nanoscale Molecular Imaging by Extreme Ultraviolet Laser Ablation Mass Spectrometry. Nat. Commun. 2015, 6, 6944. [Google Scholar] [CrossRef] [PubMed]
  3. Vaschenko, G.; Etxarri, A.; Menoni, C.; Rocca, J.; Hemberg, O.; Bloom, S.; Chao, W.; Anderson, E.; Attwood, D.; Lu, Y.; et al. Nanometer-Scale Ablation with a Table-Top Soft X-ray Laser. Opt. Lett. 2006, 31, 3615–3617. [Google Scholar] [CrossRef] [PubMed]
  4. Green, T.; Kuznetsov, I.; Willingham, D.; Naes, B.E.; Eiden, G.C.; Zhu, Z.; Chao, W.; Rocca, J.J.; Menoni, C.S.; Duffin, A.M. Characterization of Extreme Ultraviolet Laser Ablation Mass Spectrometry for Actinide Trace Analysis and Nanoscale Isotopic Imaging. J. Anal. At. Spectrom. 2017, 32, 1092–1100. [Google Scholar] [CrossRef]
  5. Attwood, D. Wave propagation and refractive index at X-ray and EUV wavelengths. In X-rays and Extreme Ultraviolet Radiation: Principles and Applications, 2nd ed.; Cambridge University Press: Cambridge, UK; New York, NY, USA, 2016; pp. 61–65. [Google Scholar]
  6. Zhang, Z.; Li, W.; Huang, Q.; Zhang, Z.; Yi, S.; Pan, L.; Xie, C.; Wachulak, P.; Fiedorowicz, H.; Wang, Z. A Table-Top EUV Focusing Optical System with High Energy Density Using a Modified Schwarzschild Objective and a Laser-Plasma Light Source. Rev. Sci. Instrum. 2018, 89, 103109. [Google Scholar] [CrossRef] [PubMed]
  7. Benware, B.; Ozols, A.; Rocca, J.; Artioukov, I.; Kondratenko, V.; Vinogradov, A. Focusing of a Tabletop Soft-X-ray Laser Beam and Laser Ablation. Opt. Lett. 1999, 24, 1714–1716. [Google Scholar] [CrossRef] [PubMed]
  8. Rossall, A.K.; Aslanyan, V.; Tallents, G.J.; Kuznetsov, I.; Rocca, J.J.; Menoni, C.S. Ablation of Submicrometer Holes Using an Extreme-Ultraviolet Laser. Phys. Rev. Appl. 2015, 3, 064013. [Google Scholar] [CrossRef]
  9. Korobenko, A.; Rashid, S.; Heide, C.; Naumov, A.; Reis, D.; Berini, P.; Corkum, P.; Vampa, G. In-Situ Nanoscale Focusing of Extreme Ultraviolet Solid-State High Harmonics. Phys. Rev. X 2022, 12, 041036. [Google Scholar] [CrossRef]
  10. Capeluto, M.G.; Vaschenko, G.; Grisham, M.; Marconi, M.C.; Luduena, S.; Pietrasanta, L.; Lu, Y.; Parkinson, B.; Menoni, C.S.; Rocca, J.J. Nanopatterning with Interferometric Lithography Using a Compact/Spl Lambda/=46.9-Nm Laser. IEEE Trans. Nanotechnol. 2006, 5, 3–7. [Google Scholar] [CrossRef]
  11. Wachulak, P.; Capeluto, M.; Marconi, M.; Patel, D.; Menoni, C.; Rocca, J. Nanoscale Patterning in High Resolution HSQ Photoresist by Interferometric Lithography with Tabletop Extreme Ultraviolet Lasers. J. Vac. Sci. Technol. B 2007, 25, 2094–2097. [Google Scholar] [CrossRef]
  12. Wachulak, P.; Grisham, M.; Heinbuch, S.; Martz, D.; Rockward, W.; Hill, D.; Rocca, J.; Menoni, C.; Anderson, E.; Marconi, M. Interferometric Lithography with an Amplitude Division Interferometer and a Desktop Extreme Ultraviolet Laser. J. Opt. Soc. Am. B-Opt. Phys. 2008, 25, B104–B107. [Google Scholar] [CrossRef]
  13. Zhao, Y.; Cui, H.; Zhang, W.; Li, W.; Jiang, S.; Li, L. Si and Cu Ablation with a 46.9-Nm Laser Focused by a Toroidal Mirror. Opt. Express 2015, 23, 14126–14134. [Google Scholar] [CrossRef] [PubMed]
  14. Cui, H.; Zhao, Y.; Khan, M.; Zhao, D.; Fan, Z. Study of Thermal Effect in the Interaction of Nanosecond Capillary Discharge Extreme Ultraviolet Laser with Copper. Appl. Sci. 2020, 10, 214. [Google Scholar] [CrossRef]
  15. Zhao, Y.; Zhao, D.; Yu, Q.; Khan, M.; Lu, H.; Li, J.; Cui, H. Influence of He Mixture on He Pulse Amplitude and Spatial Distribution of an Ne-like Ar 46.9 Nm Laser under Gain Saturation. J. Opt. Soc. Am. B-Opt. Phys. 2020, 37, 2271–2277. [Google Scholar] [CrossRef]
  16. Li, J.; Cui, H.; Zhao, D.; An, B.; Zhao, Y. Influence of Ar-He Mixture Gas Pressure on Output Characteristics of Ne-like Ar 46.9 Nm Laser. Acta Opt. Sin. 2022, 42, 1134022. [Google Scholar]
  17. Wang, Z.; Zhang, J.; Li, G.; Xu, Z.; Zhang, H.; Zhang, J.; Hartmaier, A.; Fang, F.; Yan, Y.; Sun, T. Anisotropy-related machining characteristics in ultra-precision diamond cutting of crystalline copper. Nanomanuf. Metrol. 2020, 3, 123–132. [Google Scholar] [CrossRef]
  18. Spielman, R.B.; Anthes, J.P. A study of bare X-ray diode saturation due to a high fluence X-ray pulse. AIP Conf. Proc. 1981, 75, 278–279. [Google Scholar]
  19. Pershyn, Y.; Zubarev, E.; Voronov, D.; Sevryukova, V.; Kondratenko, V.; Vaschenko, G.; Grisham, M.; Menoni, C.; Rocca, J.; Artioukov, I.; et al. Mechanisms of Radiation Damage to Sc/Si Multilayer Mirrors under EUV Laser Irradiation. J. Phys. D-Appl. Phys. 2009, 42, 125407. [Google Scholar] [CrossRef]
  20. Bravo, H.; Szapiro, B.; Wachulak, P.; Marconi, M.; Chao, W.; Anderson, E.; Menoni, C.; Rocca, J. Demonstration of Nanomachining With Focused Extreme Ultraviolet Laser Beams. IEEE J. Sel. Top. Quantum Electron. 2012, 18, 443–448. [Google Scholar] [CrossRef]
  21. Ritucci, A.; Tomassetti, G.; Reale, A.; Arrizza, L.; Zuppella, P.; Reale, L.; Palladino, L.; Flora, F.; Bonfigli, E.; Faenov, A.; et al. Damage and Ablation of Large Bandgap Dielectrics Induced by a 46.9 Nm Laser Beam. Opt. Lett. 2006, 31, 68–70. [Google Scholar] [CrossRef] [PubMed]
Figure 1. Schematic diagram of the tubular optical element.
Photonics 10 00629 g001
Figure 2. Incidence situation of the laser beam.
Photonics 10 00629 g002
Figure 3. The reflectivity of the copper plate at 46.9 nm.
Photonics 10 00629 g003
Figure 4. The x-axis and y-axis distribution of the rays at different grazing incident angles simulated by ZEMAX software.
Photonics 10 00629 g004
Figure 5. Reflectivity of the tubular element at 46.9 nm under different lasing condition.
Photonics 10 00629 g005
Figure 6. The focused 46.9 nm laser spot caught by a scintillator.
Photonics 10 00629 g006
Figure 7. The focused spot recorded by PMMA at different positions along the beam axis.
Photonics 10 00629 g007
Figure 8. The focused interference fringes at the focal plane.
Photonics 10 00629 g008
Figure 9. Simulated wavefront splitting and the interference fringes.
Photonics 10 00629 g009
Disclaimer/Publisher’s Note: The statements, opinions and data contained in all publications are solely those of the individual author(s) and contributor(s) and not of MDPI and/or the editor(s). MDPI and/or the editor(s) disclaim responsibility for any injury to people or property resulting from any ideas, methods, instructions or products referred to in the content.

