Communication

New Method for Measuring the Scattering Phase Function of Micron/Nano Particles

1
College of Energy and Power Engineering, Northeast Electric Power University, Jilin 132012, China
2
School of Energy and Power Engineering, Shandong University, Qingdao 266237, China
3
Jilin Polytechnic of Water Resources and Electric Engineering, Changchun 130117, China
*
Author to whom correspondence should be addressed.
Photonics 2023, 10(5), 511; https://doi.org/10.3390/photonics10050511
Submission received: 14 March 2023 / Revised: 19 April 2023 / Accepted: 23 April 2023 / Published: 28 April 2023
(This article belongs to the Topic Advance and Applications of Fiber Optic Measurement)

Abstract

:
The scattering phase function is crucial to analyze the light transport in the micron/nano particle suspensions. A new method including a liquid–particle system and reference system is proposed to measure the scattering phase function of the liquid–particle suspensions. In this method, a reference system of a standard particle is used to obtain the correction factor to compensate for the influence of the cuvette. Experimental validation was conducted for monodisperse silicon dioxide microspheres and monodisperse polystyrene microspheres. By considering the influence of the cuvette, both theoretical and experimental analyses prove that the proposed method can achieve a good result in the measurement of the scattering phase function of liquid–particle suspensions for particles with unknown size parameters and optical constants, especially when the size parameter of the particle is larger than 10. The correction factors of scattering light distribution of silicon dioxide microsphere suspensions with various mean particle sizes were obtained and analyzed. This method provides an alternative and simple way of measuring the scattering phase function of micron/nano particle suspensions.

1. Introduction

The propagation of radiation through micron/nano particles has important applications in energy, chemistry, medicine, atmospheric aerosol science, and radiation heat transfer [1]. The scattering phase function of micron/nano particles is generally used for the optical characterization of the investigated medium and can be determined through experimental measurements or theoretical calculations [2,3,4]. However, theoretical arithmetic can be employed to calculate the scattering phase function for particles of regular shape, but it is not available for particles with unknown size distribution and composition [5]. Therefore, the experimental approach is a more reasonable and convenient way to obtain the scattering phase function of the particle.
To understand the behavior and connections behind light scattering from particles and measured light scattering distributions, several experimental methods have been advanced [6]. These methods can be classified as follows: Elastic scattering spectroscopy [7,8], phase-sensitive detection method [9], LISST-VSF instrument [10,11,12], nephelometry method [13,14,15,16], Fourier transform light scattering method [17,18], microscopic method [19], volume scattering function (VSF) meter [20], and elliptical mirror method [21]. Elastic scattering spectroscopy (ESS) is a novel neutron scattering spectroscopy used to measure the dynamics of complex biological systems. It is a non-invasive optical technique that measures changes in the physical properties of cells [7,8]. Phase-sensitive detection is a powerful tool for reducing detector noise; therefore, it is very important in infrared spectroscopy measurements [9]. The LISST-VSF is the world’s first autonomous underwater instrument for measuring the volume scattering function (VSF) in water with depolarization capabilities. However, the LISST-VSF’s “eyeball” optics may need to be calibrated to obtain accurate VSF measurements in clear ocean water [10,11,12]. Nephelometry determines the turbidity of a suspension by directly measuring the intensity of light scattered by insoluble particles in the solution. Typically, the scattered light is measured at a certain angle relative to the incident light source to avoid interference from any transmitted light [13,14,15,16]. Fourier transform light scattering is a method for reconstructing angle-resolved light scattering (ARLS) that can extend the angular range from a single spherical object [17,18]. However, this method is only applicable to 3D symmetric objects. Microscopic method is a method for detecting and imaging sub-wavelength objects by interfering with the light scattered by the object with a reference light field [19]. Additionally, both photonic jets and whispering gallery modes can be captured using optical imaging techniques. For example, near-field scanning optical microscopy (NSOM) can be used to observe nanoscale jetting phenomena, while spectrometers can be used to measure the spectral lines of whispering gallery modes [22,23]. Volume scattering function (VSF) instruments are a new optical method for measuring the volume scattering function using image detection. The instrument is designed based on the combination of two reflectors and uses a unique measurement principle to quickly measure scattering at multiple angles simultaneously [20]. An ellipsoidal mirror scatterometer can be used to measure the scattering from rough surfaces. It uses an ellipsoidal mirror to direct light onto the rough surface and collects the scattered light, directing it onto a CCD camera [21]. All of the above methods can measure the scattering phase function with high accuracy and are applied in different fields. The main difference between these methods is whether the detector is in direct contact with the sample being measured.
The scattering phase function represents the spatial distribution of the scattered energy of particles. Spherical particles in particle suspensions are usually randomly oriented; therefore, the scattering phase function is independent of the azimuthal angle and is only a function of the polar angle. For samples contained in cylindrical glass vessels, there are two main design schemes for scattering measurements [1], as shown in Figure 1: (a) The detector rotates inside of the sample chamber; (b) the detector rotates outside of the transparent sample chamber. The design of the former type (a) will limit the size of the instrument but mitigate the sensitivity of the rotating periscope (or detector) to the scattered light since the sticky substance attaches easily to the detector. The design of the latter type (b) can help in overcoming the shortage of the former type; nevertheless, it makes the detector signal dependent on the quality of the cuvette (sample vessel) wall. This dependent can be avoided by considering the influence of a transparent sample chamber; however, the measurement error on the accuracy of scattering phase function induced by the cuvette wall has not been well discussed.
This work aims to propose a simple method to obtain the high-precision scattering phase function of particles and compensate for the influence of the cuvette. To measure the scattering phase function of particles in a cuvette, a reference system is used to eliminate the influence of the cuvette wall. A comparison of the accuracy between the experimental method and theoretical simulations is presented. In this work, the monodisperse silicon dioxide spheres and monodisperse polystyrene microspheres with known optical constants and particle diameter distribution are considered as examples to verify this new method for measuring the scattering phase function of particles. The scattering phase function of microalgae with different concentrations was measured and analyzed.

2. Experimental Measurement and Sample Characteristics

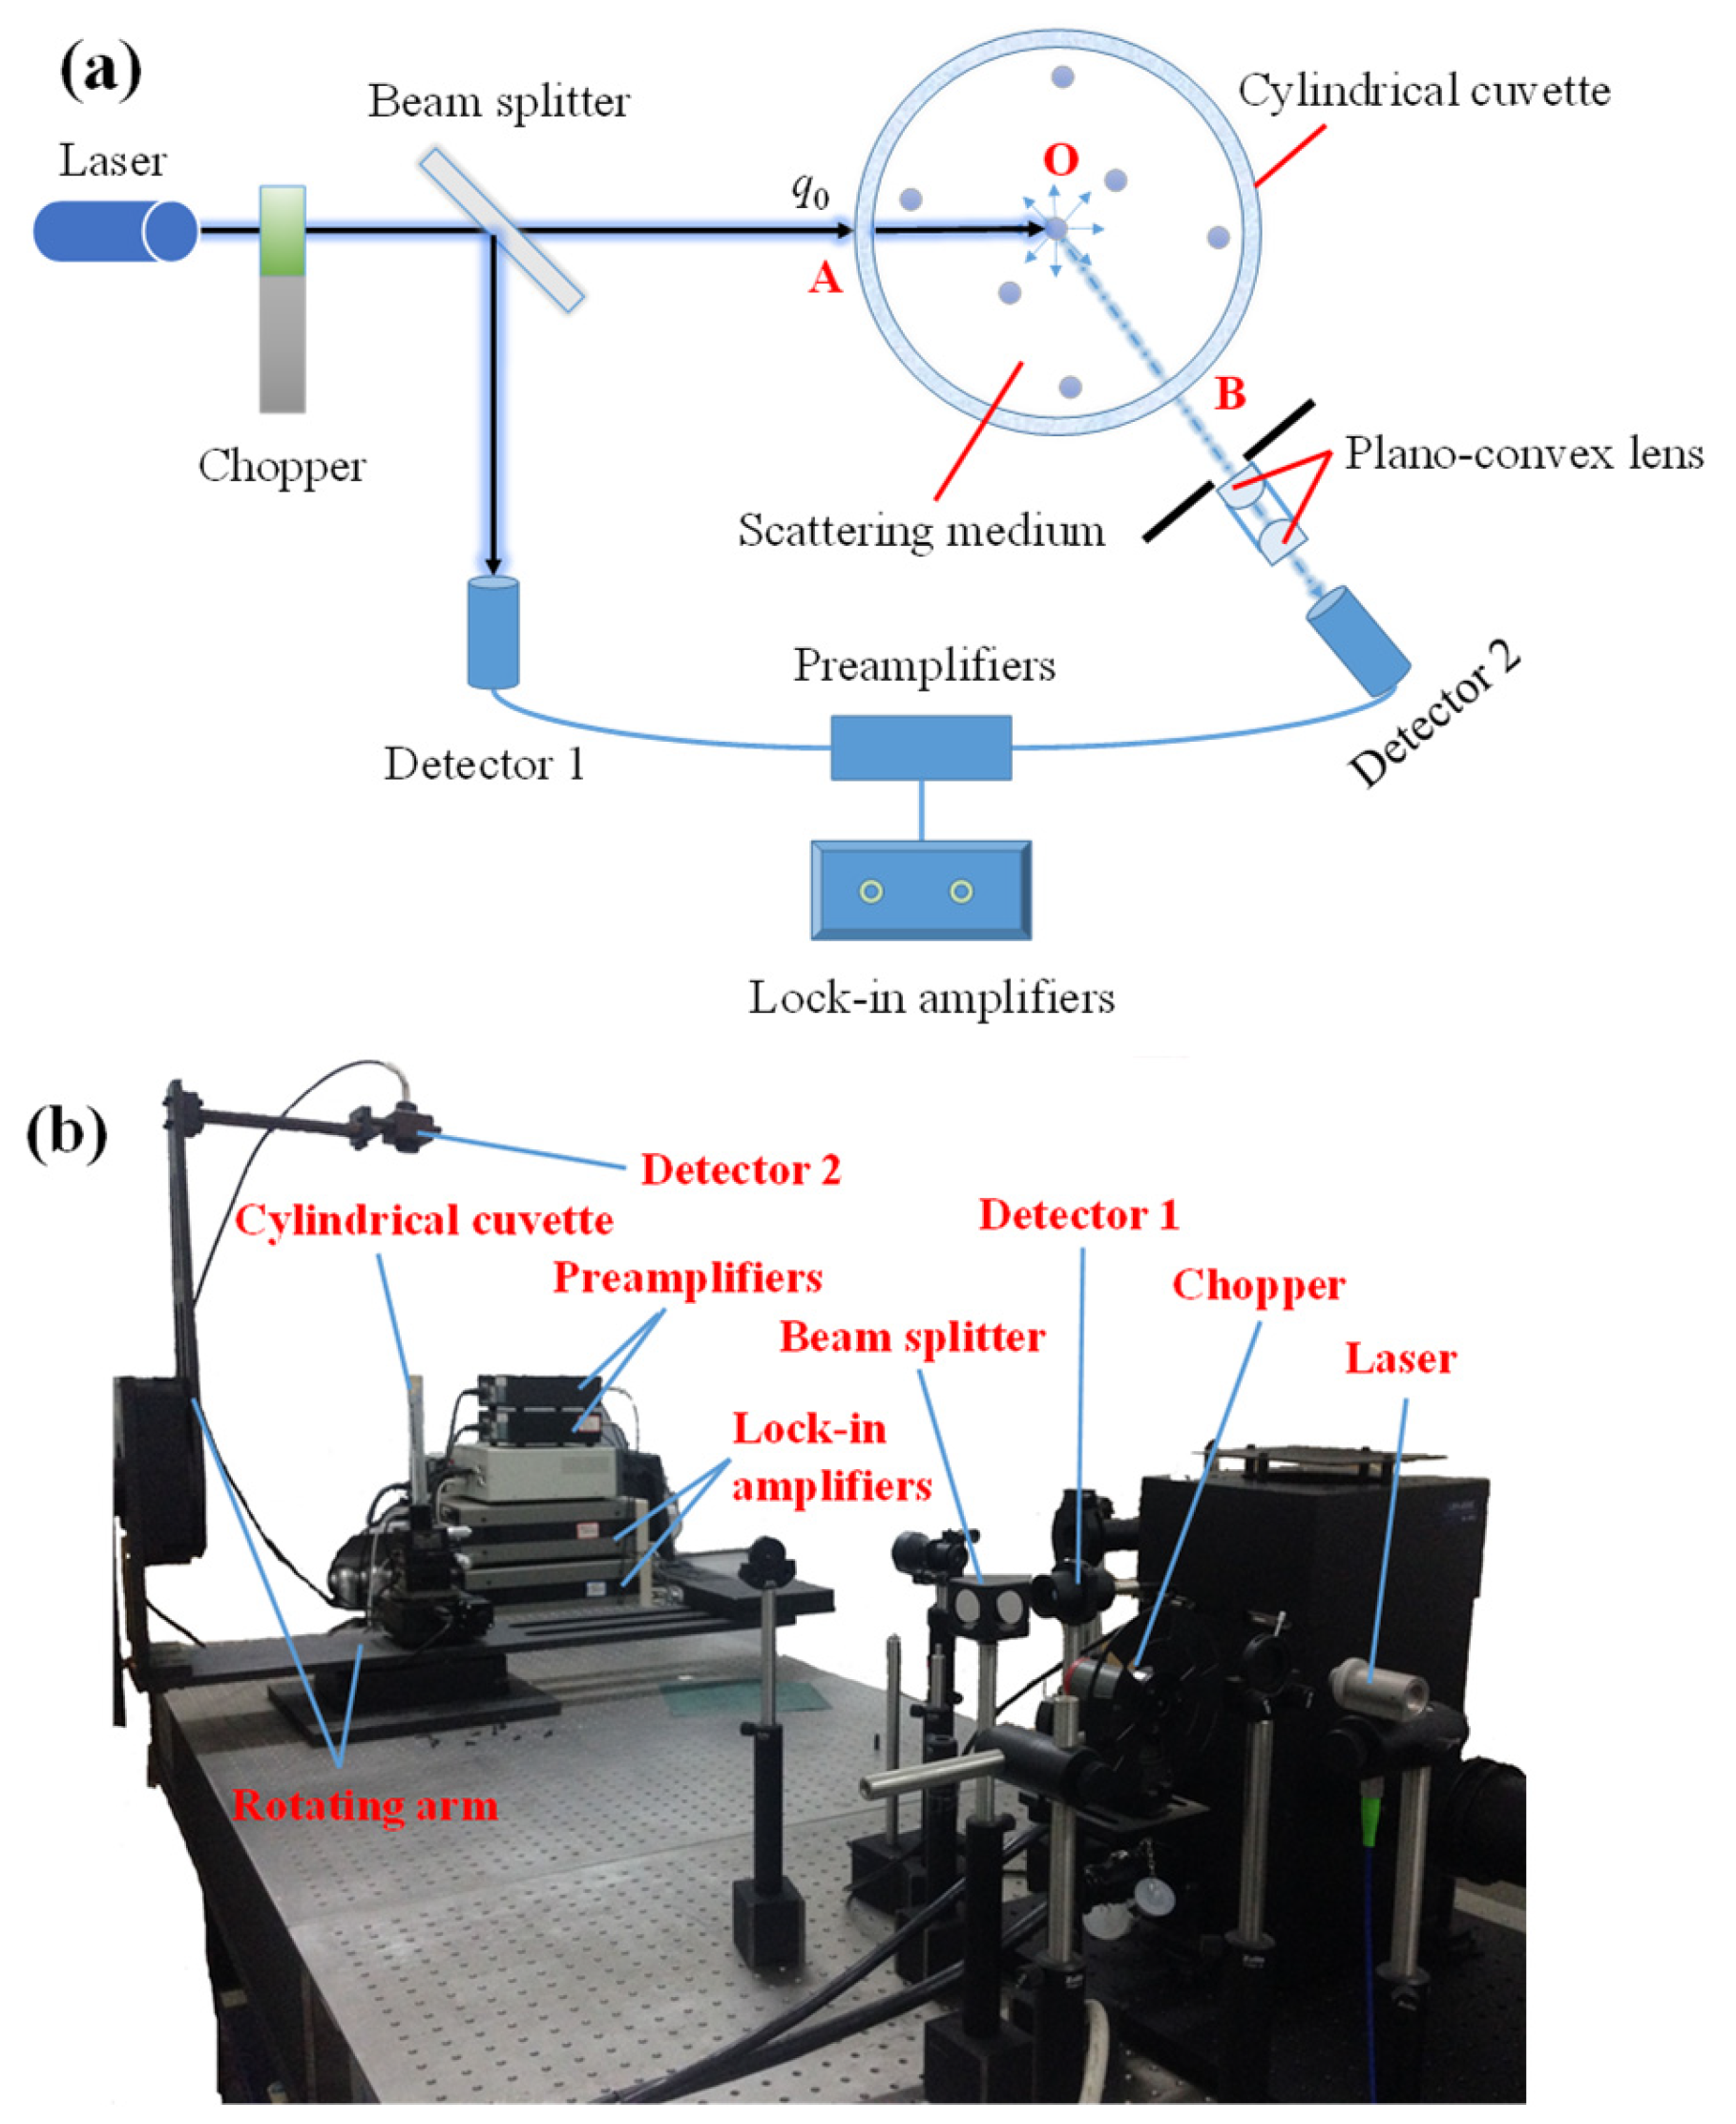
2.1. Experimental Method

In measuring the scattering phase function of micron/nano particles, the samples are diluted to proper concentrations to ensure that single scattering prevails. Figure 2 shows the schematic diagram of the proposed method and experimental setup. As shown, typical designs for the scattering measurement of particle suspensions consist of a light source, the cuvette, the detector, and the rotating arm. A stepper motor is used to rotate the detector around the sample at specific steps. These setups typically use an He–Ne laser as a light source at 532 nm. The rotating arm and detector are controlled by a computer while the light source is controlled manually. Two highly linear SM1PD1A photodiode detectors of the same type are used in this experimental setup: Detector 1 measures the reflected light flux through a cubic beam splitter; detector 2 monitors the transmitted light flux through the beam splitter. The advantage of using two detectors for the scattering measurement is to simultaneously obtain the incident and the scattered light fluxes in order that a slight drift of the laser output light does not affect the measurement result [24]. The distance between detector 2 and the cuvette is 485 mm. Two preamplifiers are used to maintain a low bias across the photodiodes. The output signals of two detectors are automatically phase-locked by using two lock-in amplifiers; therefore, the effect of background in the measured result can be eliminated.
Here, q O is the incident collimated light at point A where the laser light enters the scattering medium. The detector is placed at an angle to the incident direction of light at the center O. Two plano-convex lenses were also placed in the path of the beam before they entered detector 2. The detector receives only the light scattered by the particles within the plane of the laser beam and the detector, and the contribution of particles above and below this plane to the scattered light can be neglected.
For a single scattering axisymmetric medium subjected to collimated irradiation, the light flux at point O, along the path of the light beam after attenuation along AO ( L OA ) [25,26] can be obtained as:
q O = q 0 t cuv e β eff L OA
where t cuv is the transmittance of the cuvette; β eff is the effective extinction coefficient. The detected light flux by a detector at a scattering angle Θ can be calculated from [27]:
q detect Θ = q 0 t cuv 2 e β eff L OA + L OB σ Φ Θ Δ Ω 4 π G Θ
where L OB is the path of the light beam alone OB; σ is the scattering coefficient of the scattering medium; Φ Θ is the scattering phase function of the scattering medium; Δ Ω is the solid angle of detector 2; G Θ is the interaction coefficient between the scattering medium and cuvette. The scattering phase function of particles can be obtained as:
Φ Θ = q detect Θ q 0 Δ Ω × 4 π t cuv 2 e β eff L OA + L OB σ G Θ
The standard particles are considered as a reference system, and the scattering phase function of the reference system is written as:
Φ Ref Θ = q detect . Ref Θ q 0 Δ Ω × 4 π t cuv 2 e β eff . Ref L OA + L OB σ Ref G Θ
By using Equations (3) and (4), we have:
Φ Θ Φ Ref Θ = q detect Θ q detect . Ref Θ × X
where q detect Θ / q detect . Ref Θ represents the ratio of the light flux detected by the detector of the system under test at the scattering angle Θ to the light flux received by the detector of the reference system with standard particles; X = e β eff . Ref σ Ref / e β eff σ is the correction factor. Equation (5) indicates that the ratio of the scattering phase function of the scattering medium to the reference system is only related to the received signal of the detector and X . It can be seen that the reference system can be used to compensate for the influence of the cuvette. Note that the correction factor X may not always be constant, which is related to the effective extinction coefficient and the scattering coefficient of the scattering medium.
For further understanding the effect of the effective extinction coefficient and the scattering coefficient on the accuracy of the correction factor X , based on Lorenz–Mie theory, a theoretical analysis of the extinction efficiency factor and scattering efficiency factor with different size parameters and optical constants of the particle is conducted as shown in Figure 3. In the analysis, the size parameter of the particle varies from 0.1 to 1000. From the figure, the extinction efficiency factor Qext and the scattering efficiency factor Qsca under varying optical constants agree well with each other when the size parameter is larger than 10. It is observed that the difference between them will be more significant for refractive indices which are equal to 1.5, 2, 2.5, and 3. However, the absorption index has no clear influence on the change in the extinction efficiency factor and scattering efficiency factor in this research. Therefore, it is noted that the correction factor can be considered as a constant and modified the scattering phase function when the size parameter of the particle is greater than 10.
Here, the scattering light distribution of the scattering medium obtained by the experimental approach can be expressed as:
S EXP Θ = q D , 2 Θ a q D , 1 Θ Δ Ω
where q D , 1 Θ denotes the received signal of detector 1; q D , 2 Θ denotes the received signal of detector 2; a is the ratio of the beam splitter and different sensitivities of detectors 1 and 2. In this work, the scattering light distribution of the reference system S EXP , Ref Θ was measured and compared with the theoretical value of the scattering phase function calculated by Lorenz–Mie theory. The correction factor X Θ at the scattering angle Θ can be computed as:
X Θ = S EXP , Ref Θ Φ Mie Θ
By using the correction factor to correct the scattering light distribution of the scattering medium, the high precision value of the scattering phase function is obtained by:
Φ Θ = S EXP Θ / X Θ
Note that the normalization processing of the scattering phase function Φ Θ is also needed. Each sample should be measured several times under different magnifications by using a preamplifier to increase the measurement accuracy.

2.2. Experimental Uncertainty

In this proposed method, the experimental uncertainty of the scattering phase function is obtained by the following equations. The scattering phase function of each sample was measured 10 times. The average scattering phase function is given as:
Φ ¯ EXP = 1 M 1 M Φ M
where M = 10 denotes the number of measurements. The combined standard uncertainty of the scattering phase function can be expressed as:
Δ Φ EXP = 1 M × M 1 1 M T M Φ ¯ EXP 2

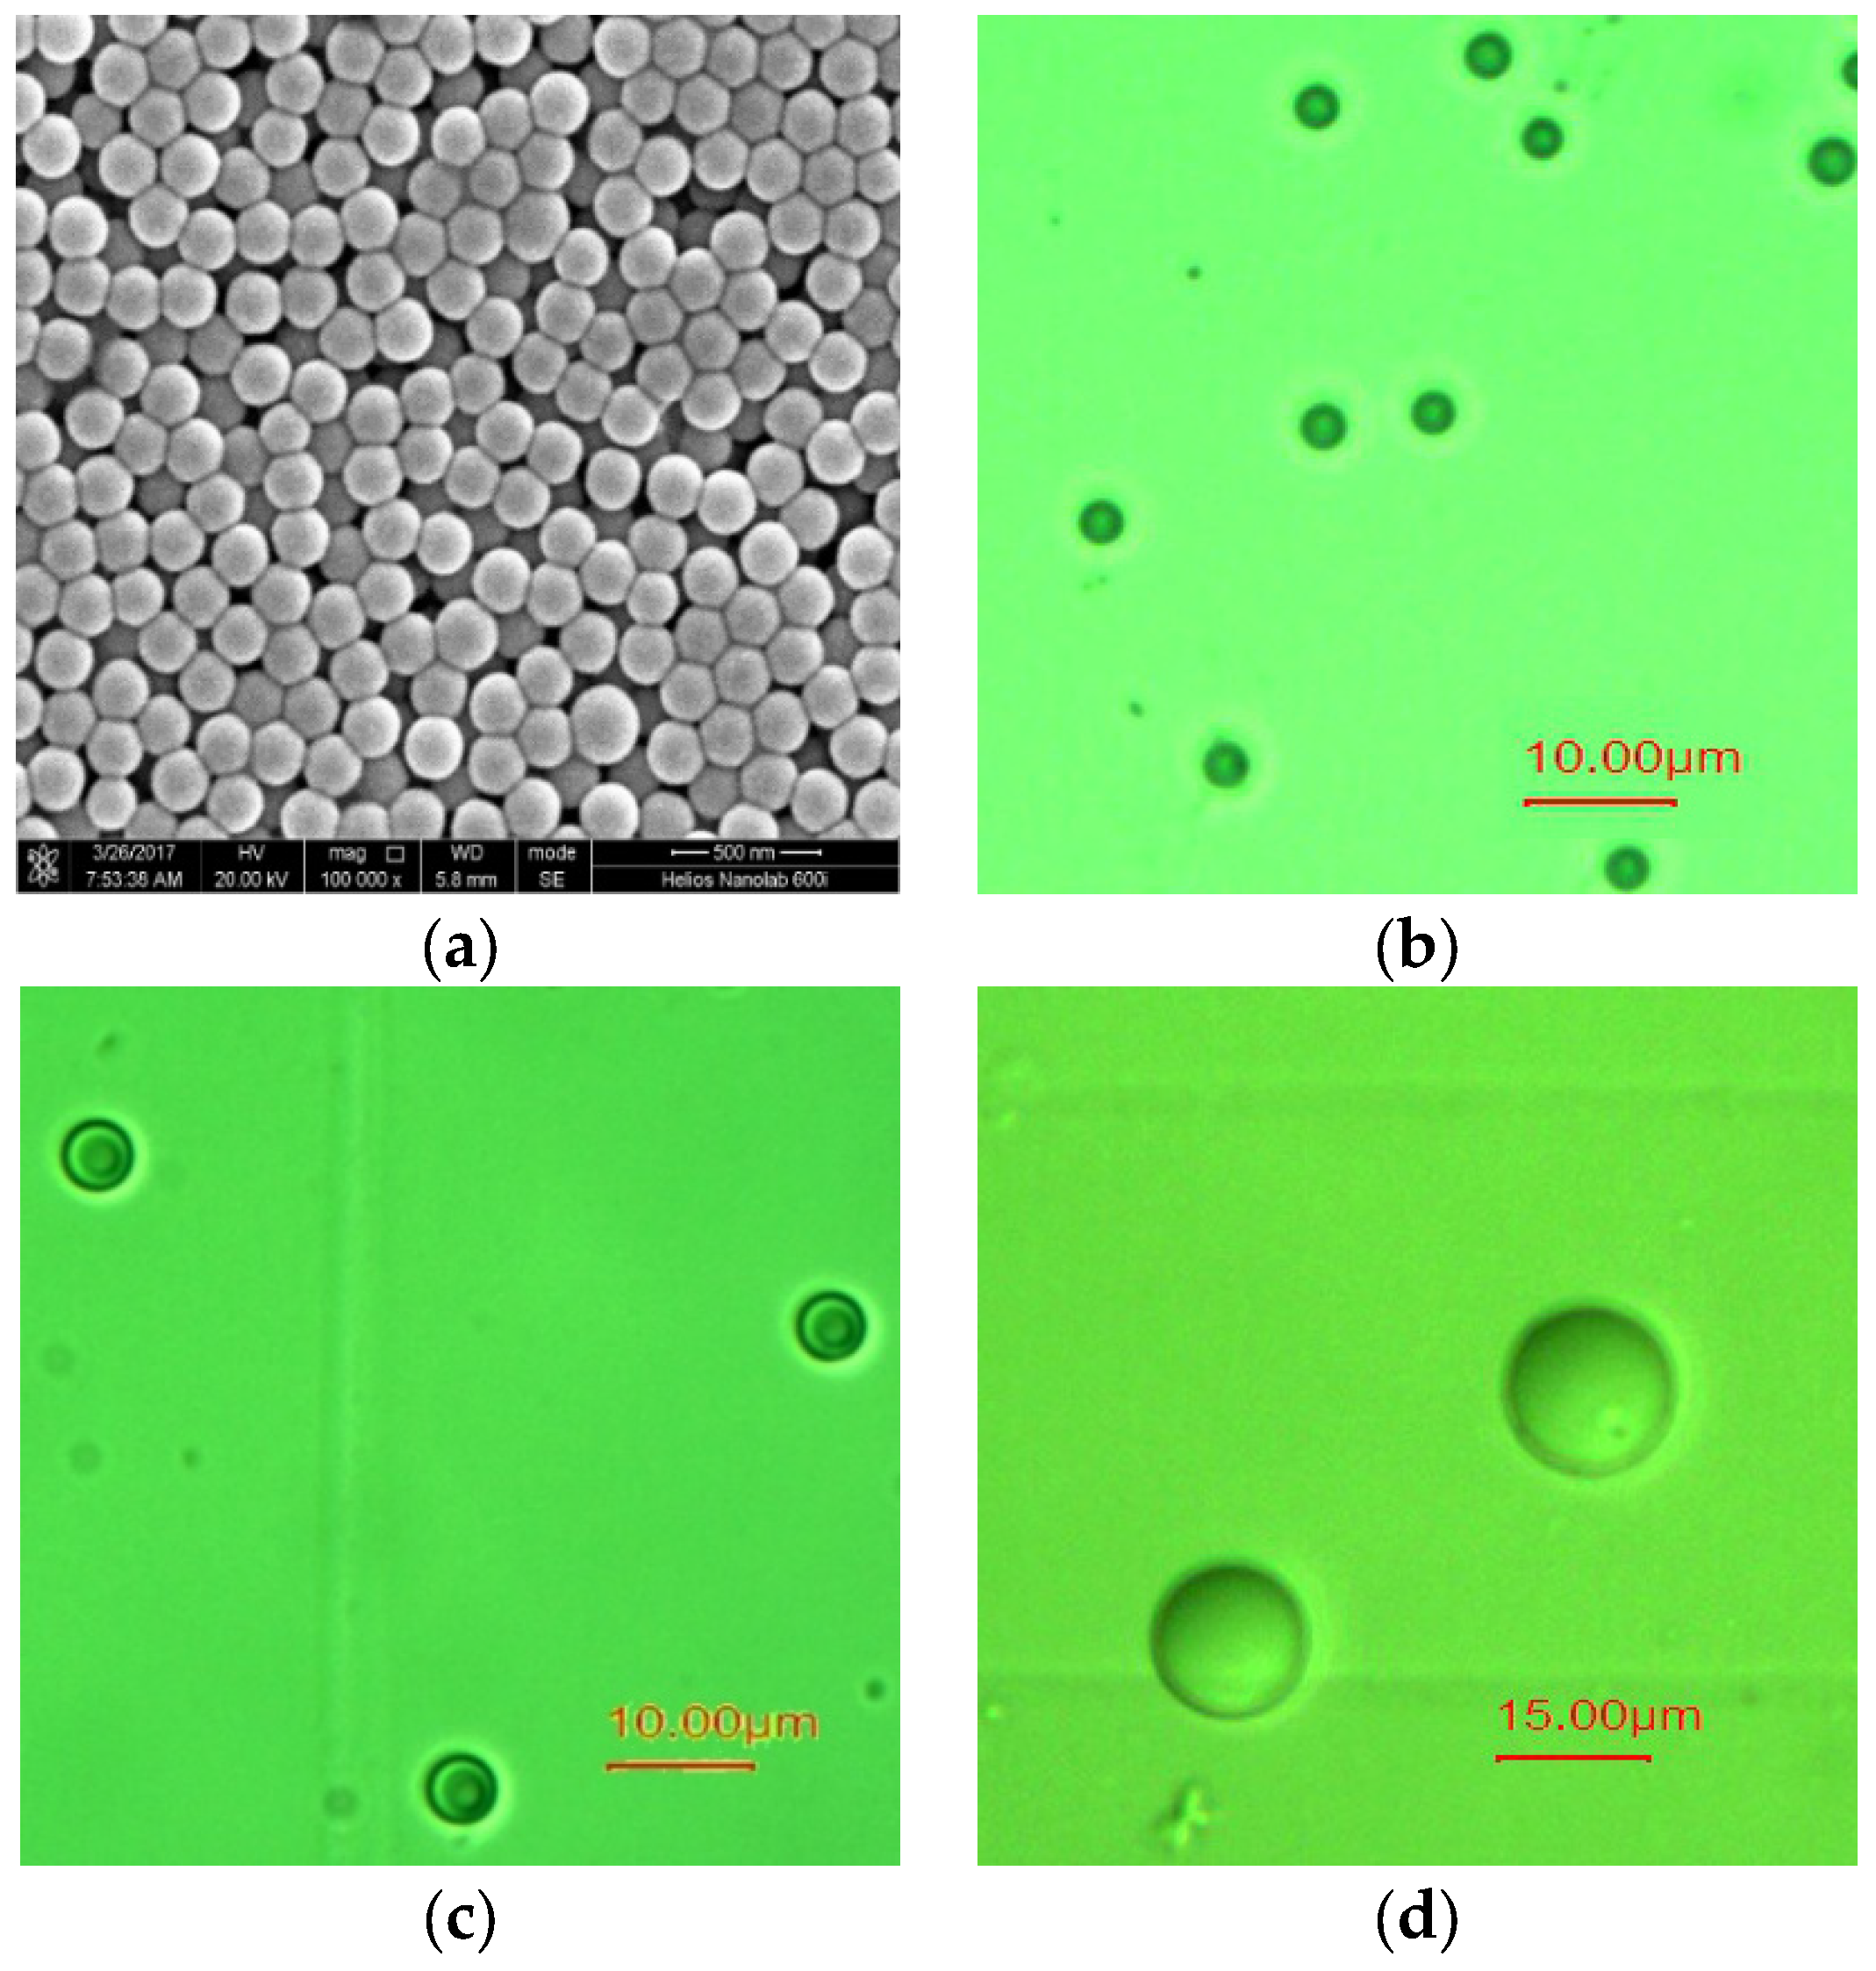
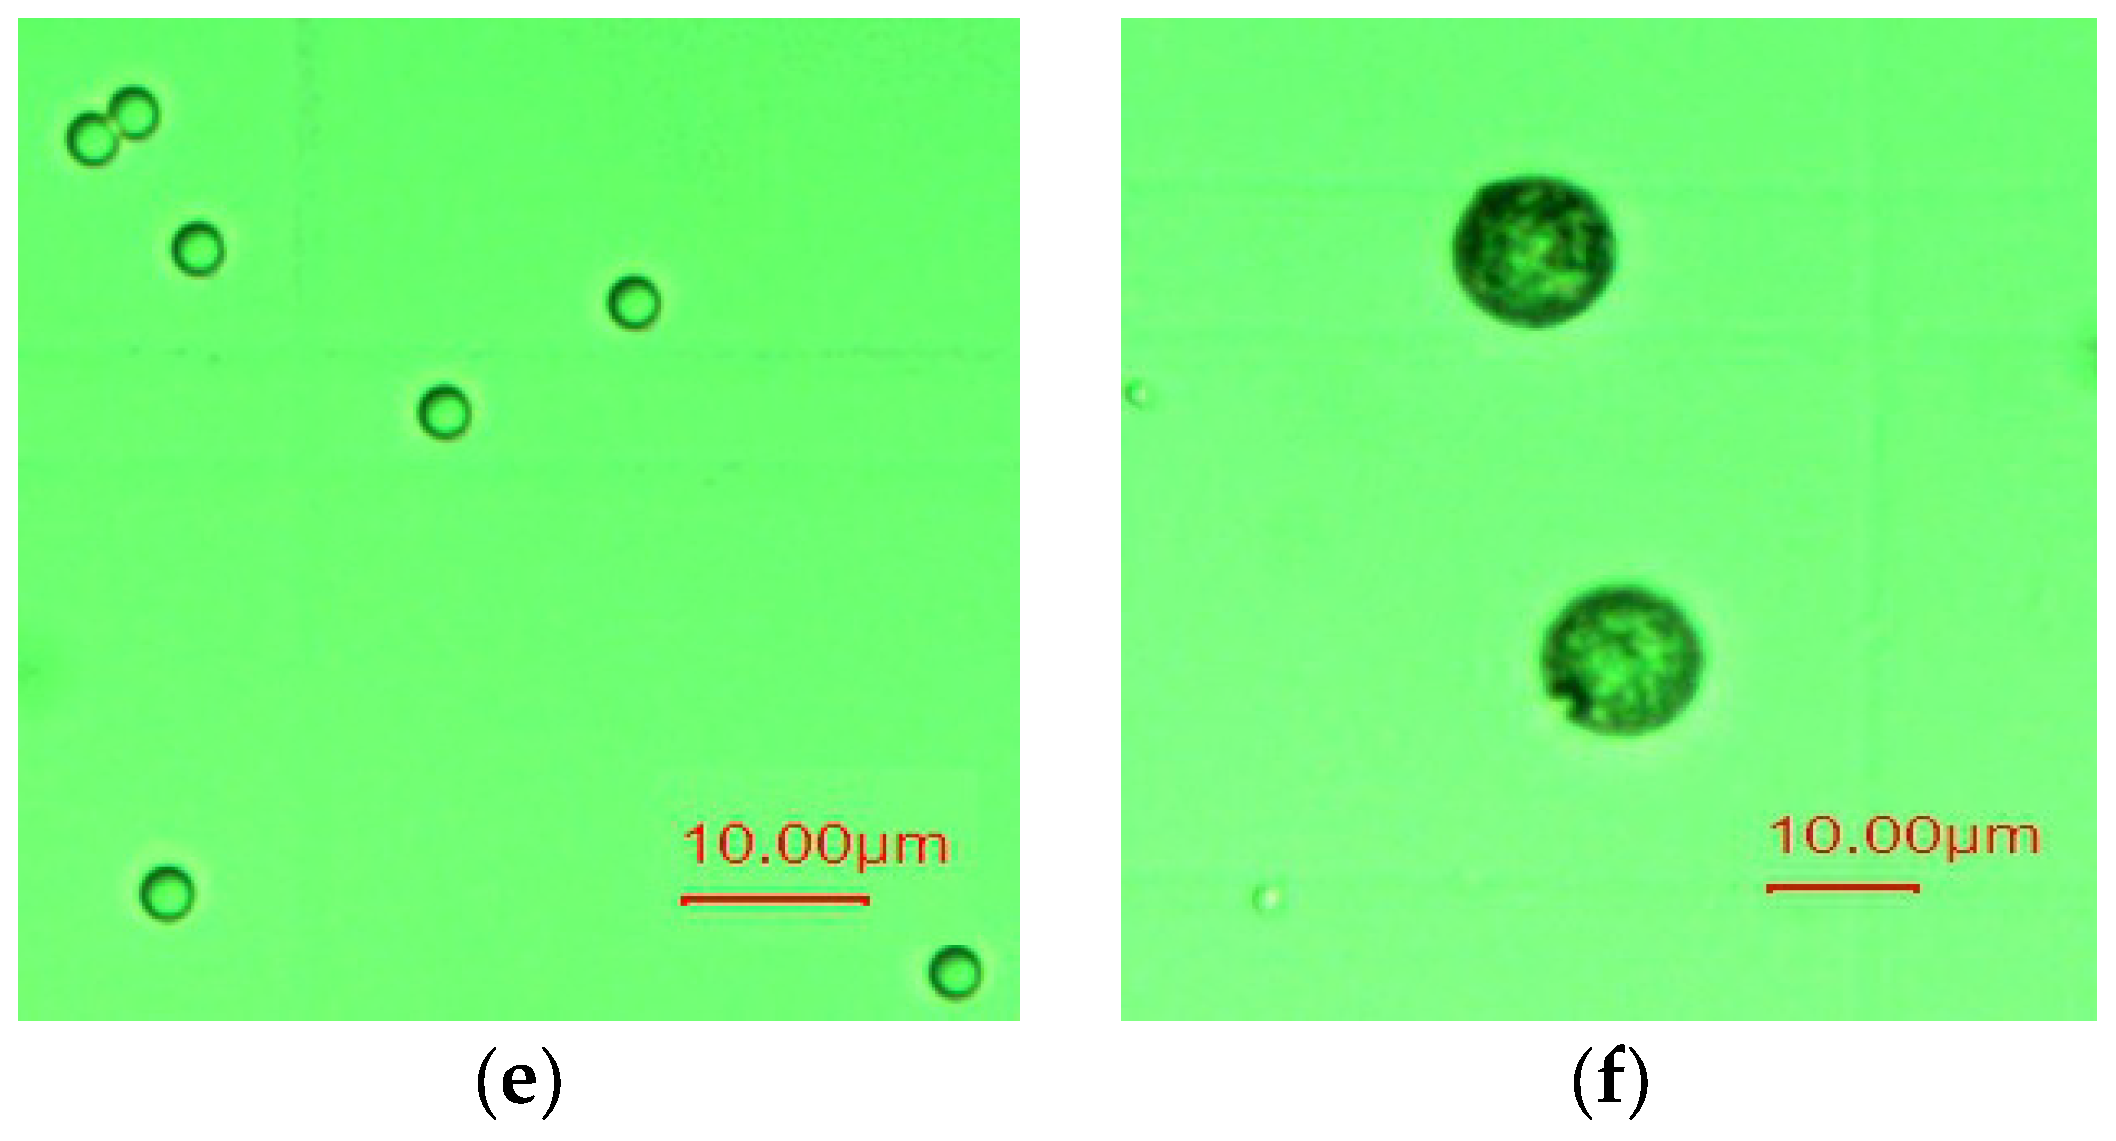
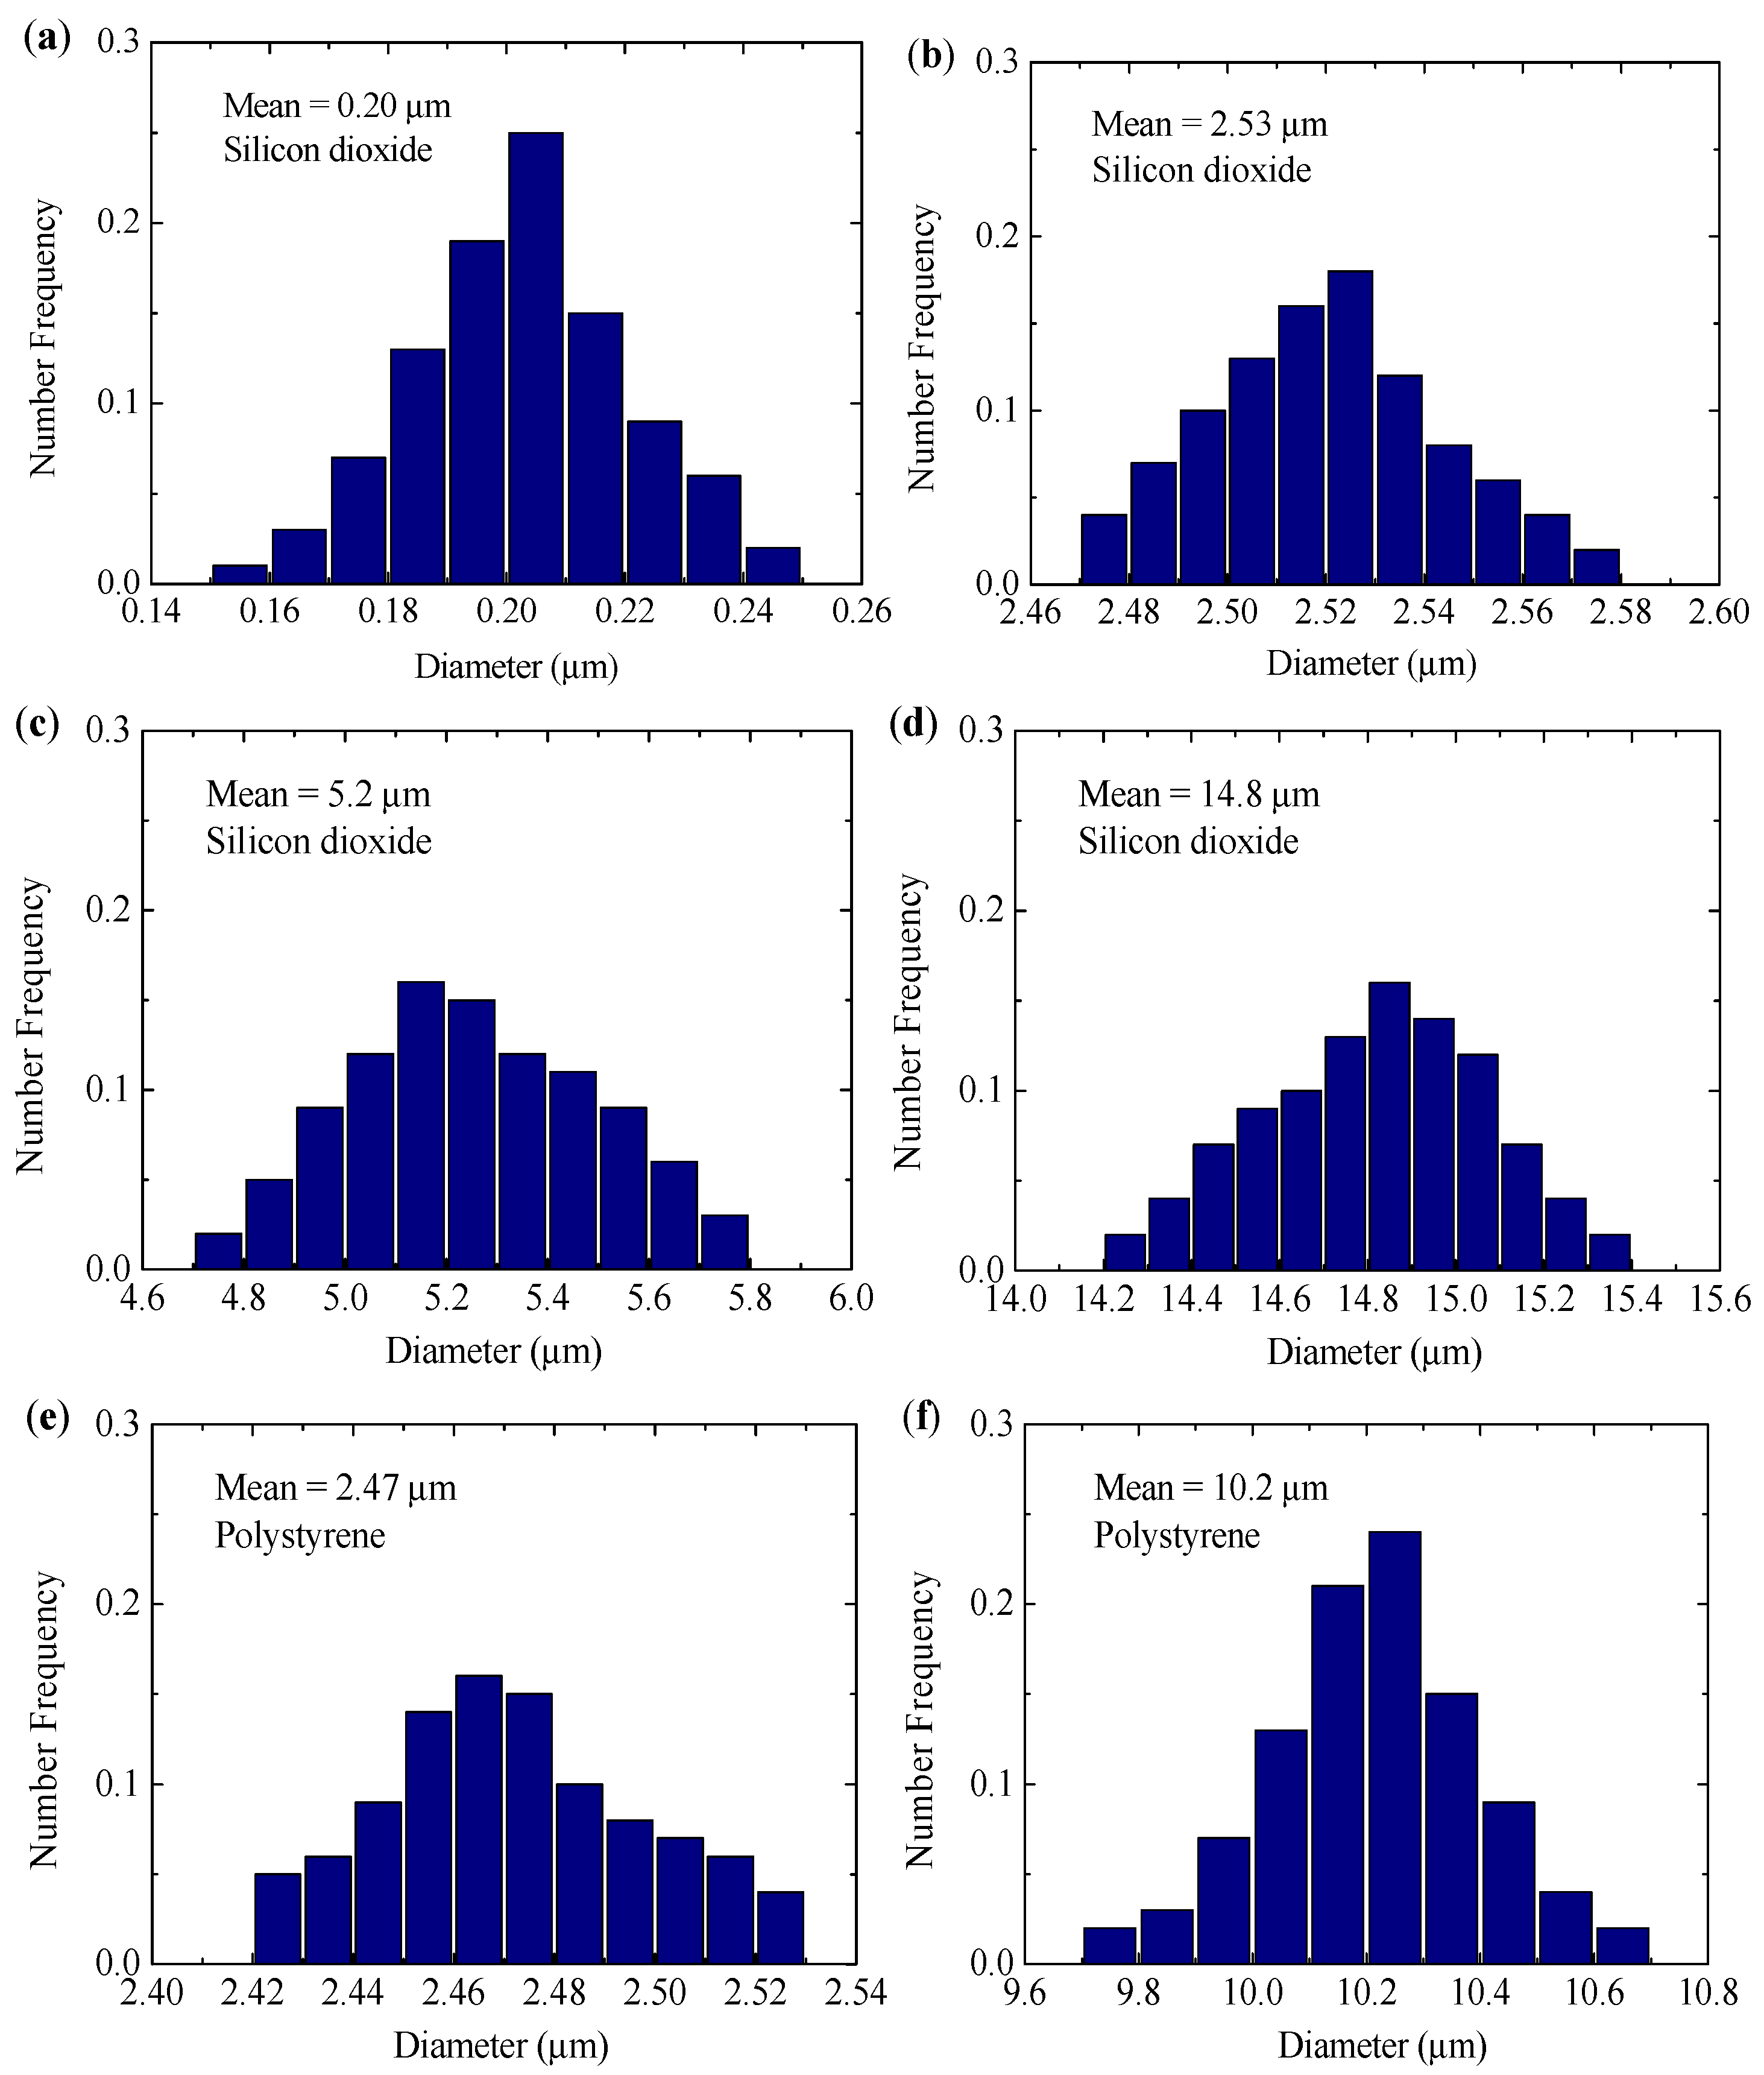
2.3. Sample Characteristics

The monodisperse silicon dioxide microspheres and monodisperse polystyrene microspheres (supplier: Baseline Chromtech Research Centre, Tianjin, China) were chosen as exemplification particles, and the base fluid of these scattering medium is deionized water. The liquid–particle suspensions were held in a cylindrical cuvette with a wall thickness of 1.5 mm. The diameters of the cuvette and the light beam are 20 mm and 1 mm, respectively. All the samples were measured at room temperature and normal atmospheric pressure. Data are collected at 1° increments from 0° to 175°.
Figure 4 shows the micrograph of silicon dioxide microspheres and polystyrene microspheres with different mean diameters. The micrograph (a) was obtained by scanning electron microscopy (JSM-6510MV, JEOL Ltd., Tokyo, Japan). The micrographs (b~f) were obtained using a biological microscope (UB203i-5.0M, Chongqing, China) connected to a CCD camera. The complex refractive index of silicon dioxide and polystyrene [28,29] at 532 nm are equal to 1.461 − i8 × 10−8 and 1.584 − i4.5 × 10−4.
Figure 5 shows the number frequency of the diameter of the silicon dioxide microspheres. To achieve a well-mixed sample, an ultrasonic oscillator (Shanghai Wuxiang, DL-1200D, Shanghai, China) was used to improve the dispersion of particles before the experimental measurement. The particle size distributions were measured using a popular public domain image-viewing and processing program, namely, ImageJ software (developed at the National Institutes of Health, http://rsb.info.nih.gov/ij, accessed on 10 May 2018.) after the measurement was finished. ImageJ reports the diameter distributions of silicon dioxide microspheres and polystyrene microspheres with different mean diameters. More than 300 particles were counted for each sample. The size parameters of silicon dioxide microspheres: (a) 0.20 μm, (b) 2.53 μm, (c) 5.2 μm, and (d) 14.8 μm are corresponding to (a) 1.20, (b) 14.93, (c) 30.69, and (d) 87.63, respectively. The size parameters of polystyrene microspheres: (e) 2.47 μm and (f) 10.2 μm are corresponding to (e) 14.58 and (d) 60.20, respectively.

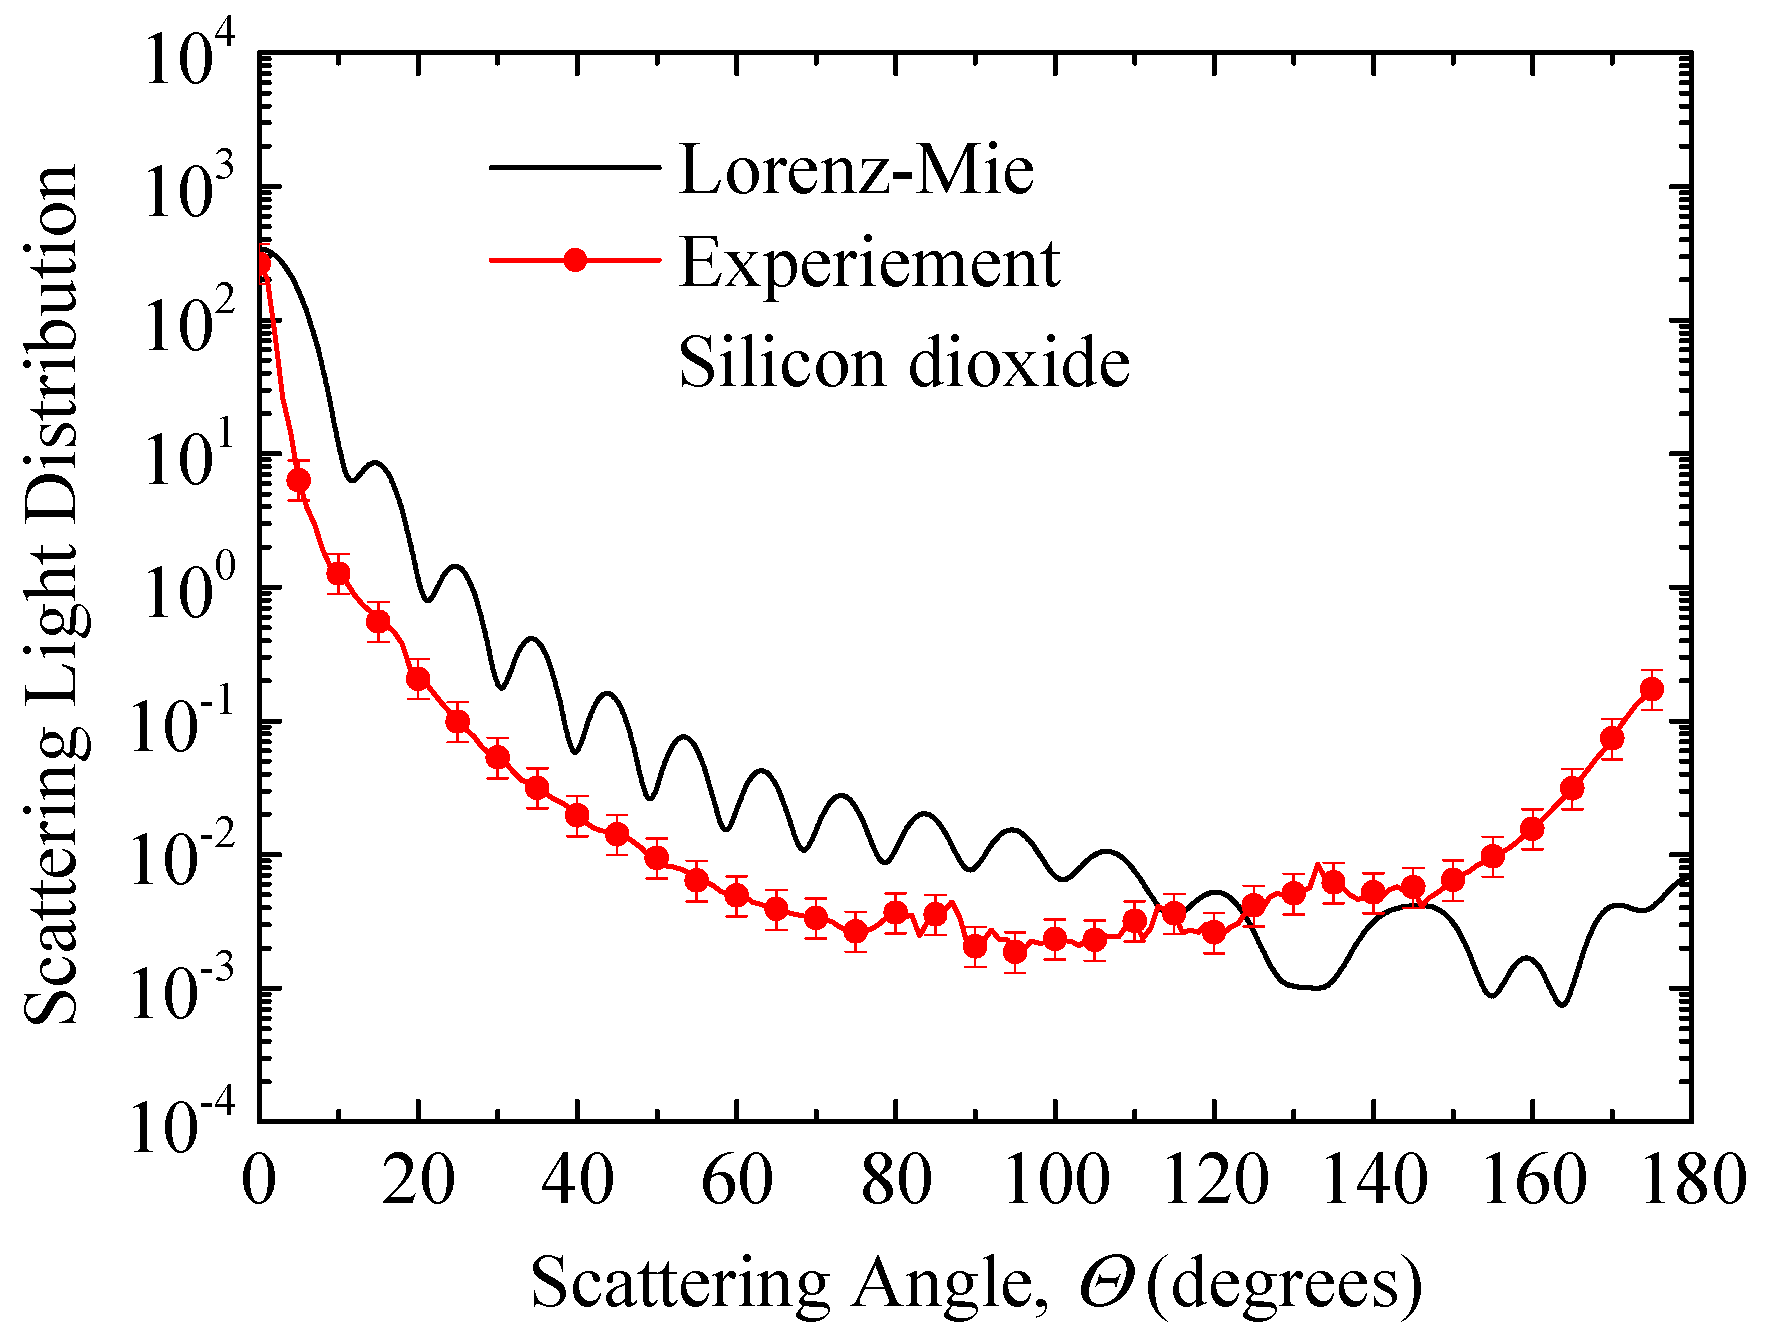
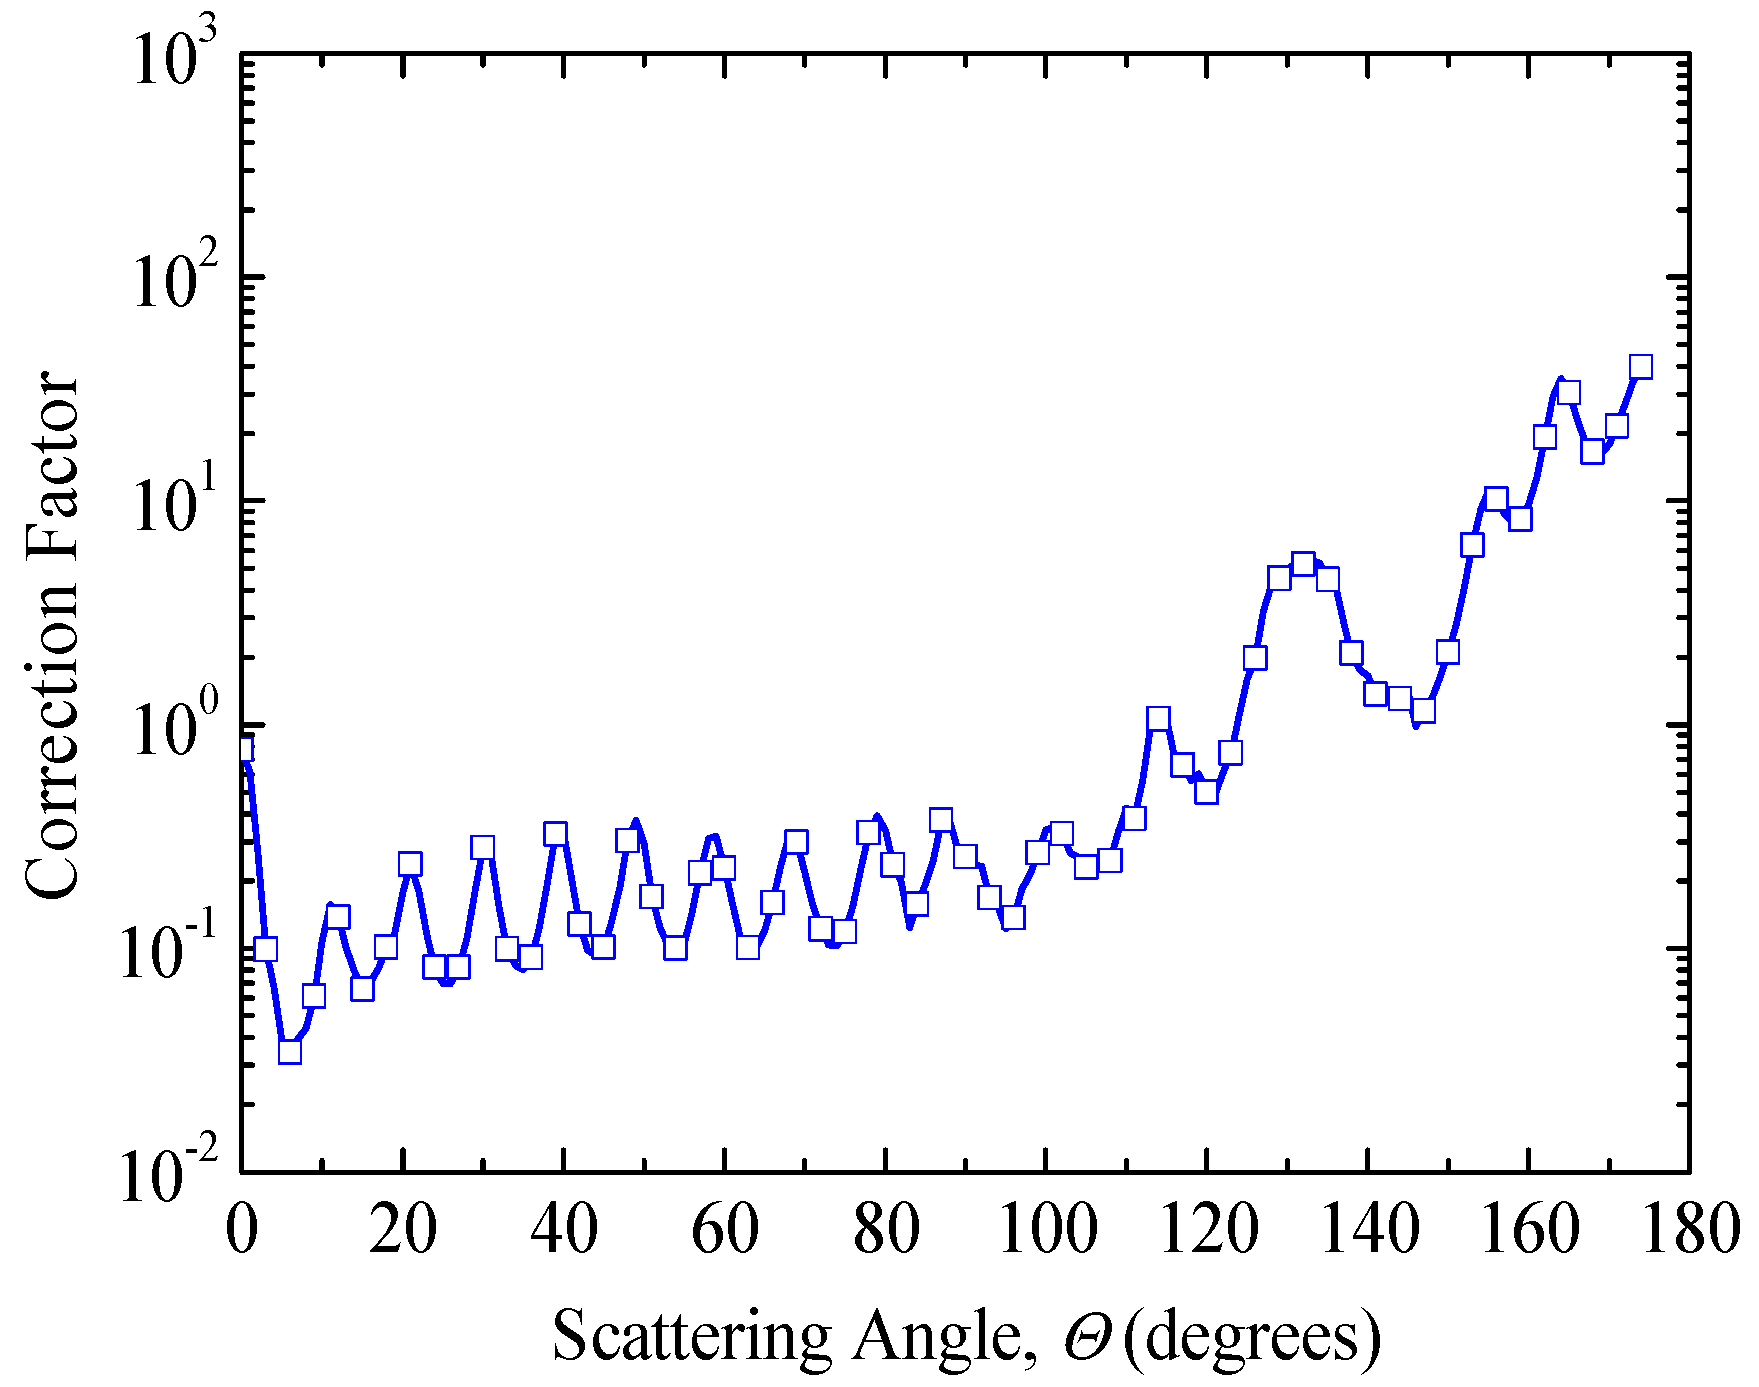
3. Experimental Validation

The monodisperse silicon dioxide microspheres and monodisperse polystyrene microspheres with known optical constants and particle diameter distribution were used to verify the proposed method. The experimental validation of the scattering phase function of particles was conducted for suspensions of various mean particle sizes based on Lorenz–Mie theory.
Different vessel diameters may affect the measurement results of the scattering phase function and cause instability in the correction factor. Therefore, based on the Monte Carlo method and Lorenz–Mie theory, the scattering light distribution in vessels with different diameters was analyzed first, as shown in Figure 6. The particles are SiO2 with a diameter of 2.57 μm, a volume fraction of 0.005%, and a wavelength of 532 nm. The vessel diameters are 1 mm, 2 mm, 5 mm, 10 mm, 20 mm, and 50 mm, respectively. As can be seen from Figure 6, as the vessel diameter increases, the scattering distribution at 0 degrees decreases, while the scattering distribution at scattering angles greater than 10 degrees increases. In addition, an increase in vessel diameter makes the distribution of scattering energy more stable and less fluctuating, which helps in obtaining a more stable correction factor. Therefore, it can be considered that when the vessel diameter is significantly larger than the particle diameter, the correction method proposed in this paper is effective.
Figure 7 shows the experimentally determined scattering light distribution of silicon dioxide microsphere suspensions in liquid retrieved using Equation (6) and the scattering phase function predicted by the Lorenz–Mie theory of diameter 2.53 μm. In the Lorenz–Mie theory analysis, the particle size distributions are obtained experimentally as shown in Figure 5. Note that the experimental data can only be obtained for scattering angles up to 175° where the detector does not block the incident beam. At all scattering angles, the value of the optical thickness is less than 0.1 ensuring that single scattering prevails. Figure 8 shows the correction factor of scattering light at scattering angles from 0° to 175° based on Equation (6). The data points of the correction factor vary with the scattering angles.
The scattering phase function for polystyrene microspheres with mean diameters of 2.53 μm and 10.2 μm were compared with the data provided by Lorenz–Mie theory and shown in Figure 9. The primary experiment result of scattering light distribution of polystyrene microspheres is also presented in this figure. As shown in Figure 9, the corrected result obtained by the new method agrees well with the predicted values of the Lorenz–Mie theory. It is observed that the results provide a strong confirmation of the validity of the presented method. This simple method is demonstrated to have good accuracy in the measurement of the scattering phase function of liquid–particle suspensions.

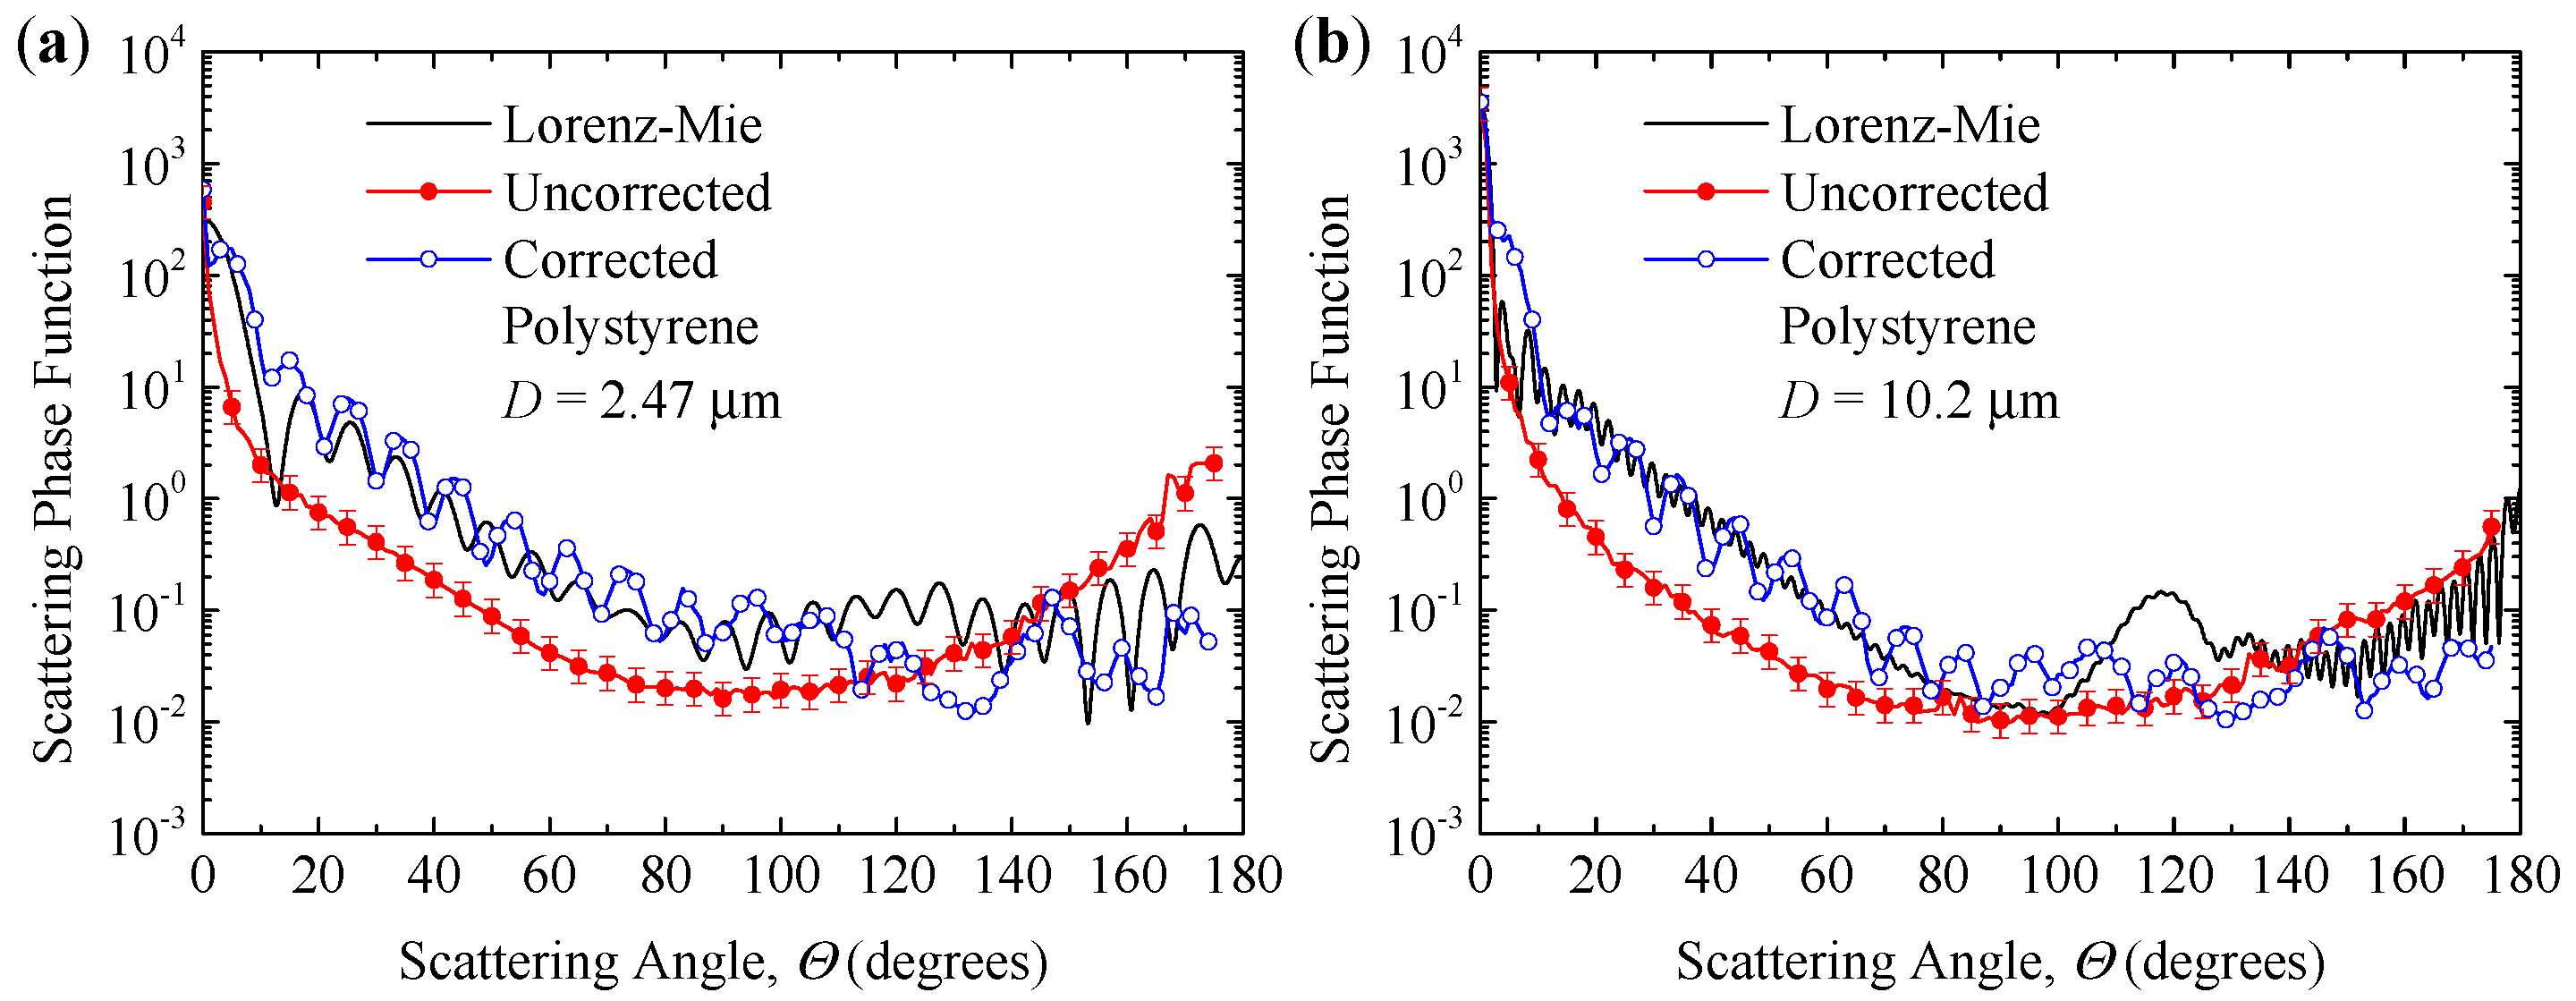
4. Results and Discussion

It is well known that particles with different diameters demonstrate different scattering properties. In order to analyze the applicability of the proposed method, an analysis of the variation of correction factor with different diameters is presented. Figure 10 shows the scattering light distribution of silicon dioxide microsphere suspensions in liquid and scattering phase function obtained by Lorenz–Mie theory with different mean diameters of 0.20 μm, 5.2 μm, and 14.8 μm, respectively. From Figure 10, the trends of the experimentally measured scattering light distribution of these four samples are similar to the scattering phase function based on Lorenz–Mie theory. It is noted that the smaller the diameter of the particle, the weaker the scattering ability of the particle, indicating that the scattering light distribution results are dominated by the cuvette for a small diameter of the particle.
The correction factors of scattering light distribution of silicon dioxide microspheres with four different diameters, 0.20 μm, 2.53 μm, 5.2 μm, and 14.8 μm, respectively, are shown in Figure 11. It is observed that the correction factors of scattering light distribution with a diameter of 2.53 μm, 5.2 μm, and 14.8 μm are similar to each other, but differ from the correction factors with the diameter of 0.20 μm. This result agrees with the theoretical analysis presented in Section 2.1. The results indicated that the reference system using standard particles with a diameter of 2.53 μm can be used to correct the scattering phase function of any unknown particles (size parameter > 10, scattering angle ≠ 0), but is not well-suited for the small-size particles. It is noteworthy that similar size particles considered as a reference system can provide reliable results. For example, the silicon dioxide particles with a mean diameter of 0.20 μm can be able to correct the scattering phase function of the polystyrene microspheres with the same or approximate diameter. Generally, the proposed method is demonstrated to eliminate the influence of the cuvette, especially when the size parameter is larger than 10.

5. Conclusions

A simple method is proposed to measure the scattering phase function of micron/nano particle suspensions. In this method, a reference system is used to compensate for the influence of the cuvette. The silicon dioxide microspheres and polystyrene microspheres were considered as an example to verify this method. The scattering light distribution of silicon dioxide microspheres and polystyrene microspheres with known optical constants and particle diameter distributions were experimentally measured at scattering angles from 0° to 175°. The results show that the new method has good accuracy in the measurement of the scattering phase function of liquid–particle suspensions. The correction factors of scattering light distribution with a diameter of 2.53 μm, 5.2 μm, and 14.8 μm are similar to each other but differ from the correction factors with a diameter of 0.20 μm. The results indicated that the reference system using standard particles with a diameter of 2.53 μm can be used to correct the scattering phase function of any unknown particles (size parameter > 10, scattering angle ≠ 0). The correction factor can be considered as a constant and modified the scattering phase function when the size parameter of the particle is greater than 10. The proposed method is demonstrated to eliminate the influence of the cuvette and can provide reliable results.

Author Contributions

Conceptualization, X.L.; methodology, X.L.; software, X.L.; validation, X.L., H.W. and J.L.; formal analysis, X.L.; investigation, X.L.; writing—original draft preparation, X.L.; writing—review and editing, L.L., Z.S. and Y.H.; funding acquisition, X.L. All authors have read and agreed to the published version of the manuscript.

Funding

This research was funded by the National Natural Science Foundation of China (52106080).

Data Availability Statement

The data presented in this study are available on request from the corresponding author.

Conflicts of Interest

The authors declare no conflict of interest.

References

  1. Miroslaw, J.; Georges, R.F. Light Scattering by Particles in Water: Theoretical and Experimental Foundations; Academic Press: New York, NY, USA, 2007. [Google Scholar]
  2. Foschum, F.; Kienle, A. Optimized goniometer for determination of the scattering phase function of suspended particles: Simulations and measurements. J. Biomed. Opt. 2013, 18, 085002. [Google Scholar] [CrossRef]
  3. Riviere, N.; Ceolato, R.; Hespel, L. Polarimetric and angular light-scattering from dense media: Comparison of a vectorial radiative transfer model with analytical, stochastic and experimental approaches. J. Quant. Spectrosc. Radiat. Transf. 2013, 131, 88–94. [Google Scholar] [CrossRef]
  4. Berberoglu, H.; Pilon, L. Experimental measurements of the radiation characteristics of Anabaena variabilis ATCC 29413-U and Rhodobacter sphaeroides ATCC 49419. Int. J. Hydrogen Energy 2007, 32, 4772–4785. [Google Scholar] [CrossRef]
  5. Kong, B.; Vigil, R.D. Simulation of photosynthetically active radiation distribution in algal photobioreactors using a multidimensional spectral radiation model. Bioresour. Technol. 2014, 158, 141–148. [Google Scholar] [CrossRef]
  6. Kinnunen, M.; Karmenyan, A. Overview of single-cell elastic light scattering techniques. J. Biomed. Opt. 2015, 20, 051040. [Google Scholar] [CrossRef]
  7. Wu, T.T.; Qu, J.Y. Assessment of the relative contribution of cellular components to the acetowhitening effect in cell cultures and suspensions using elastic light-scattering spectroscopy. Appl. Opt. 2007, 46, 4834–4842. [Google Scholar] [CrossRef]
  8. Fang, H.; Ollero, M.; Vitkin, E.; Kimerer, L.; Cipolloni, P.; Zaman, M.; Freedman, S.; Bigio, I.; Itzkan, I.; Hanlon, E.; et al. Noninvasive sizing of subcellular organelles with light scattering spectroscopy. IEEE J. Sel. Top. Quantum Electron. 2003, 9, 267–276. [Google Scholar] [CrossRef]
  9. Kinnunen, M.; Karmenyan, A.; Särkelä, A.; Dimova, E.; Kietzmann, T. Low-Intensity Light Detection Methods for Selected Biophotonic Applications. In Proceedings of the Eighth International Conference on Advanced Optical Materials and Devices (AOMD-8), Riga, Latvia, 25–27 August 2014; SPIE: Bellingham, WA, USA, 2014; Volume 9421, p. 94210D. [Google Scholar]
  10. Hu, L.; Zhang, X.; Xiong, Y.; He, M.-X. Calibration of the LISST-VSF to derive the volume scattering functions in clear waters. Opt. Express 2019, 27, A1188–A1206. [Google Scholar] [CrossRef]
  11. Koestner, D.; Stramski, D.; Reynolds, R.A. Measurements of the Volume Scattering Function and the Degree of Linear Polarization of Light Scattered by Contrasting Natural Assemblages of Marine Particles. Appl. Sci. 2018, 8, 2690. [Google Scholar] [CrossRef]
  12. Zhang, X.; Gray, D.J.; Huot, Y.; You, Y.; Bi, L. Comparison of optically derived particle size distributions: Scattering over the full angular range versus diffraction at near forward angles. Appl. Opt. 2012, 51, 5085–5099. [Google Scholar] [CrossRef]
  13. Kaller, W. A new polar nephelometer for measurement of atmospheric aerosols. J. Quant. Spectrosc. Radiat. Transf. 2004, 87, 107–117. [Google Scholar] [CrossRef]
  14. Castagner, J.-L.; Bigio, I.J. Particle sizing with a fast polar nephelometer. Appl. Opt. 2007, 46, 527–532. [Google Scholar] [CrossRef]
  15. Manfred, K.M.; Washenfelder, R.A.; Wagner, N.L.; Adler, G.; Erdesz, F.; Womack, C.C.; Lamb, K.D.; Schwarz, J.P.; Franchin, A.; Selimovic, V.; et al. Supplementary material to “Investigating biomass burning aerosol morphology using a laser imaging nephelometer”. Atmos. Chem. Phys. 2018, 18, 1879–1894. [Google Scholar] [CrossRef]
  16. Volten, H.; Muñoz, O.; Rol, E.; De Haan, J.F.; Vassen, W.; Hovenier, J.W.; Muinonen, K.; Nousiainen, T. Scattering matrices of mineral aerosol particles at 441.6 nm and 632.8 nm. J. Geophys. Res. Atmos. 2001, 106, 17375–17401. [Google Scholar] [CrossRef]
  17. Ding, H.; Berl, E.; Wang, Z.; Millet, L.J.; Gillette, M.U.; Liu, J.; Boppart, M.; Popescu, G. Fourier Transform Light Scattering of Biological Structure and Dynamics. IEEE J. Sel. Top. Quantum Electron. 2010, 16, 909–918. [Google Scholar] [CrossRef]
  18. Jo, Y.; Jung, J.; Lee, J.W.; Shin, D.; Park, H.; Nam, K.T.; Park, J.-H.; Park, Y. Angle-resolved light scattering of individual rod-shaped bacteria based on Fourier transform light scattering. Sci. Rep. 2014, 4, 5090. [Google Scholar] [CrossRef]
  19. Brock, R.S.; Hu, X.-H.; Weidner, D.R.; Mourant, J.Q.; Lu, J. Effect of Detailed Cell Structure on Light Scattering Distribution: FDTD study of a B-cell with 3D Structure Constructed from Confocal Images. J. Quant. Spectrosc. Radiat. Transf. 2006, 102, 25–36. [Google Scholar] [CrossRef]
  20. Tan, H.; Doerffer, R.; Oishi, T.; Tanaka, A. A new approach to measure the volume scattering function. Opt. Express 2013, 21, 18697–18711. [Google Scholar] [CrossRef]
  21. McCrowey, C.J.; Tinilau, S.S.; Calderon, G.; Koo, J.-E.; Curtis, D.B. A Portable High-Resolution Polar Nephelometer for Measurement of the Angular Scattering Properties of Atmospheric Aerosol: Design and Validation. Aerosol Sci. Technol. 2013, 47, 592–605. [Google Scholar] [CrossRef]
  22. Mahariq, I.; Kurt, H. On- and off-optical-resonance dynamics of dielectric microcylinders under plane wave illumination. J. Opt. Soc. Am. B 2015, 32, 1022–1030. [Google Scholar] [CrossRef]
  23. Mahariq, I.; Astratov, V.N.; Kurt, H. Persistence of photonic nanojet formation under the deformation of circular boundary. J. Opt. Soc. Am. B 2016, 33, 535–542. [Google Scholar] [CrossRef]
  24. Shen, Y.J.; Zhu, Q.Z.; Zhang, Z.M. A scatterometer for measuring the bidirectional reflectance and transmittance of semiconductor wafers with rough surfaces. Rev. Sci. Instrum. 2003, 74, 4885–4892. [Google Scholar] [CrossRef]
  25. Modest, M.F. Radiative Heat Transfer, 3rd ed.; Academic Press: New York, NY, USA, 2013. [Google Scholar]
  26. Li, X.; Zhao, J.M.; Wang, C.C.; Liu, L.H. Improved transmission method for measuring the optical extinction coefficient of micro/nano particle suspensions. Appl. Opt. 2016, 55, 8171–8179. [Google Scholar] [CrossRef] [PubMed]
  27. Agrawal, B.M.; Mengüç, M.P. Forward and inverse analysis of single and multiple scattering of collimated radiation in an axisymmetric system. Int. J. Heat Mass Transf. 1991, 34, 633–647. [Google Scholar] [CrossRef]
  28. Kitamura, R.; Pilon, L.; Jonasz, M. Optical constants of silica glass from extreme ultraviolet to far infrared at near room temperature. Appl. Opt. 2007, 46, 8118–8133. [Google Scholar] [CrossRef]
  29. Ma, X.; Lu, J.Q.; Brock, R.S.; Jacobs, K.M.; Yang, P.; Hu, X.-H. Determination of complex refractive index of polystyrene microspheres from 370 to 1610 nm. Phys. Med. Biol. 2003, 48, 4165–4172. [Google Scholar] [CrossRef]
Figure 1. Two typical designs of the nephelometer. (a) The detector rotates inside of the sample chamber; (b) the detector rotates outside of the transparent sample chamber.
Photonics 10 00511 g001
Figure 2. (a) Schematic diagram of the improved method, (b) experimental setup.
Photonics 10 00511 g002
Figure 3. The extinction efficiency factor Qext (a,c) and scattering efficiency factor Qsca (b,d) with different size parameters and optical constants of particle. The refractive indices of the particle are 1.5, 2, 2.5, and 3, and the absorption indices of the particle are 1 × 10⁻² and 1 × 10⁻⁵, respectively.
Photonics 10 00511 g003
Figure 4. Micrograph of silicon dioxide microspheres and polystyrene microspheres with different mean diameters. Silicon dioxide microspheres: (a) 0.20 μm, (b) 2.53 μm, (c) 5.2 μm, and (d) 14.8 μm, respectively. Polystyrene microspheres: (e) 2.47 μm and (f) 10.2 μm.
Photonics 10 00511 g004aPhotonics 10 00511 g004b
Figure 5. Measured diameter distributions for silicon dioxide microspheres and polystyrene microspheres with different mean diameters. Silicon dioxide microspheres: (a) 0.20 μm, (b) 2.53 μm, (c) 5.2 μm, and (d) 14.8 μm, respectively. Polystyrene microspheres: (e) 2.47 μm and (f) 10.2 μm.
Photonics 10 00511 g005
Figure 6. The scattering light distribution in vessels with different diameters, with a SiO2 nanoparticle diameter of 2.57 μm and a wavelength of 532 nm.
Photonics 10 00511 g006
Figure 7. Scattering light distribution of silicon dioxide microsphere suspensions in liquid and scattering phase function obtained by Lorenz–Mie theory with a diameter of 2.53 μm.
Photonics 10 00511 g007
Figure 8. Correction factor of scattering light distribution of silicon dioxide microspheres.
Photonics 10 00511 g008
Figure 9. Scattering phase function of polystyrene microsphere suspensions in liquid and predicted by Lorenz–Mie theory: (a) 2.47 μm, (b) 10.2 μm.
Photonics 10 00511 g009
Figure 10. Scattering light distribution of silicon dioxide microsphere suspensions in liquid and scattering phase function obtained by Lorenz–Mie theory with different mean diameters of 0.20 μm, 5.2 μm, and 14.8 μm, respectively. (a) Experiment result, (b) Lorenz–Mie theory.
Photonics 10 00511 g010
Figure 11. Correction factors of scattering light distribution of silicon dioxide microspheres with different diameters of 0.20 μm, 2.53 μm, 5.2 μm, and 14.8 μm, respectively.
Photonics 10 00511 g011
Disclaimer/Publisher’s Note: The statements, opinions and data contained in all publications are solely those of the individual author(s) and contributor(s) and not of MDPI and/or the editor(s). MDPI and/or the editor(s) disclaim responsibility for any injury to people or property resulting from any ideas, methods, instructions or products referred to in the content.

