Quantitative Endogenous Fluorescence Analysis Discriminates Glioblastoma Tumor through Visible and NIR Excitation

 and
and 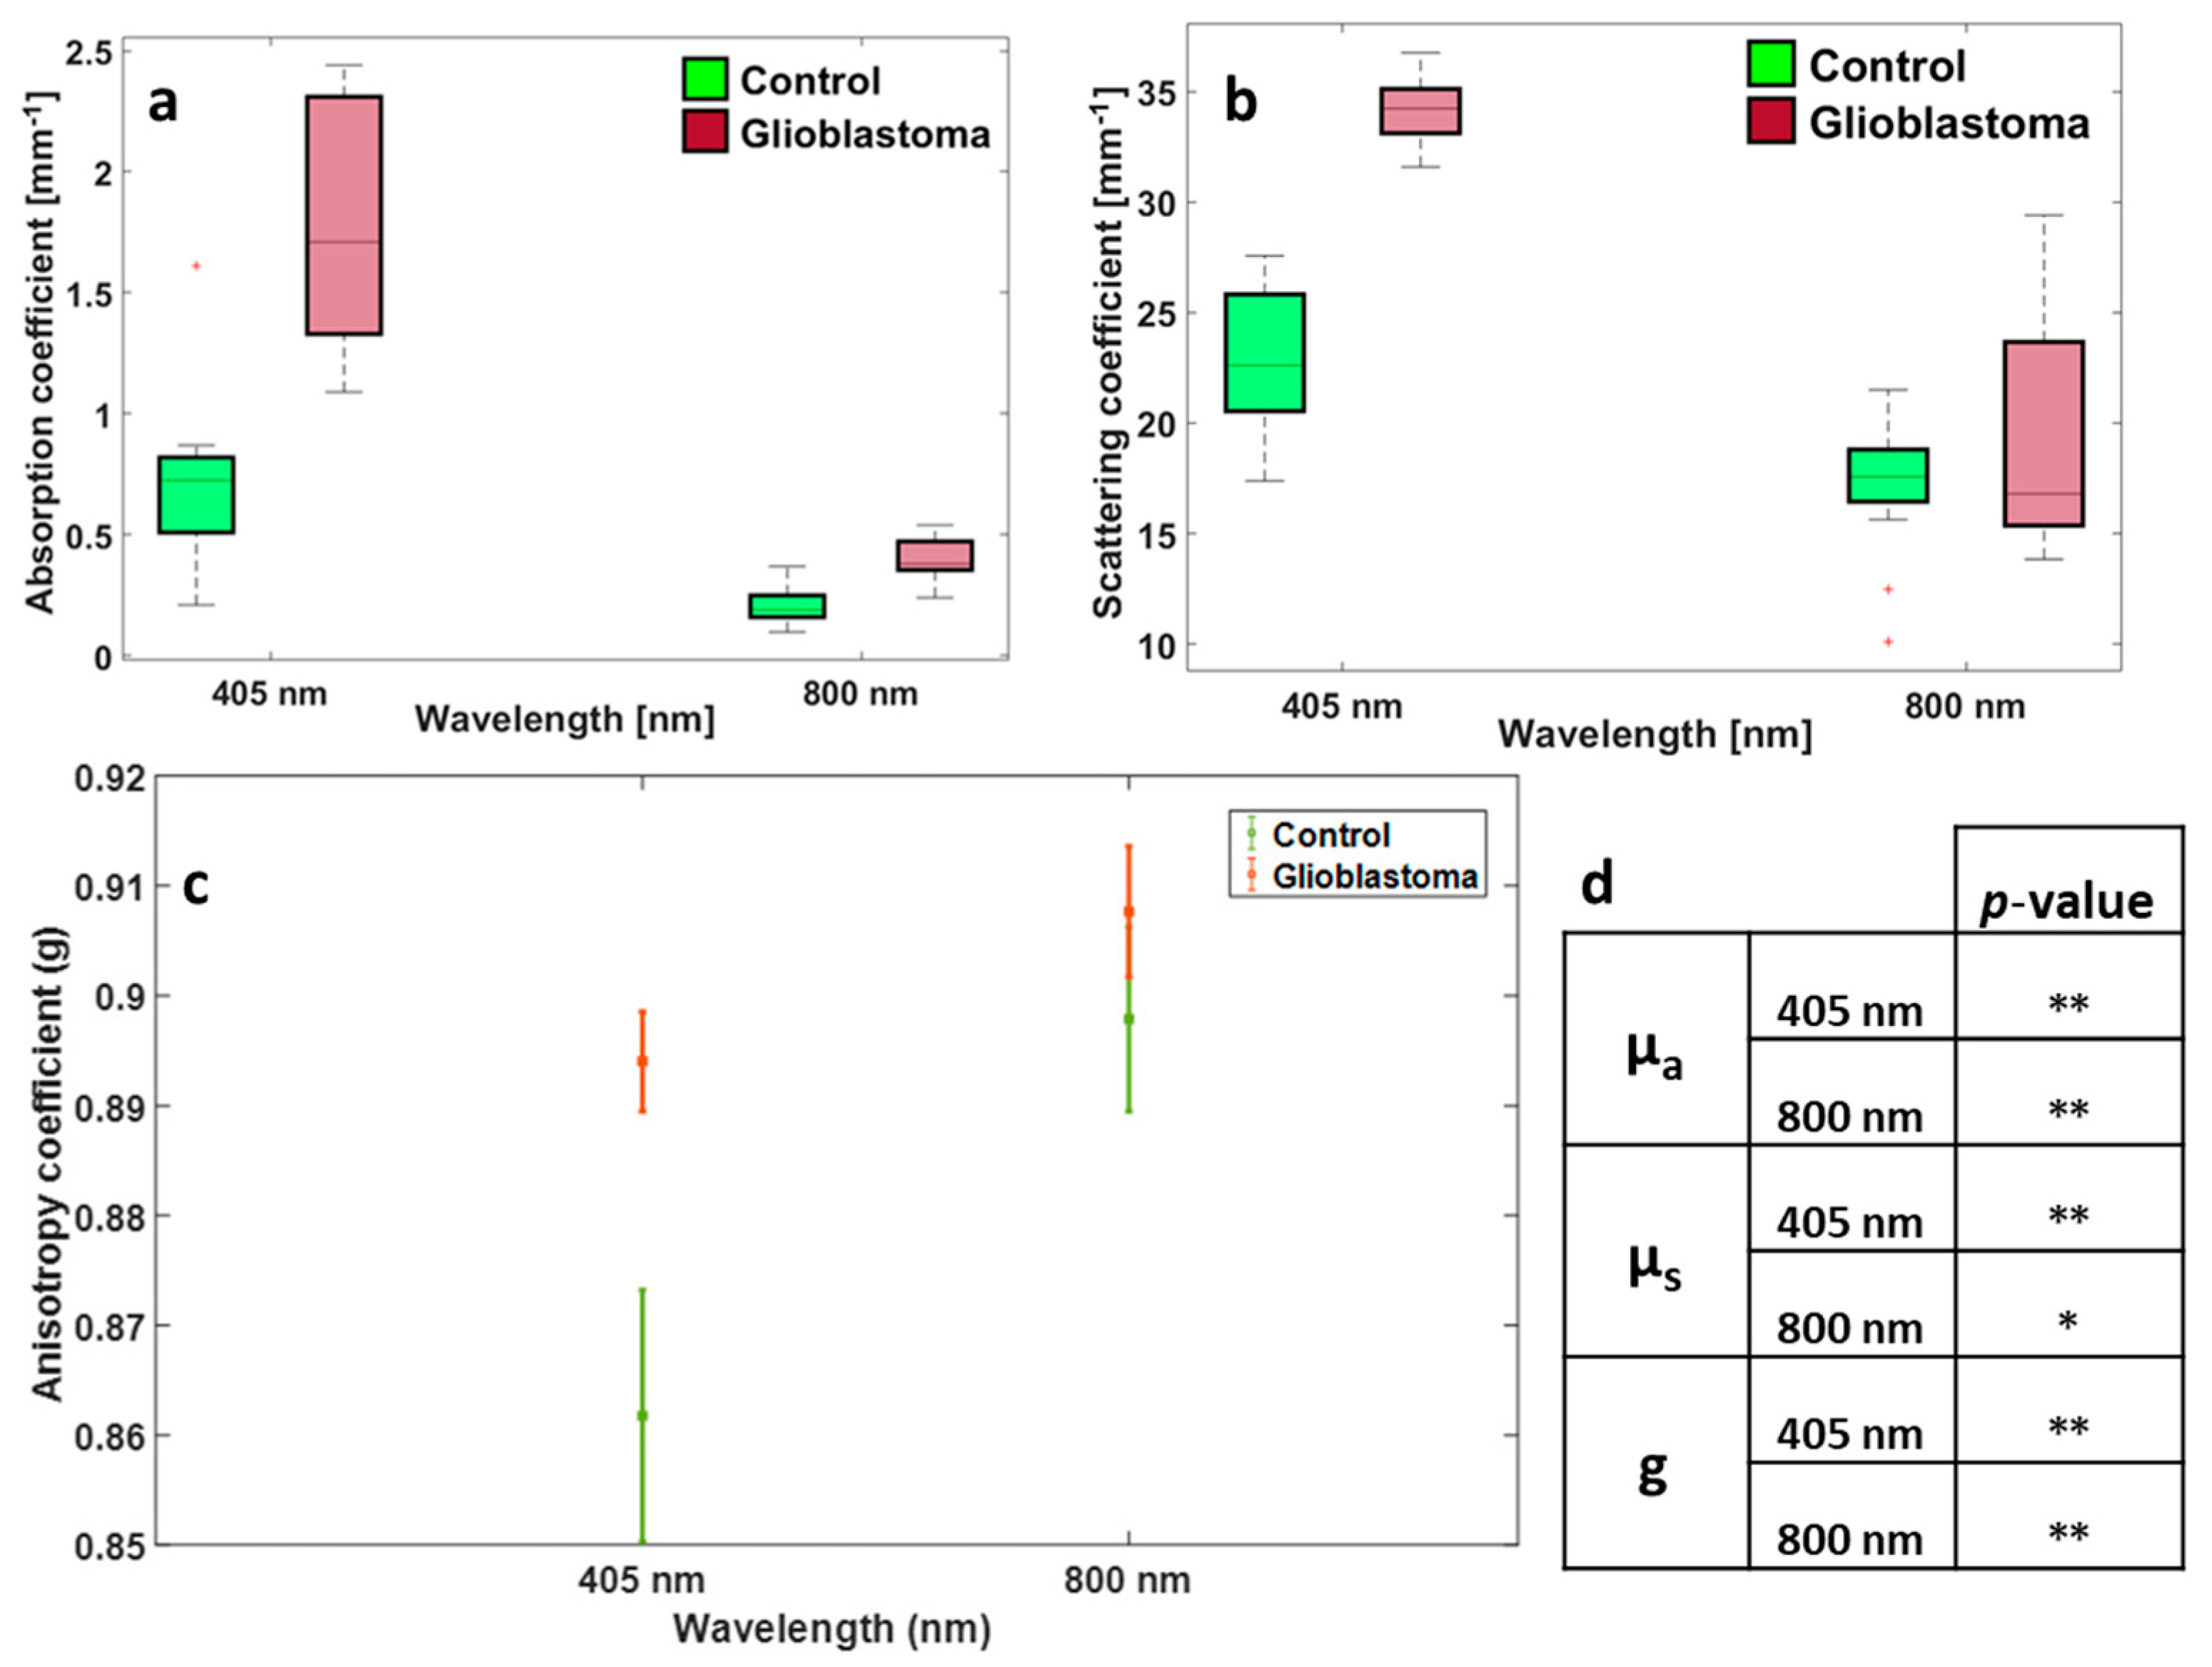
Abstract
:1. Introduction
2. Materials and Methods
2.1. Samples
2.2. Integrating Sphere Setup
2.3. Multimodal Microscopic and Fluorescence Lifetime Imaging (FLIM) Setup
3. Results
3.1. Optical Properties
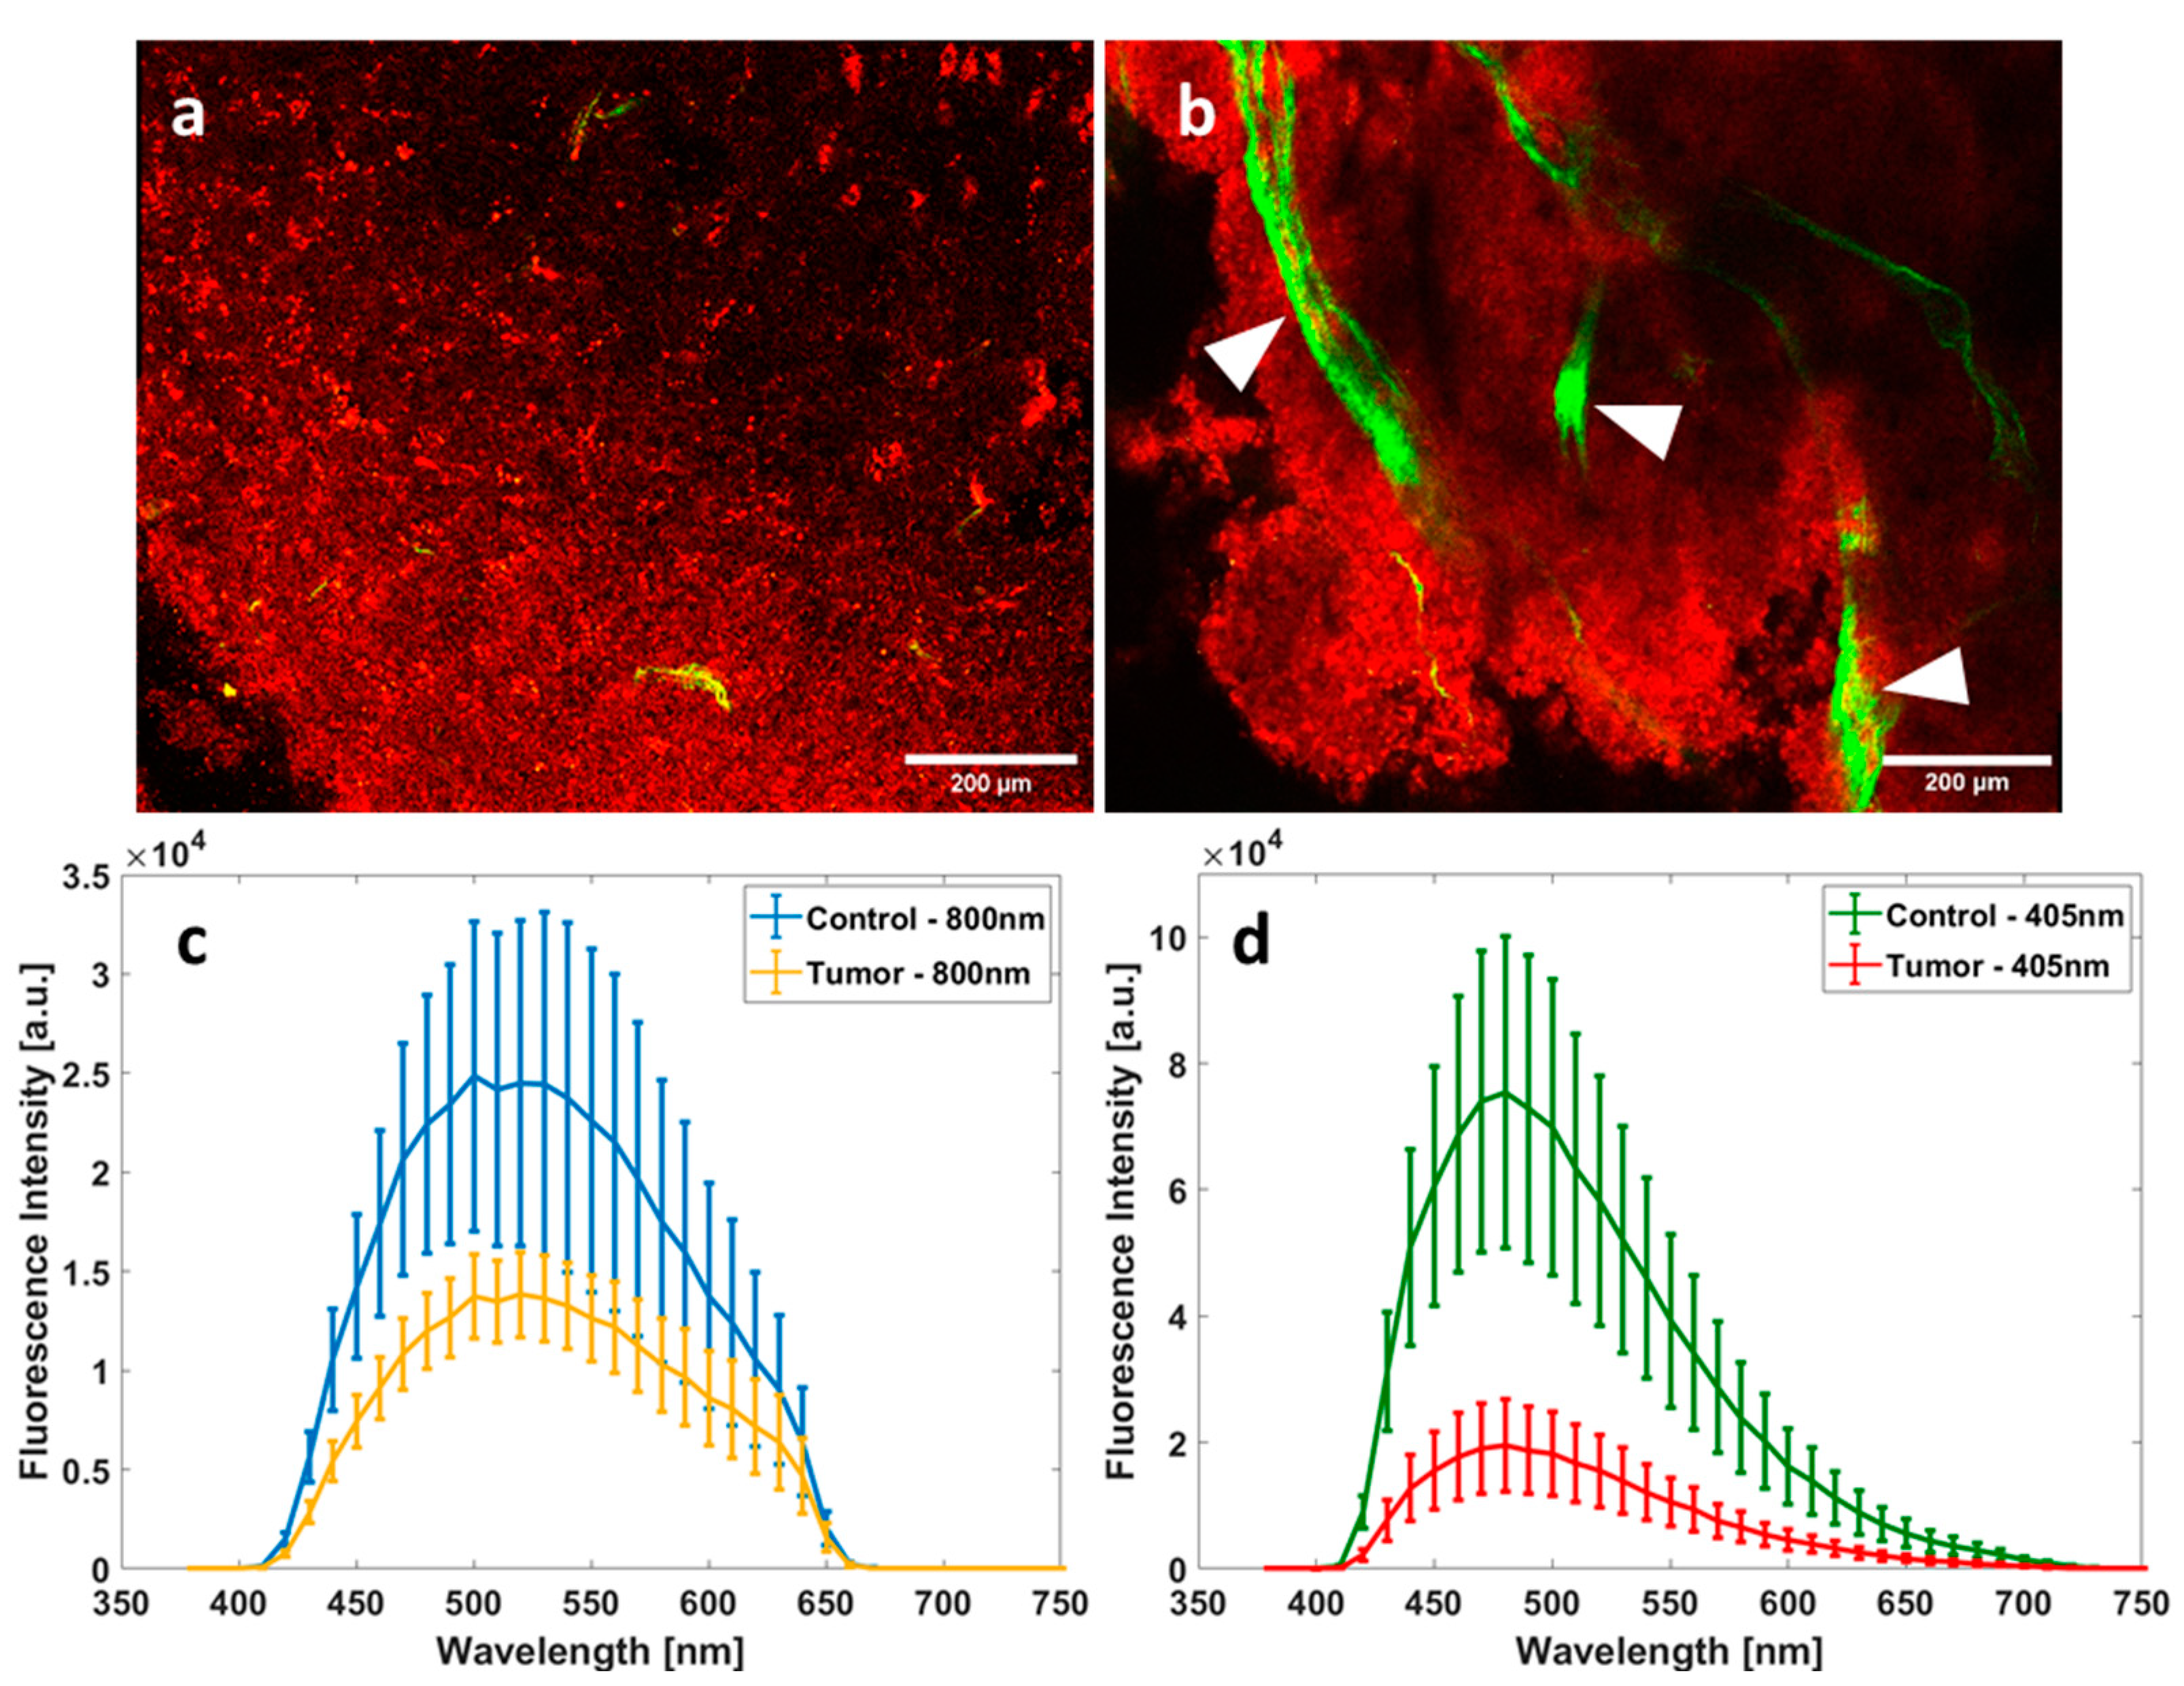
3.2. NIR Spectral Analysis
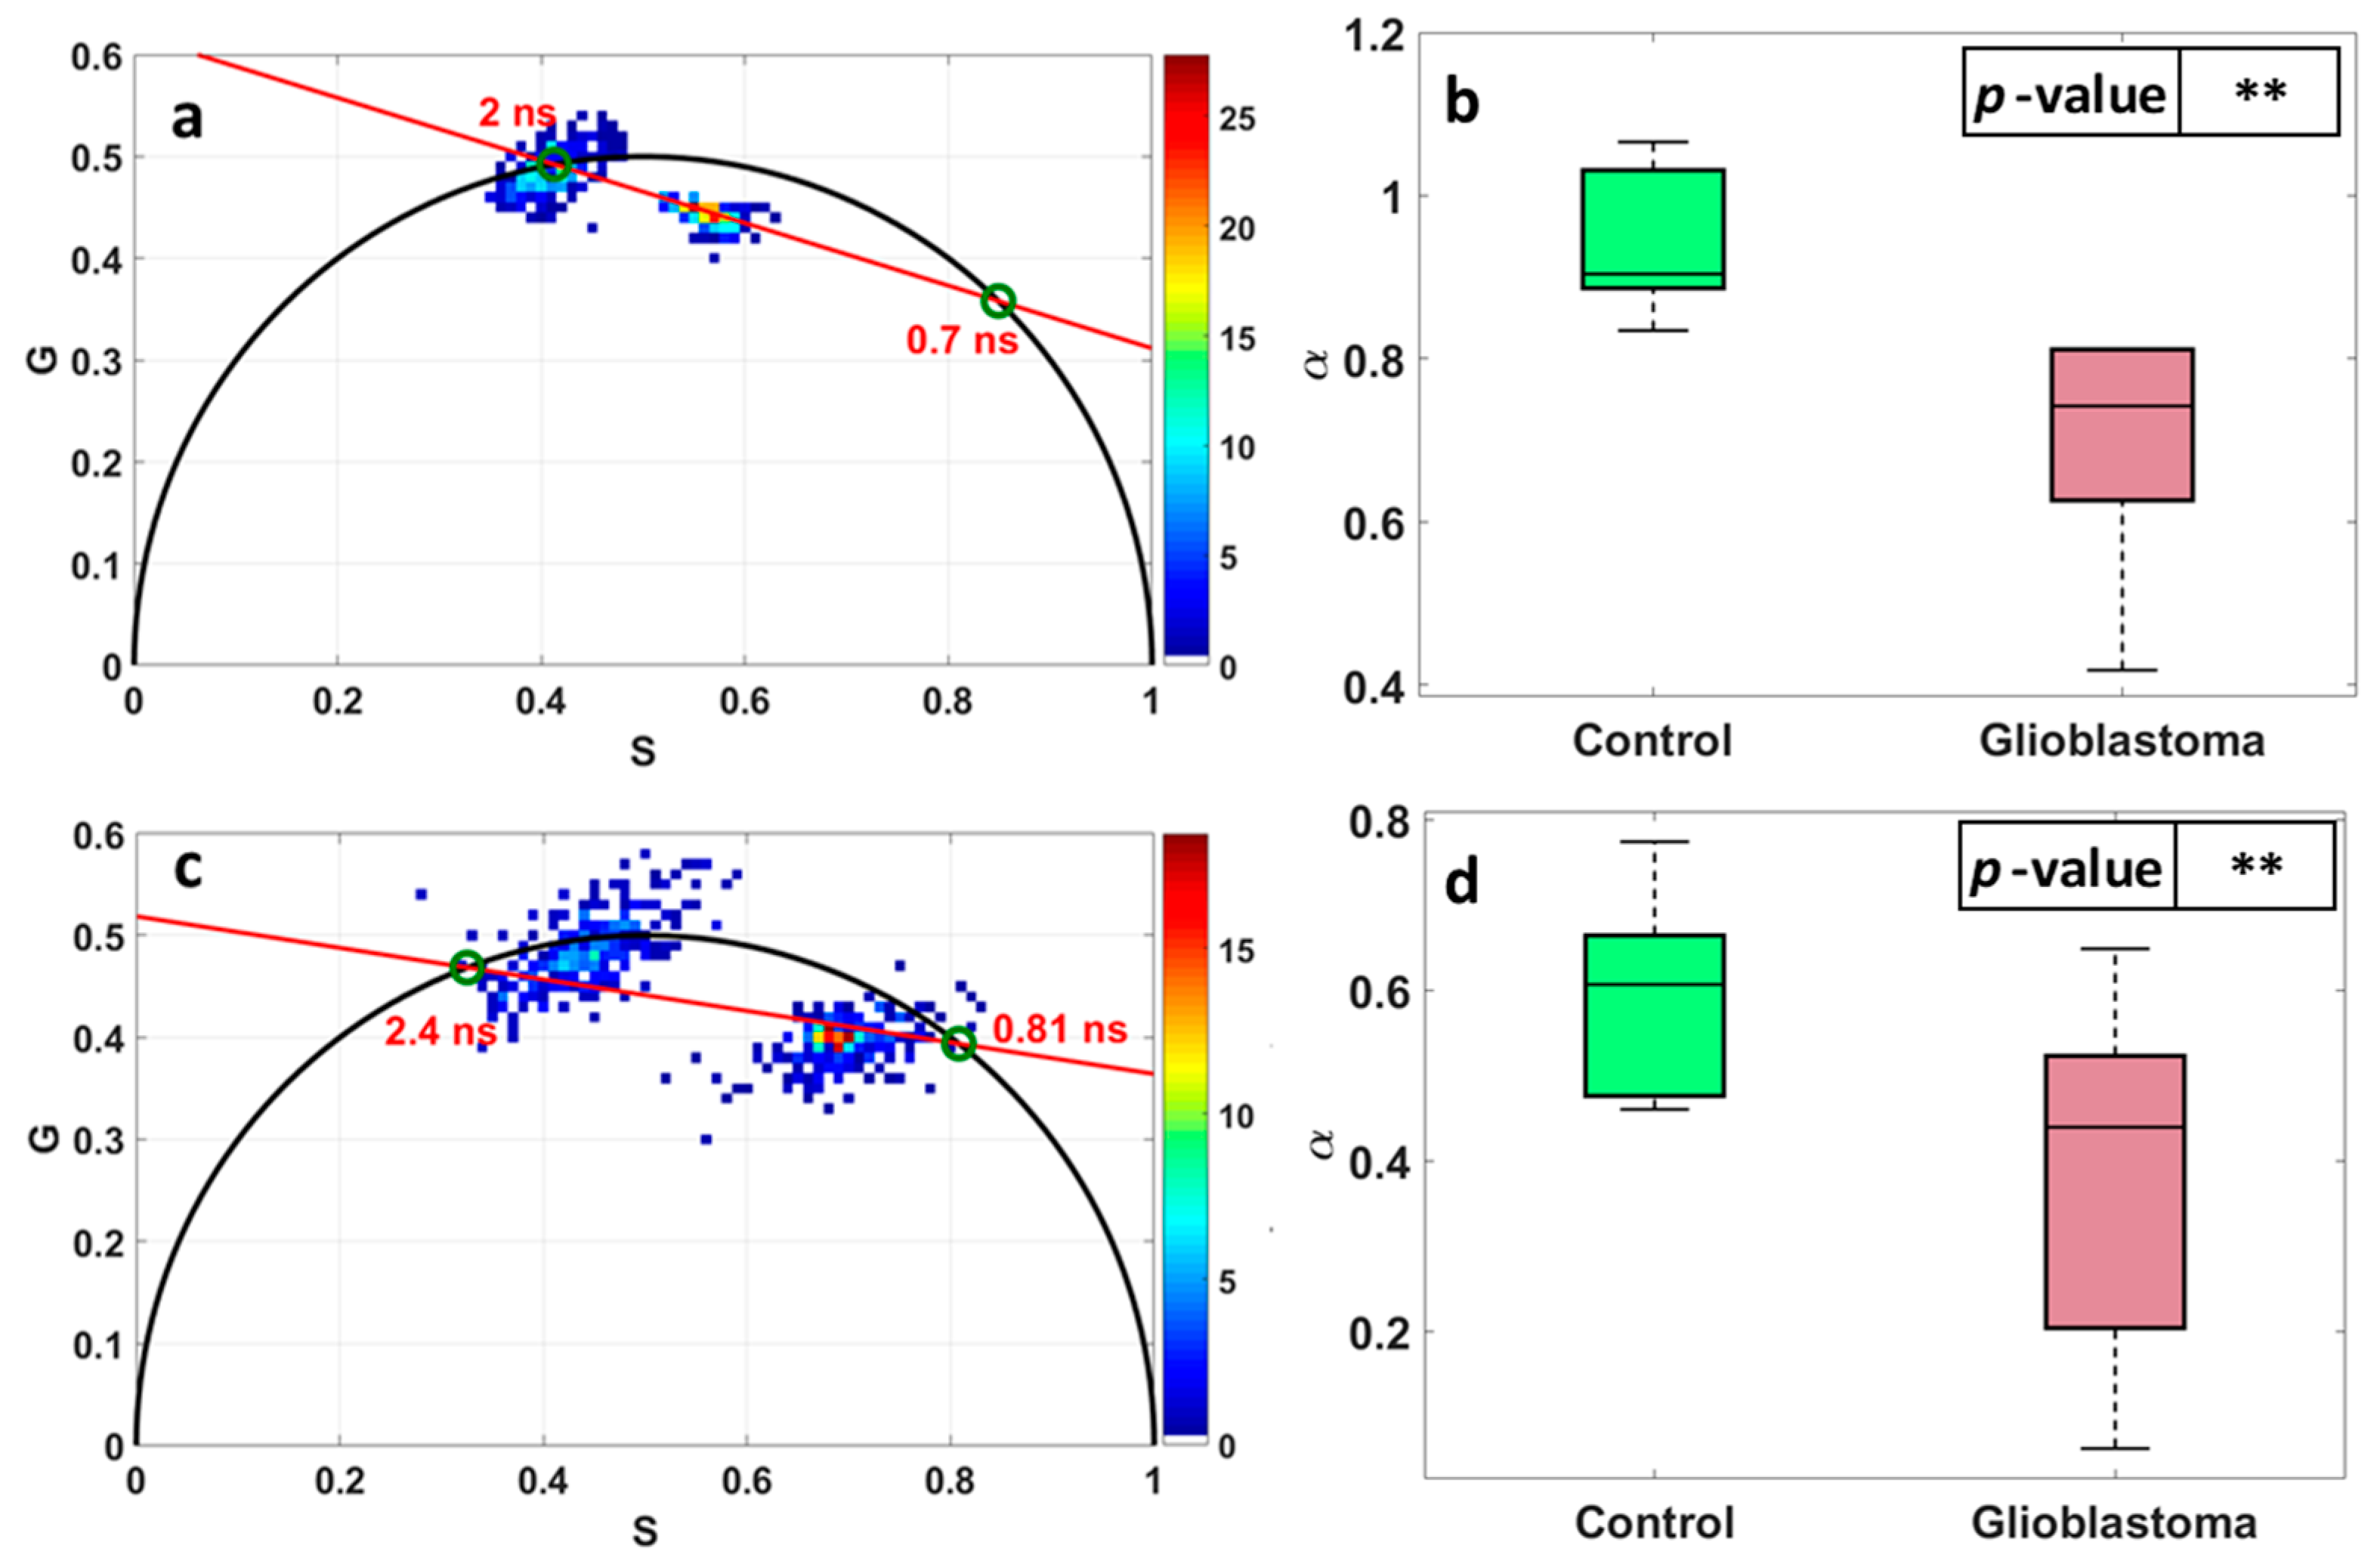
3.3. FLIM
4. Discussion
5. Conclusions
Author Contributions
Funding
Institutional Review Board Statement
Informed Consent Statement
Data Availability Statement
Acknowledgments
Conflicts of Interest
References
- Poulon, F.; Mehidine, H.; Juchaux, M.; Varlet, P.; Devaux, B.; Pallud, J.; Haidar, D.A. Optical properties, spectral, and lifetime measurements of central nervous system tumors in humans. Sci. Rep. 2017, 7, 13995. [Google Scholar] [CrossRef] [PubMed] [Green Version]
- Mehidine, H.; Chalumeau, A.; Poulon, F.; Jamme, F.; Varlet, P.; Devaux, B.; Refregiers, M.; Haidar, D.A. Optical Signatures Derived From Deep UV to NIR Excitation Discriminates Healthy Samples From Low and High Grades Glioma. Sci. Rep. 2019, 9, 8786. [Google Scholar] [CrossRef] [PubMed] [Green Version]
- Harter, D.H.; Wilson, T.A.; Karajannis, M.A. Glioblastoma multiforme: State of the art and future therapeutics. Surg. Neurol. Int. 2014, 5, 64. [Google Scholar] [CrossRef] [PubMed]
- Lara-Velazquez, M.; Al-Kharboosh, R.; Jeanneret, S.; Vazquez-Ramos, C.; Mahato, D.; Tavanaiepour, D.; Rahmathulla, G.; Quinones-Hinojosa, A. Advances in Brain Tumor Surgery for Glioblastoma in Adults. Brain Sci. 2017, 7, 166. [Google Scholar] [CrossRef] [PubMed] [Green Version]
- Valdés, P.A.; Roberts, D.W.; Lu, F.-K.; Golby, A. Optical technologies for intraoperative neurosurgical guidance. Neurosurg. Focus 2016, 40, E8. [Google Scholar] [CrossRef] [Green Version]
- Walter, S.; Susanne, S.; Simon, W.; Herbert, S.; Clemens, F.; Claudia, G.; Alwin, E.G.; Rainer, K.; Hans, J.R. Intraoperative Detection of Malignant Gliomas by 5-Aminolevulinic Acid-induced Porphyrin Fluorescence. Neurosurgery 1998, 42, 518–526. [Google Scholar] [CrossRef]
- Alston, L.; Mahieu-Williame, L.; Hebert, M.; Kantapareddy, P.; Meyronet, D.; Rousseau, D.; Guyotat, J.; Montcel, B. Spectral complexity of 5-ALA induced PpIX fluorescence in guided surgery: A clinical study towards the discrimination of healthy tissue and margin boundaries in high and low grade gliomas. Biomed. Opt. Express 2019, 10, 2478–2492. [Google Scholar] [CrossRef] [Green Version]
- Stummer, W.; Pichlmeier, U.; Meinel, T.; Wiestler, O.D.; Zanella, F.; Reulen, H.-J.; ALA-Glioma Study Group. Fluorescence-guided surgery with 5-aminolevulinic acid for resection of malignant glioma: A randomised controlled multicentre phase III trial. Lancet Oncol. 2006, 7, 392–401. [Google Scholar] [CrossRef]
- Stummer, W.; Tonn, J.-C.; Mehdorn, H.M.; Nestler, U.; Franz, K.; Goetz, C.; Bink, A.; Pichlmeier, U. Counterbalancing risks and gains from extended resections in malignant glioma surgery: A supplemental analysis from the randomized 5-aminolevulinic acid glioma resection study. J. Neurosurg. 2011, 114, 613–623. [Google Scholar] [CrossRef]
- Croce, A.; Bottiroli, G. Autofluorescence spectroscopy and imaging: A tool for biomedical research and diagnosis. Eur. J. Histochem. 2014, 58, 2461. [Google Scholar] [CrossRef] [Green Version]
- Shrirao, A.B.; Schloss, R.S.; Fritz, Z.; Shrirao, M.V.; Rosen, R.; Yarmush, M.L. Autofluorescence of blood and its application in biomedical and clinical research. Biotechnol. Bioeng. 2021, 118, 4550–4576. [Google Scholar] [CrossRef]
- Costanzo, V.; D’Apolito, L.; Sardella, D.; Iervolino, A.; La Manna, G.; Capasso, G.; Frische, S.; Trepiccione, F. Single nephron glomerular filtration rate measured by linescan multiphoton microscopy compared to conventional micropuncture. Pflügers Arch.-Eur. J. Physiol. 2022, 474, 733–741. [Google Scholar] [CrossRef] [PubMed]
- Kretschmer, S.; Pieper, M.; Hüttmann, G.; Bölke, T.; Wollenberg, B.; Marsh, L.M.; Garn, H.; König, P. Autofluorescence multiphoton microscopy for visualization of tissue morphology and cellular dynamics in murine and human airways. Lab. Investig. 2016, 96, 918–931. [Google Scholar] [CrossRef] [Green Version]
- Haidar, D.A.; Leh, B.; Zanello, M.; Siebert, R. Spectral and lifetime domain measurements of rat brain tumors. Biomed. Opt. Express 2015, 6, 1219–1233. [Google Scholar] [CrossRef] [Green Version]
- Marcu, L.; Jo, J.A.; Butte, P.V.; Yong, W.H.; Pikul, B.K.; Black, K.L.; Thompson, R.C. Fluorescence Lifetime Spectroscopy of Glioblastoma Multiforme. Photochem. Photobiol. 2007, 80, 98–103. [Google Scholar] [CrossRef]
- Palmer, S.; Litvinova, K.; Dunaev, A.; Yubo, J.; McGloin, D.; Nabi, G. Optical redox ratio and endogenous porphyrins in the detection of urinary bladder cancer: A patient biopsy analysis. J. Biophotonics 2016, 10, 1062–1073. [Google Scholar] [CrossRef] [PubMed] [Green Version]
- Hong, Z.; Chen, Y.; Chen, J.; Chen, H.; Xu, Y.; Zhu, X.; Zhuo, S.; Shi, Z.; Chen, J. Optical diagnosis of gallbladder cancers via two-photon excited fluorescence imaging of unstained histological sections. Lasers Med. Sci. 2014, 30, 225–233. [Google Scholar] [CrossRef]
- Costanzo, V.; Costanzo, M. Intravital Imaging with Two-Photon Microscopy: A Look into the Kidney. Photonics 2022, 9, 294. [Google Scholar] [CrossRef]
- Wu, X.; Chen, G.; Lu, J.; Zhu, W.; Qiu, J.; Chen, J.; Xie, S.; Zhuo, S.; Yan, J. Label-Free Detection of Breast Masses Using Multiphoton Microscopy. PLoS ONE 2013, 8, e65933. [Google Scholar] [CrossRef]
- Butte, P.V.; Fang, Q.; Jo, J.A.; Yong, W.H.; Pikul, B.K.; Black, K.L.; Marcu, L. Intraoperative delineation of primary brain tumors using time-resolved fluorescence spectroscopy. J. Biomed. Opt. 2010, 15, 027008. [Google Scholar] [CrossRef] [Green Version]
- Poulon, F.; Pallud, J.; Varlet, P.; Zanello, M.; Chretien, F.; Dezamis, E.; Abi-Lahoud, G.; Nataf, F.; Turak, B.; Devaux, B.; et al. Real-time Brain Tumor imaging with endogenous fluorophores: A diagnosis proof-of-concept study on fresh human samples. Sci. Rep. 2018, 8, 14888. [Google Scholar] [CrossRef] [PubMed] [Green Version]
- William, H.Y.; Yong, W.H.; Butte, P.V.; Pikul, B.K.; Jo, J.A.; Fang, Q.; Papaioannou, T.; Black, K.; Marcu, L. Distinction of brain tissue, low grade and high grade glioma with time-resolved fluorescence spectroscopy. Front. Biosci. 2006, 11, 1255–1263. [Google Scholar] [CrossRef] [Green Version]
- Alfano, R.; Tang, G.; Pradhan, A.; Lam, W.; Choy, D.; Opher, E. Fluorescence spectra from cancerous and normal human breast and lung tissues. IEEE J. Quantum Electron. 1987, 23, 1806–1811. [Google Scholar] [CrossRef]
- Das, B.B.; Glassman, W.S.; Alfano, R.R.; Cleary, J.; Prudente, R.; Celmer, E.J.; Lubicz, S. UV-fluorescence spectroscopic technique in the diagnosis of breast, ovarian, uterus, and cervix cancer. In Laser-Tissue Interaction II; SPIE: Los Angeles, CA, USA, 1991; pp. 368–373. [Google Scholar] [CrossRef]
- Papayan, G.; Petrishchev, N.; Galagudza, M. Autofluorescence spectroscopy for NADH and flavoproteins redox state monitoring in the isolated rat heart subjected to ischemia-reperfusion. Photodiagnosis Photodyn. Ther. 2014, 11, 400–408. [Google Scholar] [CrossRef]
- Toms, S.A.; Lin, W.-C.; Weil, R.J.; Johnson, M.D.; Jansen, E.D.; Mahadevan-Jansen, A. Intraoperative Optical Spectroscopy Identifies Infiltrating Glioma Margins with High Sensitivity. Neurosurgery 2005, 57, 382–391. [Google Scholar] [CrossRef] [PubMed]
- Skala, M.C.; Riching, K.M.; Gendron-Fitzpatrick, A.; Eickhoff, J.; Eliceiri, K.W.; White, J.G.; Ramanujam, N. In vivo multiphoton microscopy of NADH and FAD redox states, fluorescence lifetimes, and cellular morphology in precancerous epithelia. Proc. Natl. Acad. Sci. USA 2007, 104, 19494–19499. [Google Scholar] [CrossRef] [PubMed] [Green Version]
- Zanello, M.; Poulon, F.; Pallud, J.; Varlet, P.; Hamzeh, H.; Lahoud, G.A.; Andreiuolo, F.; Ibrahim, A.; Pages, M.; Chretien, F.; et al. Multimodal optical analysis discriminates freshly extracted human sample of gliomas, metastases and meningiomas from their appropriate controls. Sci. Rep. 2017, 7, 41724. [Google Scholar] [CrossRef] [Green Version]
- Mehidine, H.; Refregiers, M.; Jamme, F.; Varlet, P.; Juchaux, M.; Devaux, B.; Haidar, D.A. Molecular changes tracking through multiscale fluorescence microscopy differentiate Meningioma grades and non-tumoral brain tissues. Sci. Rep. 2021, 11, 3816. [Google Scholar] [CrossRef]
- Mehidine, H.; Devaux, B.; Varlet, P.; Haidar, D.A. Comparative Study Between a Customized Bimodal Endoscope and a Benchtop Microscope for Quantitative Tissue Diagnosis. Front. Oncol. 2022, 12, 881331. [Google Scholar] [CrossRef]
- Wright, B.K.; Andrews, L.M.; Jones, M.R.; Stringari, C.; Digman, M.A.; Gratton, E. Phasor-flim analysis of NADH distribution and localization in the nucleus of live progenitor myoblast cells. Microsc. Res. Technol. 2012, 75, 1717–1722. [Google Scholar] [CrossRef] [Green Version]
- Trinh, A.L.; Chen, H.; Chen, Y.; Hu, Y.; Li, Z.; Siegel, E.R.; Linskey, M.E.; Wang, P.H.; Digman, M.A.; Zhou, Y.-H. Tracking Functional Tumor Cell Subpopulations of Malignant Glioma by Phasor Fluorescence Lifetime Imaging Microscopy of NADH. Cancers 2017, 9, 168. [Google Scholar] [CrossRef] [PubMed] [Green Version]
- Jacques, S.L. Optical properties of biological tissues: A review. Phys. Med. Biol. 2013, 58, R37–R61. [Google Scholar] [CrossRef] [PubMed]
- Yaroslavsky, A.N.; Schulze, P.C.; Yaroslavsky, I.V.; Schober, R.; Ulrich, F.; Schwarzmaier, H.-J. Optical properties of selected native and coagulated human brain tissues in vitro in the visible and near infrared spectral range. Phys. Med. Biol. 2002, 47, 2059–2073. [Google Scholar] [CrossRef] [PubMed]
- Roggan, A.; Minet, O.; Schroeder, C.; Mueller, G.J. Determination of optical tissue properties with double integrating sphere technique and Monte Carlo simulations. In Cell and Biotissue Optics: Applications in Laser Diagnostics and Therapy; SPIE: Los Angeles, CA, USA, 1994; Volume 2100, pp. 42–57. [Google Scholar] [CrossRef]
- Zanello, M.; Poulon, F.; Varlet, P.; Chretien, F.; Andreiuolo, F.; Pages, M.; Ibrahim, A.; Pallud, J.; Dezamis, E.; Abi-Lahoud, G.; et al. Multimodal optical analysis of meningioma and comparison with histopathology. J. Biophotonics 2016, 10, 253–263. [Google Scholar] [CrossRef]
- Marcu, L.; French, P.M.W.; Elson, D.S. (Eds.) Fluorescence Lifetime Spectroscopy and Imaging: Principles and Applications in Biomedical Diagnostics; CRC Press: Boca Raton, FL, USA; Taylor & Francis Group: Abingdon, UK, 2014. [Google Scholar]
- Engbjerg, J.S.; Costanzo, V.; Sardella, D.; Bordoni, L.; Jakobsen, S.; D’Apolito, L.; Frøkiær, J.; Trepiccione, F.; Capasso, G.; Frische, S. The Probe for Renal Organic Cation Secretion (4-Dimethylaminostyryl)-N-Methylpyridinium (ASP+)) Shows Amplified Fluorescence by Binding to Albumin and Is Accumulated In Vivo. Mol. Imaging 2022, 2022, 7908357. [Google Scholar] [CrossRef]
- Croce, A.C.; Fiorani, S.; Locatelli, D.; Nano, R.; Ceroni, M.; Tancioni, F.; Giombelli, E.; Benericetti, E.; Bottiroli, G. Diagnostic Potential of Autofluorescence for an Assisted Intraoperative Delineation of Glioblastoma Resection Margins. Photochem. Photobiol. 2003, 77, 309–318. [Google Scholar] [CrossRef]
- Gogvadze, V.; Orrenius, S.; Zhivotovsky, B. Mitochondria in cancer cells: What is so special about them? Trends Cell Biol. 2008, 18, 165–173. [Google Scholar] [CrossRef]
- Mehidine, H.; Sibai, M.; Poulon, F.; Pallud, J.; Varlet, P.; Zanello, M.; Devaux, B.; Haidar, D.A. Multimodal imaging to explore endogenous fluorescence of fresh and fixed human healthy and tumor brain tissues. J. Biophotonics 2018, 12, e201800178. [Google Scholar] [CrossRef]
- Warburg, O.; Wind, F.; Negelein, E. The metabolism of tumors in the body. J. Gen. Physiol. 1927, 8, 519–530. [Google Scholar] [CrossRef] [Green Version]
- Koppenol, W.H.; Bounds, P.L.; Dang, C.V. Otto Warburg’s contributions to current concepts of cancer metabolism. Nat. Rev. Cancer 2011, 11, 325–337. [Google Scholar] [CrossRef]
- Wang, H.-W.; Gukassyan, V.; Chen, C.-T.; Wei, Y.-H.; Guo, H.-W.; Yu, J.-S.; Kao, F.-J. Differentiation of apoptosis from necrosis by dynamic changes of reduced nicotinamide adenine dinucleotide fluorescence lifetime in live cells. J. Biomed. Opt. 2008, 13, 054011. [Google Scholar] [CrossRef] [PubMed]
- Baraghis, E.; Devor, A.; Fang, Q.; Srinivasan, V.J.; Wu, W.; Lesage, F.; Ayata, C.; Kasischke, K.A.; Boas, D.A.; Sakadžić, S. Two-photon microscopy of cortical NADH fluorescence intensity changes: Correcting contamination from the hemodynamic response. J. Biomed. Opt. 2011, 16, 106003. [Google Scholar] [CrossRef] [PubMed] [Green Version]
- Kantelhardt, S.R.; Leppert, J.; Krajewski, J.; Petkus, N.; Reusche, E.; Tronnier, V.M.; Hüttmann, G.; Giese, A. Imaging of brain and brain tumor specimens by time-resolved multiphoton excitation microscopy ex vivo1. Neuro-Oncology 2007, 9, 103–112. [Google Scholar] [CrossRef] [PubMed] [Green Version]
- Schroeder, T.; Yuan, H.; Viglianti, B.L.; Peltz, C.; Asopa, S.; Vujaskovic, Z.; Dewhirst, M.W. Spatial Heterogeneity and Oxygen Dependence of Glucose Consumption in R3230Ac and Fibrosarcomas of the Fischer 344 Rat. Cancer Res. 2005, 65, 5163–5171. [Google Scholar] [CrossRef] [Green Version]
- Maeda-Yorita, K.; Aki, K. Effect of Nicotinamide Adenine Dinucleotide on the Oxidation-Reduction Potentials of Lipoamide Dehydrogenase from Pig Heart. J. Biochem. 1984, 96, 683–690. [Google Scholar] [CrossRef]


Disclaimer/Publisher’s Note: The statements, opinions and data contained in all publications are solely those of the individual author(s) and contributor(s) and not of MDPI and/or the editor(s). MDPI and/or the editor(s) disclaim responsibility for any injury to people or property resulting from any ideas, methods, instructions or products referred to in the content. |
© 2023 by the authors. Licensee MDPI, Basel, Switzerland. This article is an open access article distributed under the terms and conditions of the Creative Commons Attribution (CC BY) license (https://creativecommons.org/licenses/by/4.0/).
Share and Cite
Mehidine, H.; Kaadou Mouawad, E.; Varlet, P.; Devaux, B.; Abi Haidar, D. Quantitative Endogenous Fluorescence Analysis Discriminates Glioblastoma Tumor through Visible and NIR Excitation. Photonics 2023, 10, 434. https://doi.org/10.3390/photonics10040434
Mehidine H, Kaadou Mouawad E, Varlet P, Devaux B, Abi Haidar D. Quantitative Endogenous Fluorescence Analysis Discriminates Glioblastoma Tumor through Visible and NIR Excitation. Photonics. 2023; 10(4):434. https://doi.org/10.3390/photonics10040434
Chicago/Turabian StyleMehidine, Hussein, Emile Kaadou Mouawad, Pascale Varlet, Bertrand Devaux, and Darine Abi Haidar. 2023. "Quantitative Endogenous Fluorescence Analysis Discriminates Glioblastoma Tumor through Visible and NIR Excitation" Photonics 10, no. 4: 434. https://doi.org/10.3390/photonics10040434