Optical Temperature Sensors Based on Down-Conversion Nd3+,Yb3+:LiYF4 Microparticles

 , and
, and
Abstract
:1. Introduction
2. Materials and Methods
3. Results and Discussion
4. Conclusions
Supplementary Materials
Author Contributions
Funding
Institutional Review Board Statement
Informed Consent Statement
Data Availability Statement
Conflicts of Interest
References
- Cai, T.; Li, Y.; Guo, S.; Peng, D.; Zhao, X.; Liu, Y. Pressure effect on phosphor thermometry using Mg4FGeO6: Mn. Meas. Sci. Technol. 2019, 30, 027001. [Google Scholar] [CrossRef]
- Brites, C.D.; Balabhadra, S.; Carlos, L.D. Lanthanide-based thermometers: At the cutting-edge of luminescence thermometry. Adv. Opt. Mater. 2019, 7, 1801239. [Google Scholar] [CrossRef] [Green Version]
- Zhuang, Y.; Wang, D.; Yang, Z. Upconversion luminescence and optical thermometry based on non-thermally-coupled levels of Ca9Y (PO4)7: Tm3+, Yb3+ phosphor. Opt. Mater. 2022, 126, 112167. [Google Scholar] [CrossRef]
- Khadiev, A.R.; Korableva, S.L.; Ginkel, A.K.; Morozov, O.A.; Nizamutdinov, A.S.; Semashko, V.V.; Pudovkin, M.S. Down-conversion based Tm3+: LiY1-XYbXF4 temperature sensors. Opt. Mater. 2022, 134, 113118. [Google Scholar] [CrossRef]
- Maijer, J.M.; Aarts, L.; Ende, B.M.V.; Vlugt, T.J.H.; Maeijerink, A. Down conversion for solar cells in YF3: Nd3+, Yb3+. Phys. Rev. B 2010, 81, 035107–035116. [Google Scholar] [CrossRef]
- Sun, J.; Sun, Y.; Cao, C.; Xia, Z.; Du, H. Near-infrared luminescence and quantum cutting mechanism in CaWO4: Nd3+, Yb3+. Appl. Phys. B 2013, 111, 367–371. [Google Scholar] [CrossRef]
- Costa, F.B.; Yukimitu, K.; Nunes, L.A.D.O.; Figueiredo, M.D.S.; Silva, J.R.; Andrade, L.H.D.C.; Lima, S.M.; Moraes, J.C.S. High Nd3+→Yb3+ energy transfer efficiency in tungsten-tellurite glass: A promising converter for solar cells. J. Am. Ceram. Soc. 2017, 100, 1956–1962. [Google Scholar] [CrossRef]
- Gomes, L.; Courrol, L.C.; Tarelho, L.V.G.; Ranieri, I.M. Cross-relaxation process between +3 rare-earth ions in LiYF4 crystals. Phys. Rev. B 1996, 54, 3825. [Google Scholar] [CrossRef]
- Hegarty, J.; Huber, D.L.; Yen, W.M. Fluorescence quenching by cross relaxation in LaF3: Pr3+. Phys. Rev. B 1982, 25, 5638. [Google Scholar] [CrossRef]
- Van Wijngaarden, J.T.; Scheidelaar, S.; Vlugt, T.J.H.; Reid, M.F.; Meijerink, A. Energy transfer mechanism for downconversion in the (Pr3+, Yb3+) couple. Phys. Rev. B 2010, 81, 155112. [Google Scholar] [CrossRef] [Green Version]
- Miller, S.A.; Rast, H.E.; Caspers, H.H. Lattice vibrations of LiYF4. J. Chem. Phys. 1970, 52, 4172–4175. [Google Scholar] [CrossRef]
- Semashko, V.V.; Korableva, S.L.; Fedorov, P.P. Lithium Rare-Earth Fluorides as Photonic Materials: 2. Some Physical, Spectroscopic, and Lasing Characteristics. Inorg. Mater. 2022, 58, 447–492. [Google Scholar] [CrossRef]
- Charfi, B.; Damak, K.; Alqahtani, M.S.; Hussein, K.I.; Alshehri, A.M.; Elkhoshkhany, N.; Assiri, A.L.; Alshehri, K.F.; Reben, M.; Yousef, E.S. Luminescence and Gamma Spectroscopy of Phosphate Glass Doped with Nd3+/Yb3+ and Their Multifunctional Applications. Photonics 2022, 9, 406. [Google Scholar] [CrossRef]
- Fedorov, P.P.; Semashko, V.V.; Korableva, S.L. Lithium rare-earth fluorides as photonic materials: 1. Physicochemical characterization. Inorg. Mater. 2022, 58, 223–245. [Google Scholar] [CrossRef]
- Pudovkin, M.S.; Ginkel, A.K.; Lukinova, E.V. Temperature sensitivity of Nd3+, Yb3+: YF3 ratiometric luminescent thermometers at different Yb3+ concentration. Opt. Mater. 2021, 119, 111328. [Google Scholar] [CrossRef]
- Marciniak, L.; Bednarkiewicz, A.; Trejgis, K.; Maciejewska, K.; Elzbieciak, K.; Ledwa, K. Enhancing the sensitivity of a Nd3+, Yb3+: YVO4 nanocrystalline luminescent thermometer by host sensitization. Phys. Chem. Chem. Phys. 2019, 21, 10532–10539. [Google Scholar] [CrossRef]
- Wang, X.; Liu, Q.; Bu, Y.; Liu, C.S.; Liu, T.; Yan, X. Optical temperature sensing of rare-earth ion doped phosphors. Rsc Adv. 2015, 5, 86219–86236. [Google Scholar] [CrossRef]
- Bednarkiewicz, A.; Stefanski, M.; Tomala, R.; Hreniak, D.; Strek, W. Near infrared absorbing near infrared emitting highly-sensitive luminescent nanothermometer based on Nd3+ to Yb3+ energy transfer. Phys. Chem. Chem. Phys. 2015, 17, 24315–24321. [Google Scholar]
- Pudovkin, M.S.; Ginkel, A.K.; Morozov, O.A.; Kiiamov, A.G.; Kuznetsov, M.D. Highly-sensitive lifetime optical thermometers based on Nd3+, Yb3+: YF3 phosphors. J. Lumin. 2022, 249, 119037. [Google Scholar] [CrossRef]
- Santos, H.D.A.; Novais, S.M.V.; Jacinto, C. Optimizing the Nd: YF3 phosphor by impurities control in the synthesis procedure. J. Lumin. 2018, 201, 156–162. [Google Scholar] [CrossRef]
- Pudovkin, M.S.; Korableva, S.L.; Koryakovtseva, D.A.; Lukinova, E.V.; Lovchev, A.V.; Morozov, O.A.; Semashko, V.V. The comparison of Pr3+: LaF3 and Pr3+: LiYF4 luminescent nano-and microthermometer performances. J. Nanoparticle Res. 2019, 21, 266. [Google Scholar] [CrossRef]
- Hu, J.; Xia, H.; Hu, H.; Zhang, Y.; Jiang, H.; Chen, B. Synthesis and efficient near-infrared quantum cutting of Pr3+/Yb3+ co-doped LiYF4 single crystals. J. Appl. Phys. 2012, 112, 073518. [Google Scholar] [CrossRef]
- Bian, X.; Shi, Q.; Wang, L.; Tian, Y.; Xu, B.; Mamytbekov, Z.K.; Huang, P. Near-infrared luminescence and energy transfer mechanism in K2YF5: Nd3+, Yb3+. Mater. Res. Bull. 2019, 110, 102–106. [Google Scholar] [CrossRef]
- Zheng, L.; Wu, H.; Zhang, L.; Luo, Y.; Pan, G.H.; Wang, X.J.; Hao, Z.; Zhang, J. Determination of cross-relaxation efficiency based on spectroscopy in thulium-doped rare-earth sesquioxides. Ceram. Int. 2023, 49, 11060–11066. [Google Scholar] [CrossRef]
- Ximendes, E.C.; Santos, W.Q.; Rocha, U.; Kagola, U.K.; Sanz-Rodríguez, F.; Fernández, N.; Gouveia-Neto, A.D.S.; Bravo, D.; Domingo, A.M.; Rosal, B.D.; et al. Unveiling in vivo subcutaneous thermal dynamics by infrared luminescent nanothermometers. Nano Lett. 2016, 16, 1695–1703. [Google Scholar] [CrossRef]
- Berdowski, P.A.M.; Lammers, M.J.J.; Blasse, G. 5D3-5D4 cross-relaxation of Tb3+ in α-GdOF. Chem. Phys. Lett. 1985, 113, 387–390. [Google Scholar] [CrossRef]
- Zhao, Y.; Wang, X.; Zhang, Y.; Li, Y.; Yao, X. Optical temperature sensing of up-conversion luminescent materials: Fundamentals and progress. J. Alloy. Compd. 2020, 817, 152691. [Google Scholar] [CrossRef]
- Cadiau, A.; Brites, C.D.; Costa, P.M.; Ferreira, R.A.; Rocha, J.; Carlos, L.D. Ratiometric nanothermometer based on an emissive Ln3+-organic framework. ACS Nano 2013, 7, 7213–7218. [Google Scholar] [CrossRef] [PubMed]
- Matuszewska, C.; Elzbieciak-Piecka, K.; Marciniak, L. Transition metal ion-based nanocrystalline luminescent thermometry in SrTiO3: Ni2+, Er3+ nanocrystals operating in the second optical window of biological tissues. J. Phys. Chem. C 2019, 123, 18646–18653. [Google Scholar] [CrossRef]
- Gharouel, S.; Labrador-Páez, L.; Haro-González, P.; Horchani-Naifer, K.; Férid, M. Fluorescence intensity ratio and lifetime thermometry of praseodymium phosphates for temperature sensing. J. Lumin. 2018, 201, 372–383. [Google Scholar] [CrossRef]
- Rocha, U.; Upendra Kumar, K.; Jacinto, C.; Ramiro, J.; Caamano, A.J.; Garcia Sole, J.; Jaque, D. Nd3+ doped LaF3 nanoparticles as self-monitored photo-thermal agents. Appl. Phys. Lett. 2014, 104, 053703. [Google Scholar] [CrossRef] [Green Version]
- Trannoy, V.; Carneiro Neto, A.N.; Brites, C.D.; Carlos, L.D.; Serier-Brault, H. Engineering of mixed Eu3+/Tb3+ metal-organic frameworks luminescent thermometers with tunable sensitivity. Adv. Opt. Mater. 2021, 9, 2001938. [Google Scholar] [CrossRef]
- Pudovkin, M.; Oleynikova, E.; Kiiamov, A.; Cherosov, M.; Gafurov, M. Nd3+, Yb3+: YF3 Optical Temperature Nanosensors Operating in the Biological Windows. Materials 2022, 16, 39. [Google Scholar] [CrossRef] [PubMed]
- Wei, H.; Cui, F.; Guo, W.; Ye, R.; Lei, L. Nd3+-sensitized NIR downshifting emission in NaYbF4: Nd@NaYF4: Nd nanoparticles for deep tissue temperature sensing. Opt. Mater. 2022, 124, 112016. [Google Scholar] [CrossRef]


| Sample | Transitions, Detected Wavelengths, and Conditions of the Excitation | Maximum Sa [K−1] | Maximum Sr [%/K] | T,K | Ref. |
|---|---|---|---|---|---|
| Tb0.99Eu0.01(BDC)1.5(H2O)2 | Eu3+ (5D0–7F2), Tb3+ (5D4–7F5) λex = 320 nm | - | 0.14 | 283–333 | [28] |
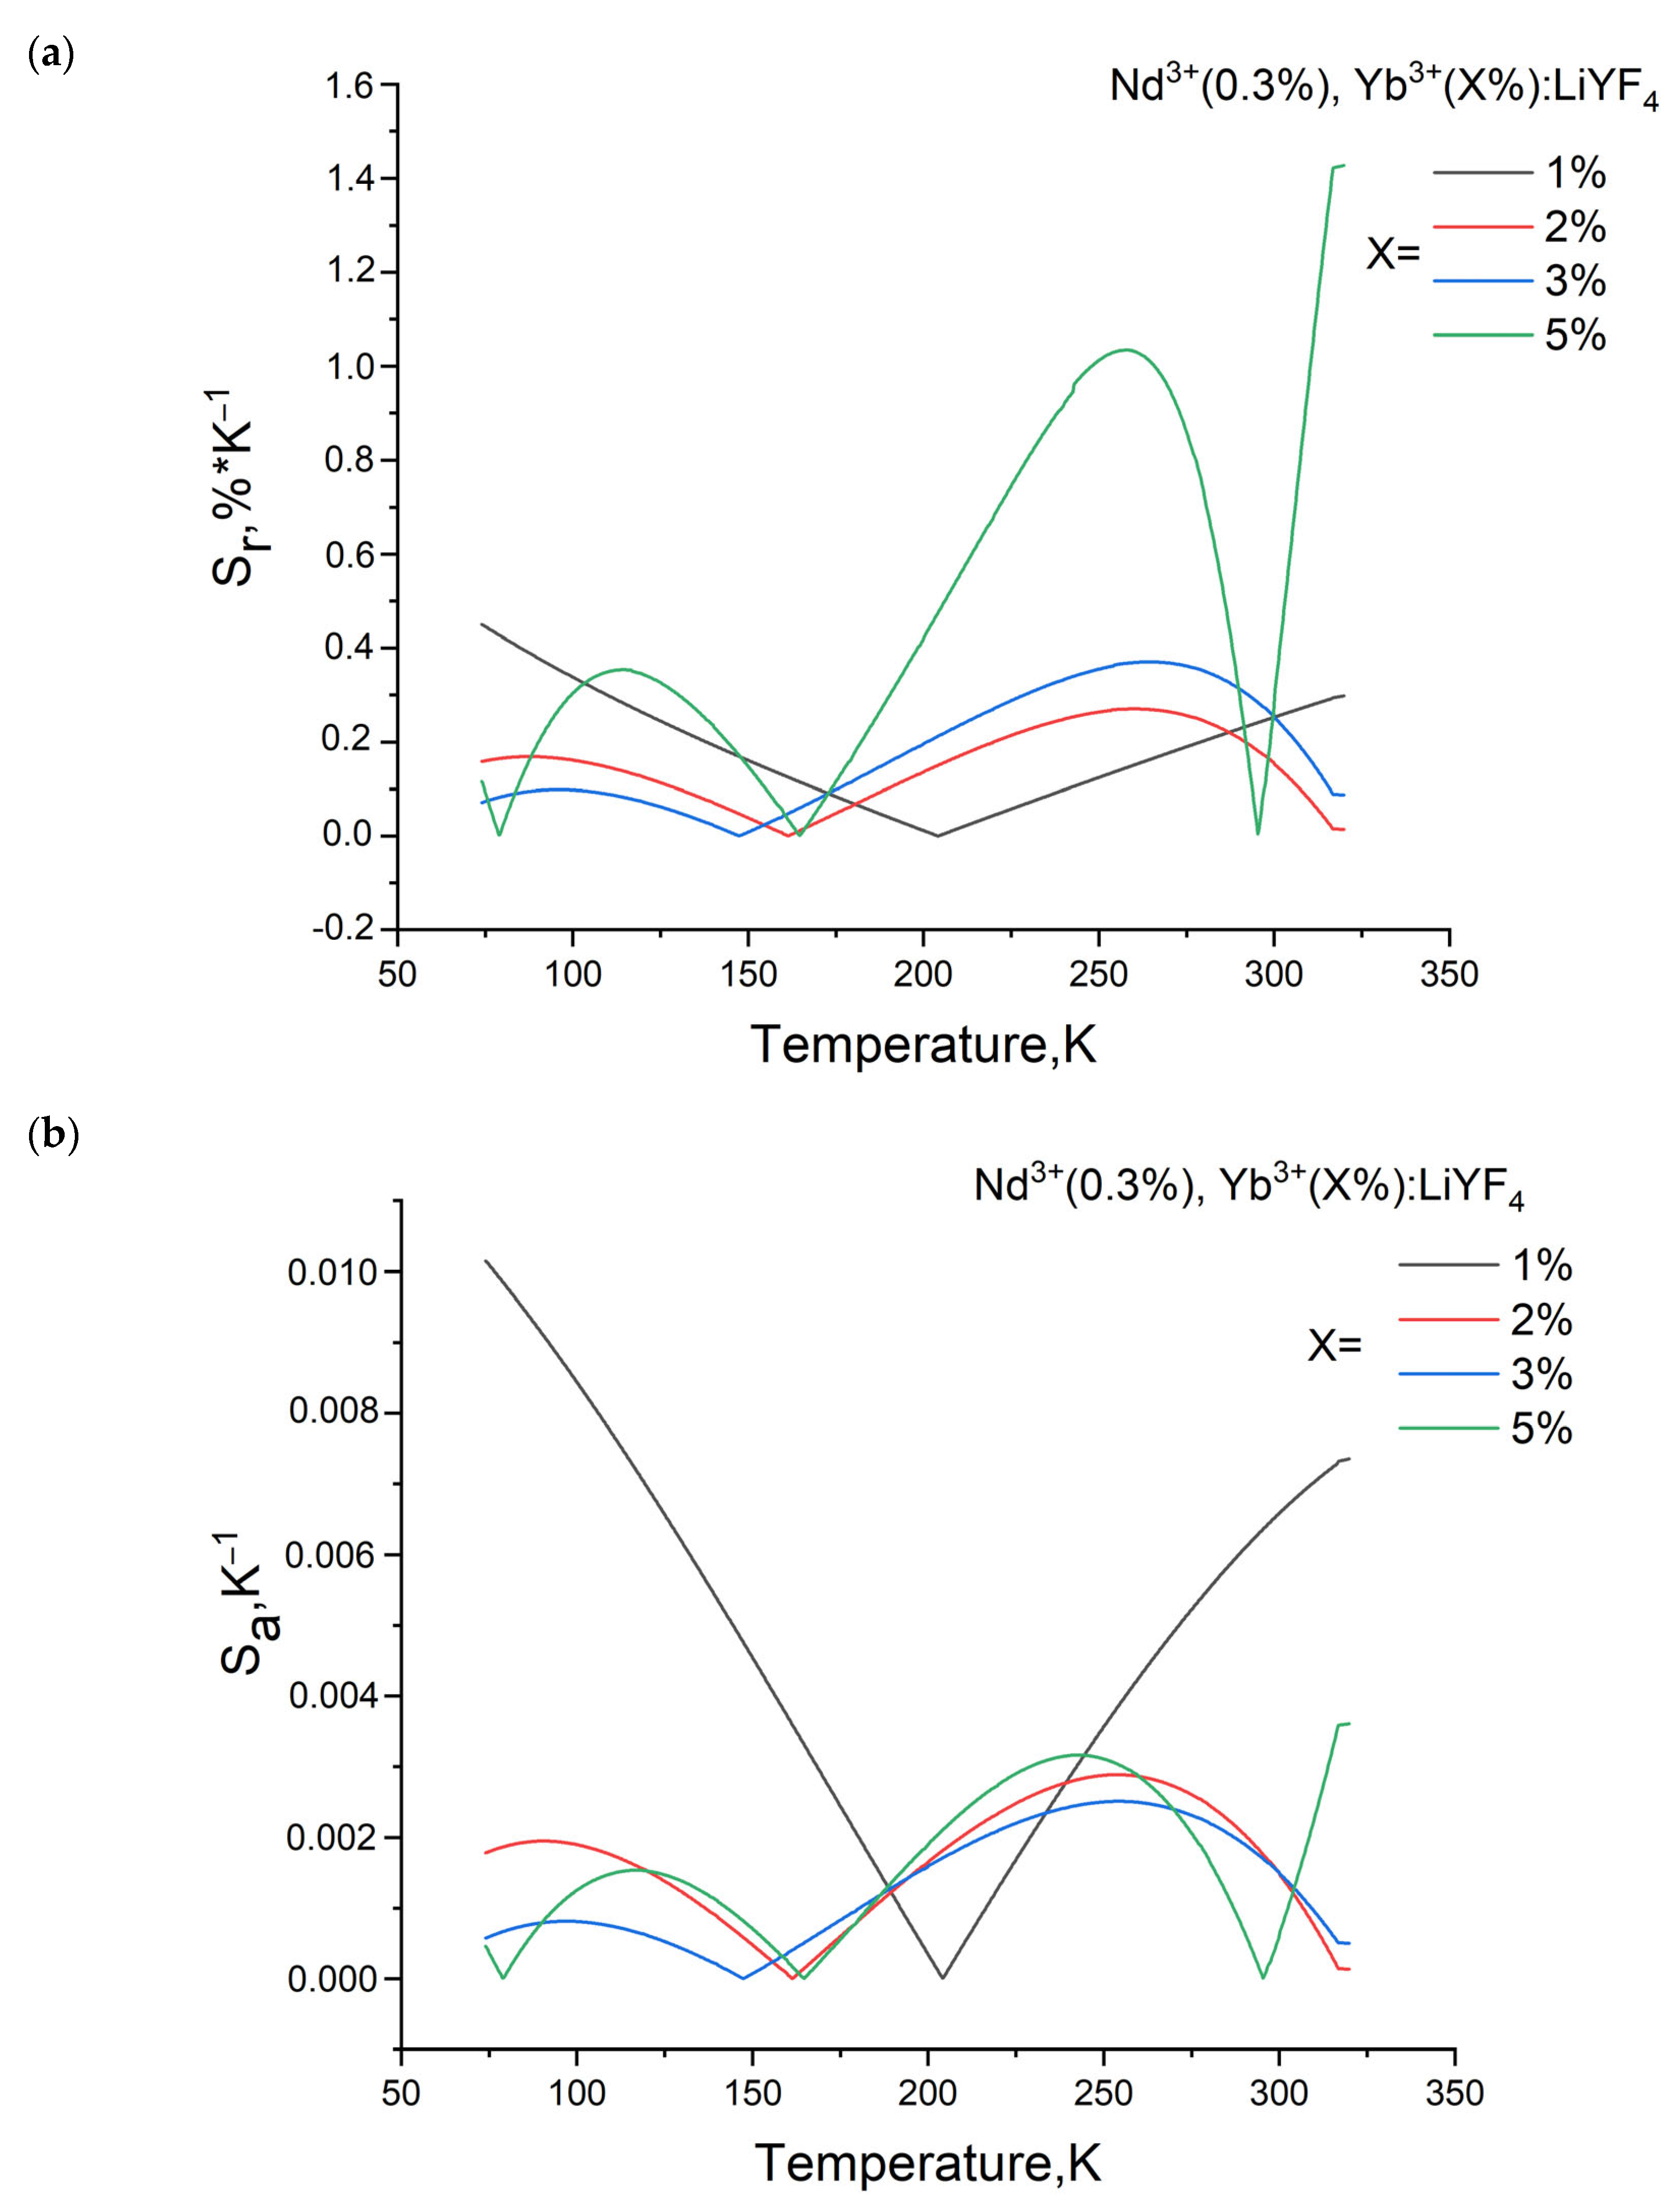
| LiYF4: Nd3+, Yb3+ | Nd3+ (4F3/2–4I9/2), Yb3+ (4F5/2–2F7/2), λex = 520 nm | 0.007 | 1.03 | 240–320 | This work |
| SrTiO3:Ni2+,Er3+ | Er3+ (4I13/2 → 4I15/2) Ni2+ (3T2g(F)→ 3A2g(F)), λex = 375 nm | - | 0.76 | 303 | [29] |
| YVO4:Nd3+ | Nd3+ (4F3/2–4I11/2) λex = 808 nm | - | 0.46 | 323 | [16] |
| PrP5O14 | Pr3+ (3P0 → 1D2) λex = 488 nm | - | 0.46 | 363 | [30] |
| NaPr(PO3)4 | Pr3+ (3P0 –3H6) λex = 488 nm | 0.0043 | - | 300–365 | [30] |
| LaF3:Nd3+ | Nd3+ (4F3/2 -4I9/2) λex = 808 nm | - | 0.1 | 293 | [31] |
| MOF: Eu3+/Tb3+ | Tb3+ (5D4→ 7F5) and Eu3+ (5D0→ 7F2) λex = 340 nm | - | 0.57 | 150–300 | [32] |
| YF3: Nd3+, Yb3+ | Nd3+ (4F5/2–4I11/2) λex = 790 nm | 0.64 | 0.92 | 100 | [33] |
| NaYbF4: Nd@NaYF4: Nd | Nd3+ (4F5/2–4I11/2) λex = 790 nm | 0.7 | 300 | [34] |
Disclaimer/Publisher’s Note: The statements, opinions and data contained in all publications are solely those of the individual author(s) and contributor(s) and not of MDPI and/or the editor(s). MDPI and/or the editor(s) disclaim responsibility for any injury to people or property resulting from any ideas, methods, instructions or products referred to in the content. |
© 2023 by the authors. Licensee MDPI, Basel, Switzerland. This article is an open access article distributed under the terms and conditions of the Creative Commons Attribution (CC BY) license (https://creativecommons.org/licenses/by/4.0/).
Share and Cite
Ginkel, A.; Pudovkin, M.; Oleynikova, E.; Korableva, S.; Morozov, O. Optical Temperature Sensors Based on Down-Conversion Nd3+,Yb3+:LiYF4 Microparticles. Photonics 2023, 10, 375. https://doi.org/10.3390/photonics10040375
Ginkel A, Pudovkin M, Oleynikova E, Korableva S, Morozov O. Optical Temperature Sensors Based on Down-Conversion Nd3+,Yb3+:LiYF4 Microparticles. Photonics. 2023; 10(4):375. https://doi.org/10.3390/photonics10040375
Chicago/Turabian StyleGinkel, Anna, Maksim Pudovkin, Ekaterina Oleynikova, Slella Korableva, and Oleg Morozov. 2023. "Optical Temperature Sensors Based on Down-Conversion Nd3+,Yb3+:LiYF4 Microparticles" Photonics 10, no. 4: 375. https://doi.org/10.3390/photonics10040375