Article

Effect of Pulsation in Microstructure and Mechanical Properties of Titanium Alloy-Annealed Welded Joints at Different Temperatures

1
Department of Mechanical Engineering, Dumka Engineering College, Dumka 814101, India
2
Department of Mechanical Engineering, Indian Institute of Technology (ISM), Dhanbad 826004, India
3
Mechanical Engineering Department, College of Engineering, King Saud University, Riyadh 11421, Saudi Arabia
4
Department of Mechanical Engineering, University Centre for Research and Development (UCRD), Chandigarh University, Mohali 140413, India
5
School of Mechanical and Automotive Engineering, Qingdao University of Technology, Qingdao 266520, China
6
G.L. Bajaj Institute of Technology & Management, Gautam Buddha Nagar, Greater Noida 201306, India
7
Department of Architecture and Architectural Engineering, Nihon University, Tokyo 102-0074, Japan
8
Department of Nuclear and Renewable Energy, Ural Federal University Named after the First President of Russia, Boris Yeltsin, 19 Mira Street, 620002 Ekaterinburg, Russia
9
Department of Mechanical and Industrial Engineering, Manipal Institute of Technology, Manipal Academy of Higher Education, Manipal 576104, India
10
Department of Mechanical Engineering, National University of Singapore, Singapore 119077, Singapore
*
Authors to whom correspondence should be addressed.
Photonics 2023, 10(4), 372; https://doi.org/10.3390/photonics10040372
Submission received: 13 February 2023 / Revised: 20 March 2023 / Accepted: 23 March 2023 / Published: 27 March 2023

Abstract

:
Thin sheets of Ti-6Al-4V alloy of thickness 1 mm were butt welded using a pulsed Nd-YAG low-power laser setup. The goal of this research is to explore the influence of pulsation on the microstructure and mechanical properties. In addition to that, annealing at different temperatures has been performed to compare the results of pulsation and heat treatment. The results indicate that after annealing at 980 °C, the structure completely transformed into an equiaxed structure. When annealed at 1010 °C, almost the total area is composed of an equiaxed α phase, and the grains are coarse as compared to the previous. This suggests that the grain size becomes thicker when the annealing temperature is raised above 980 °C. The volume fraction of the equiaxed structure is maximum. It can be deduced that the volume–fraction is dependent on the annealing temperature. The volume fraction of the equiaxed structure increases as the annealing temperature increases. A higher tensile strength value of the sample annealed at 980 °C was found as compared with the overlapped sample (A-2). The fusion zone overlapped sample (A-2) shows high hardness with a value of 397 HV1. In the FZ sample, annealing at 980 °C has a hardness of 386 HV1. The (A-2) sample indicates higher (3–4%) hardness as compared to the annealed sample at the FZ. The β phase is increased by 16% in the XRD analysis of the overlapped samples. Hence, it is evident that the amount of β phase has increased during heating, and a complete transformation has taken place at a temperature of 958 °C.

1. Introduction

In the recent generation, titanium alloys are one of the most widely used materials in the field of research. Among all the titanium alloys, the Ti-6Al-4V alloy is threatening its dominant position [1,2]. Nd-YAG pulsed laser is suitable for titanium alloys. Titanium alloys have been widely used due to their low density, high melting point, good corrosion resistance, and high operating temperature [3].
The Ti-6Al-4V-based alloys are prevalently utilized in numerous turbine discs, compressor blades, airframes, jet engine rings, pressure vessels, propulsion system cases, helicopter rotor hubs, fitting connectors, medical surgery equipment, spatial laboratory compartments, inlet air conduits, and titanium caplet sachets containing the iodine125 radio-isotope in use for cancer radiotherapy [4]. Ti-6Al-4V is a two-phase alloy with aluminum as the alpha-stabilizers and vanadium as the beta-stabilizers that have excellent strength and low densities, as well as remarkable tensile characteristics up to 450 °C. Appropriate heat treatment could also be employed to achieve the optimal mix combination of characteristics. In the new generation, Nd-YAG lasers have been extensively used due to their good beam quality, low cost of maintenance, lower beam divergence, flexible beam delivery, and compact size [4]. Nd-YAG and other lanthanide-based laser systems might be employed on practically all materials because of their lower wavelength, enabling absorption by nearly the majority of metallic materials and alloys [5].
Laser welding is a very complex process depending on several parameters; Tzeng [6] has studied the influence of pulsed laser process parameters on material processing. A mathematical equation for the overlapping factor was developed. The study showed that the average peak power density was the most predominant processing parameter that influences weldability to a great extent. Torkamany et al. [7] worked on the peak power dependence on the keyhole formed during laser welding. The result showed that the keyhole shape is transformed from a conical shape into a cylindrical shape with increasing the overlapping factor. Ghaini et al. [8] examined the influence of pulse energy, pulse duration, and welding speed on microstructure and mechanical properties. It was reported that on high-peak power density, the weld exhibited high values of hardness with respect to low-peak power density. Torkamany et al. [9] systematically investigated the impact of the process parameter on the weld-bead profile. It was suggested that the increased peak power was not a suitable strategy for deep penetration because, at high-peak power, the porosity increases greatly. Gao et al. [10] studied the correlation between the overlapping factor and welding parameters. It was revealed that upon increasing the overlapping factor, the porosity decreases, and the porosity is almost absent in the weld joint at a 75% overlapping factor. With further increases in the overlapping factor, the grains become coarser. Baruah and Bag [11] worked, in detail, on the pulse parameter of the laser heat source and found that the distortion rises with the rise in heat input because of the high amount of heat available in a particular area. Sabbaghzadeh et al. [12] developed a mathematical formula for calculating the melting ratio in overlapping pulsed Nd-YAG laser welding. Results indicate that the melting ratio largely depends on the variation of overlapping factor and peak power. The variation in welding speed does not have a greater effect on the melting ratio. Baghjari and Mousavi [13] worked on martensitic stainless steel to investigate the variation of hardness and mechanical properties. The report shows that the existence of remaining delta-ferrite in the weld structures is responsible for the increase in the hardness value. Lapsanska [14] was focused on the influence of energy and its changes in small ranges. A mathematical expression was derived to discuss the effective peak power density. The surface roughness increases as the energy increases.
It is clear that there has not been much study on the influence of overlapping factor of laser-welding of Ti-6Al-4V alloys though this approach has vibrant merits over other methods. No one has performed a comparative analysis of mechanical properties between different overlapping factors and annealing at different temperatures. In this present work, the influence of different overlapping factors on the weld quality of low-power Nd-YAG laser-welded Ti-6Al-4V thin-sheet annealed joints has been studied and compared.

2. Material and Method

2.1. Work Material

Ti-6Al-4V sheets of thickness 1 mm were used as the work material. The Ti-6Al-4V has two alloying elements: aluminum and vanadium. Aluminum generally stabilizes the alpha phase, and vanadium stabilizes the beta phase. The mechanical properties of the as-received material are given in Table 1.
The chemical composition (wt. %) from the EDS analysis of the Ti-6Al-4V base material has been presented in Table 2. The analysis confirms the expected composition of the material.

2.2. Laser Welding Procedures

A pulsed mode 600W Nd-YAG laser was employed to weld the titanium alloys (Ti-6Al-4V) sheet. Table 3 represents the specification of the Nd-YAG laser setup. Argon (AR) was chosen as a shielding gas. Figure 1 depicts the overall experiment welding apparatus with sample dimensions of 165 × 50 × 1 mm.
To study the laser weld quality significantly, we chose different overlapping factors for experimentation on varying the welding speed (V). Pure argon gas with a flow rate of 8 L/min was used for shielding. The welding speed was varied on 4 levels: namely 180, 240, 300, and 360 mm/min. During the experiment, standoff distance was kept at 3 mm. The welding has been performed from Nd-YAG laser welding setup of power ranges from 50 to 600 watts. The specimen’s size was (L × B × T) 165 × 50 × 1 mm. Every specimen was placed on the welding table just directly below the laser head.
The thin Ti-6Al-4V sheets were cleaned properly with acetone just before the welding. The two specimens of the same size are kept on the welding table just below the laser head, as shown in Figure 1. The edges are aligned properly and kept just below the laser head. Finally, after ensuring all the alignment and clamping, the welding was performed. A protective glass was used during welding to protect operators’ eyes from harmful rays. Highly pure commercial argon gas was employed as a protective gas in the welding process. During the welding, the gas flow rate was kept at 8 L/min. Initially, few welding tests were carried out to find suitable values of process parameters on the basis of good penetration and batter weldability [15,16]. From a large number of welding tests, four combinations of overlapping factor rates that had good penetration and superior weld qualities were selected. We prepared our samples based on these four parameters. Five to six samples were drawn on each set of parameters.

2.3. Annealing

The selected weld samples were subjected to heat treatments to study the differences in mechanical properties. Three temperatures were used for the annealing process 950 °C, 980 °C, and 1010 °C, respectively. The duration of annealing was one hour. The furnace chamber dimensions were 400 mm × 400 mm × 600 mm. Specimens were kept in the horizontal direction. After heating, the sample was kept inside for one hour and then taken out.

2.4. Cross-Section and Metallographic Observation

For the metallographic analysis, the section perpendicular to the weld surface was cut and polished by grinding paper of various grit sizes ranging from 400 to 1500. The samples were polished for the same polishing time (5 min) with each grit size of paper. All specimens were polished in a clockwise direction as well as anti-clockwise direction for the same period of time. The polished surfaces of the samples were treated with Keller’s reagents for 25 s for optical microscope image and 3 to 4 min for FESEM image. All activities were performed at room temperature.

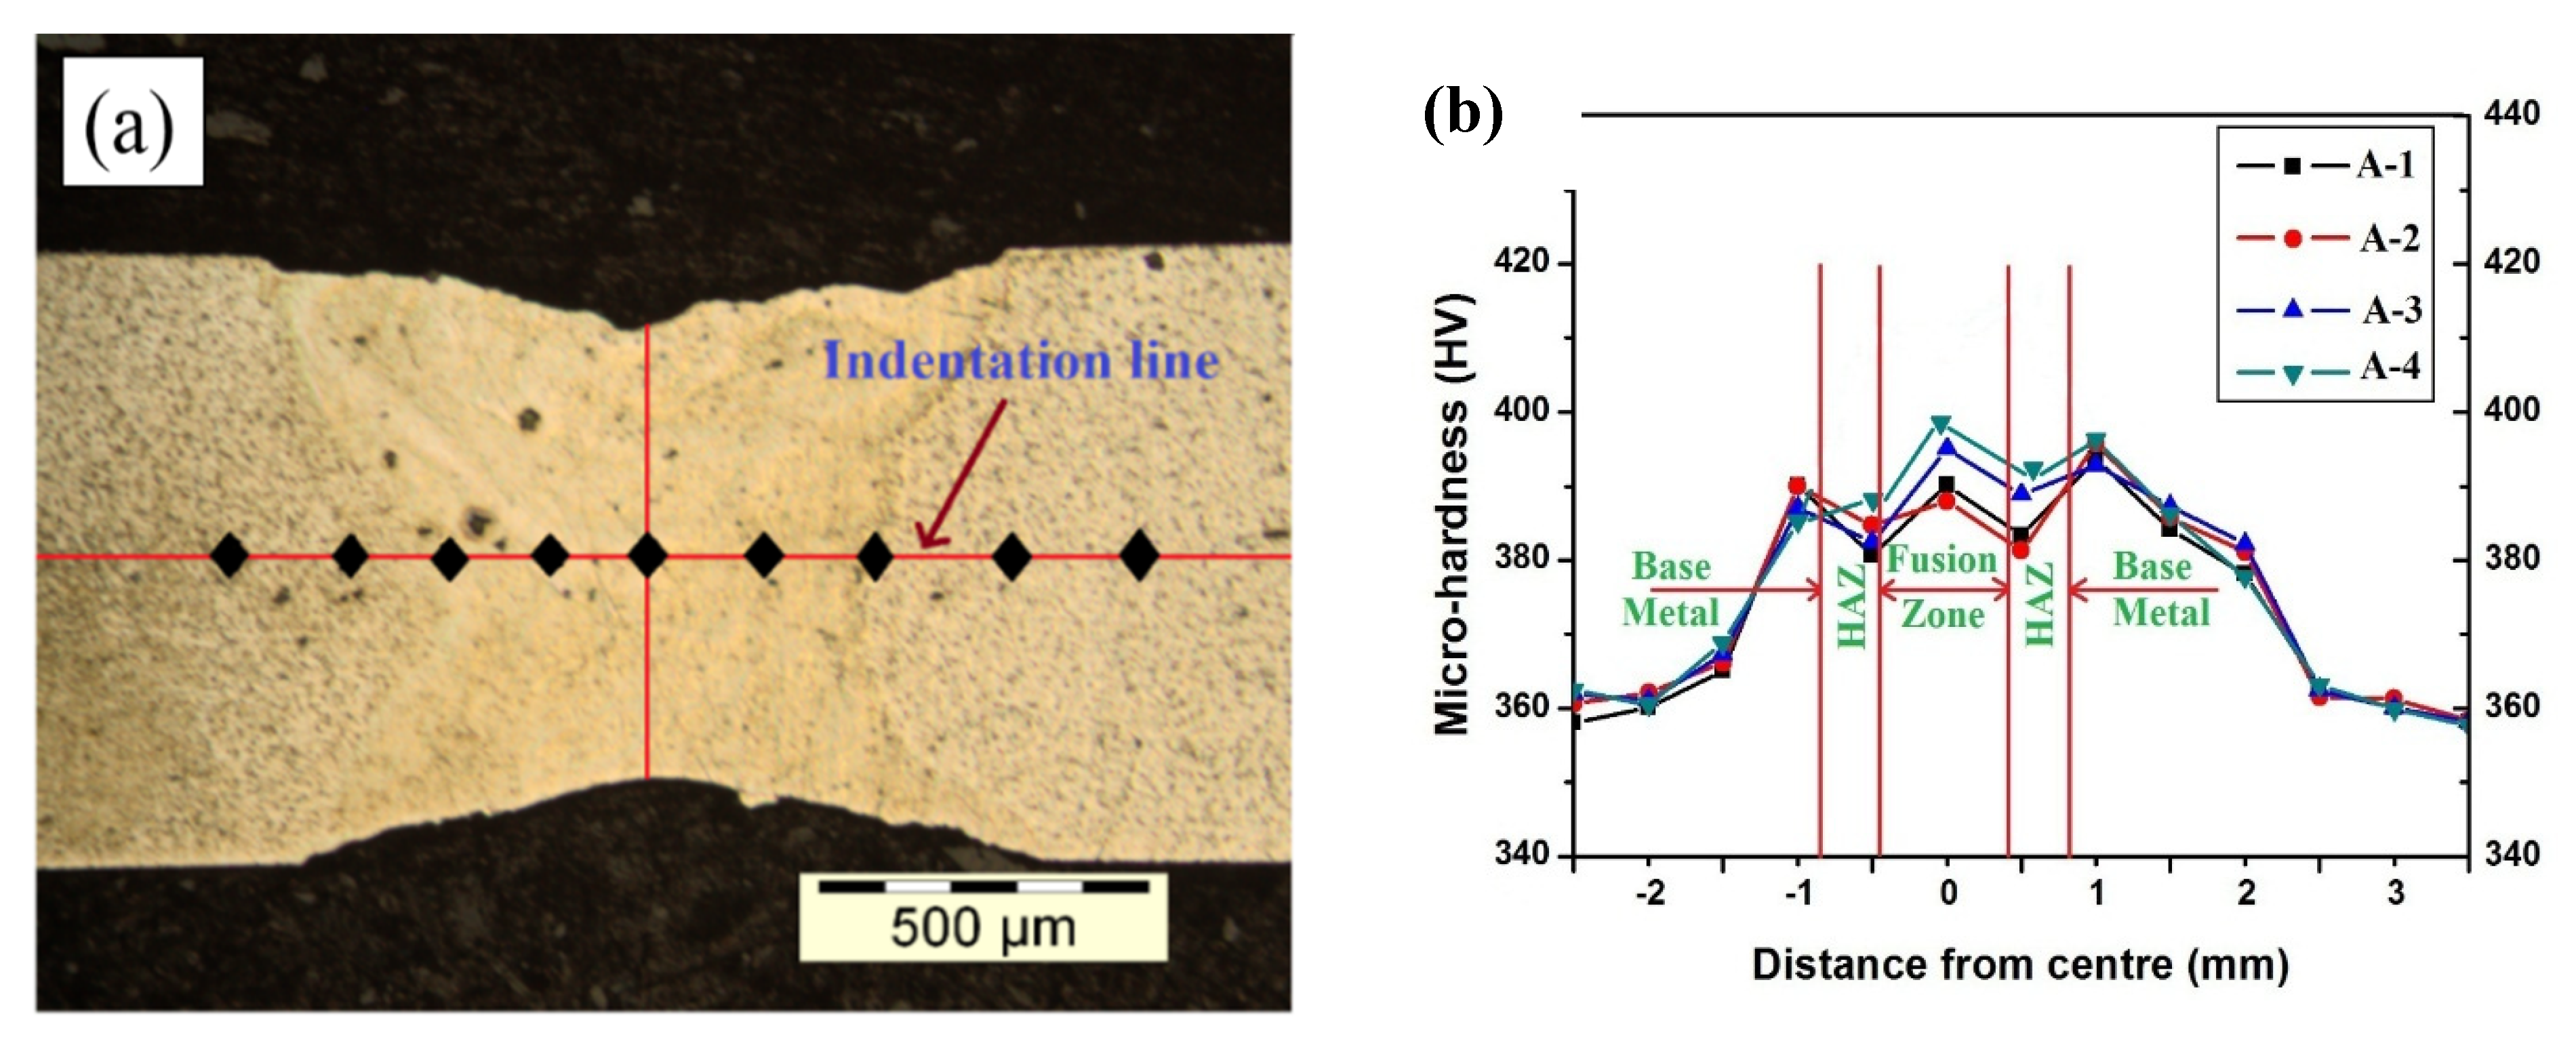
2.5. Procedures of Measurement of Microhardness

For the microhardness measurement of the samples was performed on VHM (Vickers hardness machine ECONOMENT VH-1MD) at room temperature. The indentation load during the measurement was 1 kg and the dwell time was 10 s. Polished samples were used for hardness measurement. The direction of hardness measurement was along the length, focusing on weld bead at the center position. Four measurements of each sample were recorded to minimize error.

2.6. Procedures for Tensile Test

All samples were prepared in accordance with the ASTM E8 standard. The Tensile Testing Machine (BISS) was fully automated with a maximum load-carrying capacity of 25 kN. The strain rate of the sample was kept constant at 0.0001/sec during the test. Using a rubber band, we attached an axial extensometer to the middle of the gauge section of the sample. All data were recorded by a computer, which was connected to the test machine. Three tensile specimens were prepared for each test. The average value of all data is taken for plotting graphs and analysis. All activities were performed at room temperature.

3. Results and Discussions
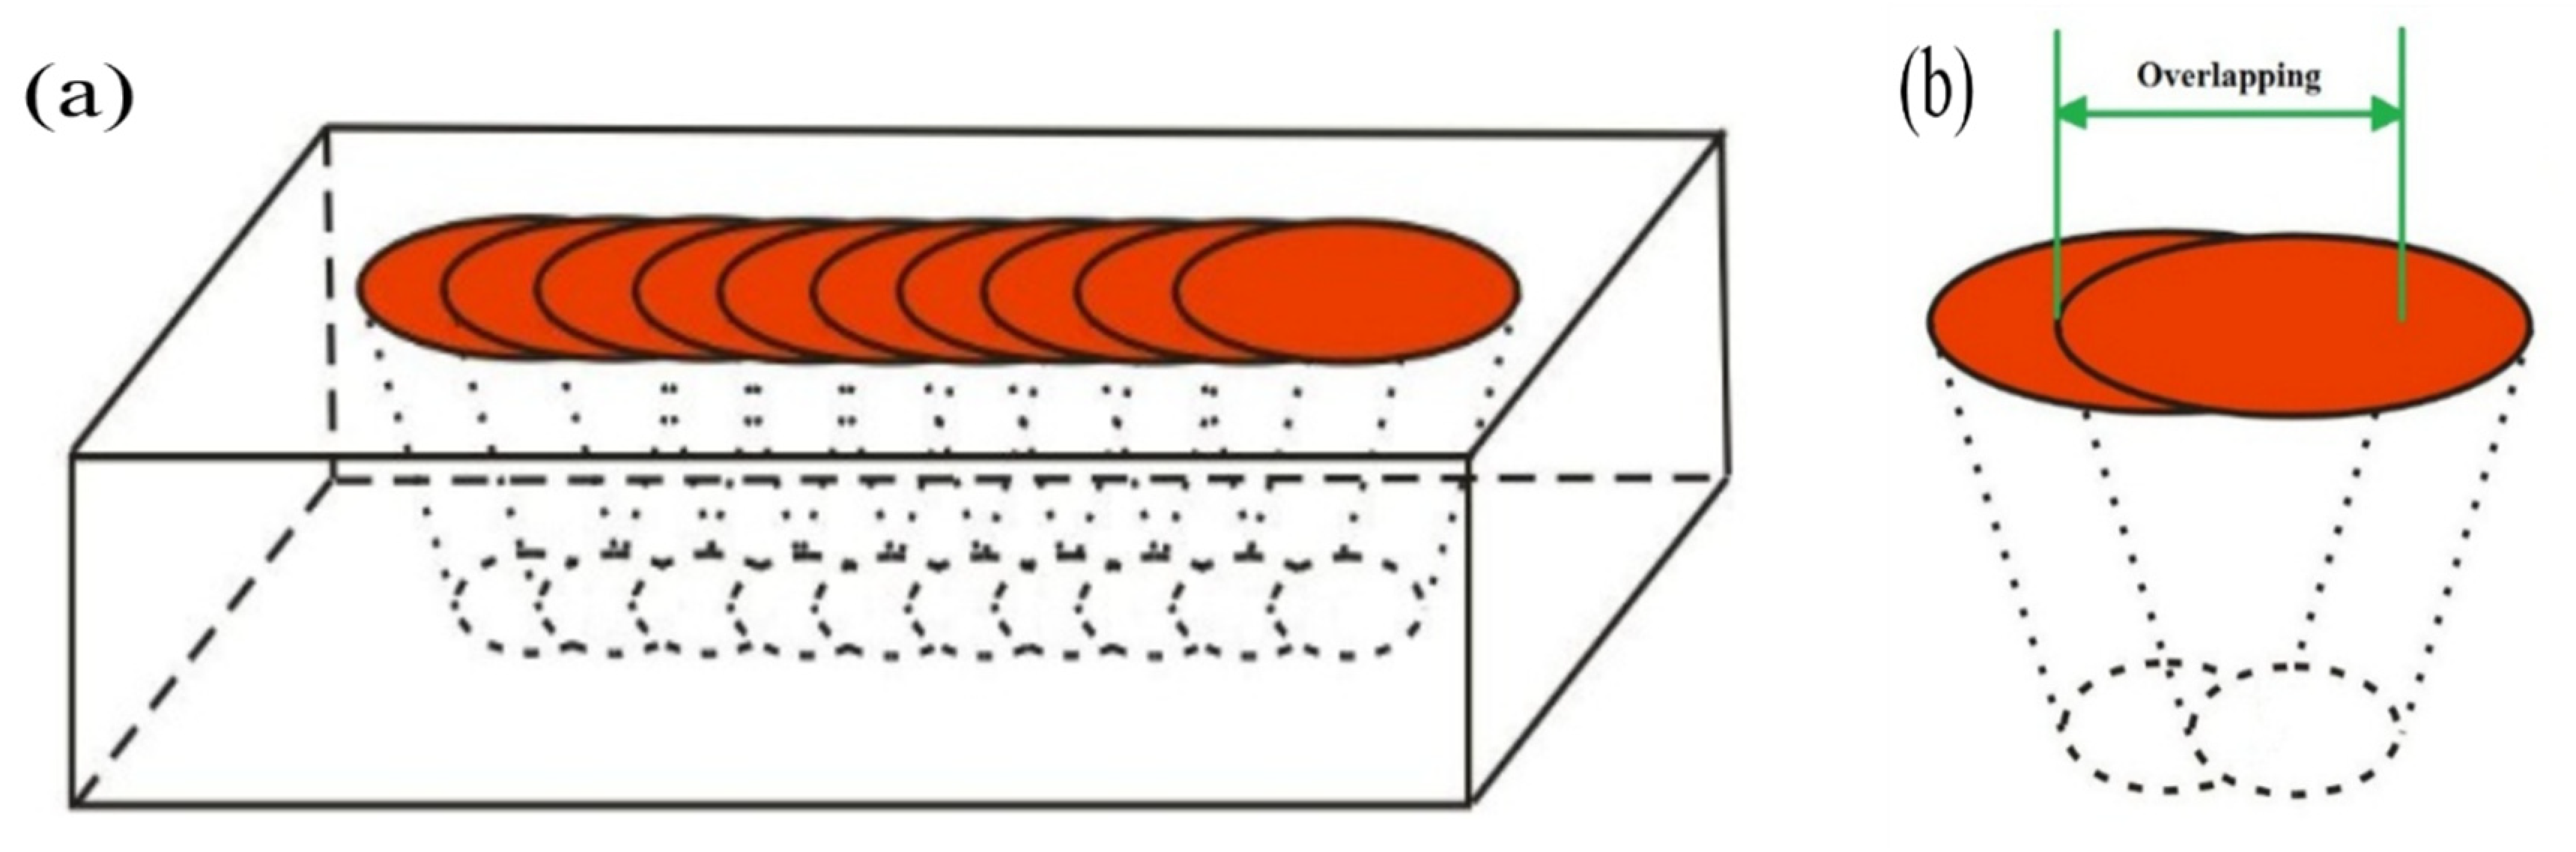
3.1. Overlap Theory

In pulse mode laser welding, the seam consists of a series of periodic spots, and these spots are partially overlapped. The correct overlapping rate also greatly improves the mechanical properties. Figure 2 shows the series of pulse trains. The overlapping percentage rate can be calculated using Equation (1) [6].
Overlapping   % O % = 1 V f D + V T × 100
where V is welding speed, f is frequency of the laser, D is spot diameter of the laser, and T is pulse duration.
A peak power of 192 W has been kept constant for the entire configuration, together with other parameters, as presented in Table 4. The welding speed was the only parameter that varied.
The analysis of the weld joint suggested that the welding speed of 4 mm/sec gave the best result.

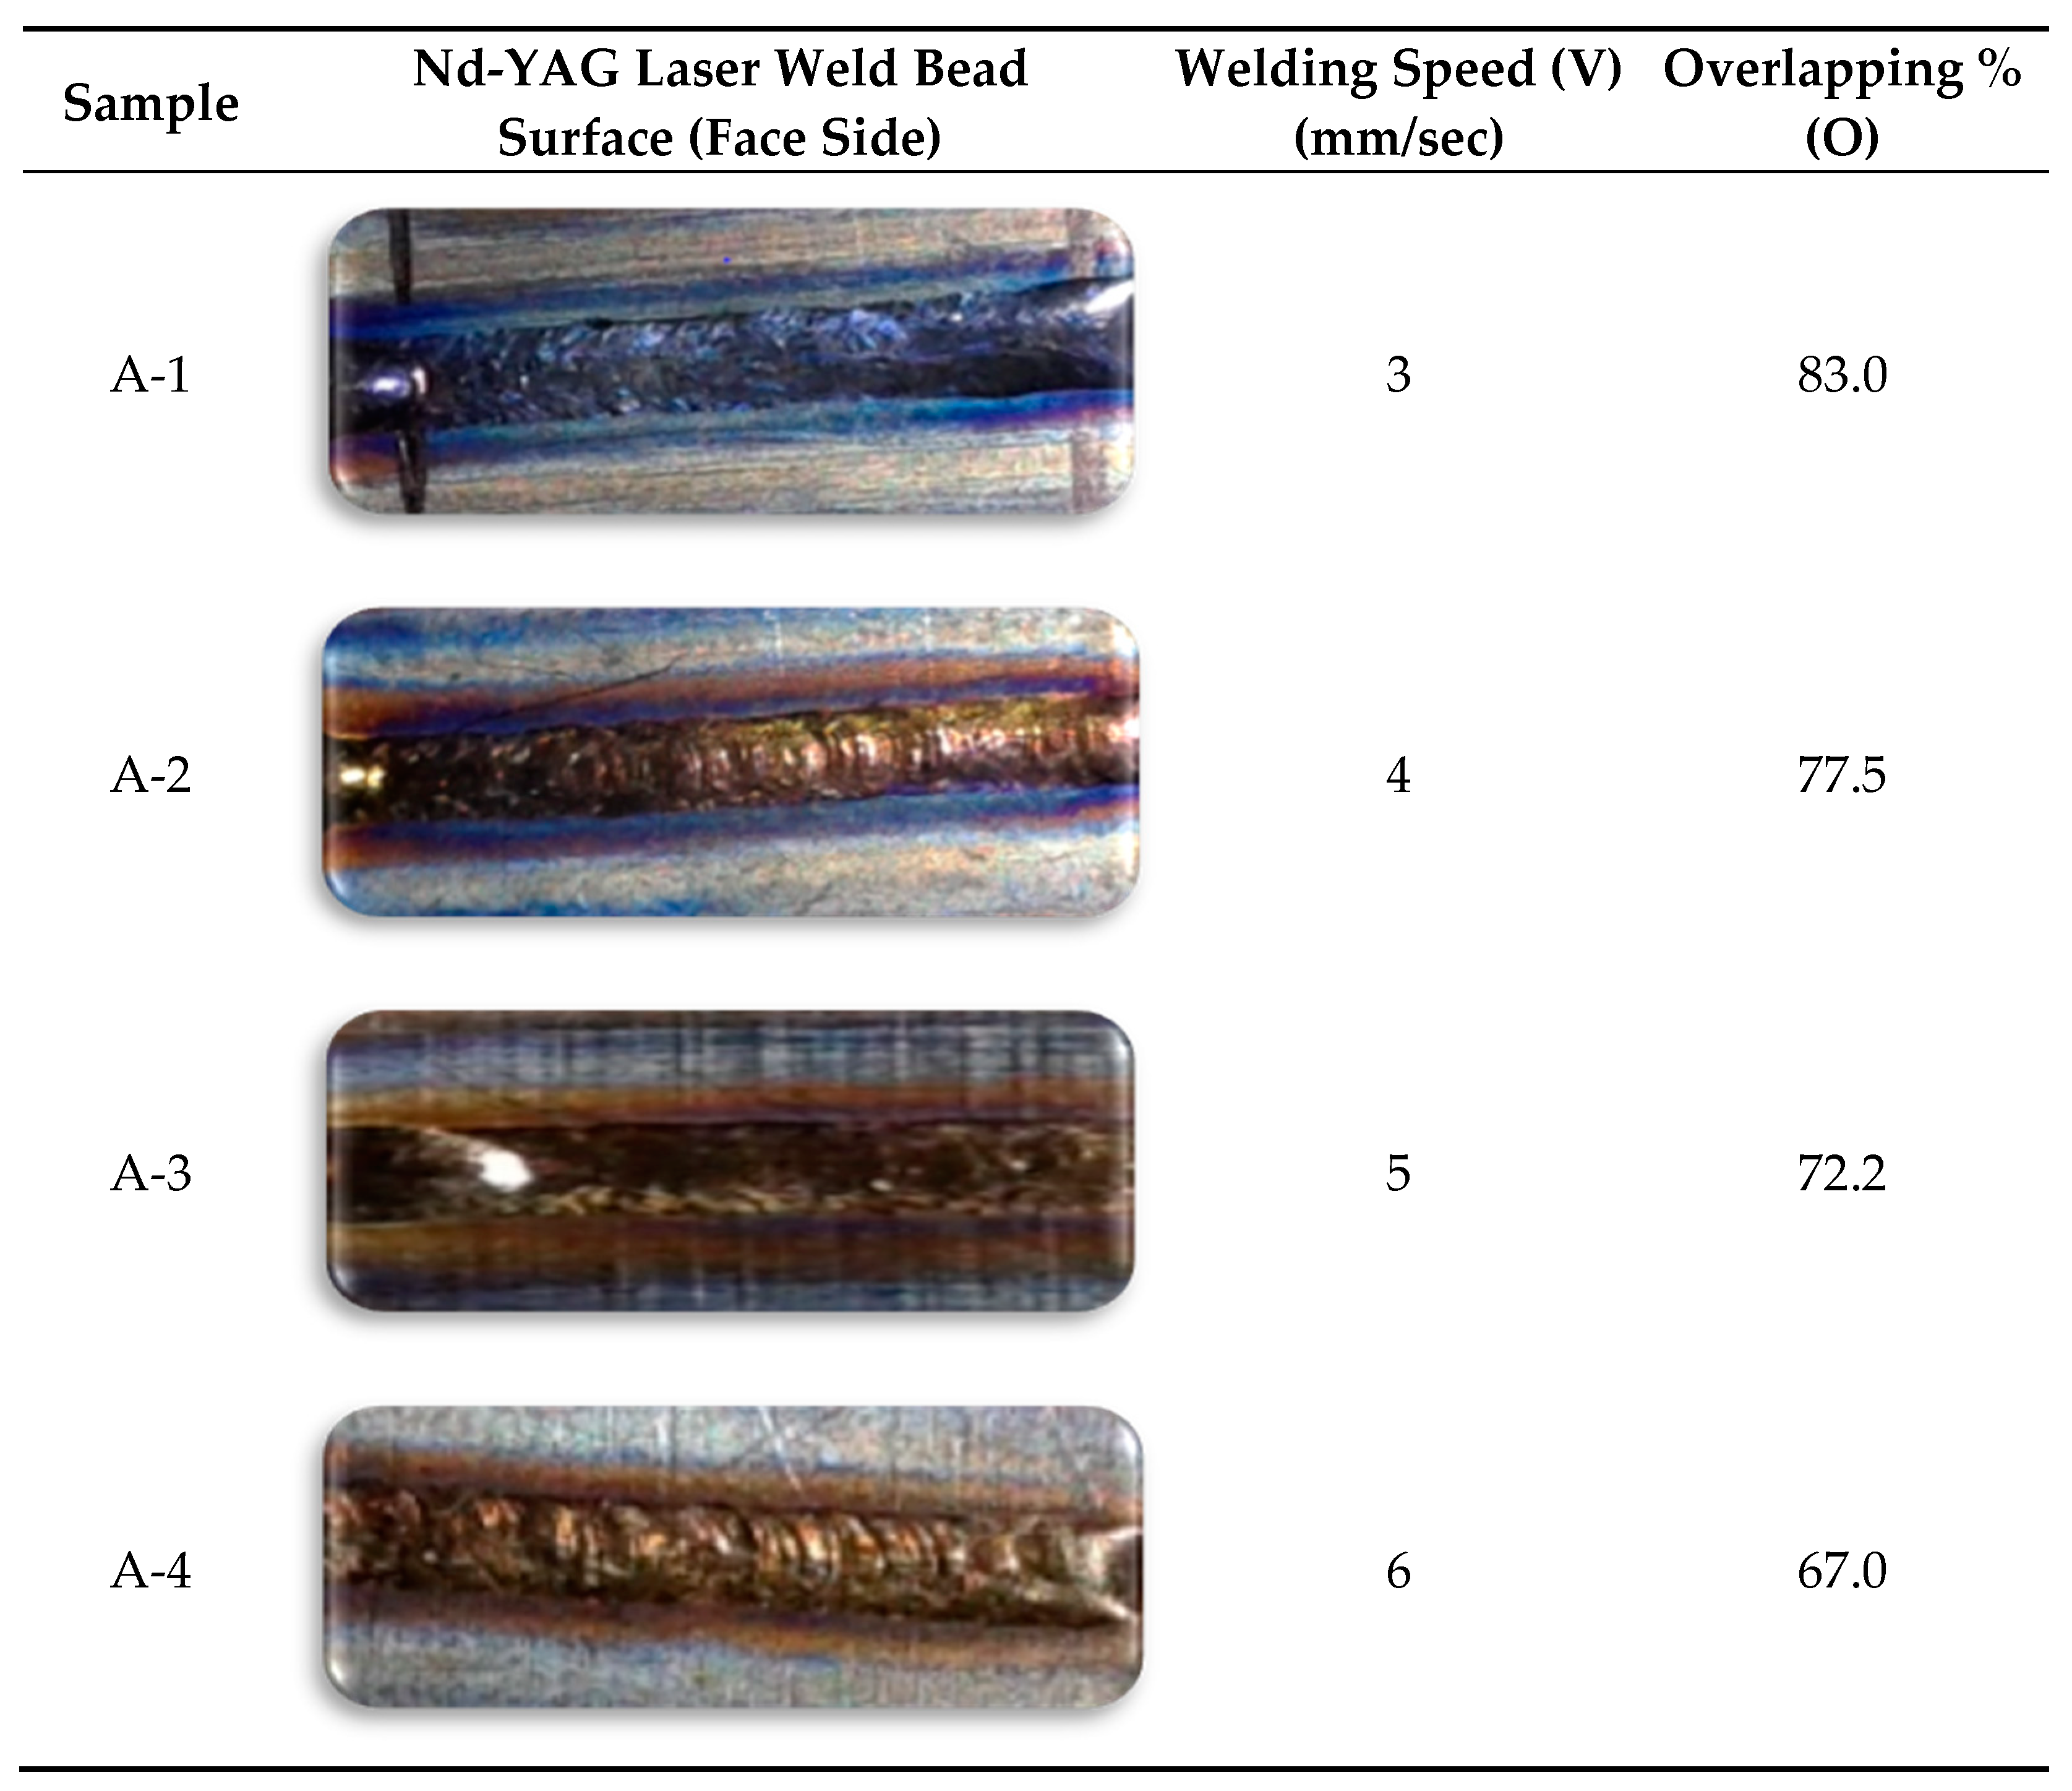
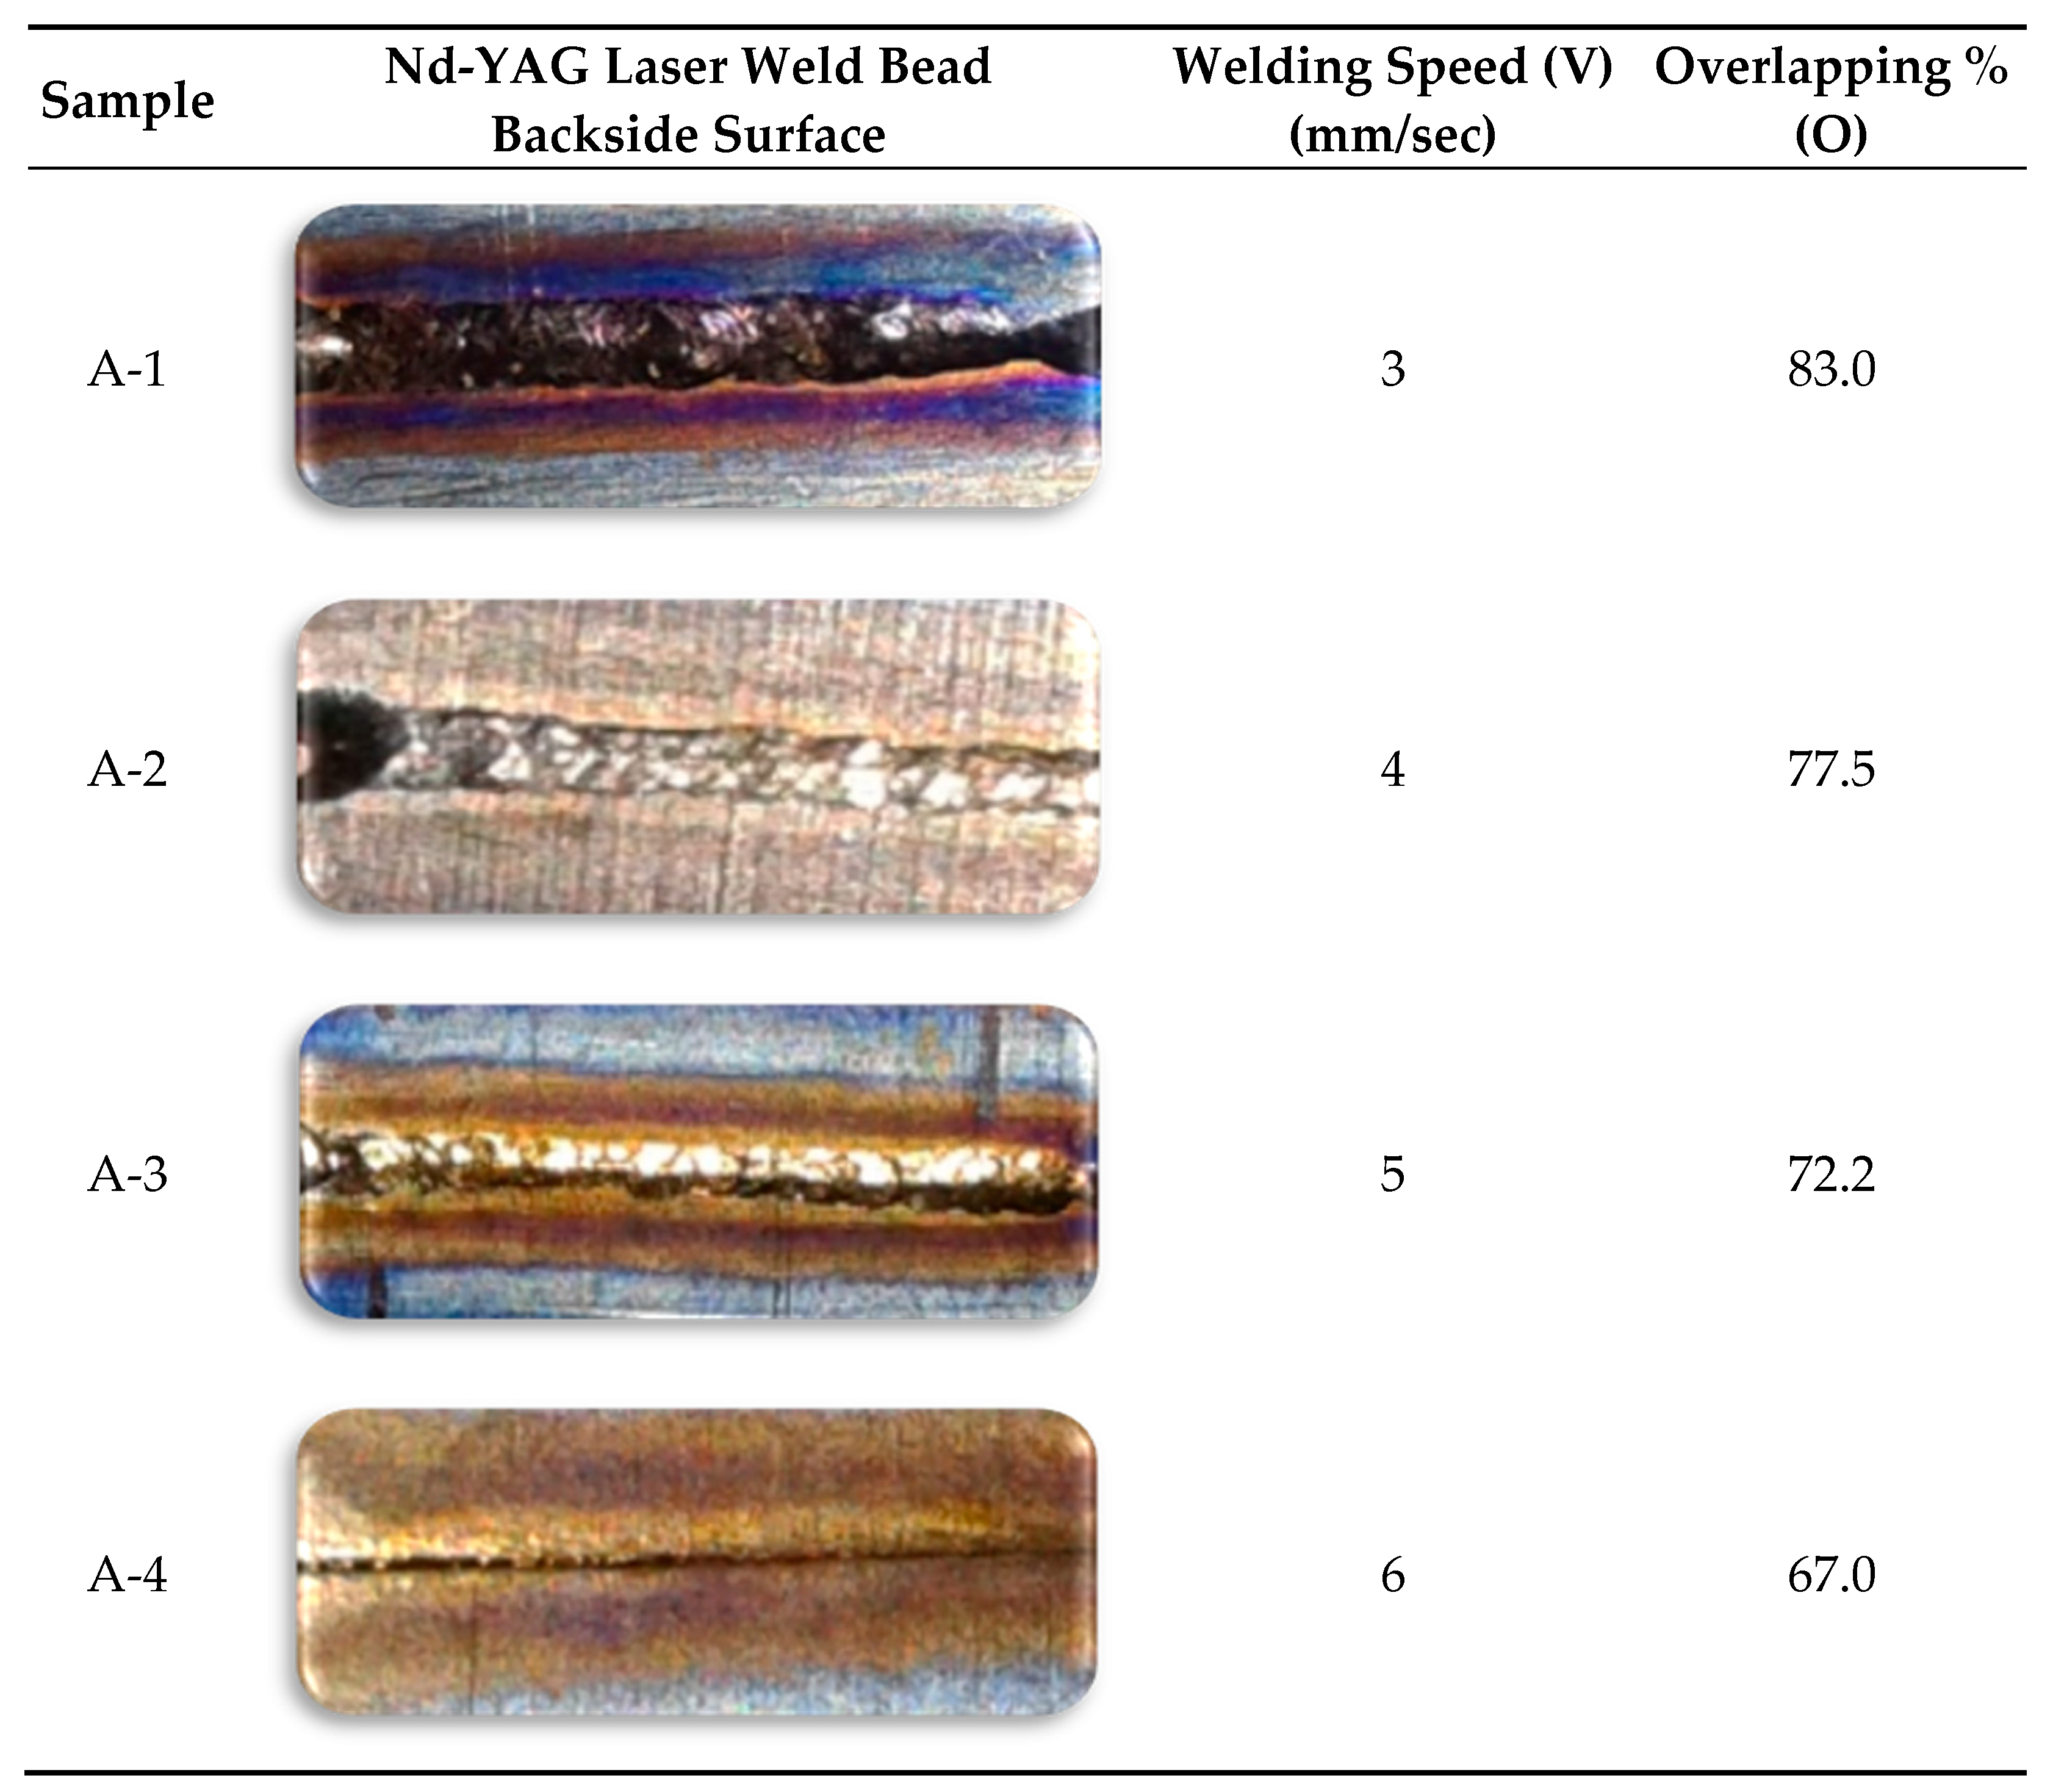
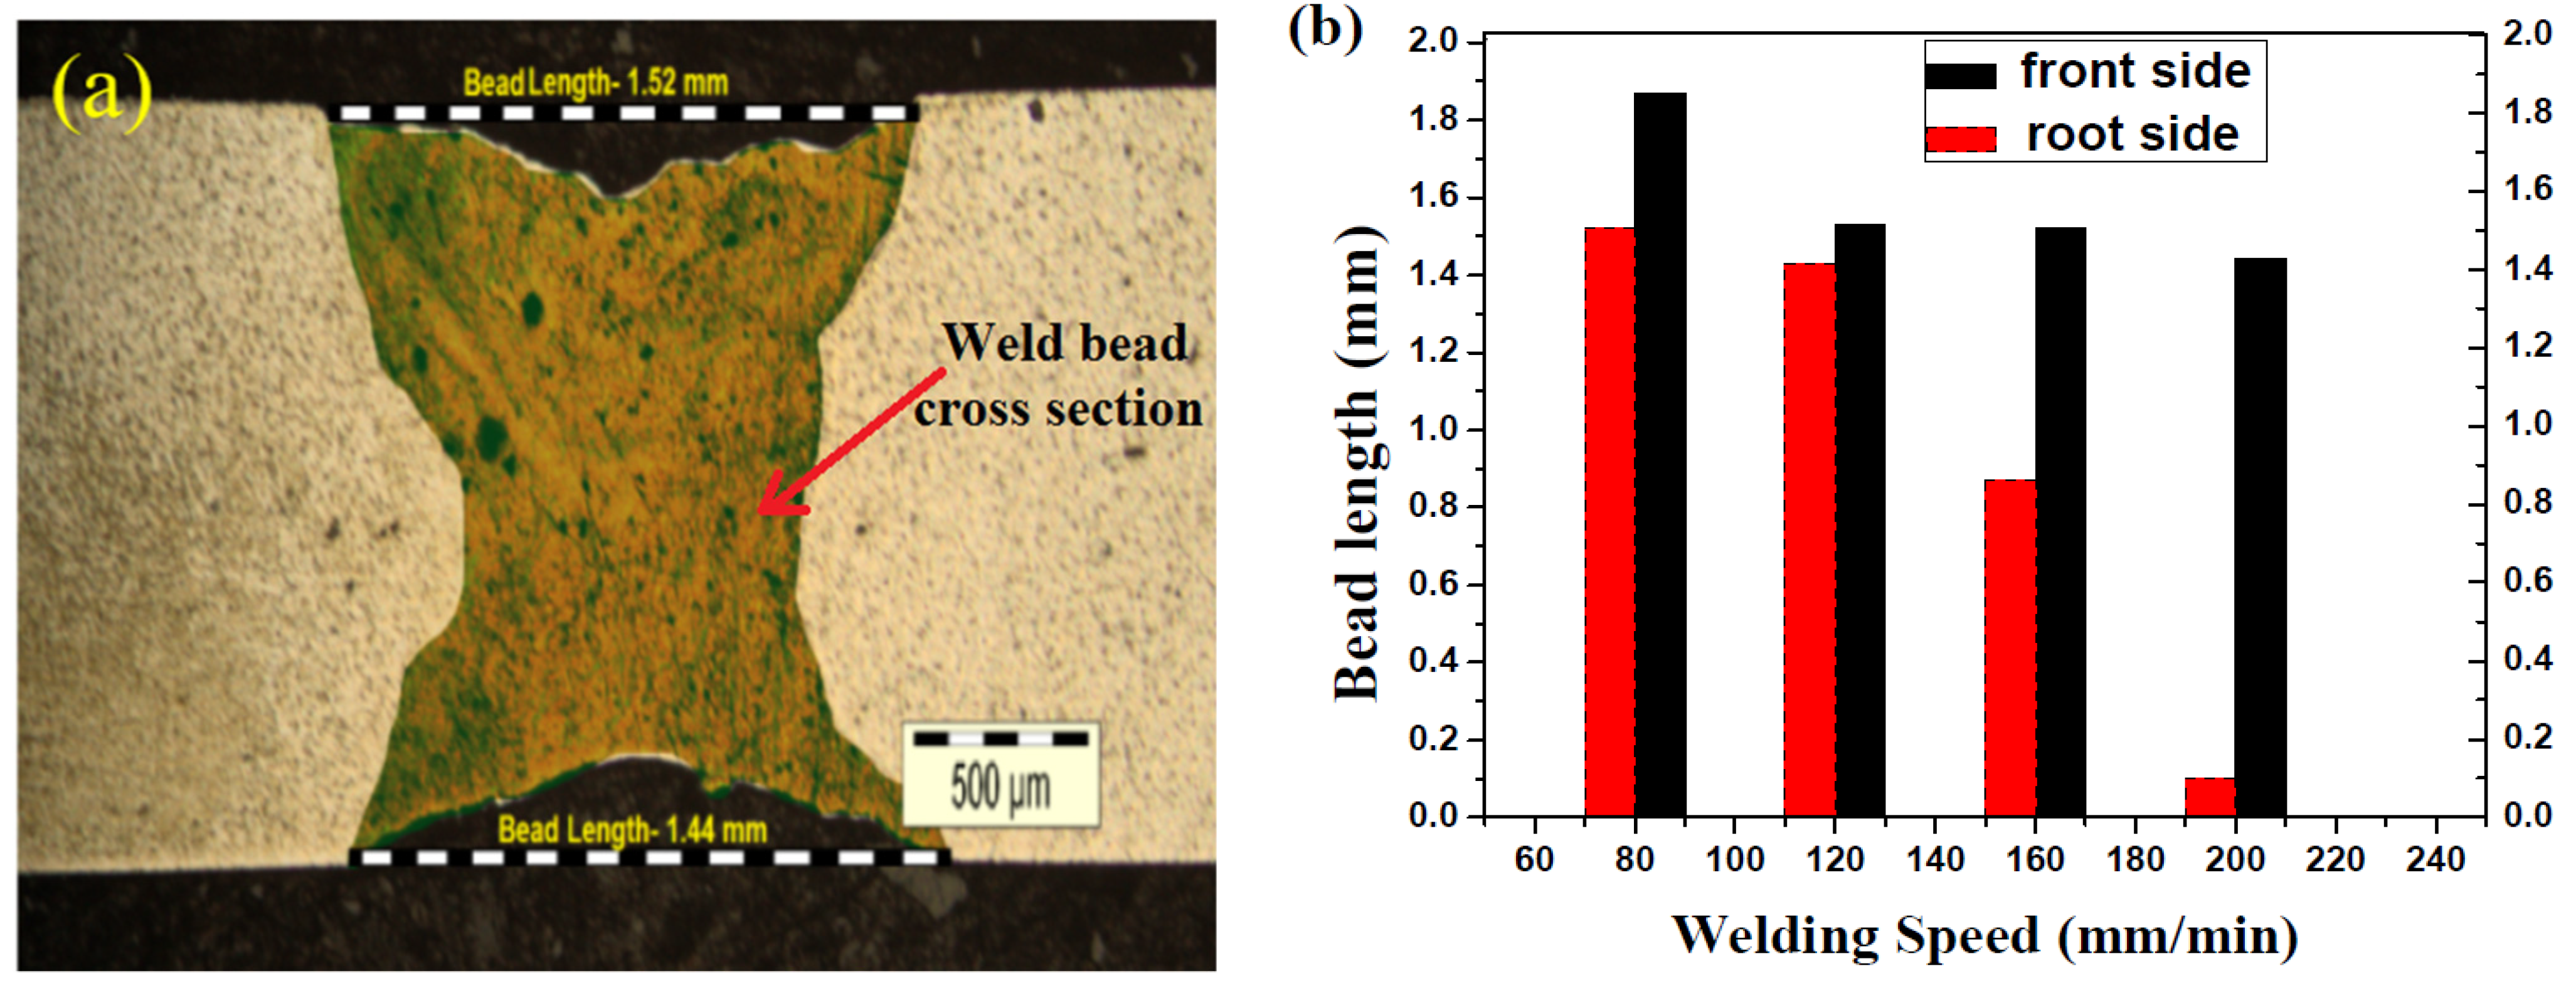
3.2. Weld Quality Analysis on the Variation of Overlapping-Factor

The welding quality directly depends upon external parameters such as weld bead surface smoothness and width of the welded zones. Weld bead images of the specimens under different overlapping factors are displayed in Figure 3 and Figure 4. Figure 3 shows the face-side images of the weld specimens. For the sample (A-1), the weld bead color is blues grey, the material deposition is not uniform, and there are lots of peaks and valleys. Sample (A-2) shows the best weld bead in which the material deposition is almost uniform and the color is grey. Figure 3(A-3) show a grey weld bead, the uniformity of the material deposition is good but not up to the previous sample. The spatter was observed in the weld bead and the near base metal also for this sample. The penetration depth of the sample (A-4) is not enough. The amount of spatter is almost negligible in the weld zone and the area adjacent to the base metal. Out of these weld parameters combinations, (A-2) gives the best quality weld. The widths of weld bead for (A-1), (A-2), (A-3), and (A-4) are 1.87 mm, 1.63 mm, 1.52 mm, and 1.44 mm, respectively, clearly indicating that the width is minimum for the highest welding speed but in the case of (A-4), the penetration depth is poor, and the weld quality is also not acceptable. So, from the above discussion, it is evident that sample (A-2) has the best weld bead width among all the samples.
Figure 4 represents the appearance of the weld backside profiles. On the backside, the surface finish was poor as compared to the face side. The material deposition is non-uniform, and peaks and valleys are bigger than the face side. Out of that, Figure 4(A-1) shows that the color of the weld bead is blue-grey. The weld bead surface of the sample (A-2) is smoother, and the width is also better than the previous sample. Figure 4(A-3) indicates that the color of the weld bead is grey and material deposition is comparatively uniform to the previous one. However, in this sample, the weld bead width is much smaller compared to the previous sample. Sample (A-4) presents a very limited penetration depth and an almost zero weld bead width. The weld bead widths of the root side welded joints in samples (A-1), (A-2), (A-3), and (A-4) are 1.52 mm, 1.29 mm, 0.87 mm, and 0.1 mm, respectively.
Figure 5a represents the crossectional view of the sample (A-2), and Figure 5b shows the bar chart diagram of weld bead length for the front side and root side as well. Figure 5 shows that the weld bead length is minimal in the case of samples (A-3) and (A-4), but both have poor weld quality. Therefore, sample (A-2) gives the best quality weld. Moreover, if the comparison is made, the weld bead length of the root side of the A-2 and A-3 samples is minimum in the case of A-2, even when the welding speed of the A-3 is maximum. The reason for this inconsistency is because of the overlapping factor. On the basis of the entire discussion, it is clear that the sample (A-2) gives the best quality weld on 77.5 overlapping factors in terms of the minimum width of the weld bead, good penetration depth, smooth surface, and appropriate material deposition.

3.3. Microstructure Analysis on the Variation of Overlapping Factor

Figure 6a,b,d,e show the SEM views of the top surface of the welded zone of the annealed A-2 sample. The optical microscope image of the weld bead is presented in Figure 6c. This indicates that the heat-affected zone (HAZ) is too narrow among the three regions of the weld bead: (fusion zone) FZ, HAZ, and BM (Base metal). The microstructure of FZ is shown in Figure 6b. The grains in the FZ are coarse, which can be easily visualized. During the melting process, there is a significant coarsening and local disorientation of the grains, leading to microstructural changes. In that case, when the rate of cooling is very high, acicular ‘α’ martensite is formed [15]. In the FZ, the microstructure consists of an acicular ‘α’ martensite phase to a great extent. Due to this high amount of acicular martensite, the weld bead has a high hardness value. This results in reduced ductility [16,17]. Figure 6d shows the microstructural image of the near-HAZ. It indicates that microstructure is composed largely of acicular α’ martensite phase, blocky α, and some other phase that is not present in the FZ compared with BM.
In Figure 6e, near-HAZ, far-HAZ and both sections have been shown. In the near-HAZ section, more acicular α’ martensite phase and some blocky α are observed. In the far-HAZ section, less acicular α’ martensite phase and more blocky α are noticed. Some original α was also found in the far HAZ section. This indicates that there was incomplete transformation during the cooling process. Hence, this section can be considered a partially transformed HAZ. The fusion zone of the weld pool produced by Nd-YAG laser welding contained a large number of needle and fine equiaxed shapes. The reason for this microstructure’s formation is due to the high temperature at HAZ, and at high temperatures, the recrystallization and recovery took place, leading to the formation of needle and fine equiaxed shapes [16]. The reason for these different shapes: the cooling rates must be different at different places of the FZ. These needle-shaped phases in the martensitic α’ matrix lower the beta transus, thereby changing the mechanical properties.

3.4. Effects of Annealing on Grain Structure

The FESEM view of the weld section of anneals samples are presented in Figure 7. Some cracks are observed in the FZ, along with the full martensite α’ of the needle shape in Figure 7a. The microstructure of the sample annealed at the temperature of 950 °C is shown in Figure 7b. The figure reveals that the formation of new grains is started and cracks are not seen here. The uniform cooling rate is the reason for these changes in structure. The grain structure of the sample heat treated at the temperature of 980 °C is shown in Figure 7c. At this temperature, a new equiaxed α has come into existence. Figure 7d reveals the fully equiaxed structures. Division of grain boundary and recrystallization was the primary reason for the formation of the equiaxed α structure [16]. At the high cooling rate, the sub-boundaries face a speedy recovery, resulting in boundary division taking place. During the cooling process, resolidification takes place. During resolidification, the higher surface energy (HSE) molecule tries to acquire less surface energy (LSE), resulting in the contraction of the structure. Due to this mechanism, a new arrangement is created. This arrangement is termed an equiaxed structure. At 980 °C, the grains are fine and uniform; this is surely due to the complete recrystallization of the microstructure. The grain structure of the heat-treated sample at 1010 °C is shown in Figure 7e. The figure reveals that the maximum part of the area is covered with the equiaxed α phase. Grains are coarser than the previous heat-treated sample Figure 7f indicates the enlarged view of the completely transformed equiaxed α. This says that grain size increases on heating beyond 980 °C. The volume fraction of the equiaxed structure is maximum. It can be concluded that the volume fraction depends on the temperature of the heat treatment. At higher annealing temperatures, the recrystallized structure volume increases progressively. Table 5 indicates the volume fraction under different annealing conditions.

3.5. Tensile Property Analyses of the Samples at Different Overlapping Factors

Many welded samples of different parameters and base metals were tested in every condition. Among all the tensile strength values, the best values have been considered and compared with the base metal. The tensile strength of the base metal is presented in Table 2. Figure 8a shows the welded samples after the tensile test. The fracture is away from the weld zone in the case of sample A-2, and it is in the weld zone for samples A-1, A-2, and A-4. It might be due to a large amount of spatter formation and excess heat input, creating nonuniformity in the material distribution. Figure 8b indicates the stress–strain curves of the Nd-YAG laser weld samples at different overlapping factors and the base metal. The curve represents that the tensile strength of sample A-2 is a little higher than the tensile strength of the base metal as well as other samples. From the tensile test data, it can also be observed that there is a 4–10% increment in the tensile strength of the A-2 weld sample as compared to the base metal. Hence, from the above discussion, it is clear that the overlapping factor of 77.5% shows the best result.
The curves for samples A-3 and base metal almost overlapped completely in the last stage of the profile. After the annealing, the microstructural inhomogeneity reduces, and as a result, strength increases and the elongation percentage decreases [19]. The increase in tensile strength is due to the availability of a high amount of acicular α’ martensite phase in the fusion region.

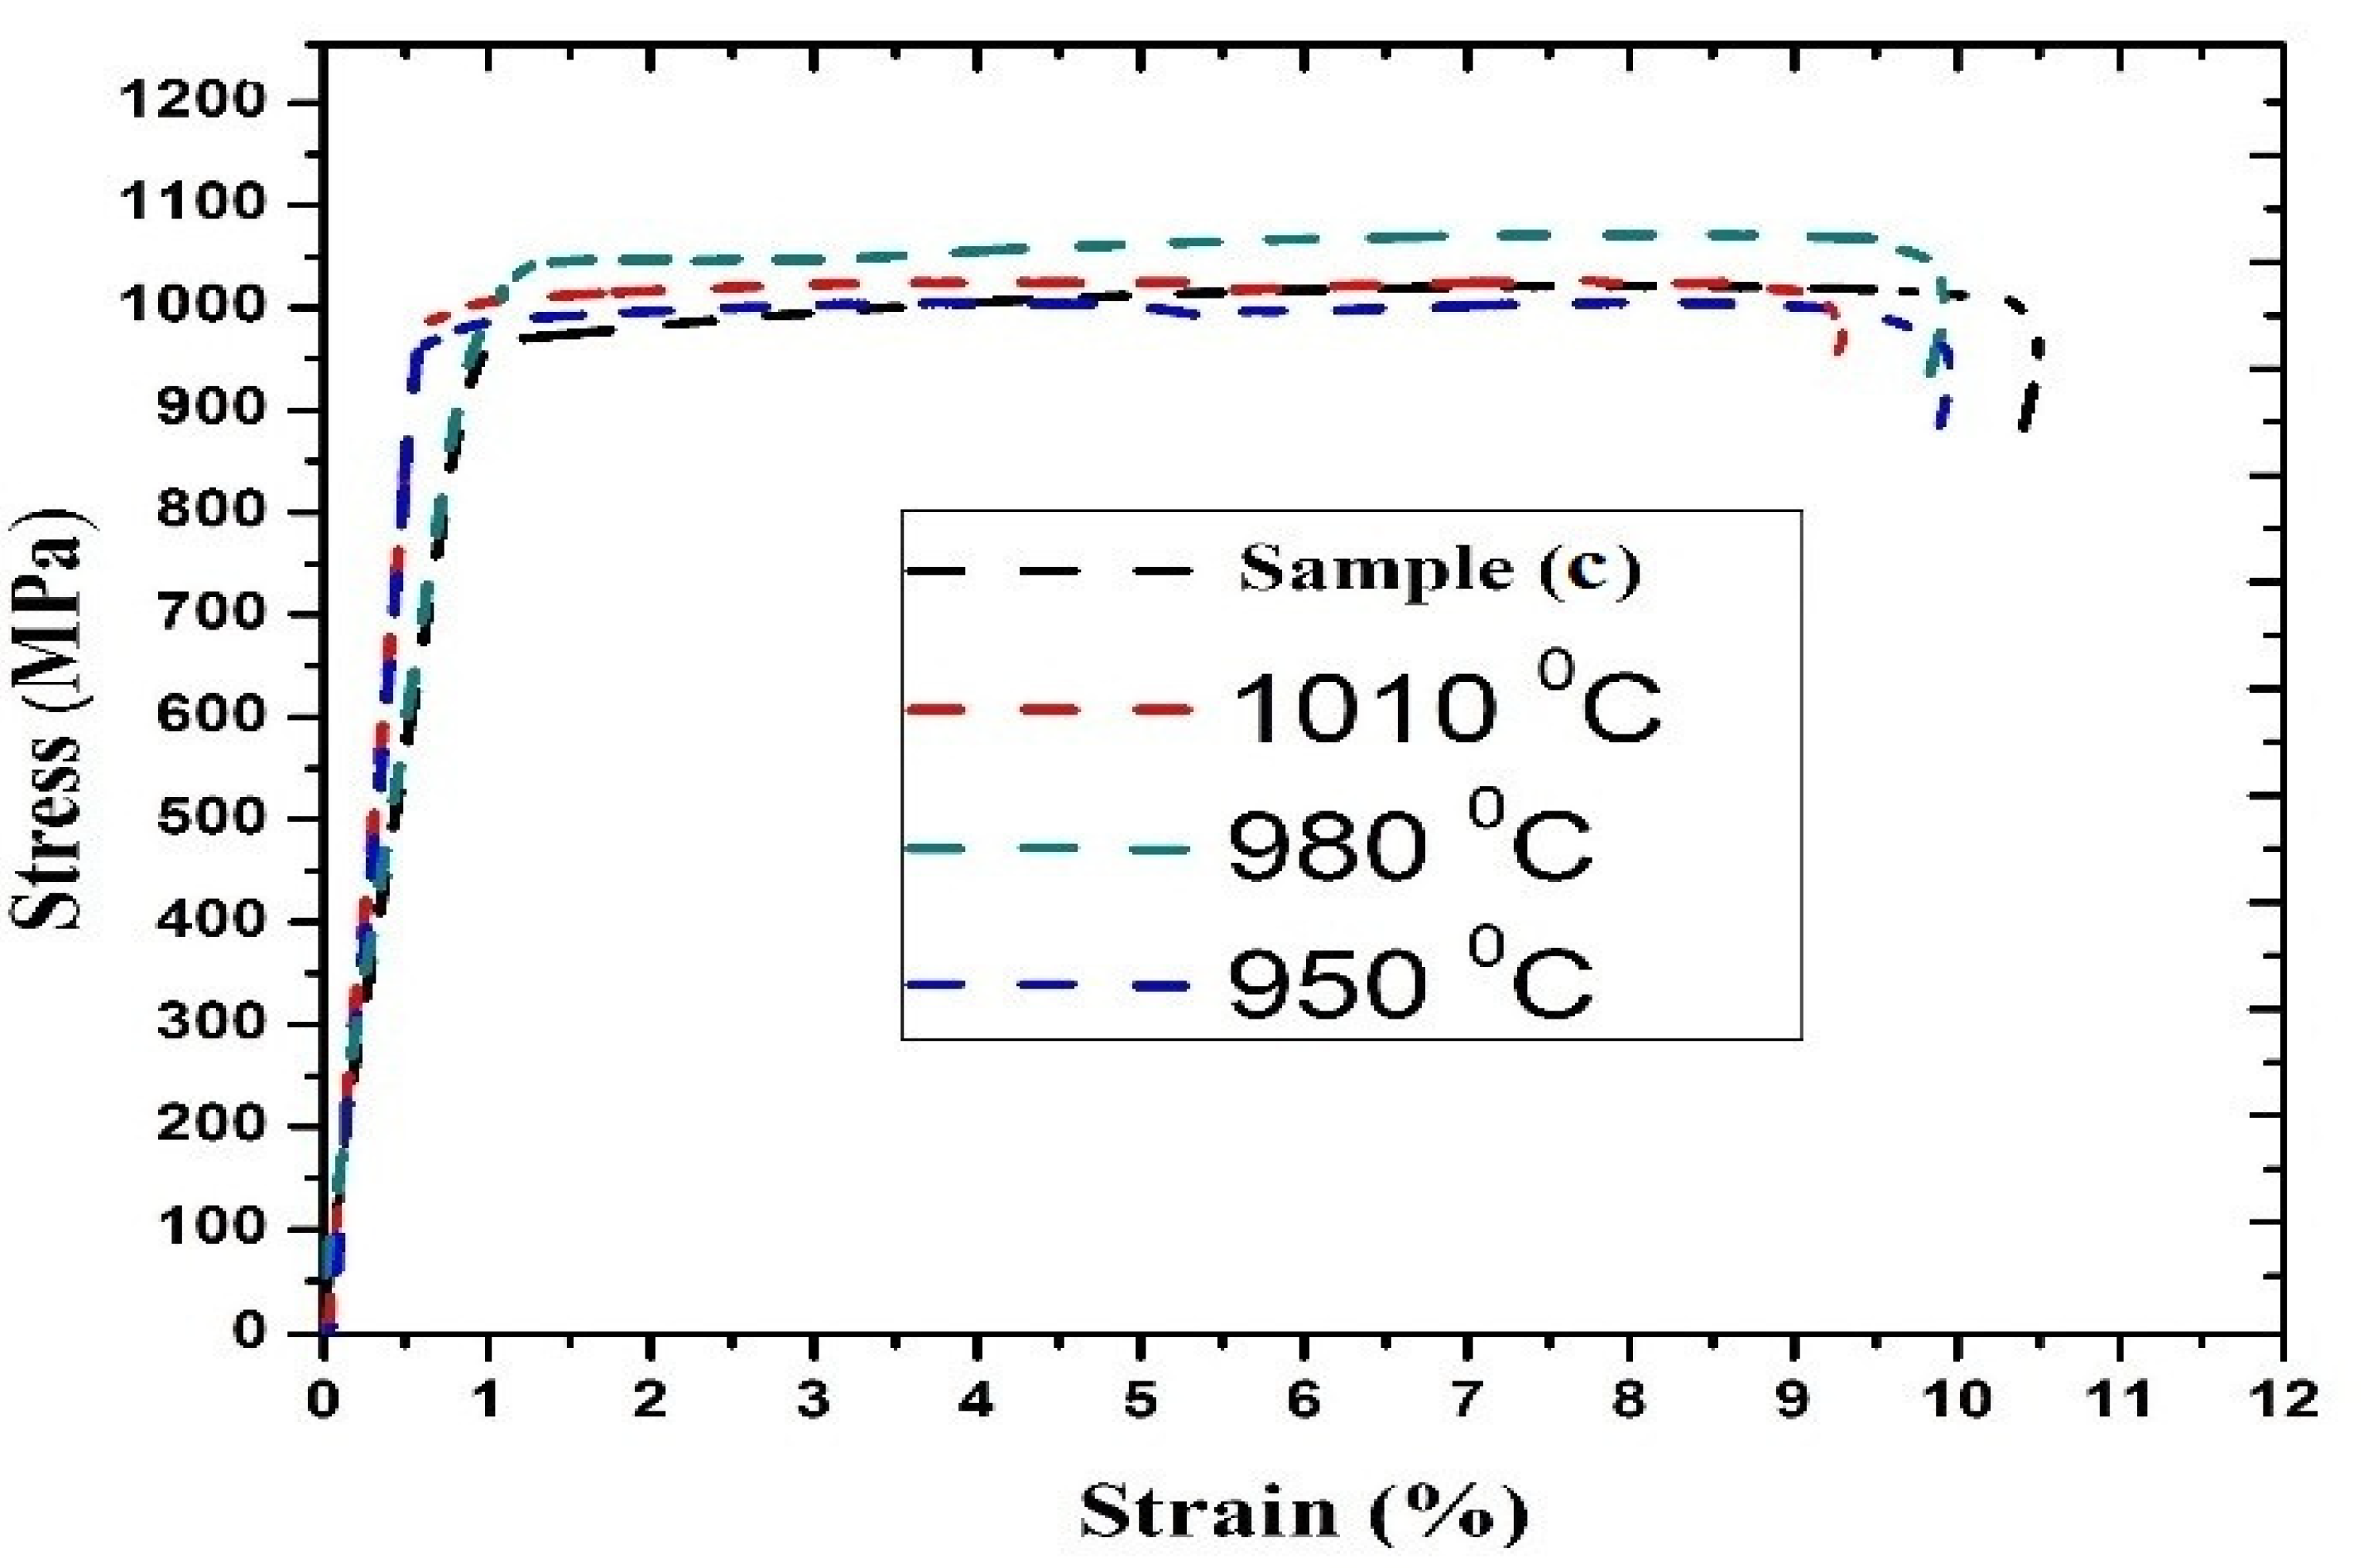
3.6. Tensile Properties Analysis for the Annealed Samples

Table 6 shows the tensile properties of sample (c), annealed at 950 °C, annealed at 980 °C, and annealed at 1010 °C. A stress–strain graph is presented in Figure 9 of the above-mentioned samples. The curve of the 950 °C samples and sample (c) are similar in nature with small deviations. The table indicates that sample 980 °C and sample (c) show the maximum and minimum values of UTS, respectively. On the other hand, samples at 1010 °C and sample (c) represent the lowest and highest values of elongation %. That clearly indicates an elongation % decrease on increasing annealing temperature [20].
Hence, it can be concluded that at 980 °C, the overall grain refinement of the equiaxed α is the key factor for attaining maximum UTS. In addition to that, at this microstructural, irregularity is minimum [21,22,23]. However, for the sample, 1010 °C coarse grains are responsible for the decrement of UTS.
There is a direct relation between annealing temperature and volume fraction of ‘α’ martensite, i.e., increasing the annealing temperature volume fraction of ‘α’ martensite increases and vice versa. There is an indirect relation between needle-shaped ‘α’ and the annealing temperature, i.e., by increasing the annealing temp., the volume fraction decreases and vice versa [24,25,26].

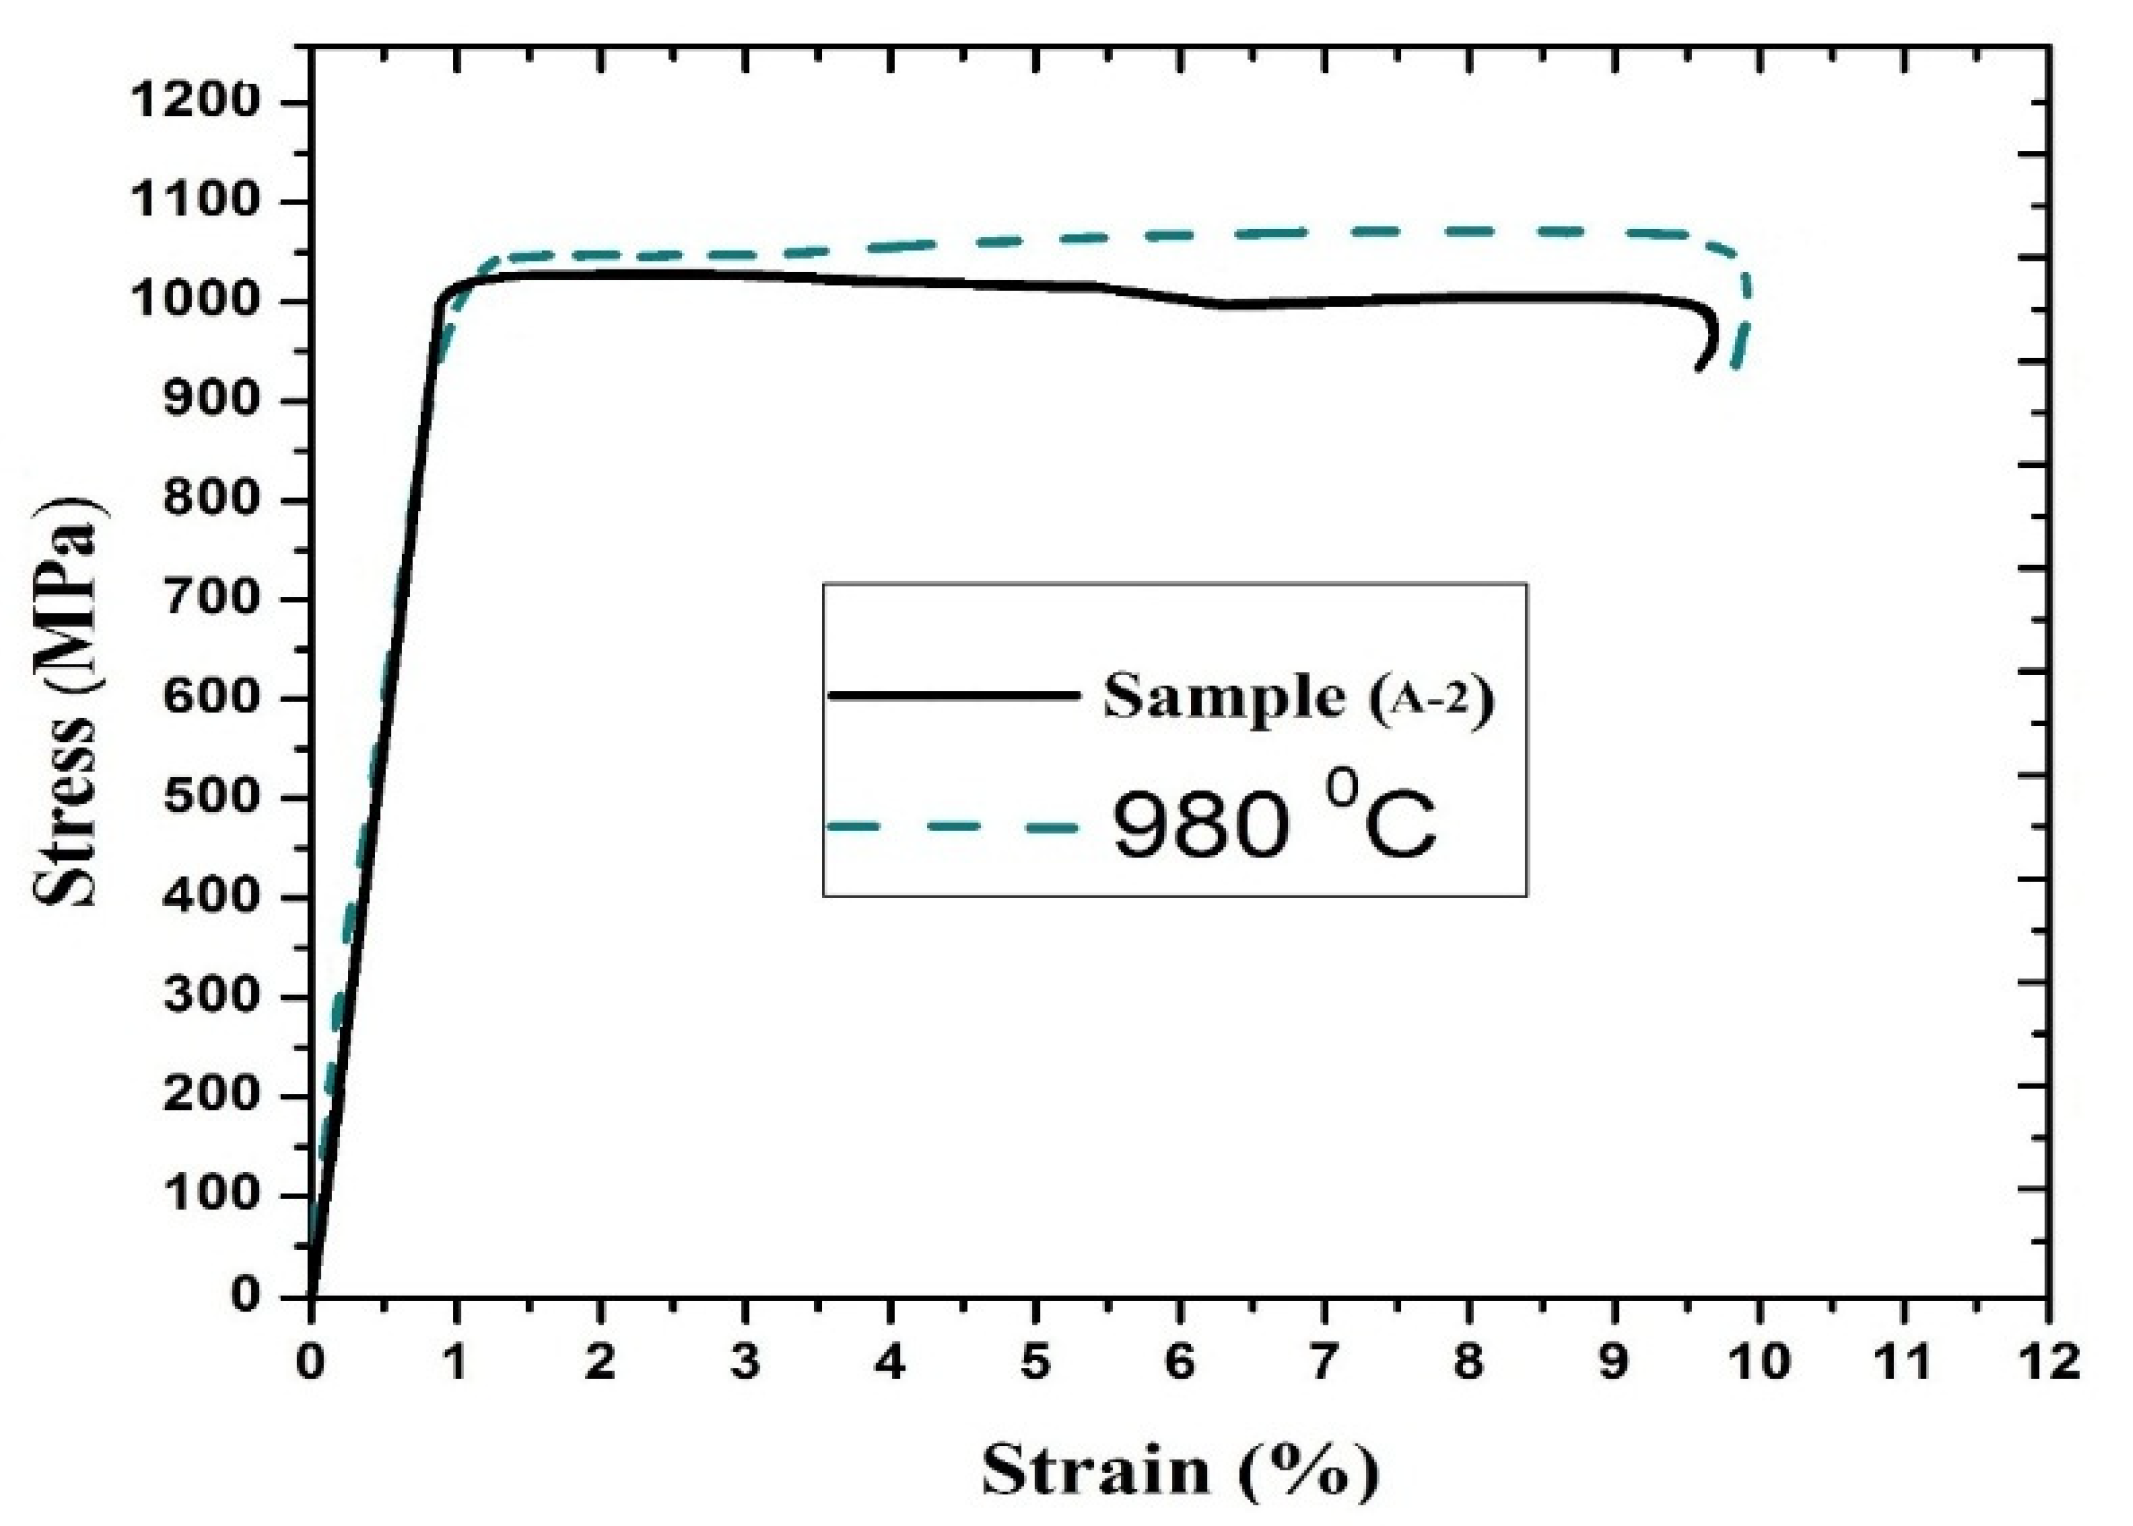
3.7. Comparison of Tensile Strength between Overlapped Sample (A-2) and Annealed Sample (Base Sample) at 980 °C

Figure 10 shows the comparison between the stress–strain curve of the (A-2) sample and annealed sample at 980 °C. Up to the elastic limit, both have the same tensile strength. A higher value (1048 MPa) of UTS is observed for a sample at 980 °C than the sample (A-2) (1018 MPa). There is a 4–5% increment in the UTS of the sample at 980 °C as compared to the overlapped sample (A-2).

3.8. Variation of Hardness at Different Overlapping Factors

Figure 11a indicates the indentation line of the hardness measurement at the middle of the weld zone. Figure 11b represents the typical microhardness variation profile of all four welded joints at different overlapping factors. Base metal indicates a minimum hardness value of about 360 ± 10 HV. The FZ region of the sample (A-4) shows the highest hardness value with 405 HV. The minimum value of microhardness was found for sample (A-2), and it is approximately 387 HV. In the HAZ, the sample (A-4) indicates the highest value, and the sample (A-1) shows the lowest value. The sample (A-2) shows approx. the same value in the HAZ as well as FZ, which is 387 HV. Upon increasing the overlapping factor, the microhardness decreases in the HAZ region [27,28,29].

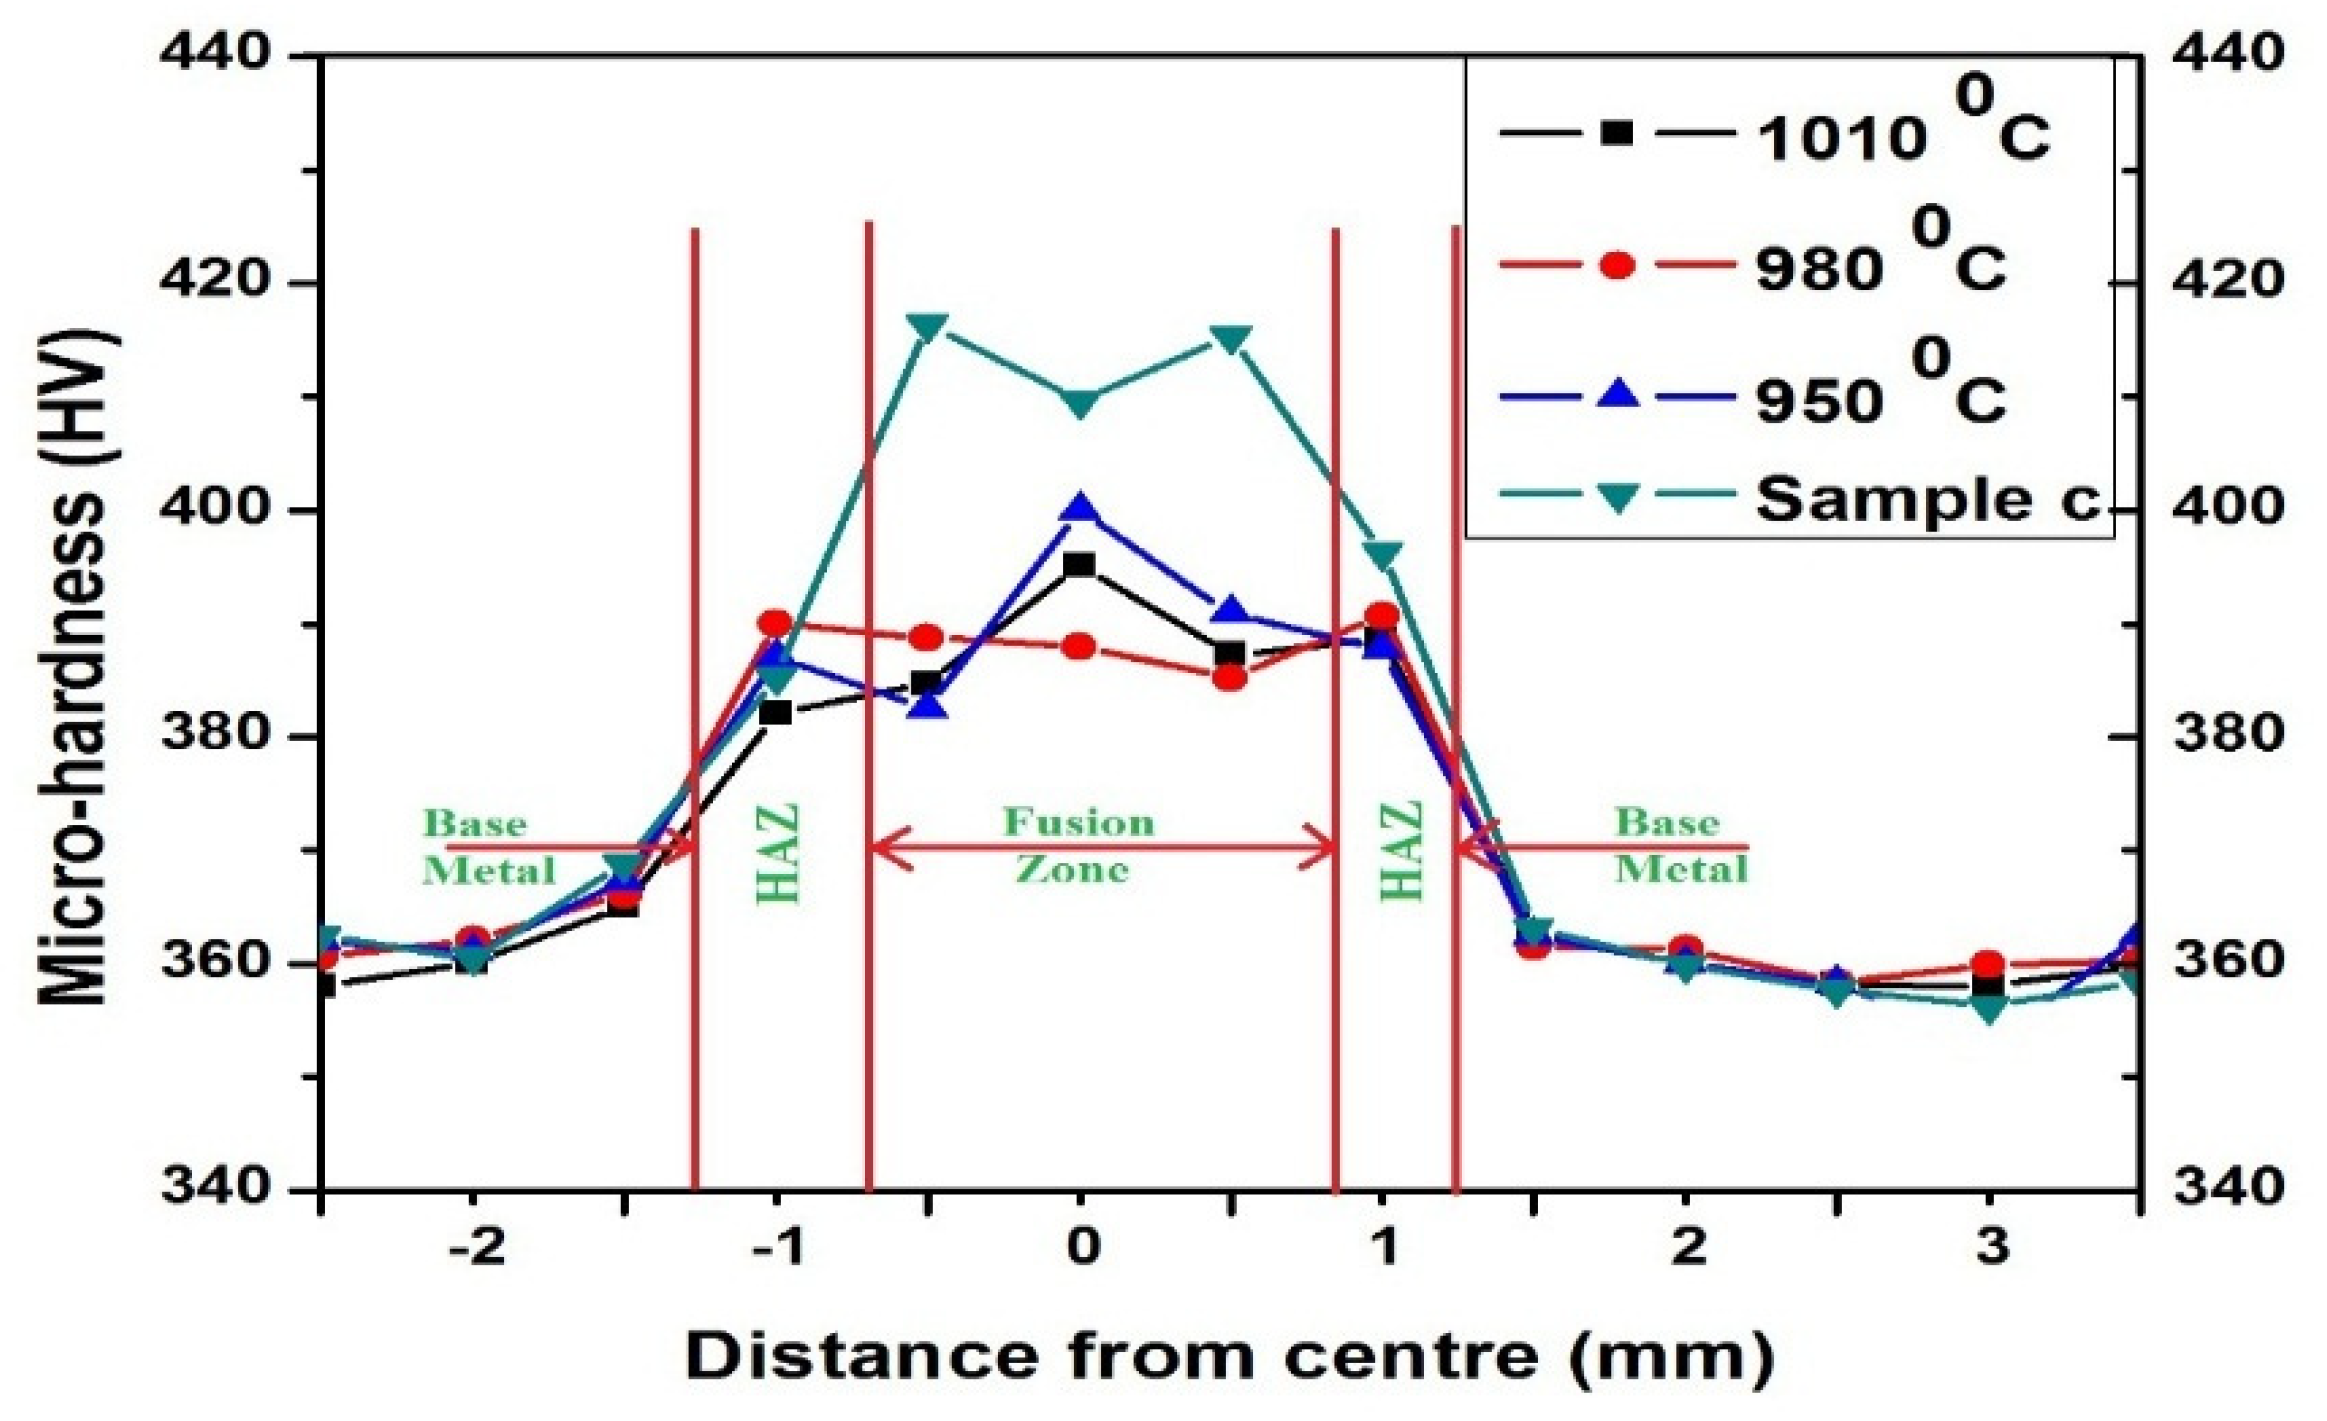
3.9. Microhardness Analysis of the Annealed Samples

Figure 12 represents the microhardness variation of heat-treated samples and samples (c) at the selected temperature. The graph indicates that the microhardness value is highest for sample (c). For sample (c), HAZ shows the lower value of hardness with HV 409, and FZ shows the highest value with HV 417. The changes in the microhardness for the annealed samples are minimum. Sample annealed at 1010 °C indicates the highest value of microhardness in the HAZ region with HV399. The lowest value is found for the sample 980 °C in the HAZ region. The deviation in the microhardness value for the heat-treated sample at 980 °C is more or less minimum [30,31,32]. Its microhardness value was observed in between the HV 381 to 391. The reason for this uniform microhardness in the sample is grain fineness [33,34,35]. On the other side, coarse grains are the main reason for the decrease in microhardness [36,37]. The sample heat-treated at 1010 °C shows the minimum value of microhardness in the FZ [38].

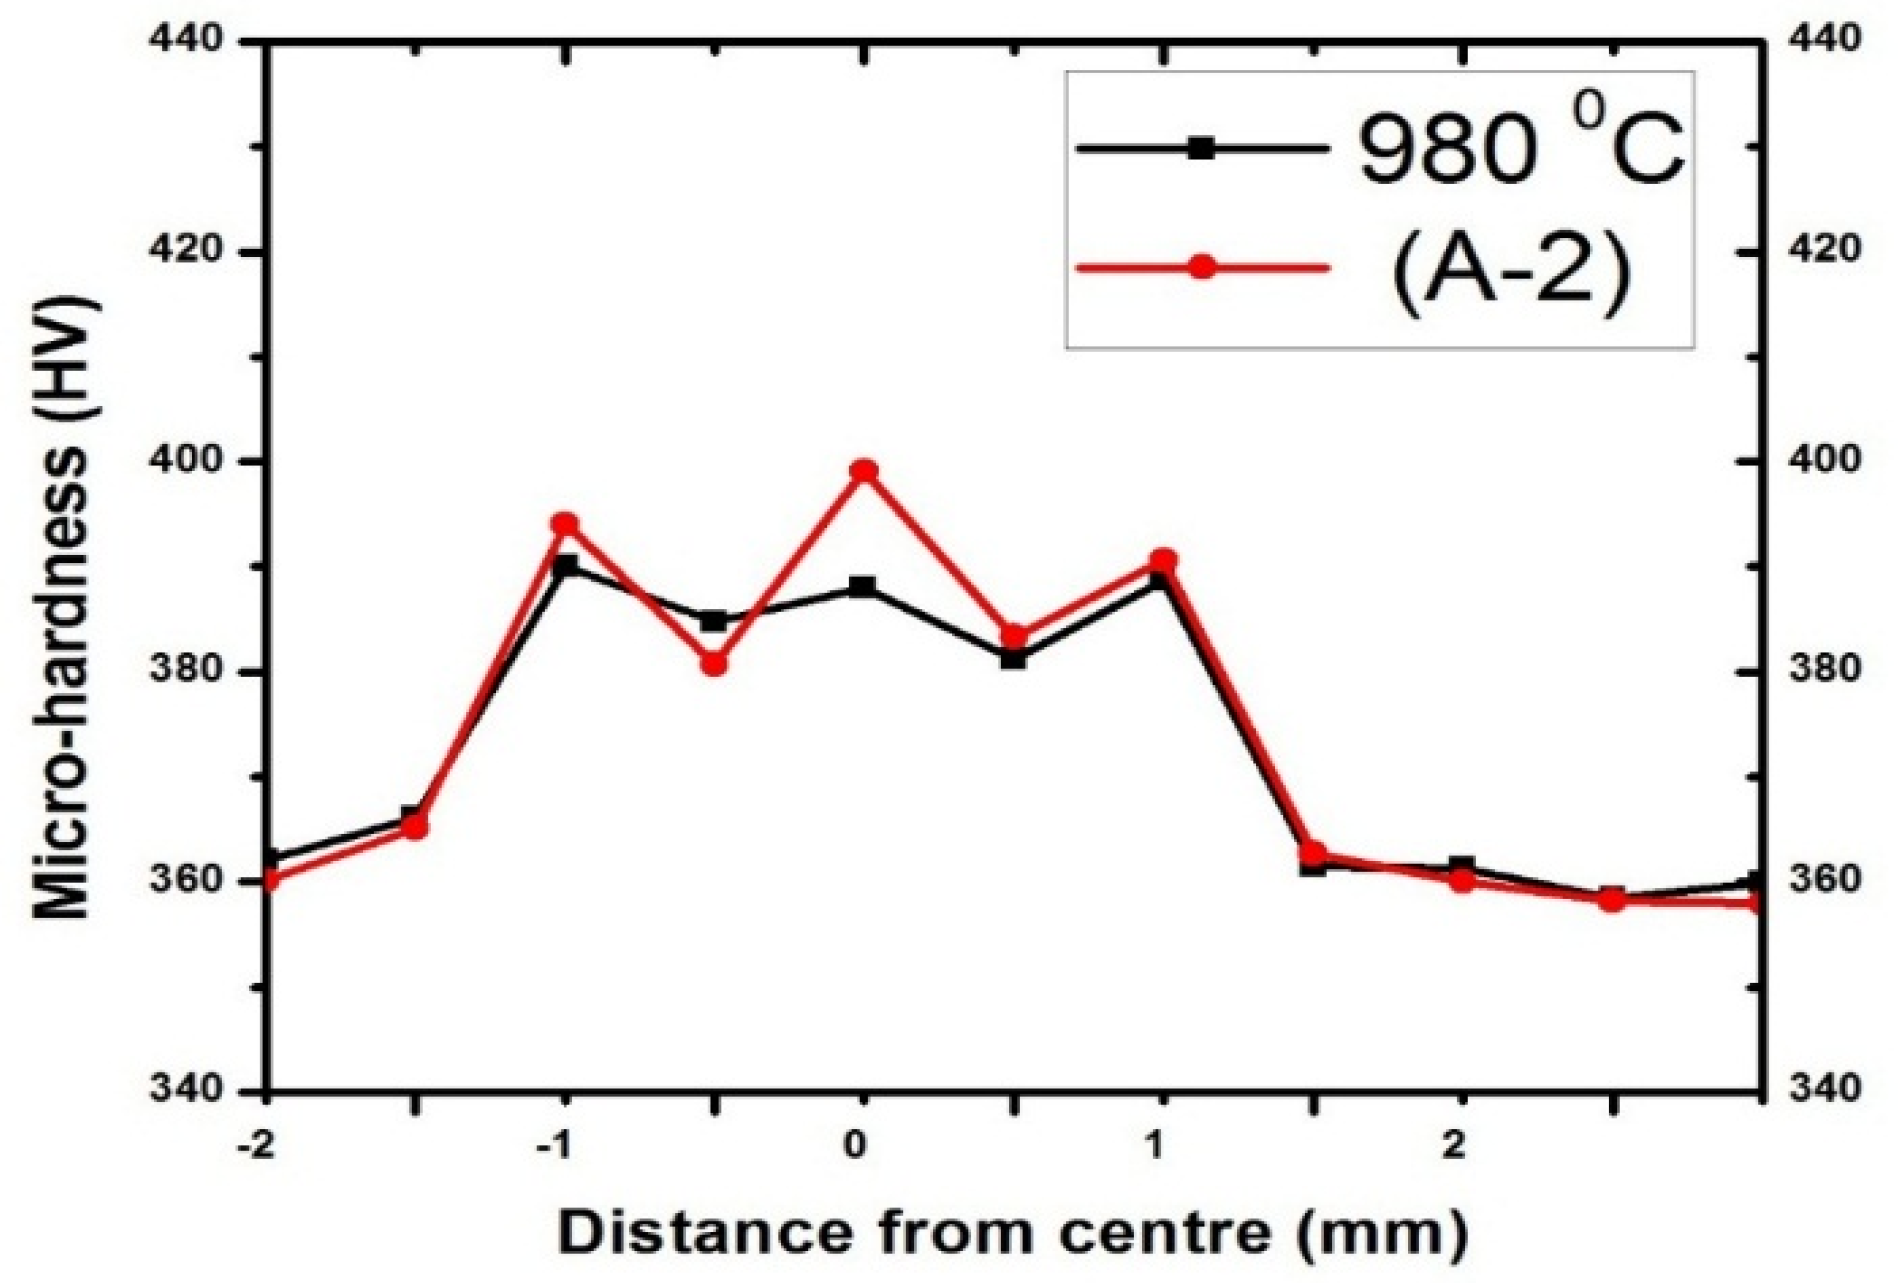
3.10. Comparison of Microhardness between Overlapped Sample (A-2) and Annealed Sample (Sample c) at 980 °C

The microhardness comparison between overlapped sample (A-2) and annealed sample at 980 °C has been represented in Figure 13. From the figure, it is clear that the overlapped sample (A-2) shows a high value of hardness approximately in every zone. The variation of microhardness for the annealed sample at 980 °C is lower as compared with the overlapped sample (A-2). In the fusion zone, overlapped sample (A-2) shows a high hardness with a value of 397 HV1. The sample annealed at 980 °C presents a hardness of 386 HV1 in the fused zone. The (A-2) sample shows a hardness 3–4% higher compared to the annealed sample in the fusion zone. Both have approximately the same microhardness in the heat-affected zone.

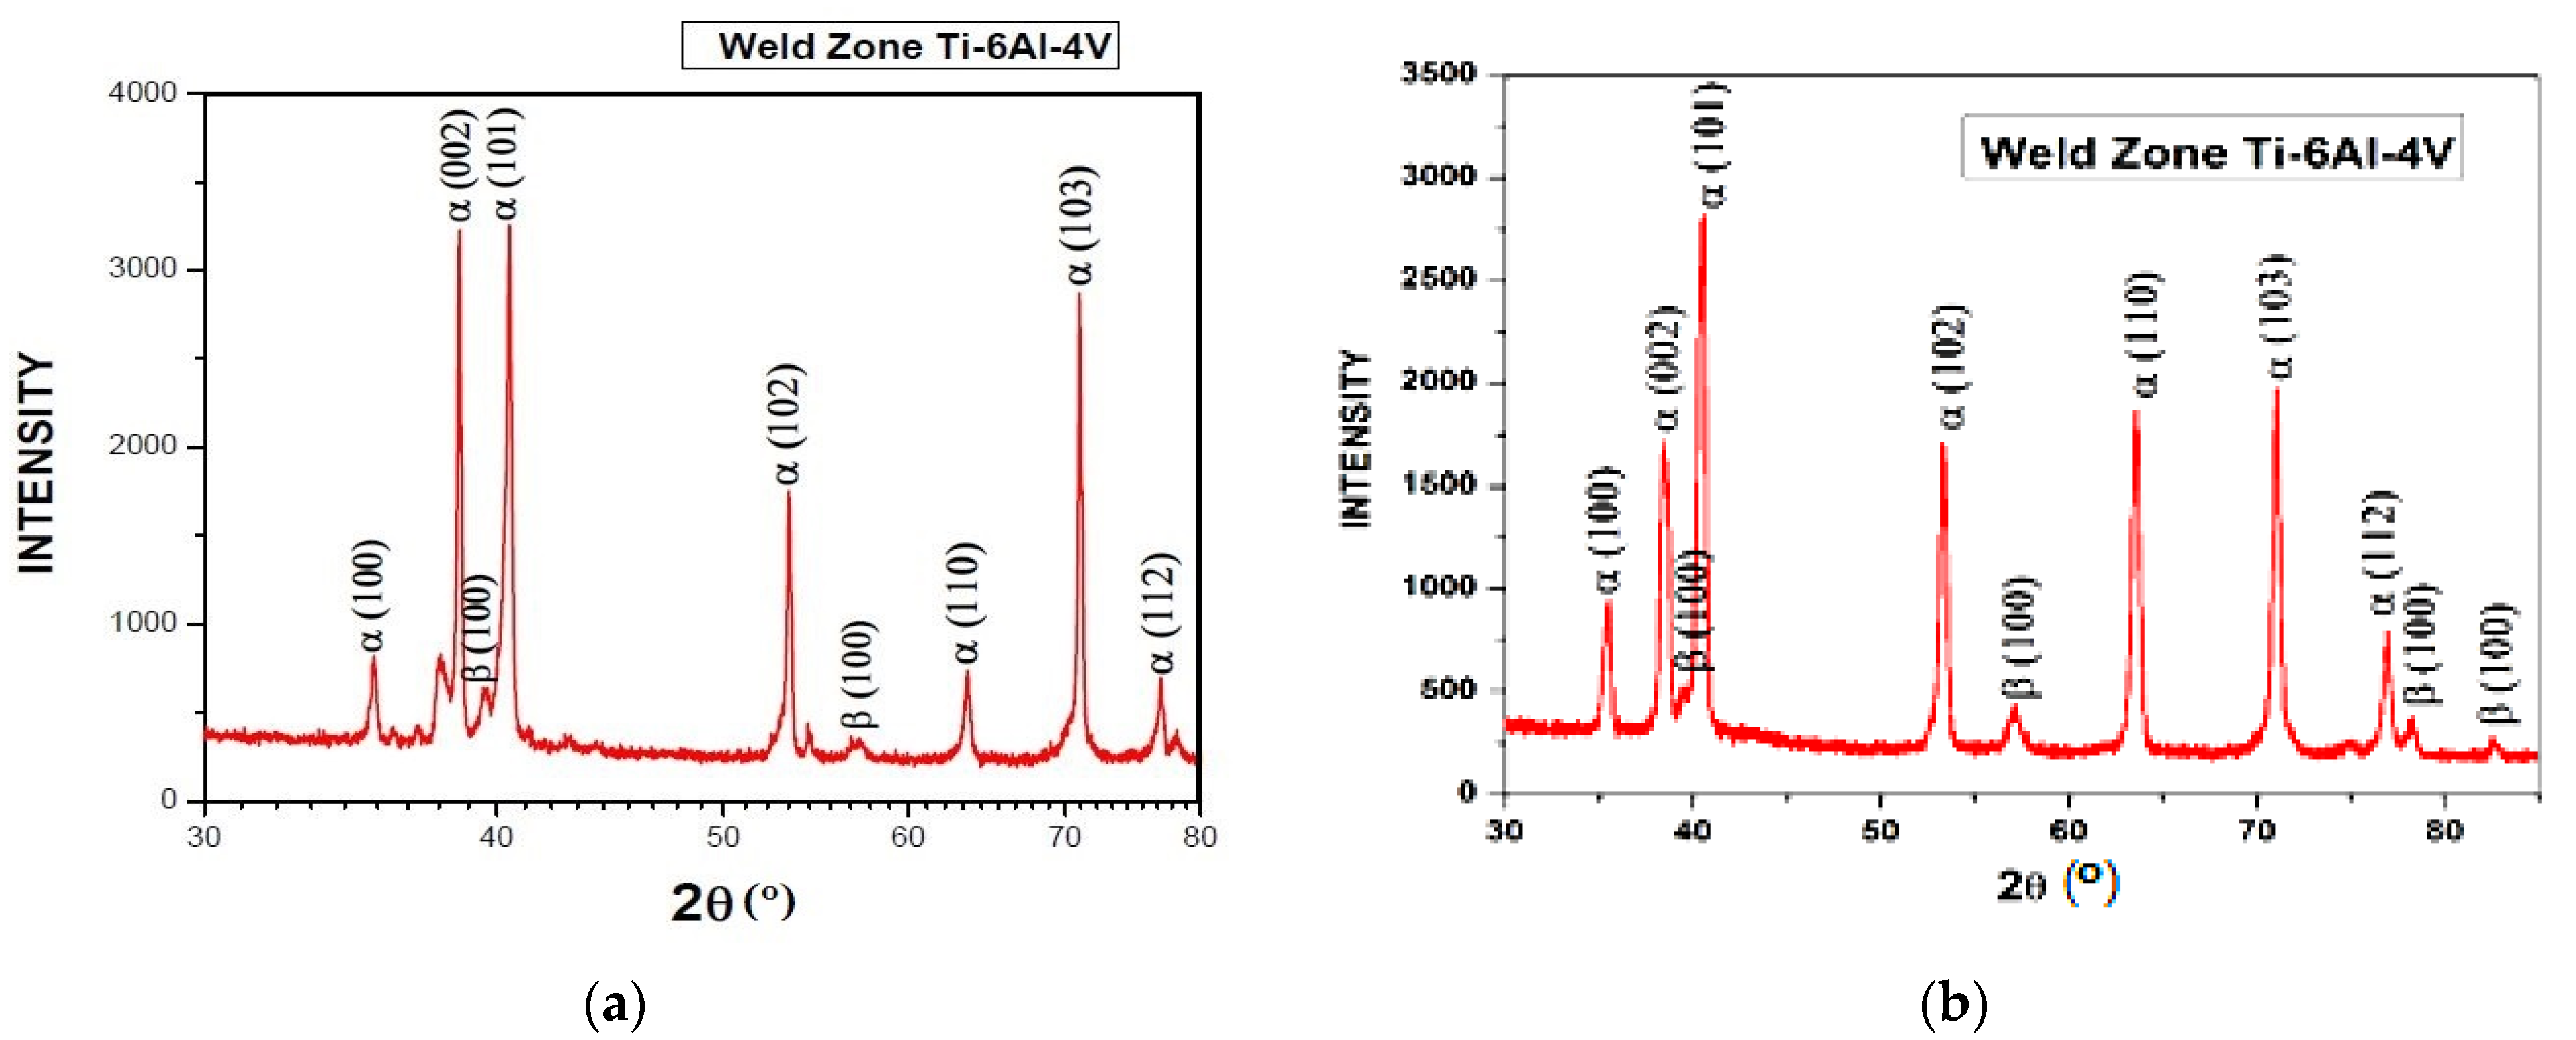
3.11. XRD Analysis for the Overlapped Sample (A-2)
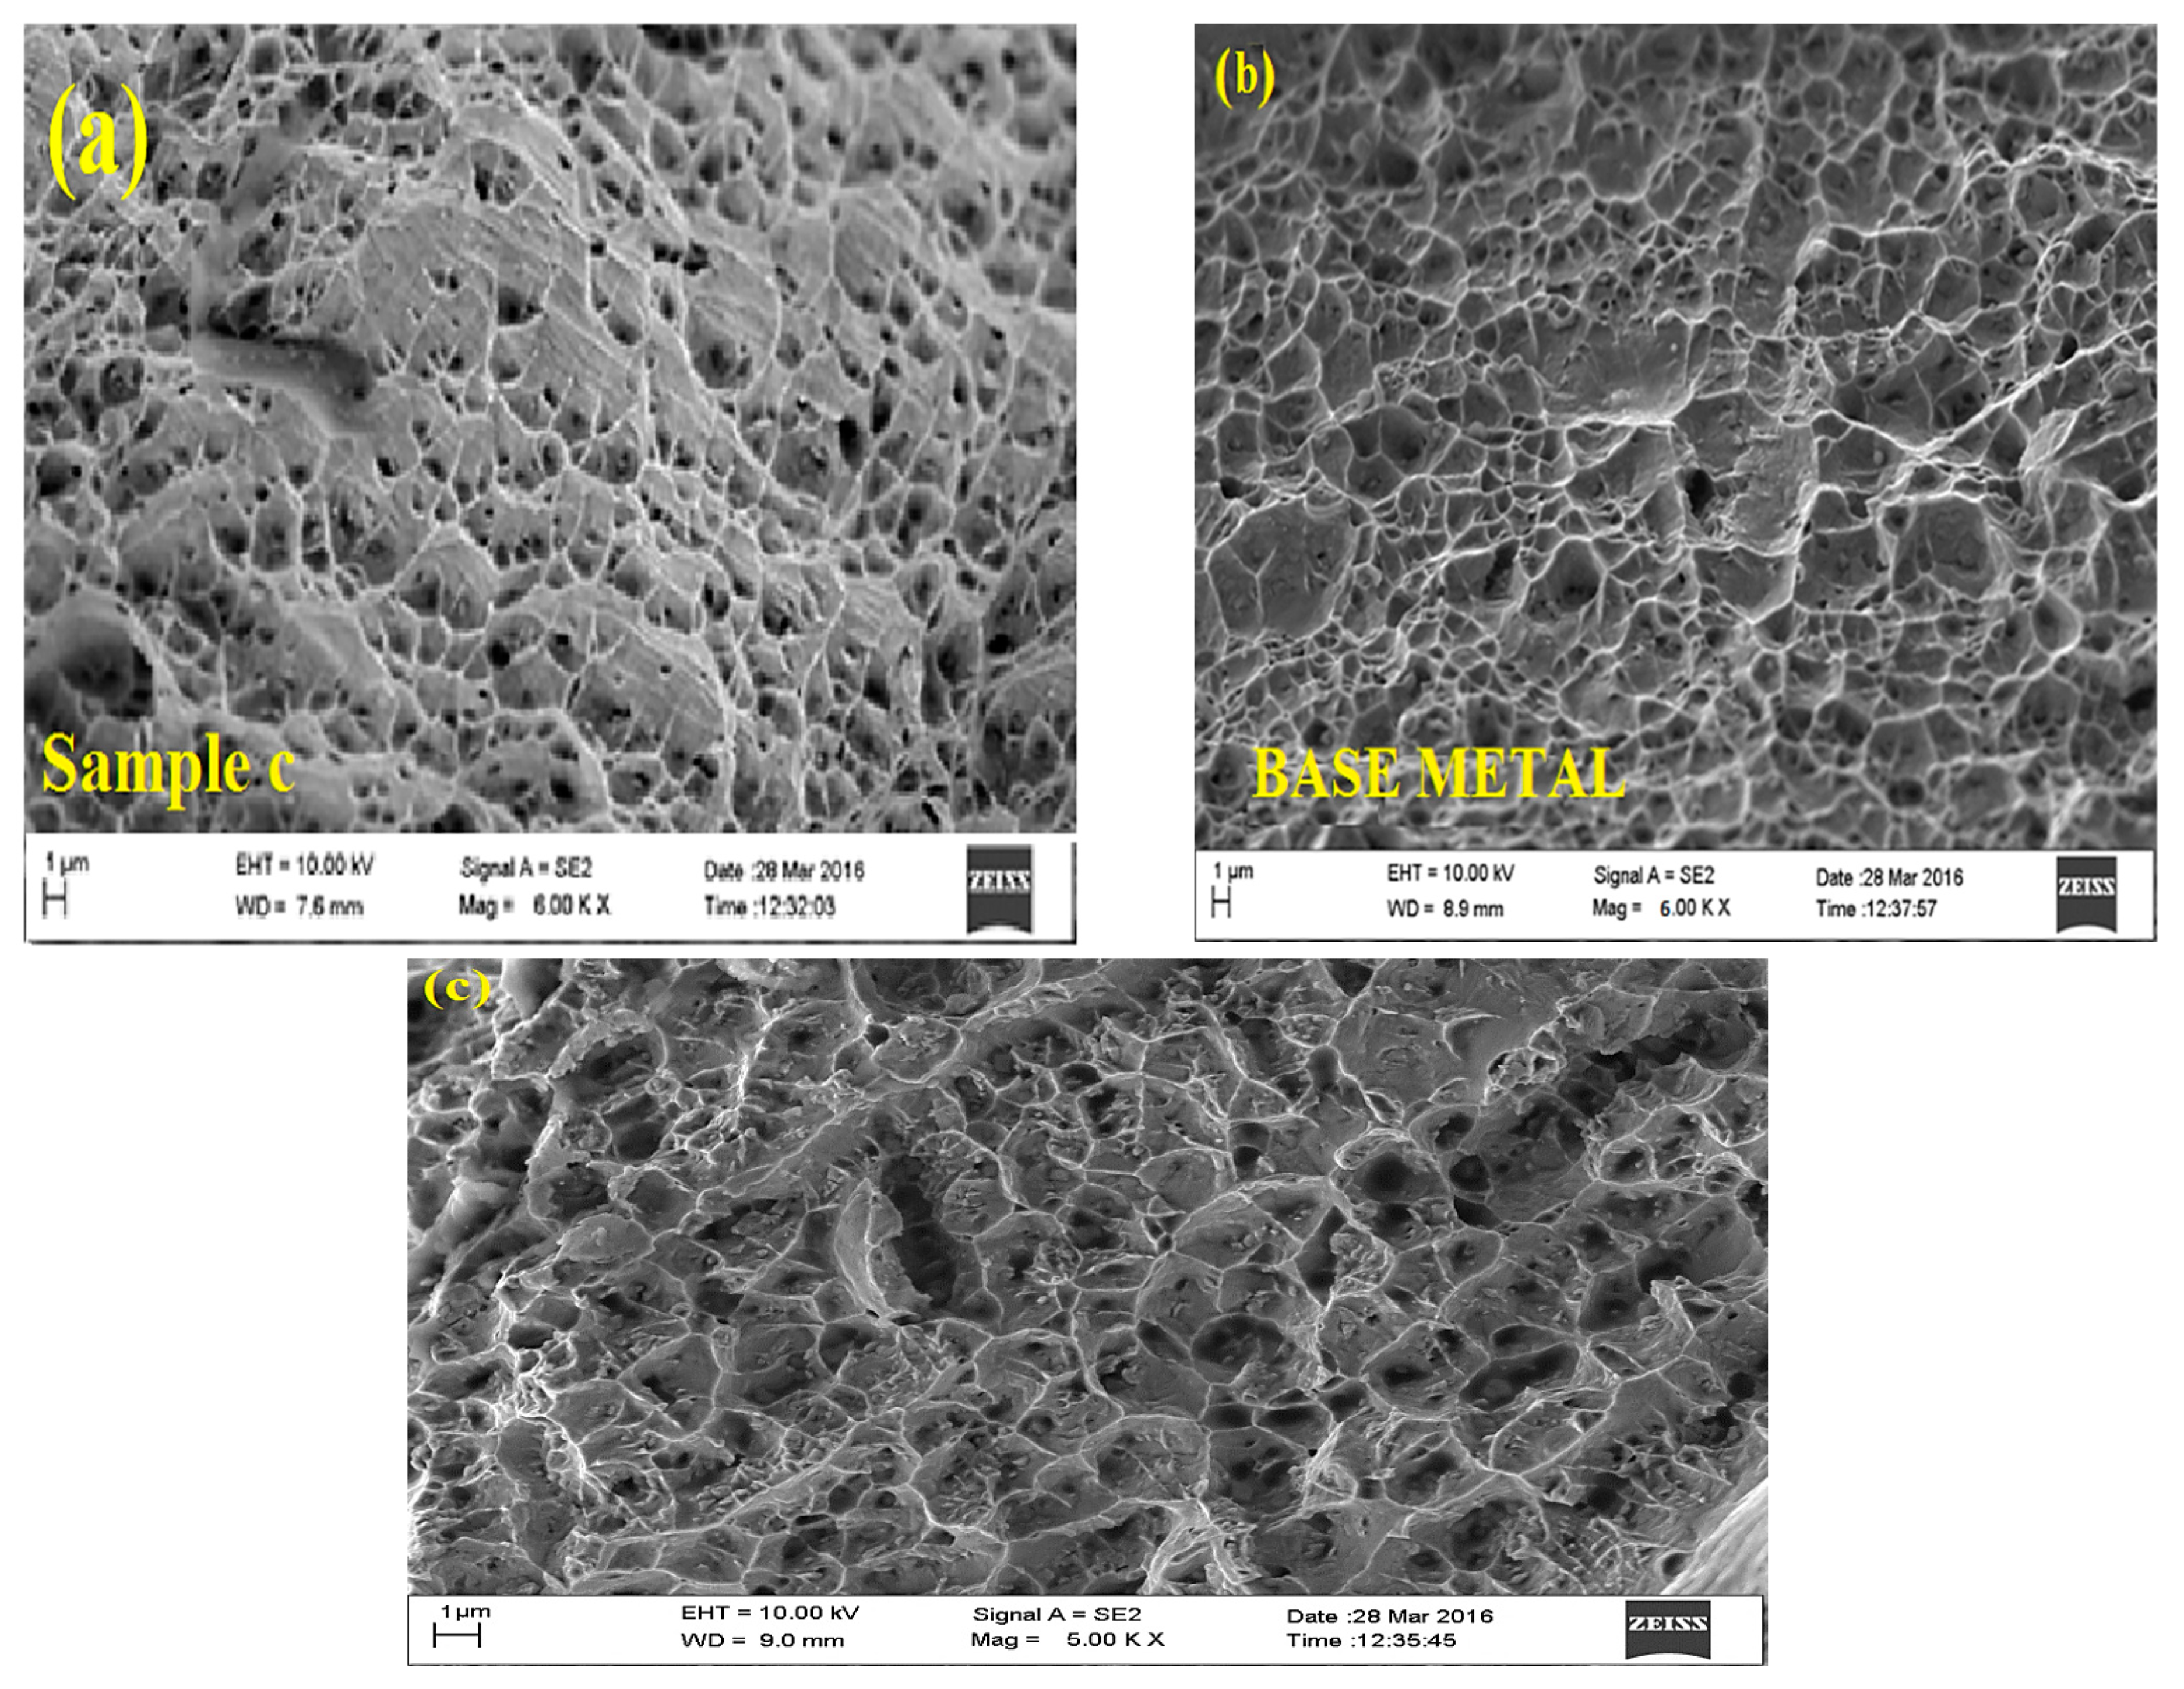
Figure 14a indicates the XRD pattern of the annealed sample at 980 °C. This 2θ range covers two possible β-titanium peaks (bcc), i.e., 100 at an angle of 40.110° and 100 at an angle of 57.912° and seven possible α-titanium peaks. The seven α peaks were observed at an angle of ((hcp) 100) 35.875°, ((hcp) 002) 38.568°, ((hcp) 101) 41.488°, ((hcp) 102) 53.121°, ((hcp) 110) 63.522°, ((hcp) 103), 70.945° and ((hcp) 112) 76.818°. The above discussion indicates that 23% of β peaks and 77% of α peaks occur in the heat-treated sample at 980 °C.
Figure 14b represents four possible β-titanium peaks (bcc) 100 at 38.013°, (bcc) 100 at 57.34°, (bcc) 100 at 78.06°, and (bcc) 100 at 85.912° and seven possible α-titanium peaks. The seven α peaks are ((hcp) 100) at 34.875°, ((hcp) 002) at 39.112°, ((hcp) 101) at 39.003°, ((hcp) 102) at 54.224°, ((hcp) 110) at 62.908°, ((hcp) 103) at 70.905°, ((hcp) 112) at 76.208°. The above discussion shows that 37% of β peaks and 63% of α peaks occur in the overlapping sample. The number of β peaks is increased in the laser-welded sample as compared with a base metal [38,39]. Hence, it is evident that the amount of β phase has increased during heating, and a complete transformation has taken place at a temperature of 958 °C.

3.12. Fractography

To further study the difference of fractures after the tensile tests of the base metal sample, the Nd-YAG laser welded sample c, overlapped sample (A-2), and heat-treated samples c at 980 °C. The FESEM image displayed in Figure 15a–e shows the Nd-YAG laser-welded sample c, base metal, overlapped sample (A-2), and annealed welded sample c at 980 °C, respectively. Figure 15a shows the dimple size is bigger as compared with the dimples of base metal. Dimple size is not uniform; in some places, it is bigger, and in some places, it is smaller. In the base metal, the dimple size is smaller, but it is uniform everywhere. Figure 15c indicates that the sizes of the dimples are appreciably big and are in large numbers as compared to base metal and lower than that of the normal welded sample. It clearly indicates that the fracture was a ductile fracture [39,40].
From the literature, it is evident that the formation of dimples largely depends upon the microstructure, and the formation of the dimples depends on the local stress at the dimples [20]. In Figure 15d, it can be distinctively observed that the dimples are very fine and bigger than that of the other samples. Finer dimples show that the load carried by the welded sample is high and, hence, yields tensile strength, and the ultimate tensile strength of the sample annealed at 980 °C is higher than that of the sample (A-2). Since the welded sample has fine dimples and, hence, the local stress at the dimples is lower than the base metal, this also improves the tensile properties of the joints. High local stress at the dimples helps to grow the size of the dimple, which leads to a decrease in the yield tensile strength and ultimate tensile strength. Figure 15e shows the close view of the selected portion. It indicates that a high amount of oxygen and aluminum was present. Therefore, alumina is a solid inclusion.

4. Conclusions

The present work is concerned with the investigation of the annealing and overlapping factor on surface morphology and mechanical properties. The following are the basic observations derived from the investigation:
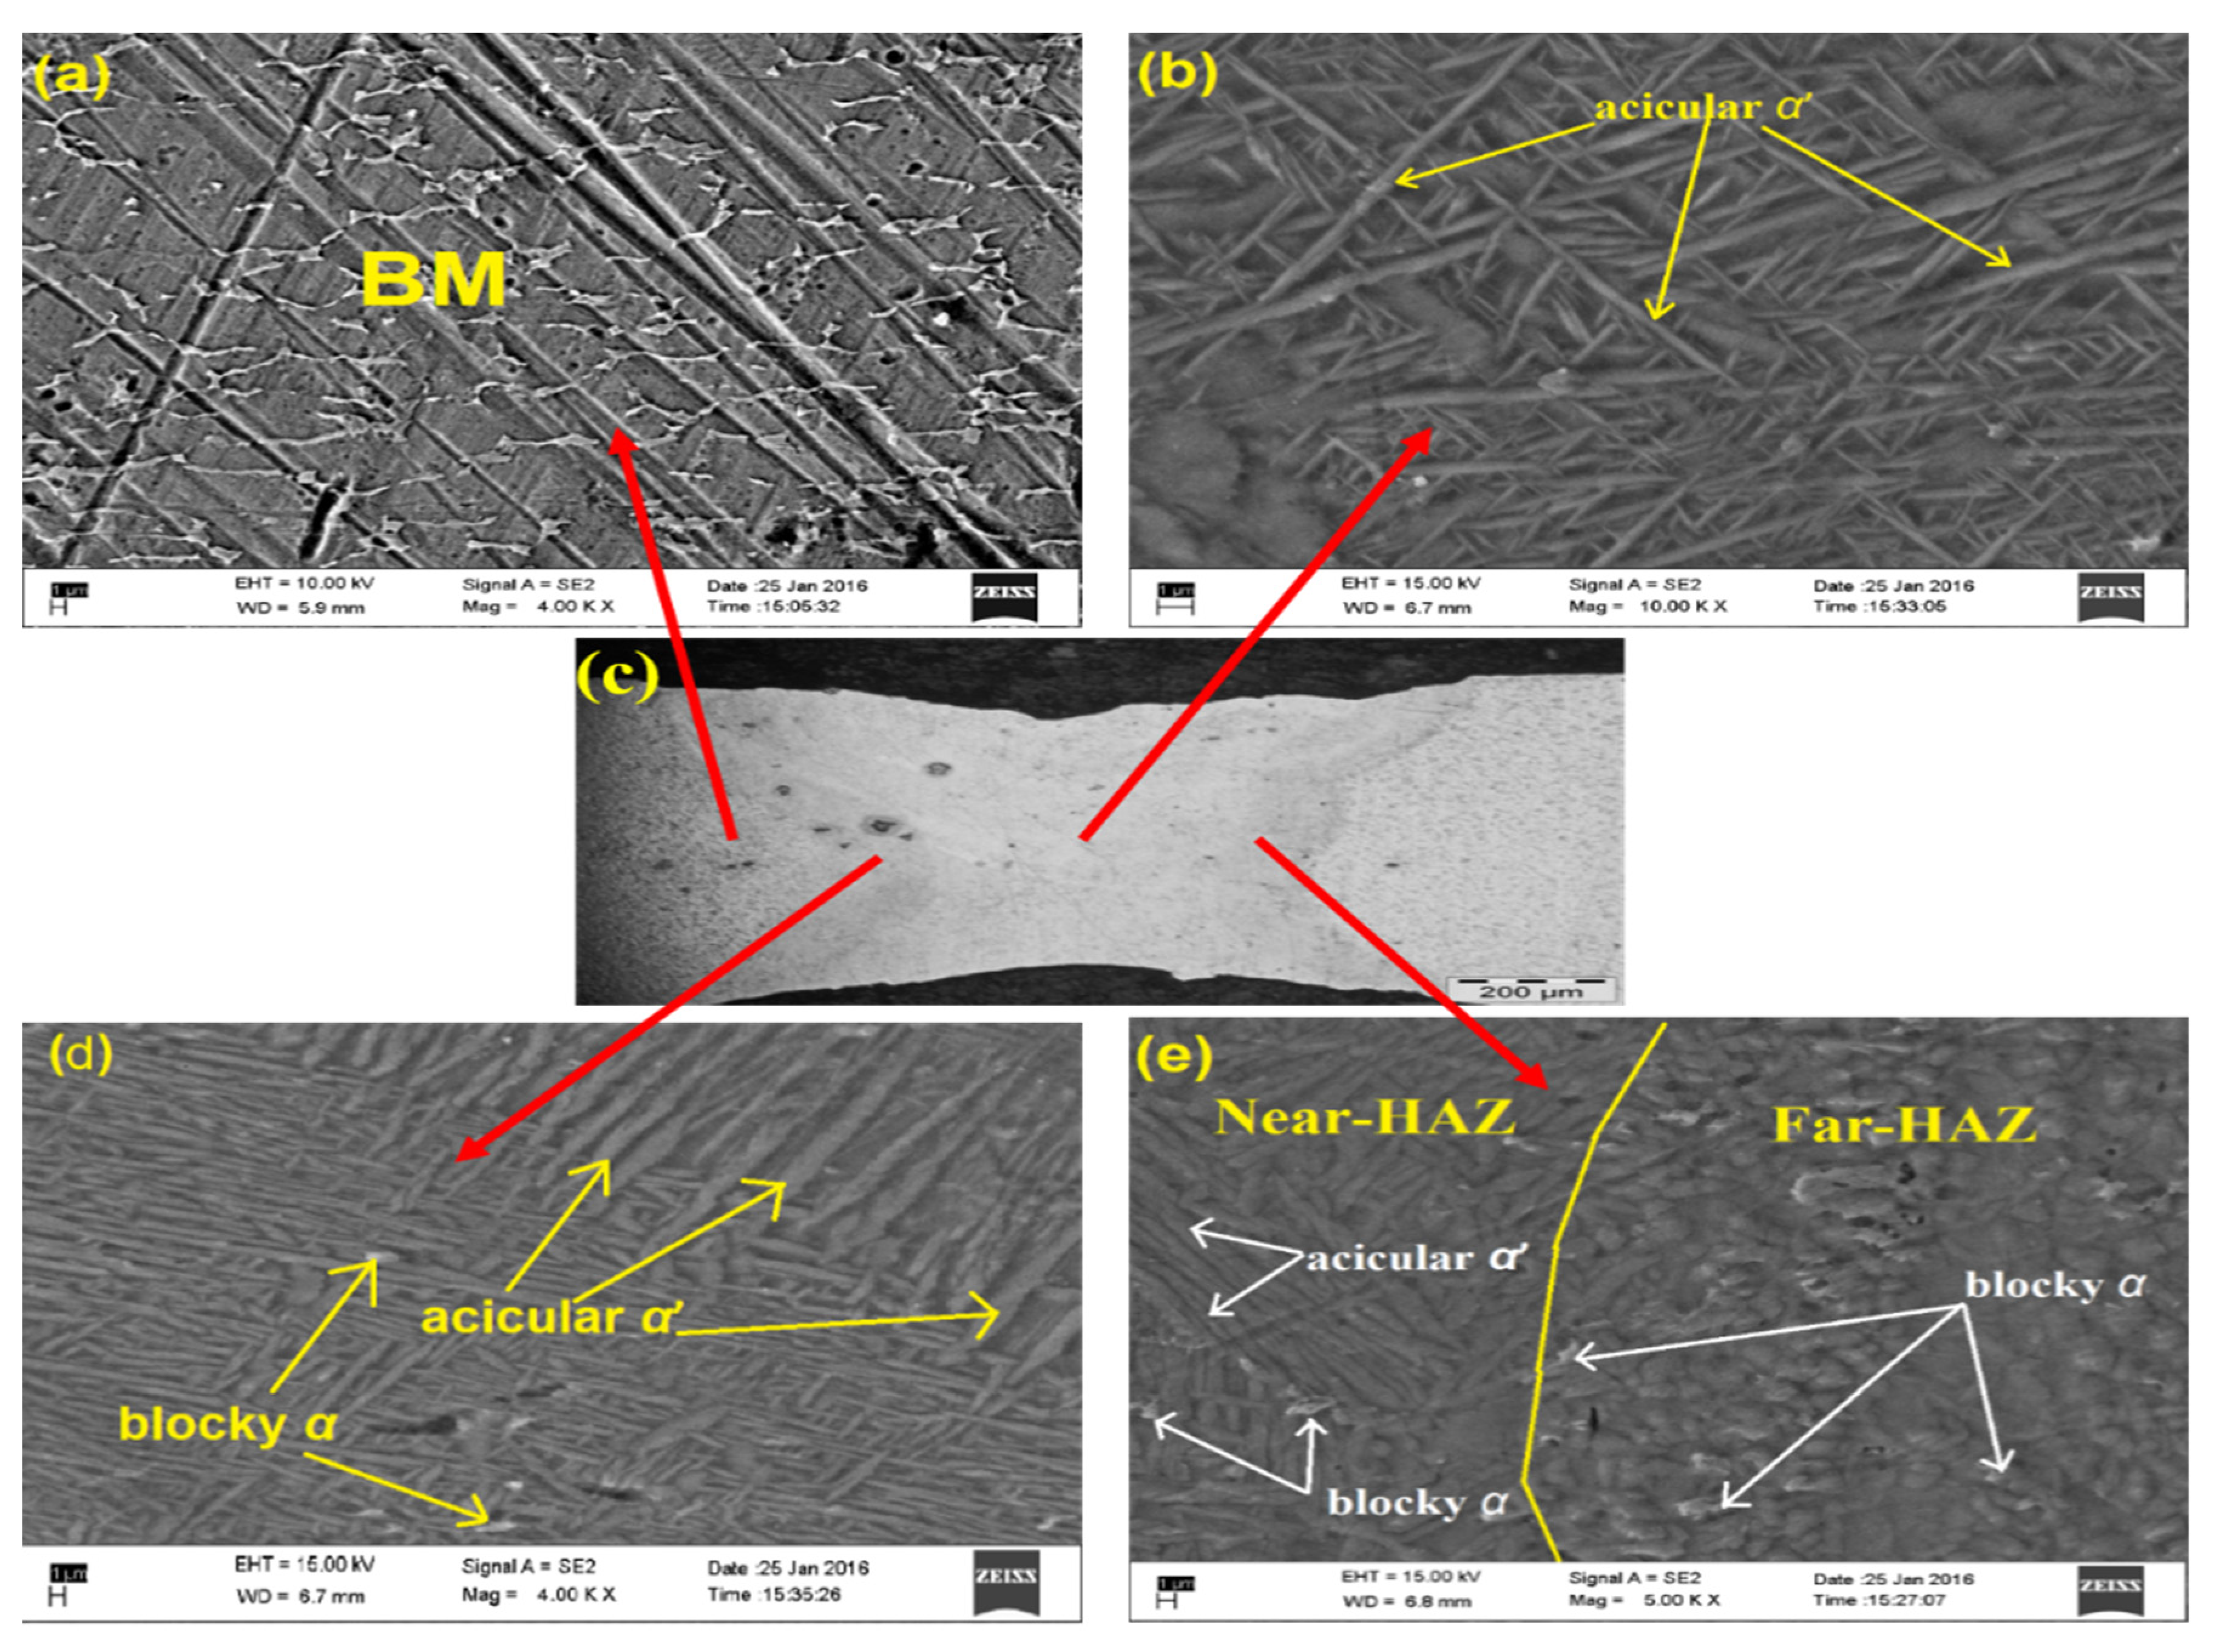
  • The presence of the acicular ‘α’ martensite phase in the FZ is the main reason for the increment of tensile strength and yield strength of the welded samples. The higher hardness in the fusion zone also supports the enhancement of tensile strength.
  • A high amount of acicular ‘α’ martensite phase is recorded in the FZ and decrement is observed from near-HAZ to far-HAZ, and it completely vanishes at the far-HAZ and BM interface.
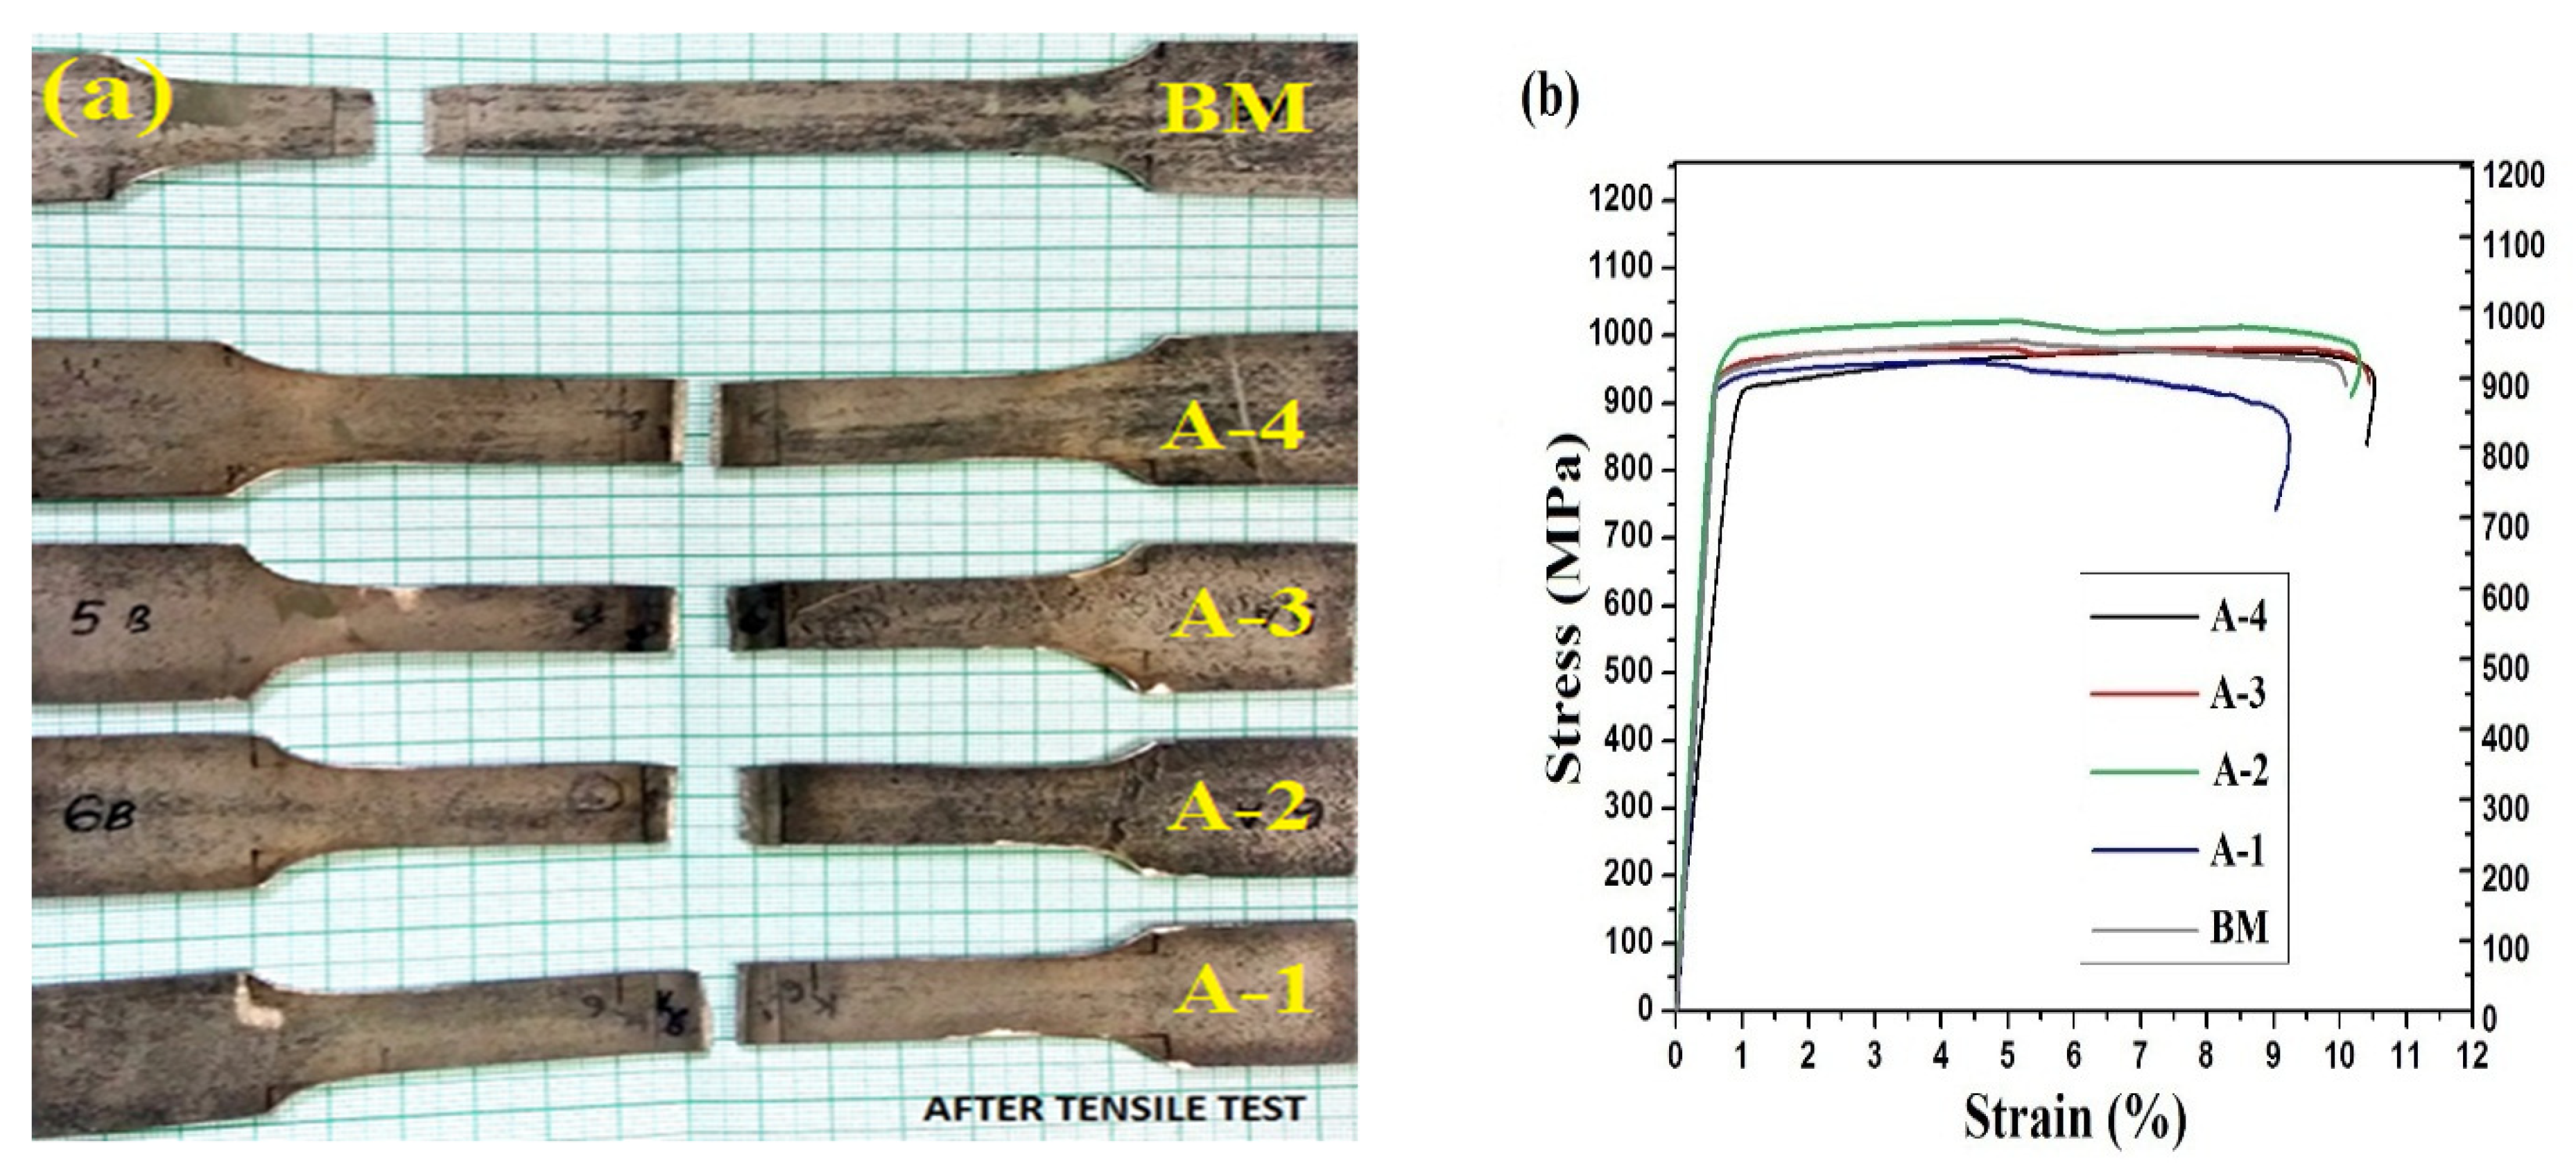
  • A sample having an overlapping percentage of 79.5 shows the most favorable result in terms of weld quality.
  • The UTS of the annealed sample (c) at 980 °C was highest with 1048 MPa.
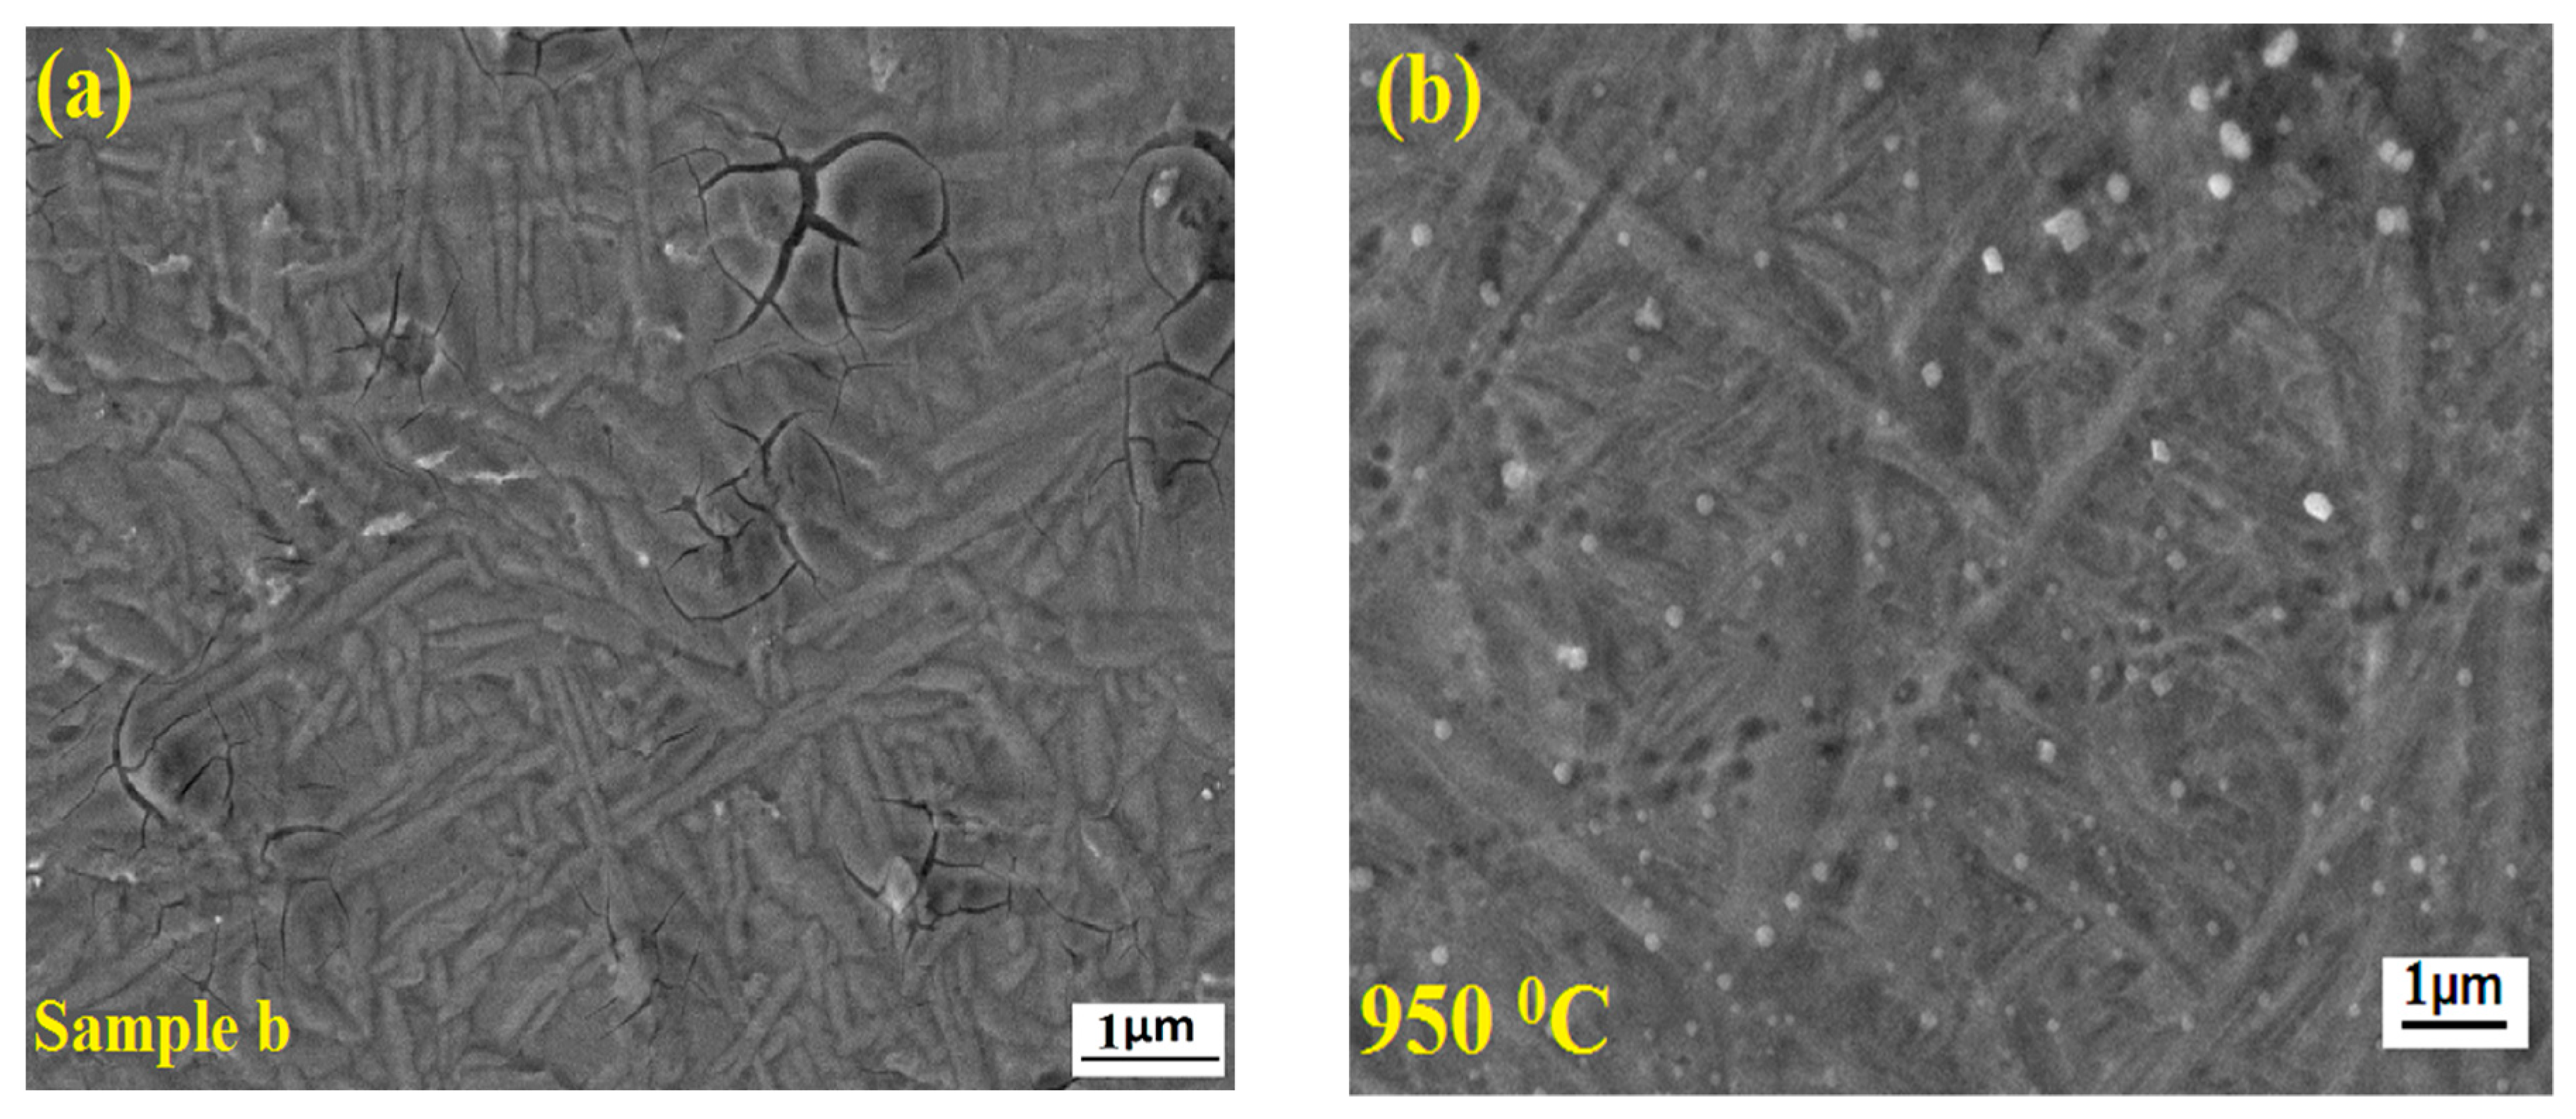
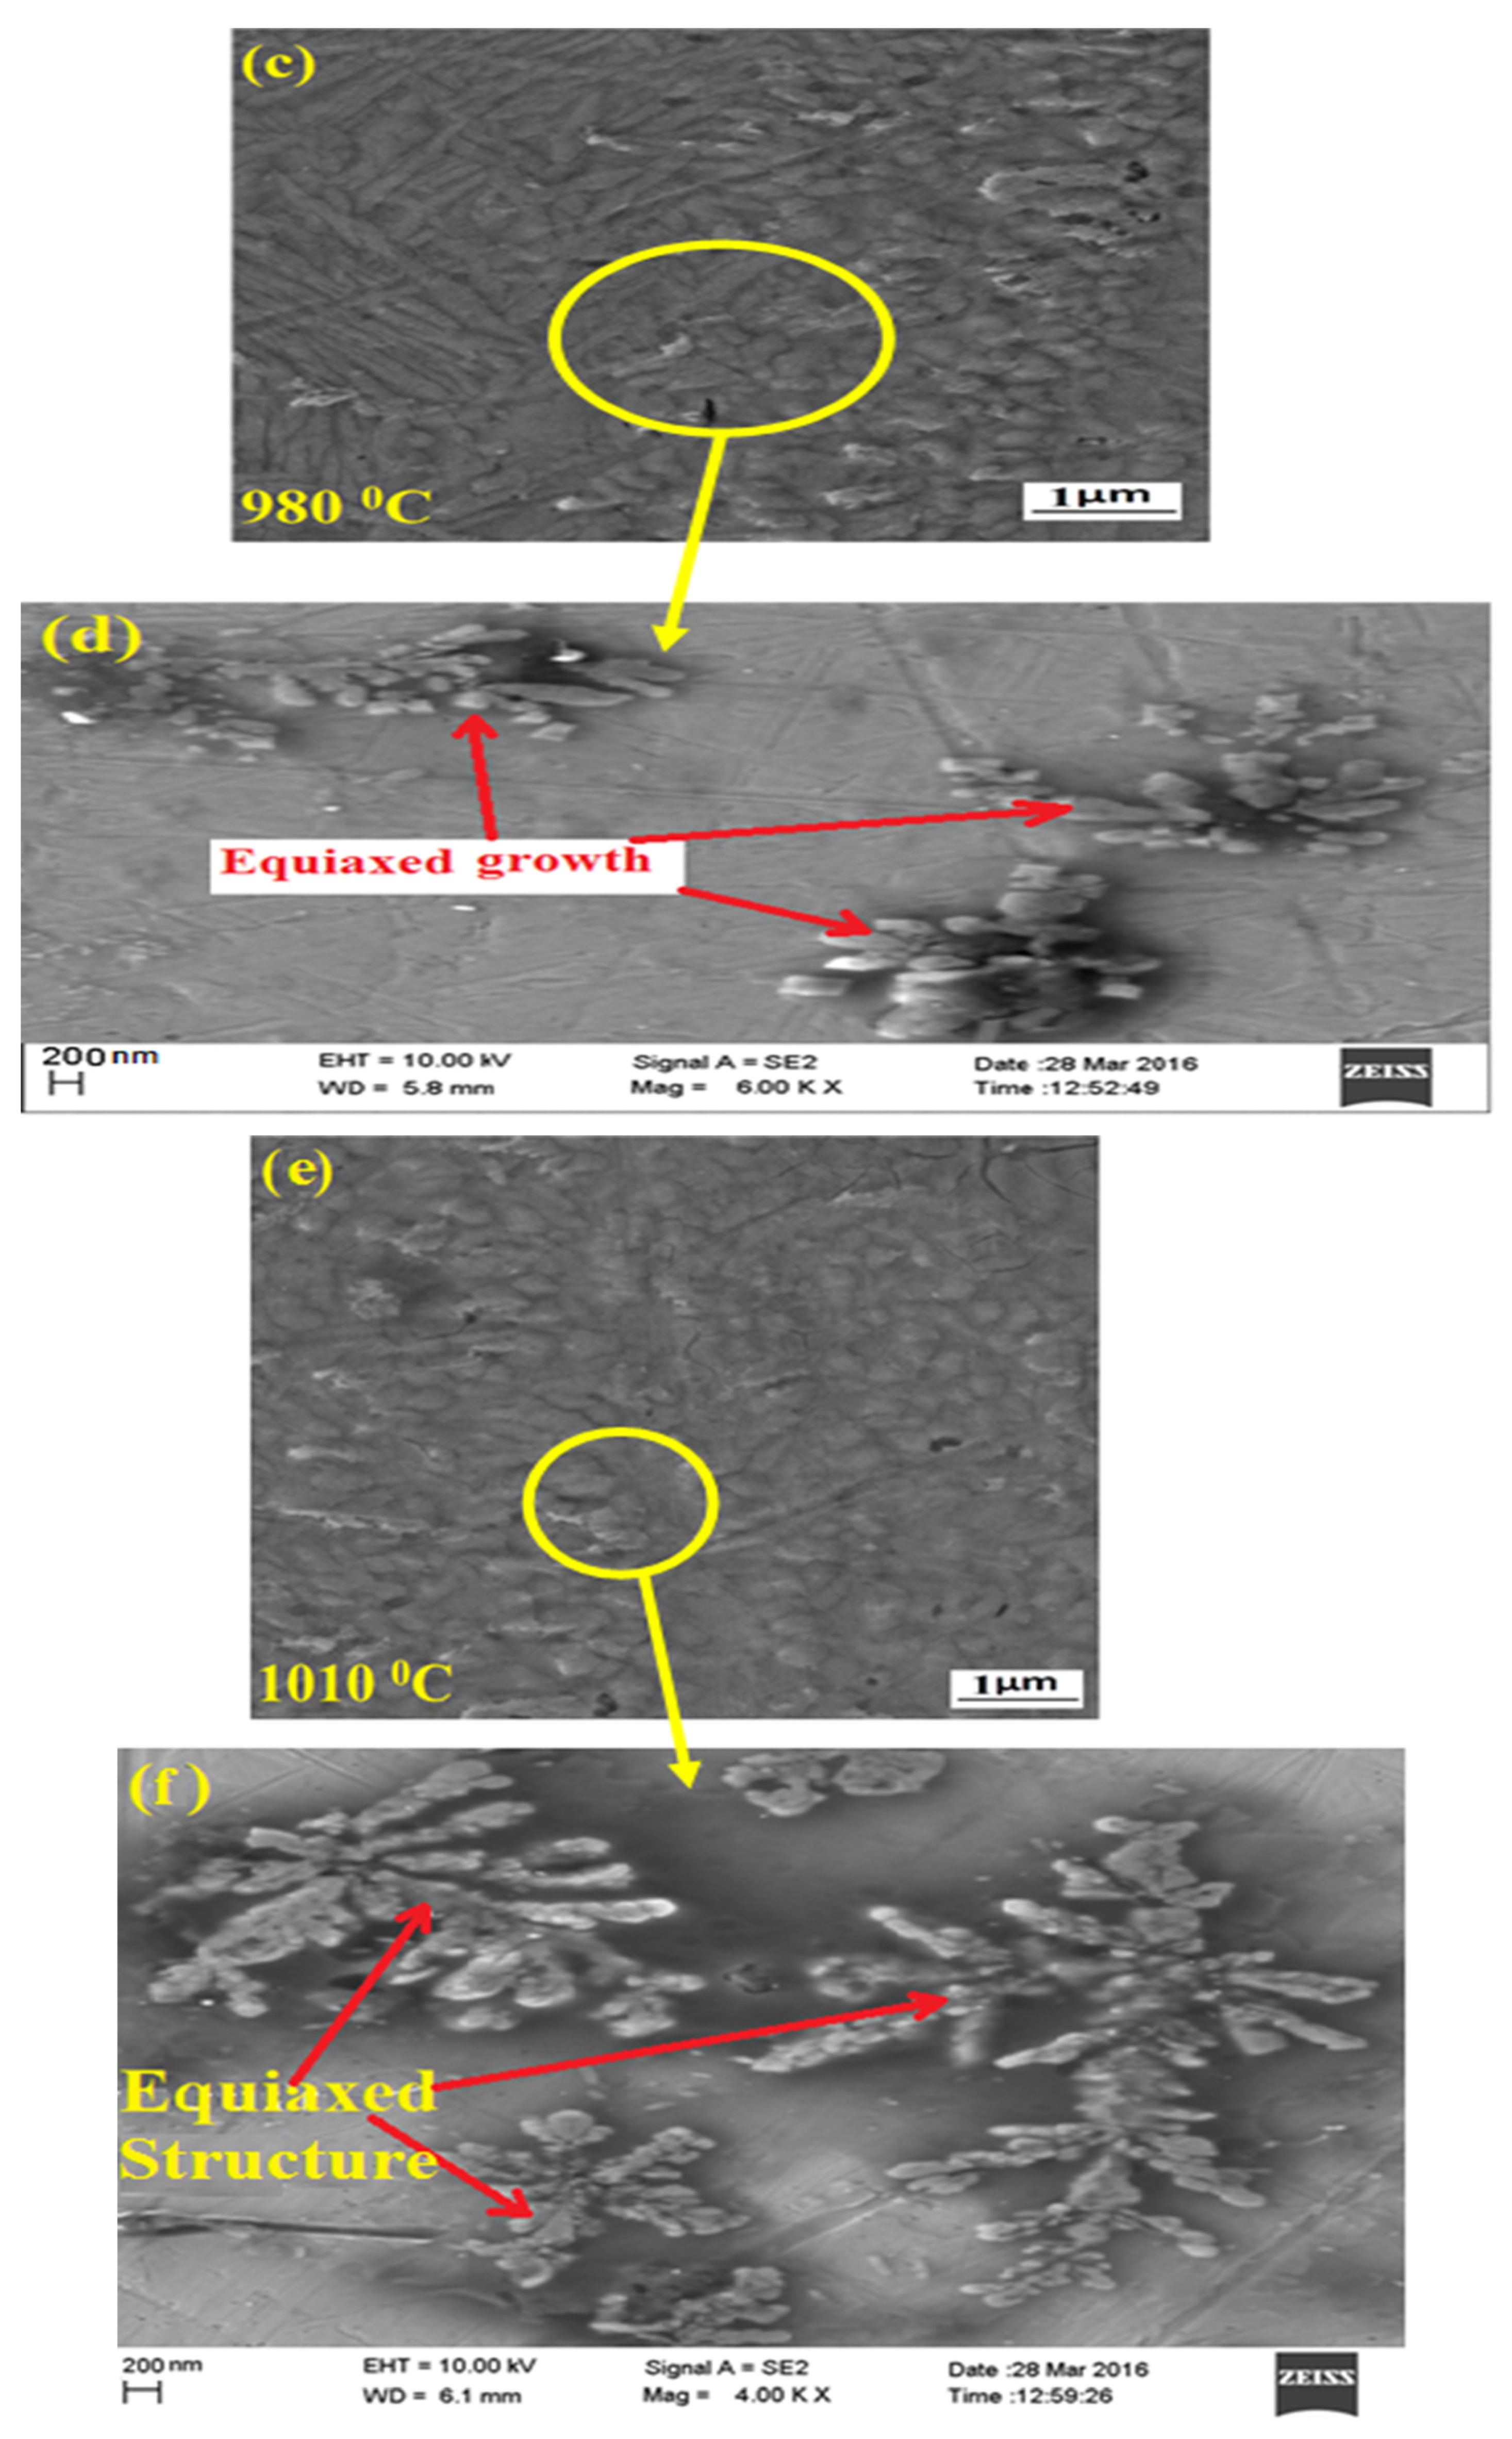
  • Heat treatment reduces the content of the beta phase and increases the alpha phase.
  • XRD analysis indicates that 23% of β peaks and 77% of α peaks occur in the heat-treated sample at 980 °C, but 37% of β peaks and 63% of α peaks occur in the overlapped sample.
  • In the annealed sample at 980 °C, the dimples are bigger in size as compared to overlapped sample (A-2). Dimples are evenly distributed, which also increases the tensile strength.

Author Contributions

Conceptualization, U.K., S.C., A.K.D., S.S. (Shubham Sharma), S.P.D. and K.N.; methodology, U.K., S.C., A.K.D., S.S. (Shubham Sharma), S.P.D. and K.N.; formal analysis, U.K., S.C., A.K.D., A.H.S., S.S. (Shubham Sharma), S.P.D. and K.N.; investigation, UK, SC, A.K.D., S.S. (Shubham Sharma), S.P.D. and K.N.; writing—original draft prep-aration, U.K., S.C., A.K.D., S.S. (Shubham Sharma), S.P.D. and K.N.; writing—review and editing, A.H.S., S.S. (Shubham Sharma), S.P.D., K.N., A.K., A.A. and S.S. (Sunpreet Singh); supervision, S.S. (Shubham Sharma), S.P.D., K.N., A.K., A.A. and S.S. (Sunpreet Singh); project administration, A.H.S., S.S. (Shubham Sharma) and S.S. (Sunpreet Singh); funding acquisition, S.S. (Shubham Sharma) and S.S. (Sunpreet Singh). All authors have read and agreed to the published version of the manuscript.

Funding

This research was funded by the Researchers Supporting Project number RSP2023R373.

Institutional Review Board Statement

Not applicable.

Informed Consent Statement

Not applicable.

Data Availability Statement

No data were used to support this study.

Acknowledgments

The authors would like to acknowledge the Researchers Supporting Project number (RSP2023R373), King Saud University, Riyadh, Saudi Arabia.

Conflicts of Interest

The authors declare no conflict of interest.

References

  1. Caiazzo, F.; Curcio, F.; Daurelio, G.; Minutolo, F.M.C. Ti6Al4V sheets lap and butt joints carried out by CO2 laser: Mechanical and morphological characterization. J. Mater. Process. Technol. 2004, 149, 546–552. [Google Scholar] [CrossRef]
  2. Casalino, G.; Curcio, F.; Minutolo, F.M.C. Investigation on Ti6Al4V Laser welding using Statistical and Taguchi Approaches. J. Mater. Process. Technol. 2005, 167, 422–428. [Google Scholar] [CrossRef]
  3. Xiao, C.; Zhang, H.; Davoodi, D.; Miri, R.; Tayebi, M. Microstructure evolutions of Ti-Al-Nb alloys with different Ta addition, produced by mechanical alloying and spark plasma sintering. Mater. Lett. 2022, 323, 132568. [Google Scholar] [CrossRef]
  4. Lee, H.K.; Han, H.S.; Son, K.J.; Hong, S.B. Optimization of Nd-YAG laser welding parameters for sealing small titanium tube ends. Mater. Sci. Eng. A 2006, 415, 149–155. [Google Scholar] [CrossRef]
  5. Costa, A.; Miranda, R.; Quintino, L.; Yapp, D. Analysis of Beam Material Interaction in Welding of Titanium with Fiber Lasers. Mater. Manuf. Process. 2007, 22, 798–803. [Google Scholar] [CrossRef]
  6. Tzeng, Y.F. Process characterisation of pulsed Nd-YAG laser seam welding. Int. J. Adv. Manuf. Technol. 2000, 16, 10–18. [Google Scholar] [CrossRef]
  7. Torkamany, M.J.; Hamedi, M.J.; Malek, F.; Sabbaghzadeh, J. The effect of process parameters on keyhole welding with a 400 W Nd-YAG pulsed laser. J. Phys. D Appl. Phys. 2006, 39, 4563. [Google Scholar] [CrossRef]
  8. Ghaini, F.M.; Hamedi, M.J.; Torkamany, M.J.; Sabbaghzadeh, J. Weld metal microstructural characteristics in pulsed Nd-YAG laser welding. Scr. Mater. 2007, 56, 955–958. [Google Scholar]
  9. Torkamany, M.J.; Ghaini, F.M.; Papan, E.; Dadras, S. Process optimization in titanium welding with pulsed Nd-YAG laser. Sci. Adv. Mater. 2012, 4, 489–496. [Google Scholar] [CrossRef]
  10. Gao, X.L.; Zhang, L.J.; Liu, J.; Zhang, J.X. Porosity and microstructure in pulsed Nd-YAG laser welded Ti-6Al-4V sheet. J. Mater. Process. Technol. 2014, 214, 1316–1325. [Google Scholar] [CrossRef]
  11. Baruah, M.; Bag, S. Influence of pulsation in thermo-mechanical analysis on laser micro-welding of Ti-6Al-4V alloy. Opt. Laser Technol. 2017, 90, 40–51. [Google Scholar] [CrossRef]
  12. Sabbaghzadeh, J.; Hamedi, M.J.; Ghaini, F.M.; Torkamany, M.J. Effect of process parameters on the melting ratio in overlap pulsed laser welding. Metall. Mater. Trans. B 2008, 39, 340–347. [Google Scholar] [CrossRef]
  13. Baghjari, S.H.; Mousavi, S.A. Effects of pulsed Nd-YAG laser welding parameters and subsequent post-weld heat treatment on microstructure and hardness of AISI 420 stainless steel. Mater. Des. 2013, 43, 1–9. [Google Scholar] [CrossRef]
  14. Lapsanska, H.; Chmelickova, H.; Hrabovsky, M. Effect of beam energy on weld geometric characteristics in Nd-YAG laser overlapping spot welding of thin AISI 304 stainless steel sheets. Metall. Mater. Trans. B 2010, 41, 1108–1115. [Google Scholar] [CrossRef]
  15. Wang, S.H.; Wei, M.D.; Tsay, L.W. Tensile properties of LBW welds in Ti–6Al–4V alloy at evaluated temperatures below 450 °C. Mater. Lett. 2003, 57, 1815–1823. [Google Scholar] [CrossRef]
  16. Jiao, X.; Kong, B.; Tao, W.; Liu, G.; Ning, H. Effects of annealing on microstructure and deformation uniformity of Ti-22Al-24Nb-0.5 Mo laser-welded joints. Mater. Des. 2017, 130, 166–174. [Google Scholar] [CrossRef]
  17. Kumar, U.; Gope, D.K.; Srivastava, J.P.; Chattopadhyaya, S.; Das, A.K.; Krolczyk, G. Experimental and Numerical Assessment of Temperature Field and Analysis of Microstructure and Mechanical Properties of Low Power Laser Annealed Welded Joints. Materials 2018, 11, 1514. [Google Scholar] [CrossRef] [PubMed] [Green Version]
  18. Kumar, U.; Gope, D.K.; Kumar, R.; Chattopadhyaya, S.; Das, A.K.; Pramanik, A.; Krolczyk, G. Investigation of microstructure and mechanical properties of titanium alloy sheet using low power Nd-YAG laser welding process. Met. Mater. 2018, 56, 121–129. [Google Scholar] [CrossRef] [Green Version]
  19. Wang, G.Q.; Wu, A.P.; Zhao, Y.; Zou, G.S.; Chen, Q.; Ren, J.L. Effect of post-weld heat treatment on microstructure and properties of Ti-23Al-17Nb alloy laser beam welding joints. Trans. Nonferrous Met. Soc. China 2010, 20, 732–739. [Google Scholar] [CrossRef]
  20. Zhong, Y.; Xie, J.; Chen, Y.; Yin, L.; He, P.; Lu, W. Microstructure and mechanical properties of micro laser welding NiTiNb/Ti6Al4V dissimilar alloys lap joints with nickel interlayer. Mater. Lett. 2022, 306, 130896. [Google Scholar] [CrossRef]
  21. Yuhua, C.; Yuqing, M.; Weiwei, L.; Peng, H. Investigation of welding crack in micro laser welded NiTiNb shape memory alloy and Ti6Al4V alloy dissimilar metals joints. Opt. Laser Technol. 2017, 91, 197–202. [Google Scholar] [CrossRef]
  22. Chen, Y.; Sun, S.; Zhang, T.; Zhou, X.; Li, S. Effects of post-weld heat treatment on the microstructure and mechanical properties of laser-welded NiTi/304SS joint with Ni filler. Mater. Sci. Eng. A 2020, 771, 138545. [Google Scholar] [CrossRef]
  23. Long, X.; Guo, Y.; Su, Y.; Siow, K.S.; Chen, C. Unveiling the damage evolution of SAC305 during fatigue by entropy generation. Int. J. Mech. Sci. 2023, 244, 108087. [Google Scholar] [CrossRef]
  24. Zhang, H.; Xiao, Y.; Xu, Z.; Yang, M.; Zhang, L.; Yin, L.; Cai, X. Effects of Ni-decorated reduced graphene oxide nanosheets on the microstructural evolution and mechanical properties of Sn-3.0Ag-0.5Cu composite solders. Intermetallics 2022, 150, 107683. [Google Scholar] [CrossRef]
  25. Wang, S.; Chen, Y.; Gu, C.; Sai, Q.; Lei, T.; Williams, J. Antifouling Coatings Fabricated by Laser Cladding. Coatings 2023, 13, 397. [Google Scholar] [CrossRef]
  26. Zhang, H.; Ouyang, Z.; Li, L.; Ma, W.; Liu, Y.; Chen, F.; Xiao, X. Numerical Study on Welding Residual Stress Distribution of Corrugated Steel Webs. Metals 2022, 12, 1831. [Google Scholar] [CrossRef]
  27. Xiao, X.; Zhang, H.; Li, Z.; Chen, F.; Rasulo, A. Effect of Temperature on the Fatigue Life Assessment of Suspension Bridge Steel Deck Welds under Dynamic Vehicle Loading. Math. Probl. Eng. 2022, 2022, 7034588. [Google Scholar] [CrossRef]
  28. Shi, J.; Zhao, B.; He, T.; Tu, L.; Lu, X.; Xu, H. Tribology and dynamic characteristics of textured journal-thrust coupled bearing considering thermal and pressure coupled effects. Tribol. Int. 2023, 180, 108292. [Google Scholar] [CrossRef]
  29. Zhang, L.; Xiong, D.; Su, Z.; Li, J.; Yin, L.; Yao, Z.; Zhang, H. Molecular dynamics simulation and experimental study of tin growth in SAC lead-free microsolder joints under thermo-mechanical-electrical coupling. Mater. Today Commun. 2022, 33, 104301. [Google Scholar] [CrossRef]
  30. Fu, Z.H.; Yang, B.J.; Shan, M.L.; Li, T.; Zhu, Z.Y.; Ma, C.P.; Gao, W. Hydrogen embrittlement behavior of SUS301L-MT stainless steel laser-arc hybrid welded joint localized zones. Corros. Sci. 2020, 164, 108337. [Google Scholar] [CrossRef]
  31. Zhu, Z.Y.; Liu, Y.L.; Gou, G.Q.; Gao, W.; Chen, J. Effect of heat input on interfacial characterization of the butter joint of hot-rolling CP-Ti/Q235 bimetallic sheets by Laser + CMT. Sci. Rep. 2021, 11, 10020. [Google Scholar] [CrossRef] [PubMed]
  32. Zhu, Q.; Chen, J.; Gou, G.; Chen, H.; Li, P. Ameliorated longitudinal critically refracted—Attenuation velocity method for welding residual stress measurement. J. Mater. Process. Technol. 2017, 246, 267–275. [Google Scholar] [CrossRef]
  33. Gao, Q.; Ding, Z.; Liao, W. Effective elastic properties of irregular auxetic structures. Compos. Struct. 2022, 287, 115269. [Google Scholar] [CrossRef]
  34. Fang, J.X.; Wang, J.X.; Wang, Y.J.; He, H.T.; Zhang, D.B.; Cao, Y. Microstructure evolution and deformation behavior during stretching of a compositionally inhomogeneous TWIP-TRIP cantor-like alloy by laser powder deposition. Mater. Sci. Eng. A 2022, 847, 143319. [Google Scholar] [CrossRef]
  35. Zhang, Z.; Chen, J.; Wang, J.; Han, Y.; Yu, Z.; Wang, Q.; Yang, S. Effects of solder thickness on interface behavior and nanoindentation characteristics in Cu/Sn/Cu microbumps. Weld. World 2022, 66, 973–983. [Google Scholar] [CrossRef]
  36. Liang, L.; Xu, M.; Chen, Y.; Zhang, T.; Tong, W.; Liu, H.; Li, H. Effect of welding thermal treatment on the microstructure and mechanical properties of nickel-based superalloy fabricated by selective laser melting. Mater. Sci. Eng. A Struct. Mater. Prop. Microstruct. Process. 2021, 819, 141507. [Google Scholar] [CrossRef]
  37. Xu, H.; He, T.; Zhong, N.; Zhao, B.; Liu, Z. Transient thermomechanical analysis of micro cylindrical asperity sliding contact of SnSbCu alloy. Tribol. Int. 2022, 167, 107362. [Google Scholar] [CrossRef]
  38. Niu, X.; Zhu, S.; He, J.; Liao, D.; Correia, J.A.F.O.; Berto, F.; Wang, Q. Defect tolerant fatigue assessment of AM materials: Size effect and probabilistic prospects. Int. J. Fatigue 2022, 160, 106884. [Google Scholar] [CrossRef]
  39. He, J.; Zhu, S.; Luo, C.; Niu, X.; Wang, Q. Size effect in fatigue modelling of defective materials: Application of the calibrated weakest-link theory. Int. J. Fatigue 2022, 165, 107213. [Google Scholar] [CrossRef]
  40. Li, X.; Zhu, S.; Liao, D.; Correia, J.A.F.O.; Berto, F.; Wang, Q. Probabilistic fatigue modelling of metallic materials under notch and size effect using the weakest link theory. Int. J. Fatigue 2022, 159, 106788. [Google Scholar] [CrossRef]
Figure 1. Schematic illustration of the complete experimental setup.
Photonics 10 00372 g001
Figure 2. (a) Schematic of an overlapping factor of pulsed laser; (b) Close view of the overlapping.
Photonics 10 00372 g002
Figure 3. Face side images of the weld bead with different overlapping percentages and welding speeds with a magnification scale of 50×.
Photonics 10 00372 g003
Figure 4. Images of the weld bead backside face with different overlapping percentages and welding speeds with a magnification scale of 50×.
Photonics 10 00372 g004
Figure 5. (a) Bead length of front and root side of sample A-2 [17]. (b) Represents bar chart of weld bead between face side and root side.
Photonics 10 00372 g005
Figure 6. Joint morphology of annealed A-2 sample in (ae).
Photonics 10 00372 g006
Figure 7. Structure at different temperatures during annealing. (a) Base Sample (b) at 950 °C (c) at 980 °C; (d) large view of equiaxed structure growth (e) at 1010 °C; (f) close view of an equiaxed structure [17,18].
Photonics 10 00372 g007aPhotonics 10 00372 g007b
Figure 8. (a) Tensile tested samples of the Ti-6Al-4V; (b) Stress–strain curve of the Ti-6Al-4V.
Photonics 10 00372 g008
Figure 9. Stress–strain graph for the annealed samples [17].
Photonics 10 00372 g009
Figure 10. Comparison of stress–strain curve of the sample (A-2) and the sample 980 °C.
Photonics 10 00372 g010
Figure 11. (a) Indentation line of the welded joint. (b) Micro-hardness profiles across weld center line.
Photonics 10 00372 g011
Figure 12. Variation of hardness in different conditions.
Photonics 10 00372 g012
Figure 13. Microhardness comparison between (A-2) and annealed sample at 980 °C.
Photonics 10 00372 g013
Figure 14. (a) XRD pattern for an annealed sample at 980 °C [18]. (b) XRD pattern for overlapped sample (A-2).
Photonics 10 00372 g014
Figure 15. FESEM fractography of tensile samples (a) Nd-YAG laser-welded sample c; (b) Base metal; (c) Overlapped sample (A-2); (d) Annealed welded sample at 980 °C; (e) Close view of the selected portion.
Photonics 10 00372 g015aPhotonics 10 00372 g015b
Table 1. Mechanical properties of work material (Ti-6Al-4V).
Tensile Strength (MPa)Yield Strength
(MPa)
Elongation
(%)
Hardness
(HV)
962 ± 44895 ± 4010–14342–348
Table 2. Chemical composition (wt. %) of work material (Ti-6Al-4V).
CAlVOTi
0.16.804.070.5584.20
Table 3. Fixed welding parameters during experimentation.
ParametersValue
Spot diameter (mm)0.45
Peak pulse power (W)1000
Pulse per energy (J)20
Pulse duration (ms)20
Wavelength (µm)1.06
Pulse frequency (Hz)20
Table 4. Fixed system parameter used for calculating overlapping factor.
Peak Power192 W
Pulse energy9.6 J
Pulse Frequency20 Hz
Pulse duration10 ms
Table 5. Volume fraction under different annealing temperatures.
As-Welded950 °C980 °C1010 °C
The volume fraction of needle-shaped structure (%)98845211
The volume fraction of equiaxed structure (%)2164889
Table 6. Mechanical properties of samples at different conditions.
Mechanical PropertiesBase Sample950 °C980 °C1010 °C
UTS (MPa)1014101610481021
Elongation (%)10.59.99.79.3
Disclaimer/Publisher’s Note: The statements, opinions and data contained in all publications are solely those of the individual author(s) and contributor(s) and not of MDPI and/or the editor(s). MDPI and/or the editor(s) disclaim responsibility for any injury to people or property resulting from any ideas, methods, instructions or products referred to in the content.

