Design of a Broadband Fiber Optic Mode Coupler for Multimode Optical Coherence Tomography


1
Institute for Infocomm Research, Agency for Science, Technology and Research, Singapore 138632, Singapore
2
School of Electrical and Electronic Engineering, Nanyang Technological University, Singapore 639798, Singapore
*
Author to whom correspondence should be addressed.
Photonics 2023, 10(2), 162; https://doi.org/10.3390/photonics10020162
Submission received: 20 December 2022
/
Revised: 31 January 2023
/
Accepted: 1 February 2023
/
Published: 3 February 2023
(This article belongs to the Special Issue Advances in 3OM: Opto-Mechatronics, Opto-Mechanics, and Optical Metrology)
Abstract
:In this paper, we propose an optical fiber-based broadband mode coupler for multimode optical coherence tomography (OCT) in the O-band (1.26–1.36 μm). The proposed device uses a tapered few-mode fiber (FMF) to lower the effective mode index of the selected higher-order mode, which can be phase matched to the fundamental mode of the single-mode fiber (SMF). The tapered FMF and the SMF are side polished to reduce the core-to-core separation to achieve efficient mode coupling. Key design parameters such as the tapering ratio of the FMF, FMF core to SMF core separation, coupler length, and coupling ratio in the O-band are studied thoroughly. Higher-order modes of the FMF will be effectively coupled from the fundamental mode of SMF in the sample arm of the multimode OCT system. The reflected signals of the higher-order modes from the sample will be separated into several single-mode signals using the same fiber device before interfering with the reference light, which was not possible before. The proposed fiber device will be a key component to efficiently achieve multimode OCT operation with better signal collection efficiency and improved penetration depth for deep tissue imaging.
1. Introduction
Optical coherence tomography (OCT) has been established as a standard-of-care tool for the diagnosis of a wide spectrum of ocular diseases and a powerful tool for the diagnosis of coronary artery disease and gastrointestinal diseases [1,2,3]. However, penetration depth and resolution degradation in deep tissue are two major limitations of the technology for existing and potential clinical use [4,5]. For example, OCT is very limited in imaging the choroid, sclera, and optic nerve head due to limited penetration depth, making it unfit for examining abnormalities in these tissues [6,7,8,9]. In intravascular and endoscopic applications, the penetration limit precludes the technology for assessing deep lesions such as invasive tumors in digestive tracts and large plaques in coronary arteries [10,11,12,13]. In the single mode regime, OCT has reached shot-noise limited detection, which is the fundamental limitation on penetration given a certain maximum permissible exposure [14,15,16,17,18]. The way to improve penetration depth is to shift to the multimode regime, where signal collection efficiency can be improved by an order of magnitude by collecting backscattered light from tissue with a larger fiber core size and larger numerical aperture. Few mode fiber (FMF)-based simultaneous bright and dark field OCT imaging has demonstrated good prospects to achieve improved detection efficiency, although still suffering from crosstalk and sensitivity drop due to mode mismatch between the higher-order modes and the reference [19,20]. The key to addressing these limitations in multimode OCT is to separate OCT signals of different modes with a mode-selective device and detect them individually. More recently, a modally specific photonic lantern was used to achieve mode-dependent coupling and solved the sensitivity issue in multimode OCT at 930 nm [21]. However, 930 nm is not a commonly used center wavelength where the quantum efficiency of either Si or InGaAs-based linear cameras is low. In this paper, we present the design of a detection module with mode selectivity for the multimode OCT in 1.26–1.36 μm, typically used for OCT imaging applications. In the simulation study, a two-mode FMF is used to construct the mode-selective device. The simulation results suggest that the proposed few-mode detection module could enable multimode OCT detection, totaling approximately 1.69 times of conventional OCT signal.
2. Operating Principle of the Proposed Multimode OCT System and the Broadband Fiber Optic Mode Coupler
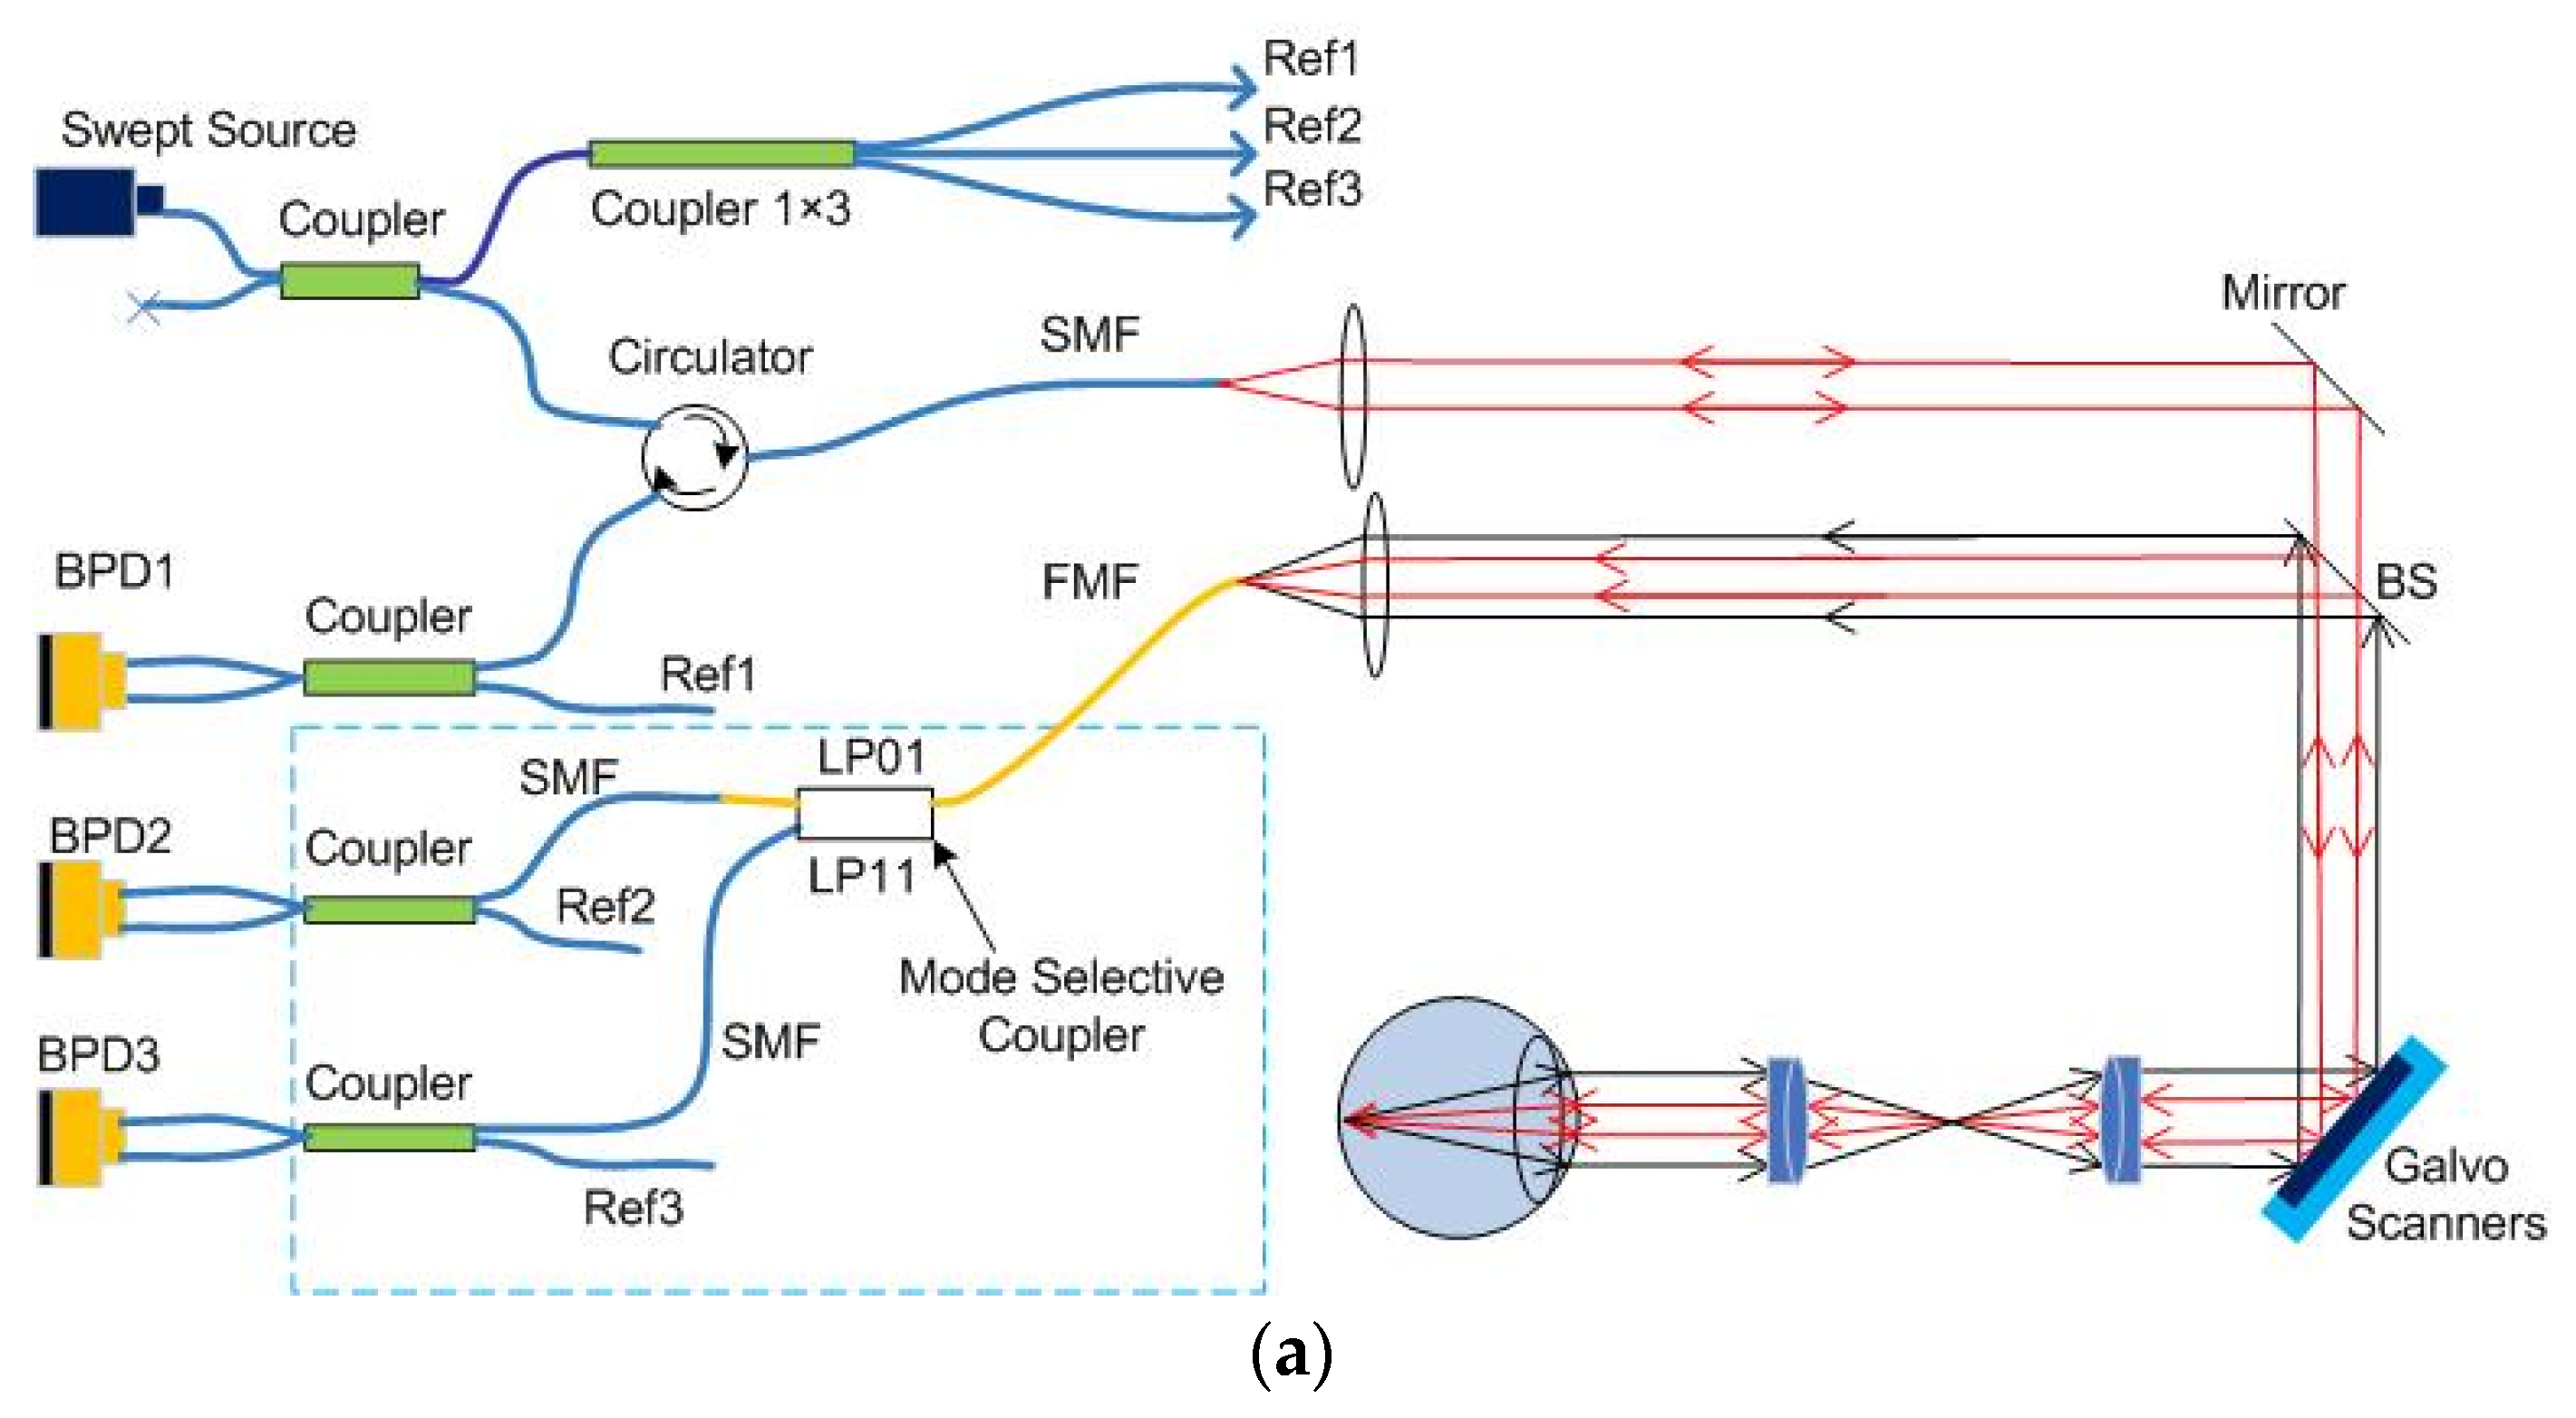
In the standard OCT operating in a single-mode regime, only backscattered (ballistic) photons coupled into the LP01 mode are detected. Different from the standard OCT, in the proposed multimode OCT setup, an FMF guides both LP01 and higher-order modes to the mode-selective coupler, which separates the signals of multiple modes with high coupling efficiency. For simplicity, we chose a two-mode FMF in the study, which only supports LP01 and LP11 modes.
In the proposed multimode OCT setup, a portion of the back-reflected or backscattered light from the sample will be picked up by the beam splitter (BS) and coupled into FMF. This portion of the signal is coupled to the FMF in both LP01 and LP11 modes, which are shown as the red rays for LP01 mode and black rays for LP11 mode reflected by the BS in Figure 1a. Compared with the standard single-mode detection, there is a significant portion of the signal in the LP11 mode carrying useful information that can be detected in the proposed multimode OCT system. The rest of the sample light, i.e., the backscattered light, is directed to pass the BS and coupled back to the same SMF that delivers the excitation light, as shown in the red rays in Figure 1a.
The detection of signals of both LP01 and LP11 modes will result in better signal collection efficiency compared with the standard single-mode OCT, where only the signal of LP01 mode is detected. Since the OCT noise is dominated by the shot noise of the reference light, i.e., short noise limited, the sensitivity (signal-to-noise ratio with a perfect reflector) is solely dependent on the signal detected [18]. On the other hand, the penetration depth of OCT is proportional to the sensitivity.
The reference light is split into three beams, and each of the reference beams will independently interfere with the signals guided in the excitation SMF, the LP01 mode of FMF, and the LP11 mode of FMF, respectively. The three interference signals are separately detected by the use of three balanced detectors.
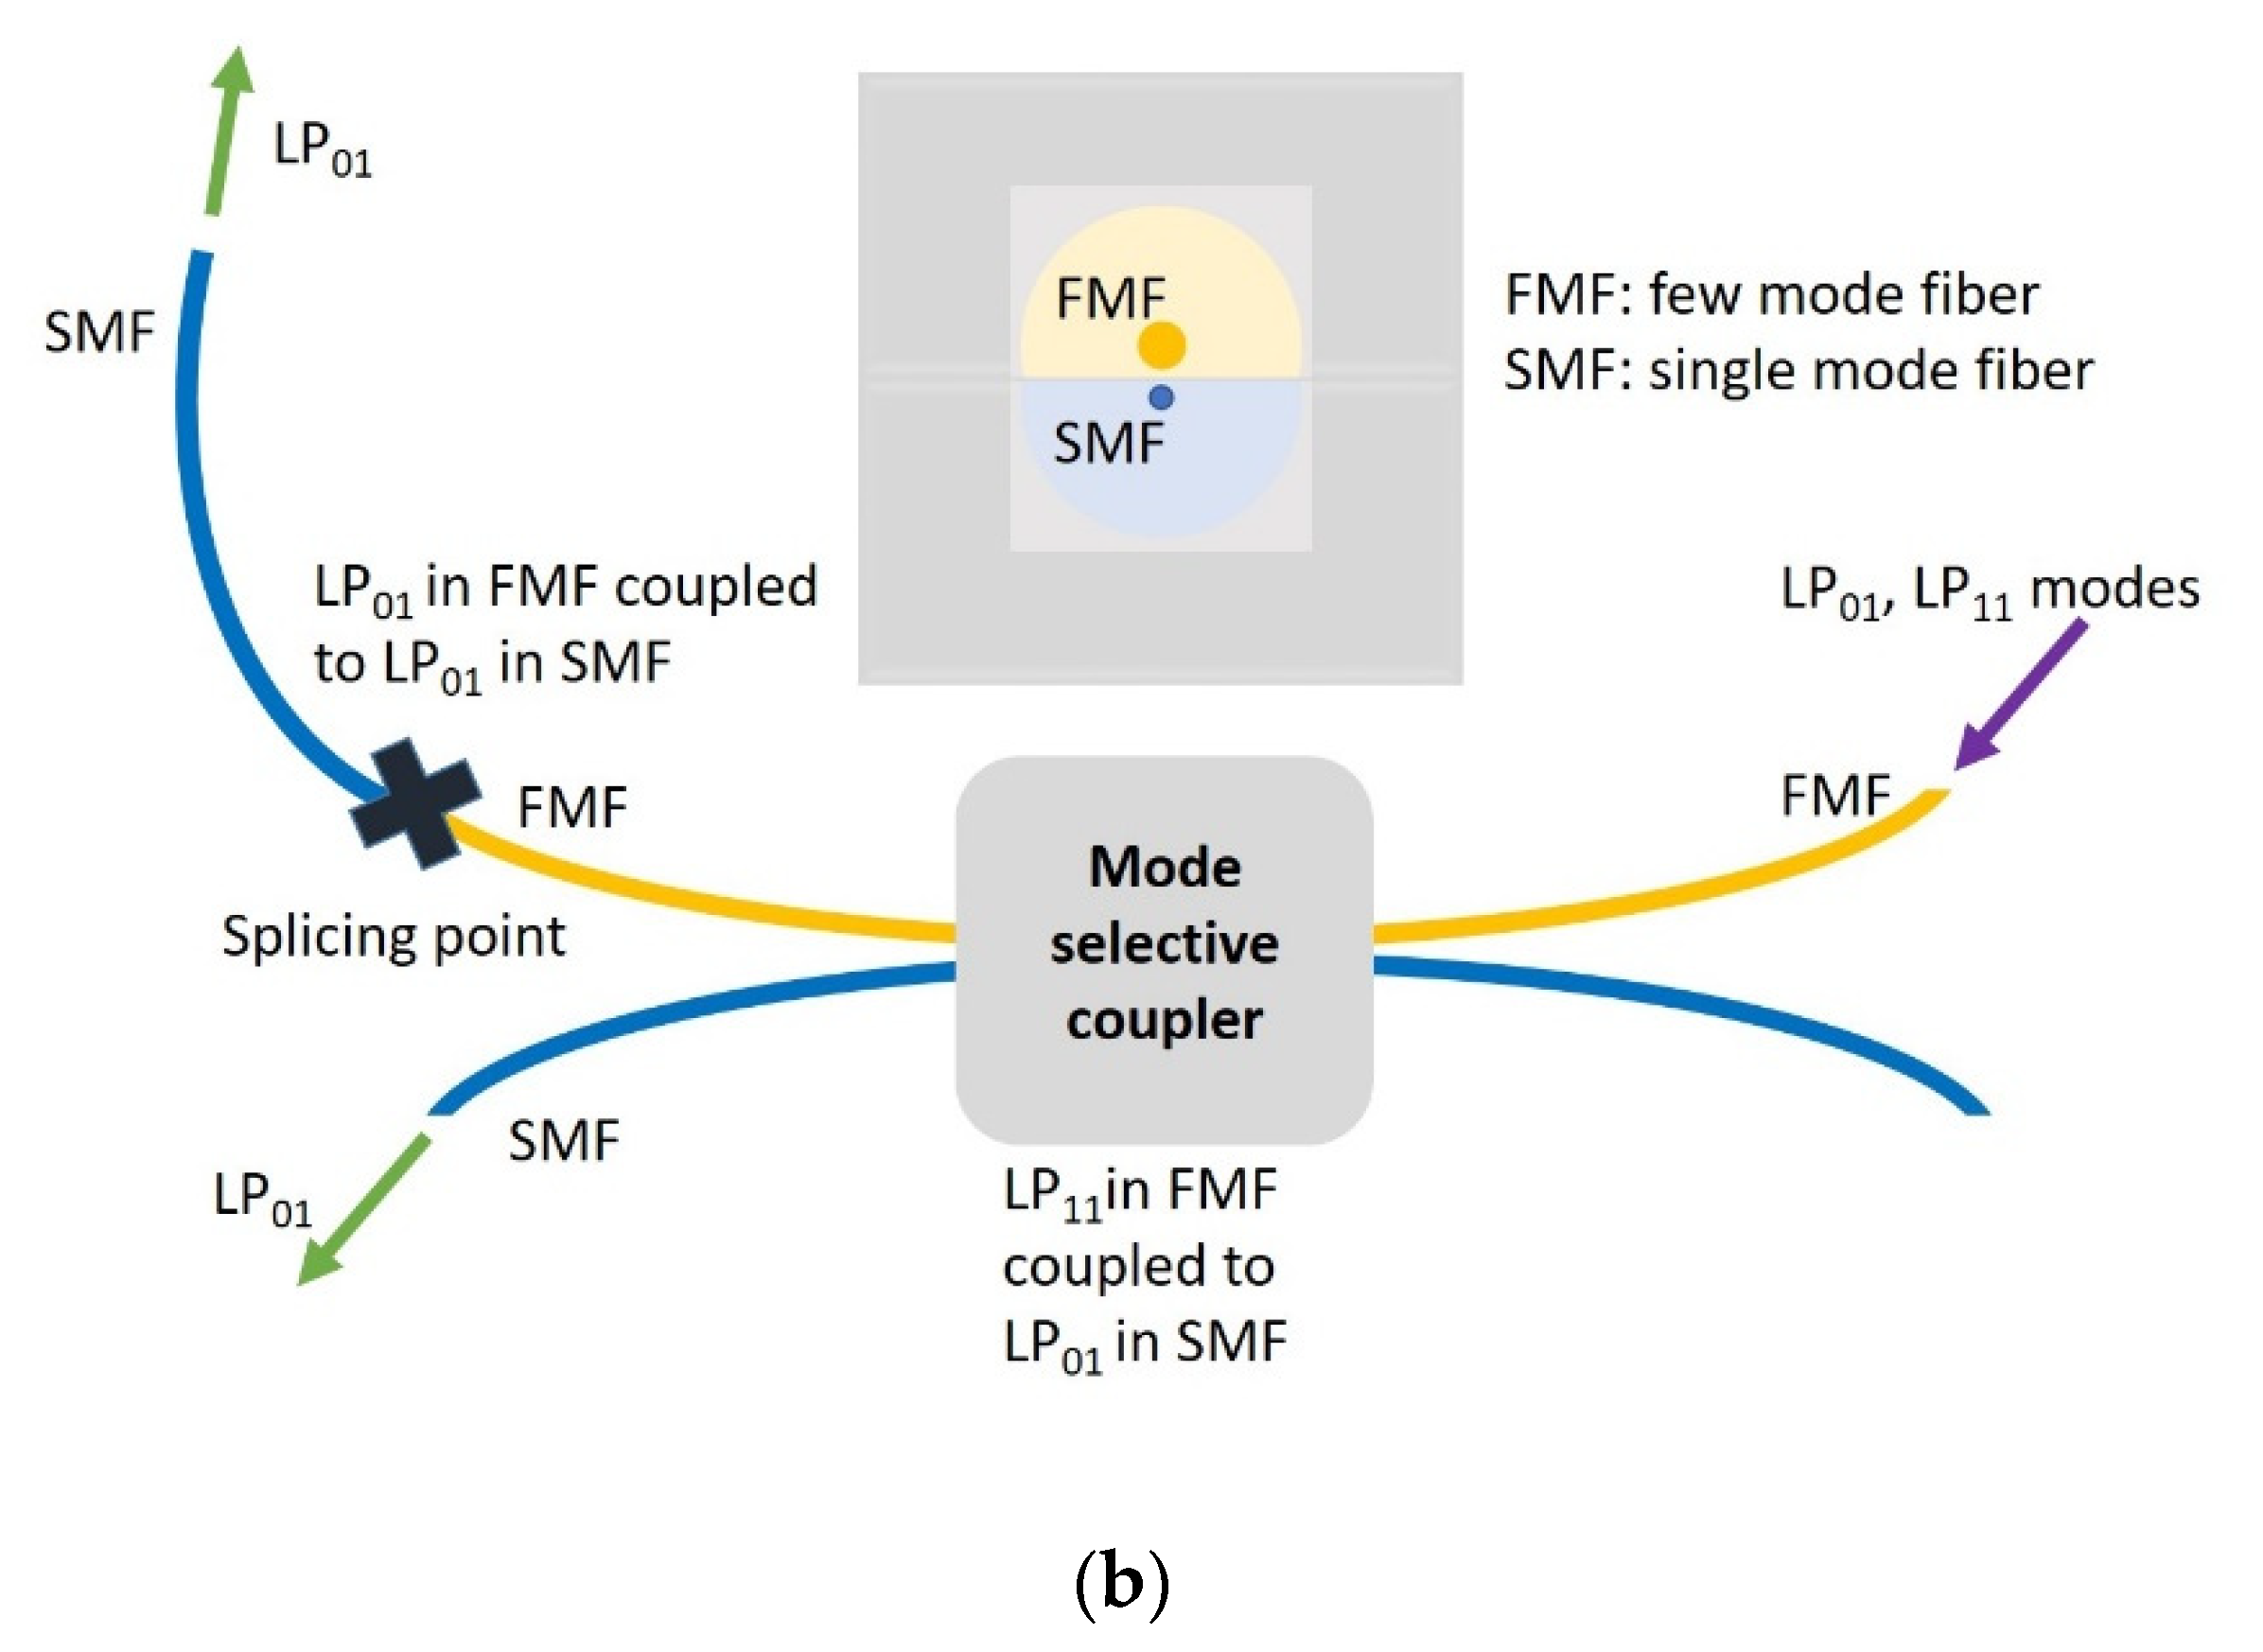
FMF has been used extensively in communication applications to augment the transmission capacity and for selective mode couplers [22,23,24,25,26]. For example, an FMF-based mode-selective coupler was developed to achieve mode division multiplexing from 1515–1590 nm. The fundamental mode of the SMF LP01 mode is selectively coupled to higher-order modes in FMF for transmission [26]. There are two parts of detection from mode coupling in the proposed FMF detection module, as shown in Figure 1b. Firstly, a tapered FMF is used to phase match its LP11 mode to the LP01 mode in SMF. In this study, the FMF only supports two modes for simplicity. If FMF supports more than one higher-order mode, each higher-order mode needs to be selectively phase matched to the LP01 mode in SMF for selective mode coupling. Both FMF and SMF are side polished to reduce the core-to-core separation to achieve effective mode coupling between “the LP11 in FMF coupled to LP01 in SMF” occurring in the mode-selective coupler; the corresponding output port (lower left SMF in Figure 1b) is guiding LP01 mode in SMF to interfere with reference. Secondly, at the other output port of the coupler module (upper left FMF in Figure 1b), the LP01 mode in FMF is coupled to LP01 mode in SMF through butt coupling or fusion splicing [27]. Then the LP01 mode in SMF will interfere with another reference. For desirable OCT imaging applications, the detection module is targeted to achieve broadband selective mode coupling in the O-band (1.26–1.36 μm).
3. Results and Discussion
In this section, the phase matching conditions and the selective mode coupling between the FMF and SMF in the proposed selective mode coupler structure is presented. Firstly, the side coupling between the tapered FMF LP11 mode and SMF LP01 mode is modeled by two parallel waveguides of FMF and SMF with the simulation parameters as shown in Table 1, including the core diameters, the refractive index of the cladding, which is calculated based on Sellmeier equation for fused silica to account for material dispersion, numerical aperture (NA) which can be used to calculate the refractive index of the core, the tapering ratio of the FMF, SMF core to FMF core separation, wavelength band, and coupler length. The Sellmeier equation used in this work is [28], where is the wavelength with the unit of μm, and is the refractive index of the cladding. The refractive index of the core is calculated by . In this study, a commercial software (BeamProp®—RSOFT Design®) was used to model the beam propagation and mode coupling in the optical coupler device.
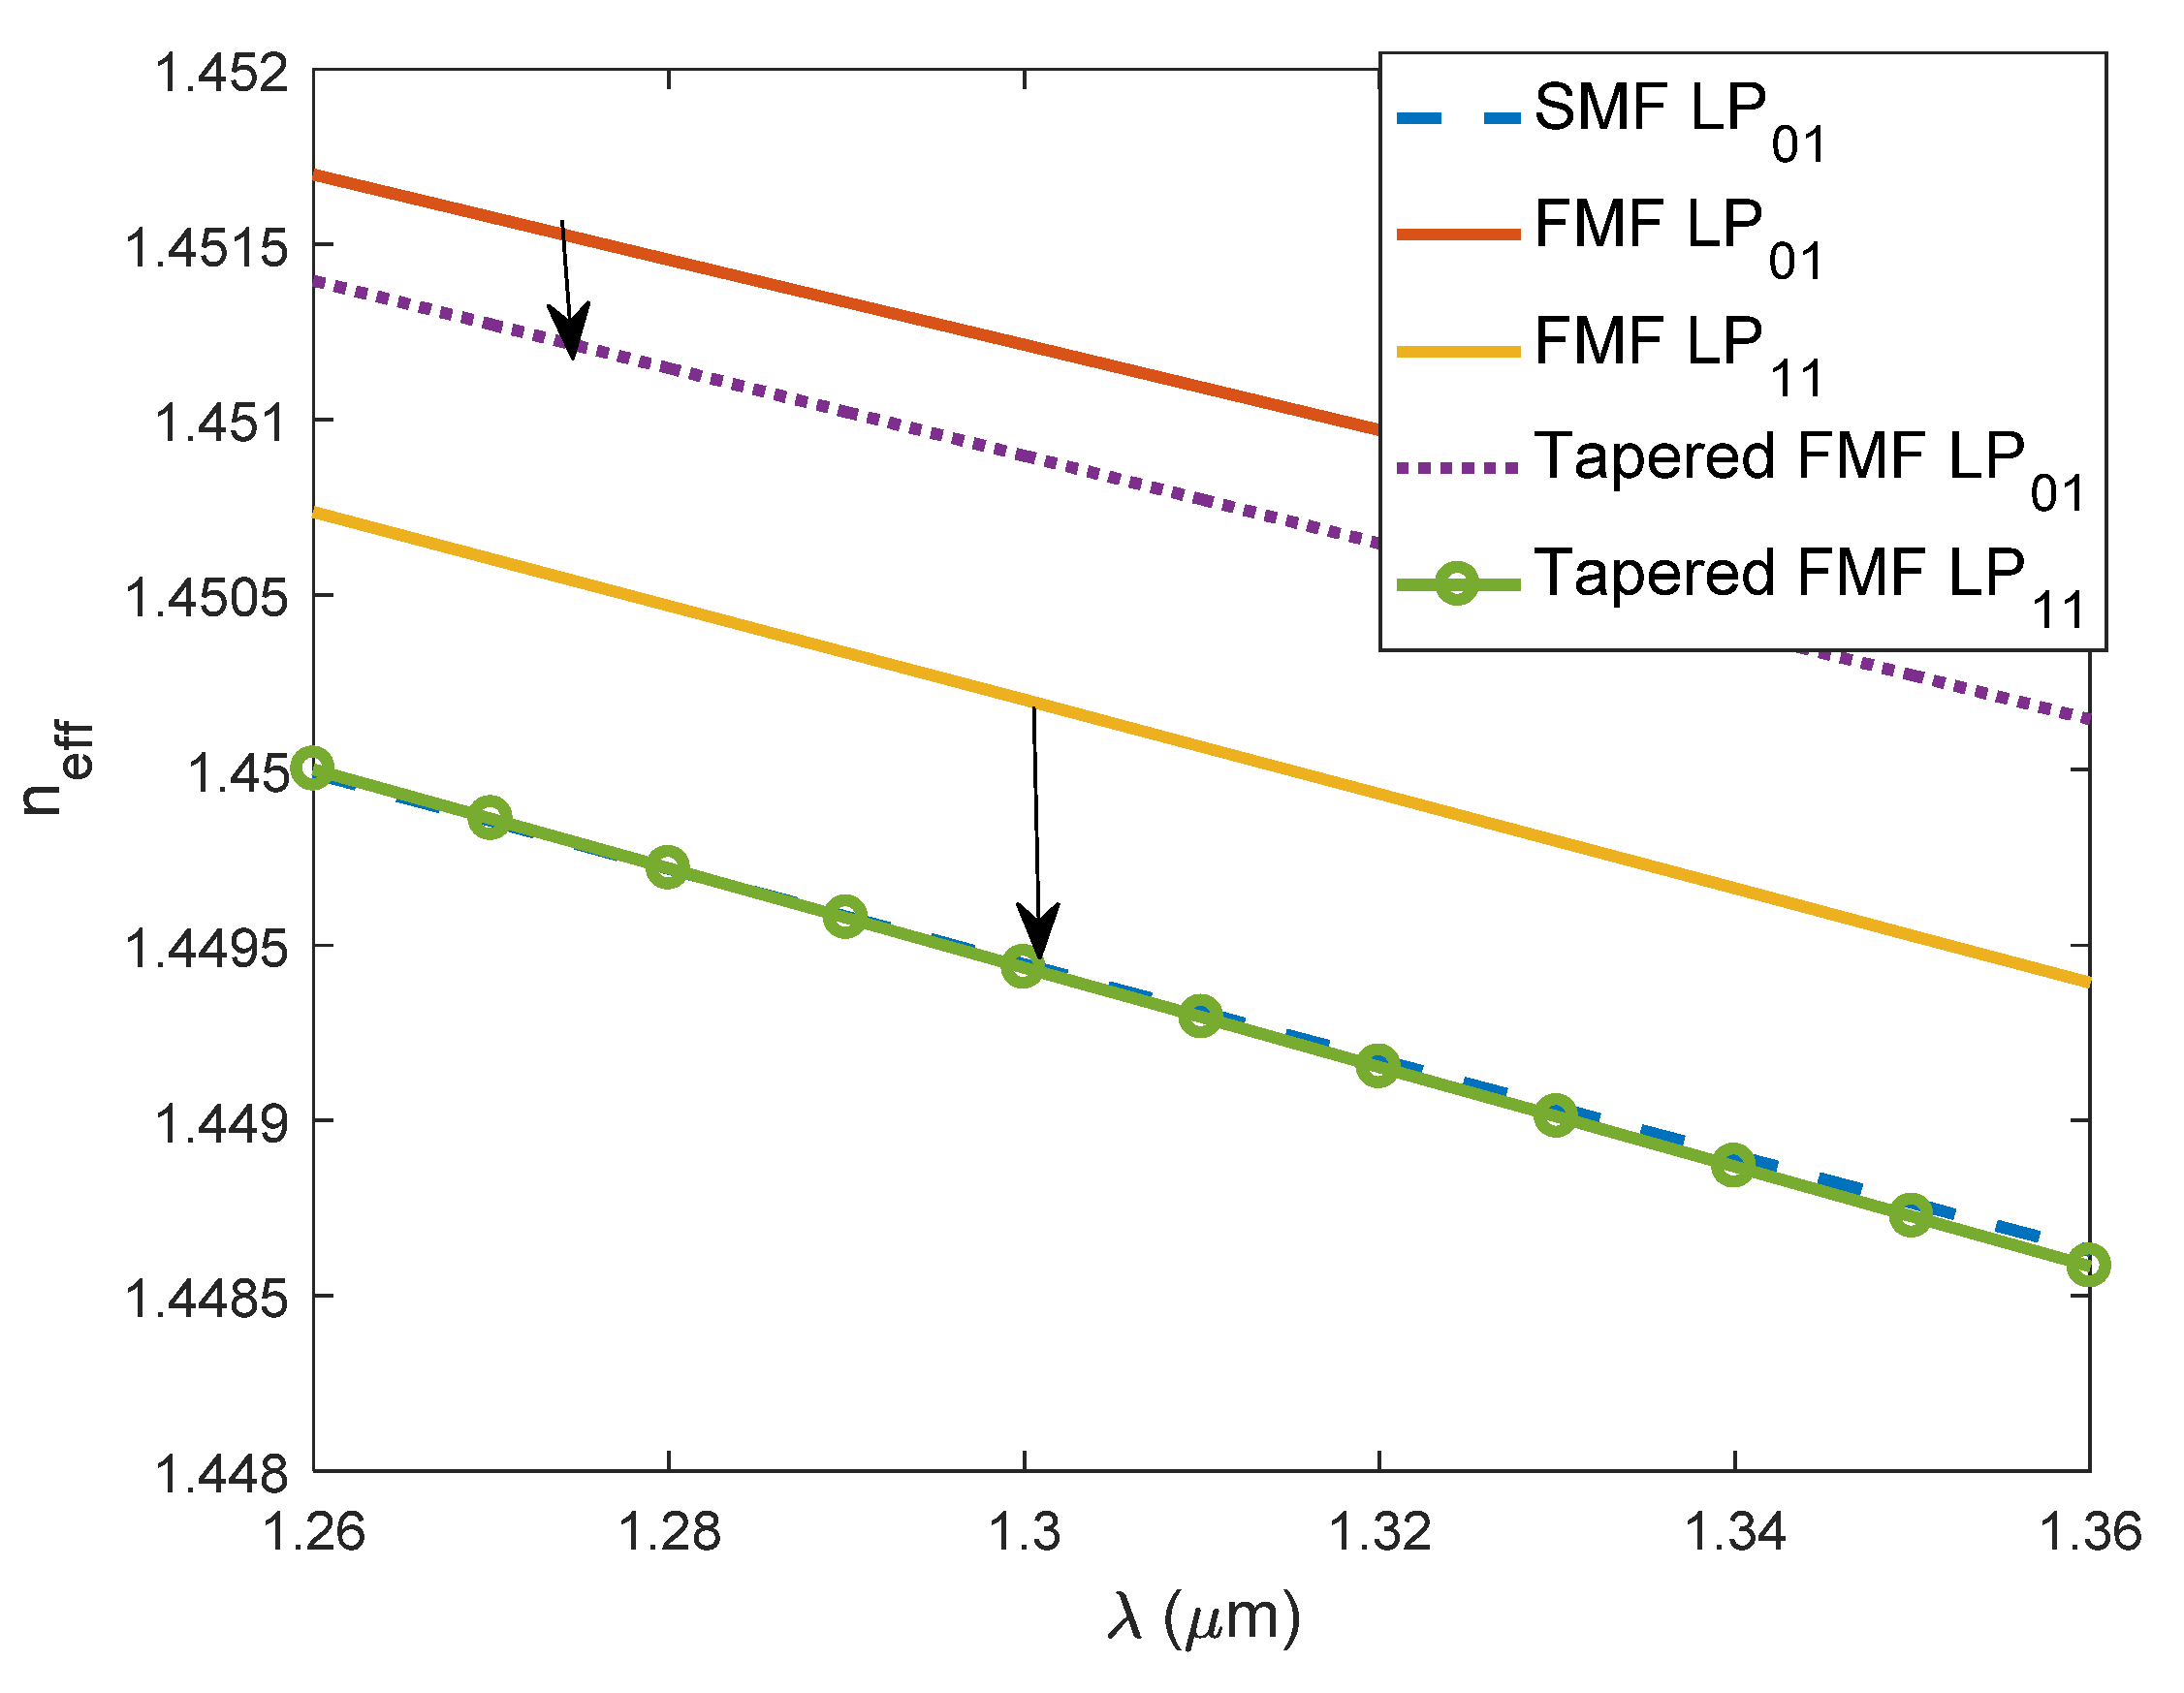
The effective mode indices in FMF and SMF are shown in Figure 2. The mode curves in untapered FMF are depicted by red and yellow curves, which are higher than the LP01 mode index curve of the SMF. Tapered FMF has lower mode indices compared with untapered FMF. The phase match condition is satisfied when the LP01 mode curve in SMF and the LP11 mode curve in tapered FMF are intersected in the O-band, as depicted by the blue curve and green circles curve, respectively. The tapered FMF has a core diameter of 15.1 μm
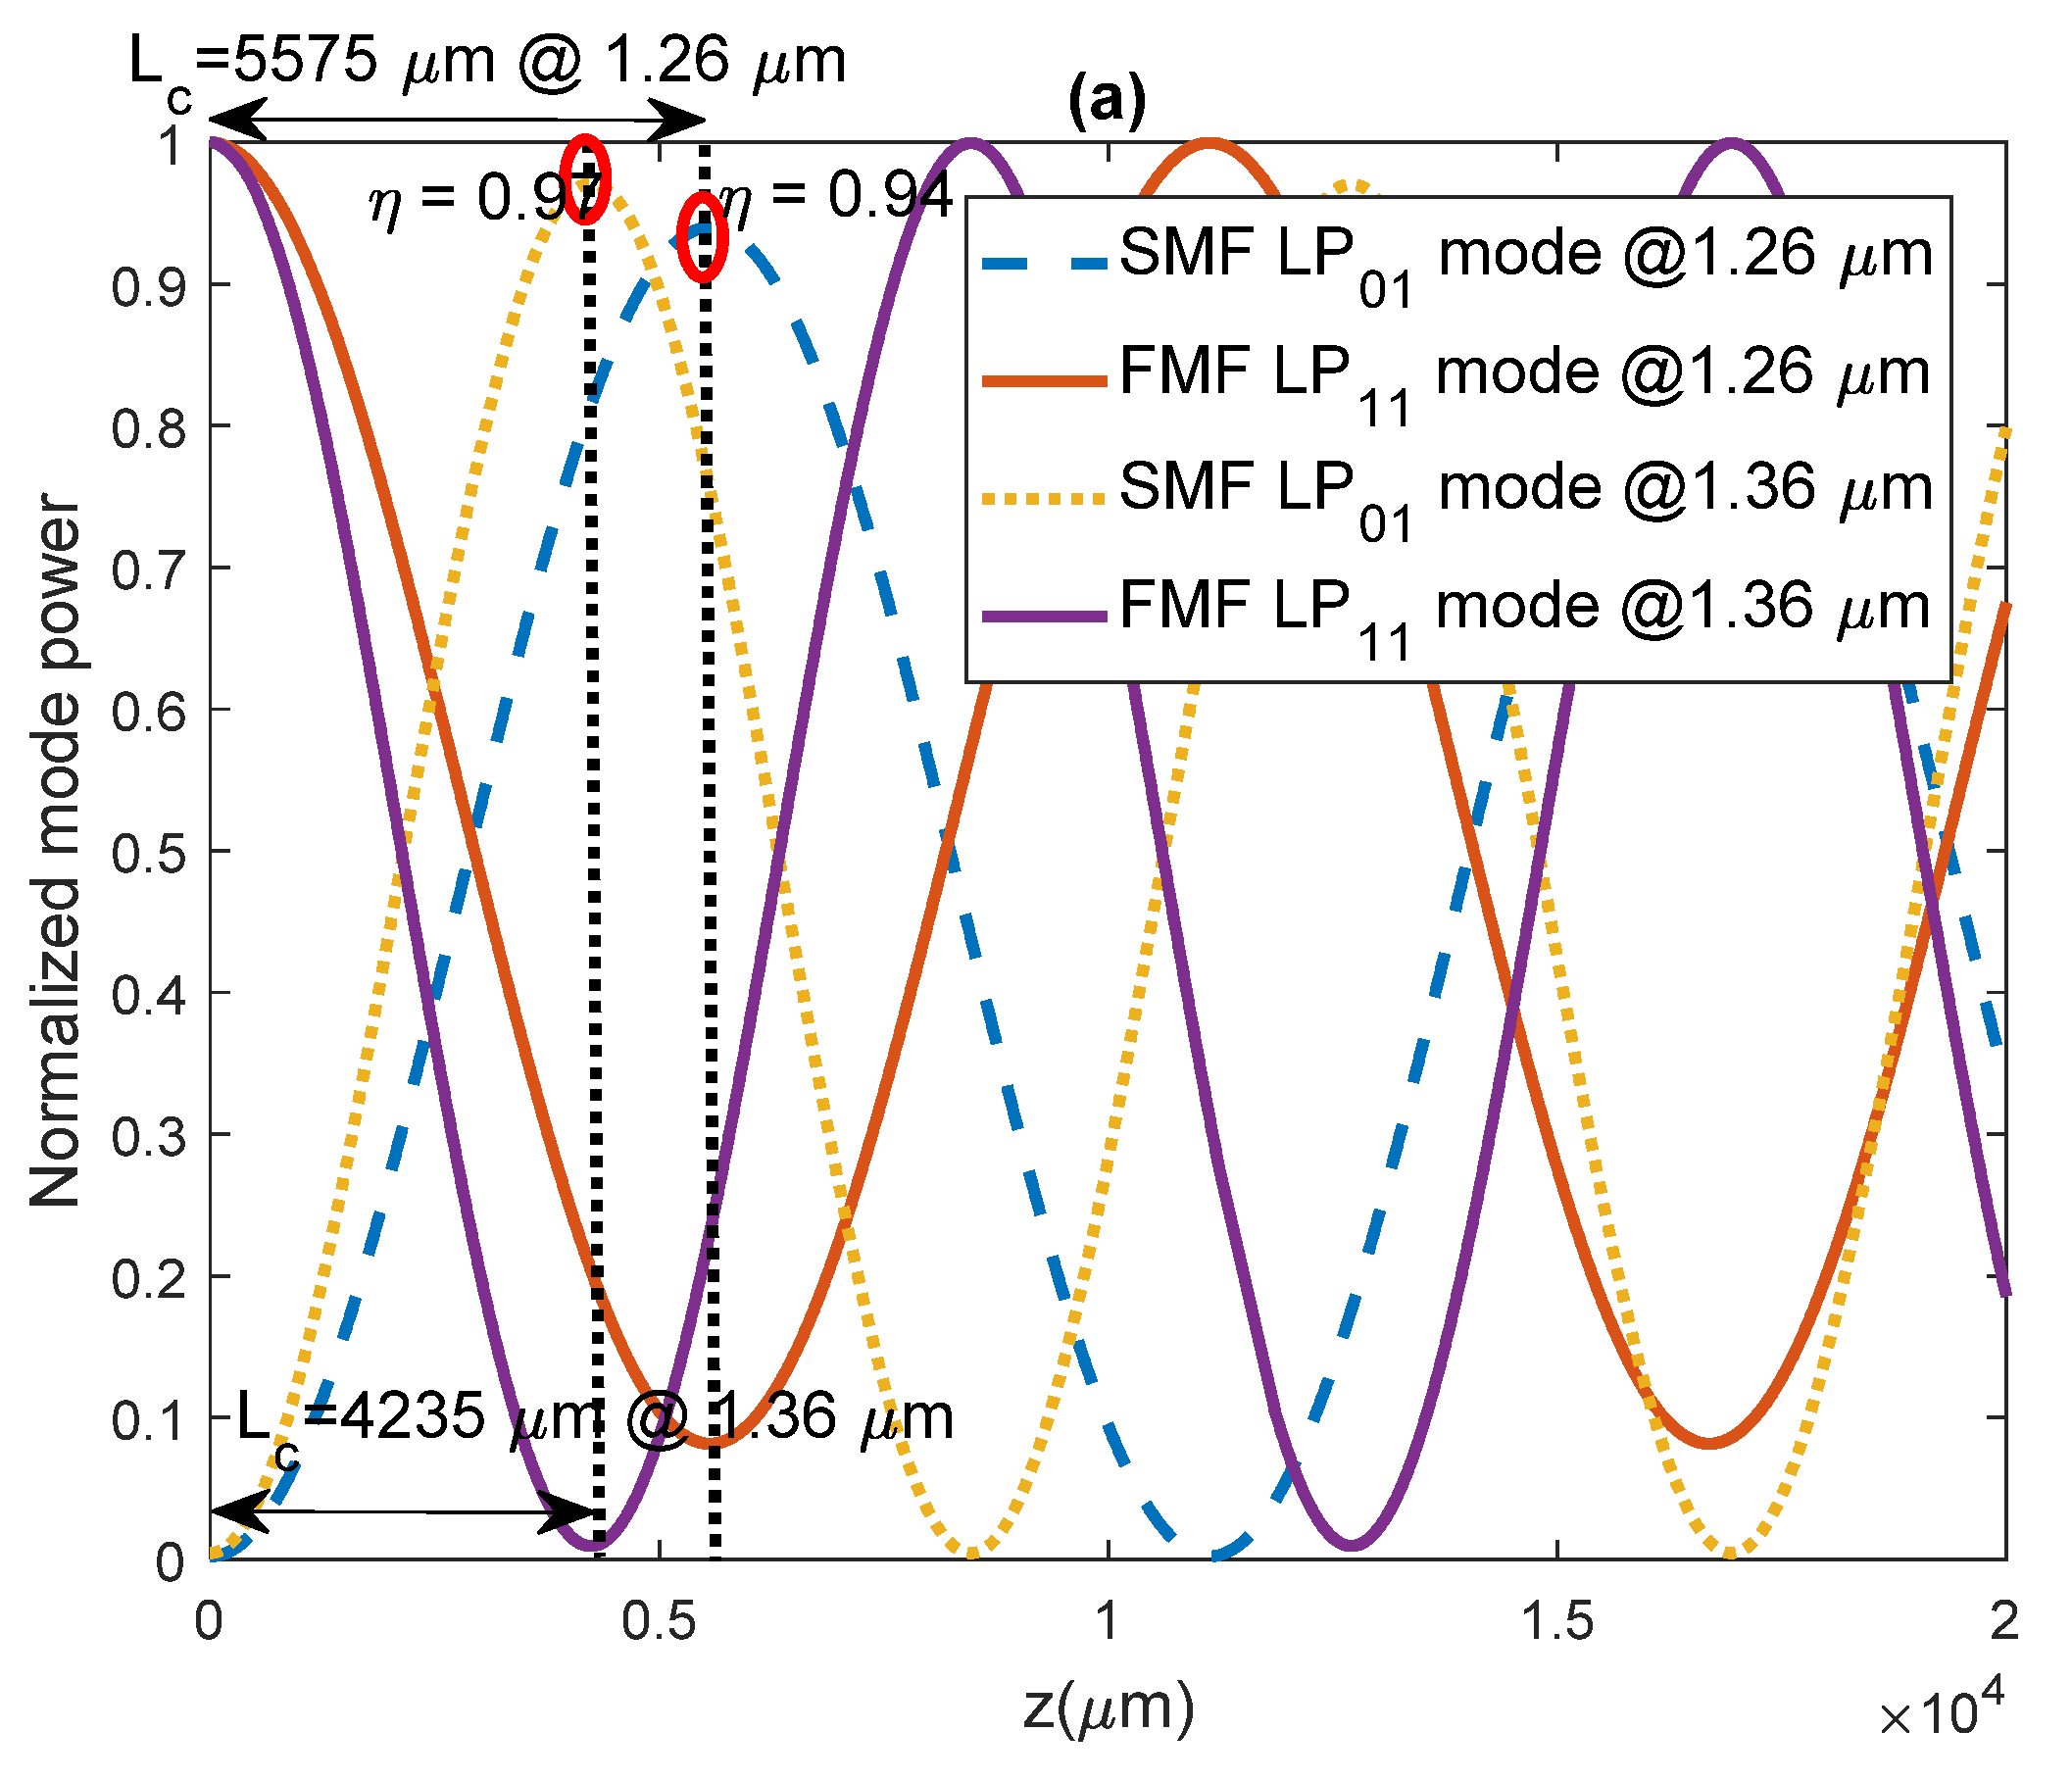
The mode coupling between the two parallel coupled waveguides can be analyzed by coupled mode theory [29]. The SMF core to FMF core distance is a critical parameter for the mode coupling in two parallel coupled waveguides as the coupling coefficient is inversely dependent on it [30,31]. In addition, the coupling length is dependent on the coupling coefficient. Thus, it is also dependent on the core-to-core separation. The coupling ratio η in this dissimilar fiber coupler determines how much power is transferred from one core to the other, so it is essential to analyze the wavelength-dependent coupling ratio to ensure sufficient coupling for all wavelengths in the chosen band. The coupling between the LP11 mode in tapered FMF and the LP01 mode in SMF is analyzed by the beam propagation method. The normalized launch field is LP11 mode in the FMF core, and the mode power in both the FMF core and the SMF core is monitored along the propagation length. As shown in Figure 3a, the normalized mode power of LP11 mode in the FMF core (solid curves) is coupled to LP01 mode in SMF (dashed and dotted curves) and vice versa along the entire length of the coupler. The core-to-core separation is 4 μm in this simulated structure. The maximum coupling occurs at the coupling length , corresponding to the maximum achievable coupling ratio η or the normalized coupled mode power of LP01 mode in SMF. The mode coupling curves are plotted at two wavelengths of 1.26 and 1.36 μm, with different and η values of 5575 μm, 0.94 and 8210 μm, 0.97, respectively. Figure 3b shows the mode coupling curves at wavelength of 1.26 μm for coupler structures with core-to-core separation d of 4 μm and 4.9 μm. Clearly, when d is larger, both cores are further apart, leading to a weaker coupling thus longer coupling length of 8210 μm associated with η of 0.88.
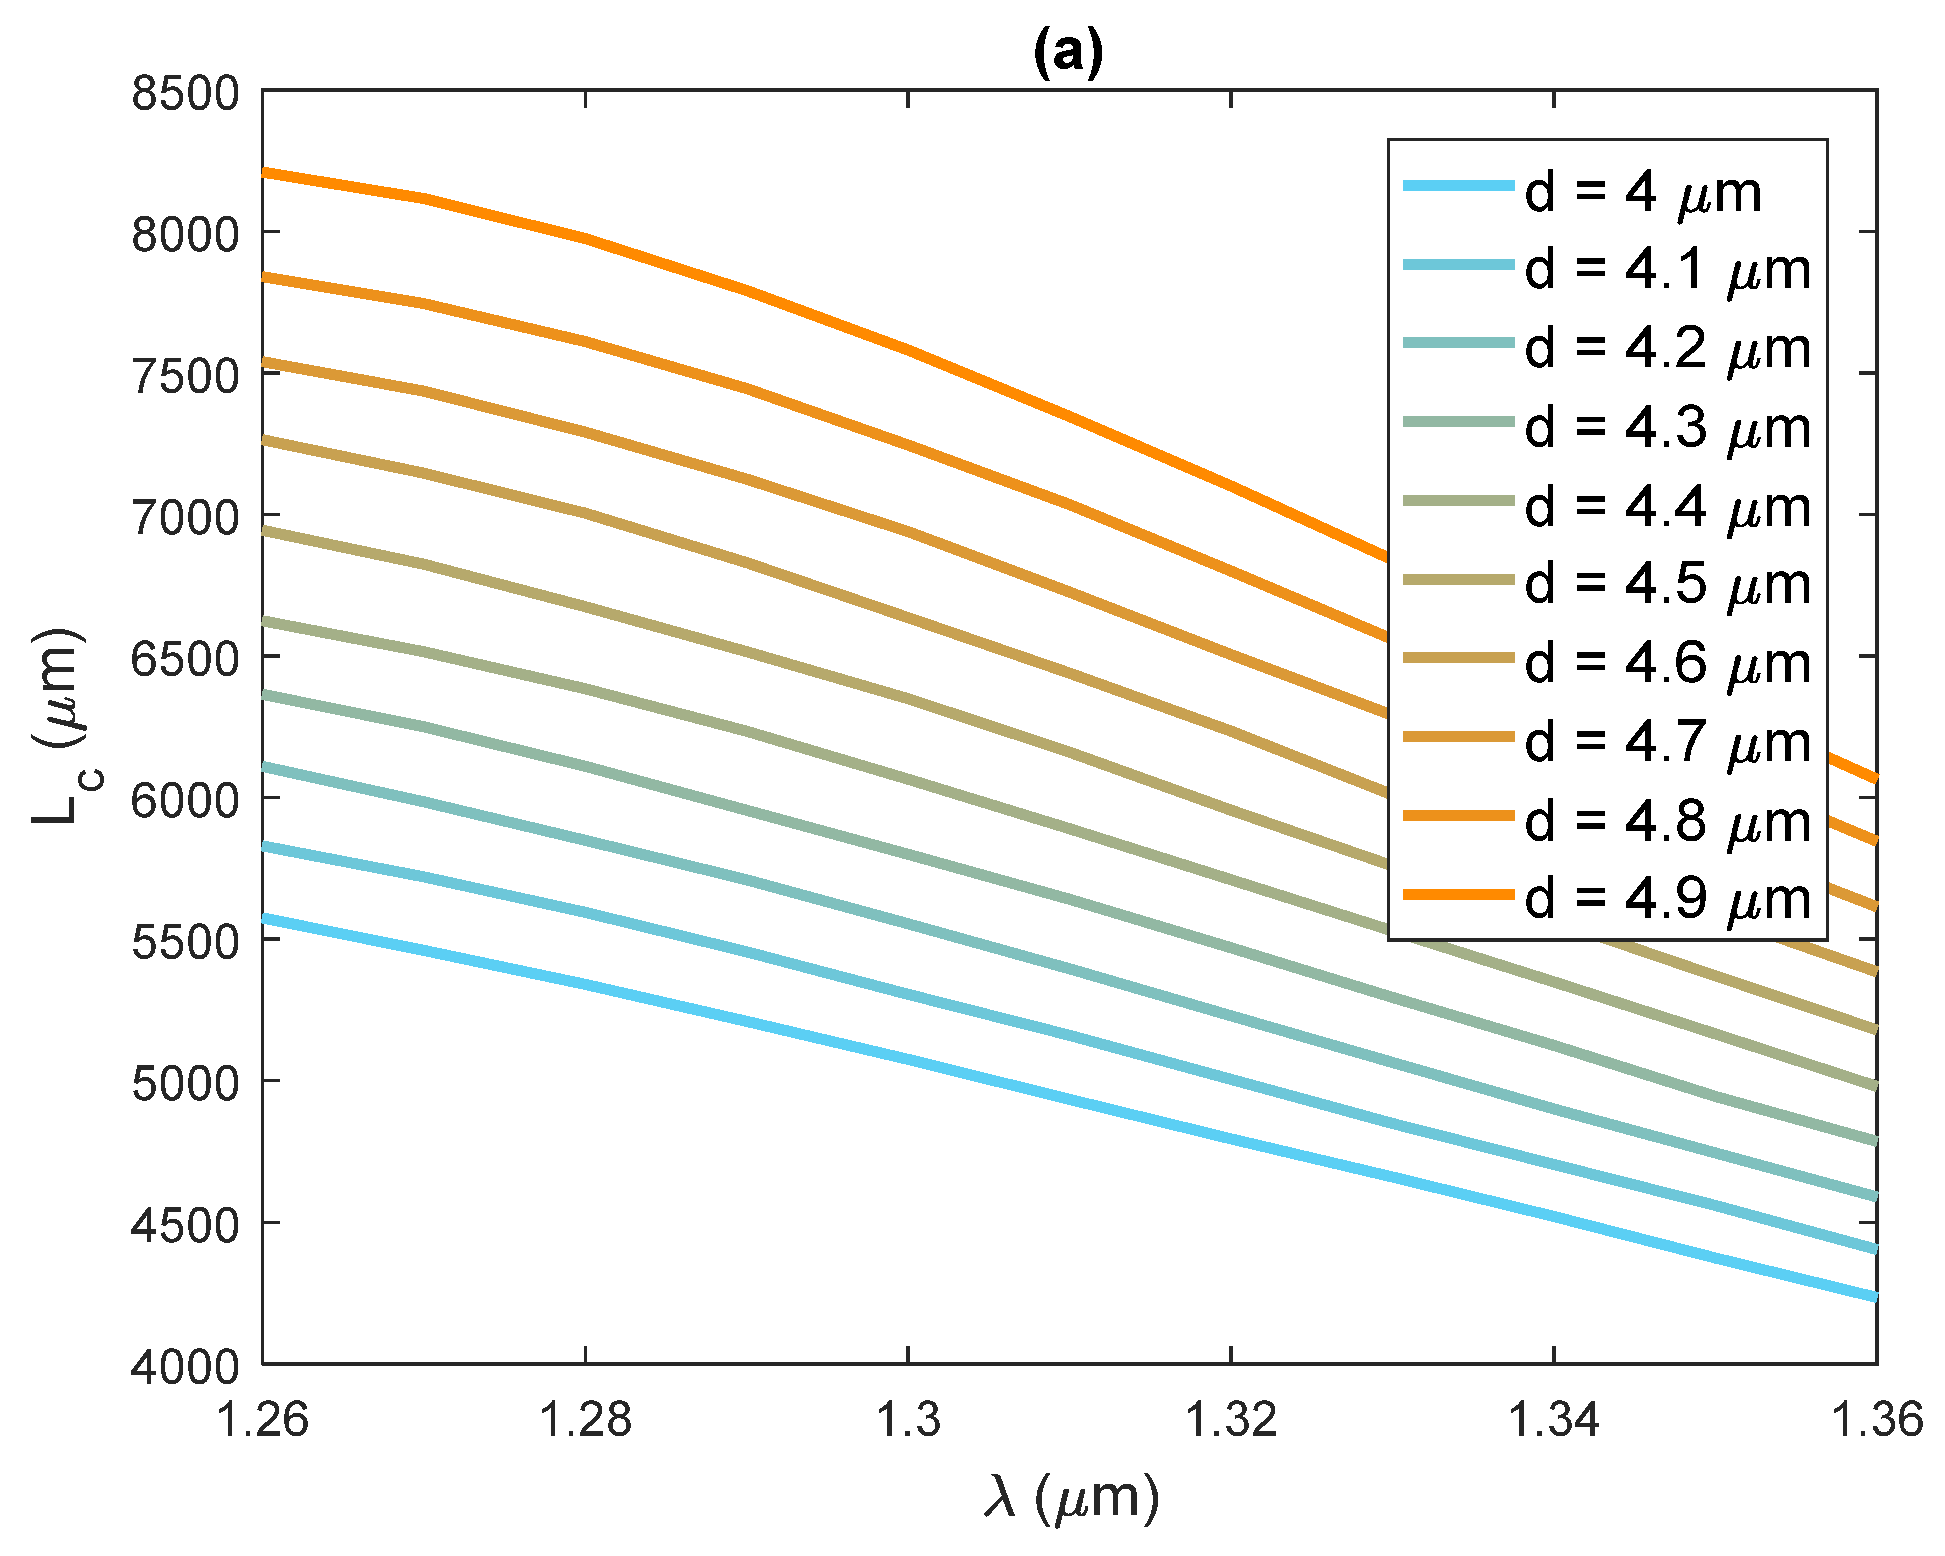
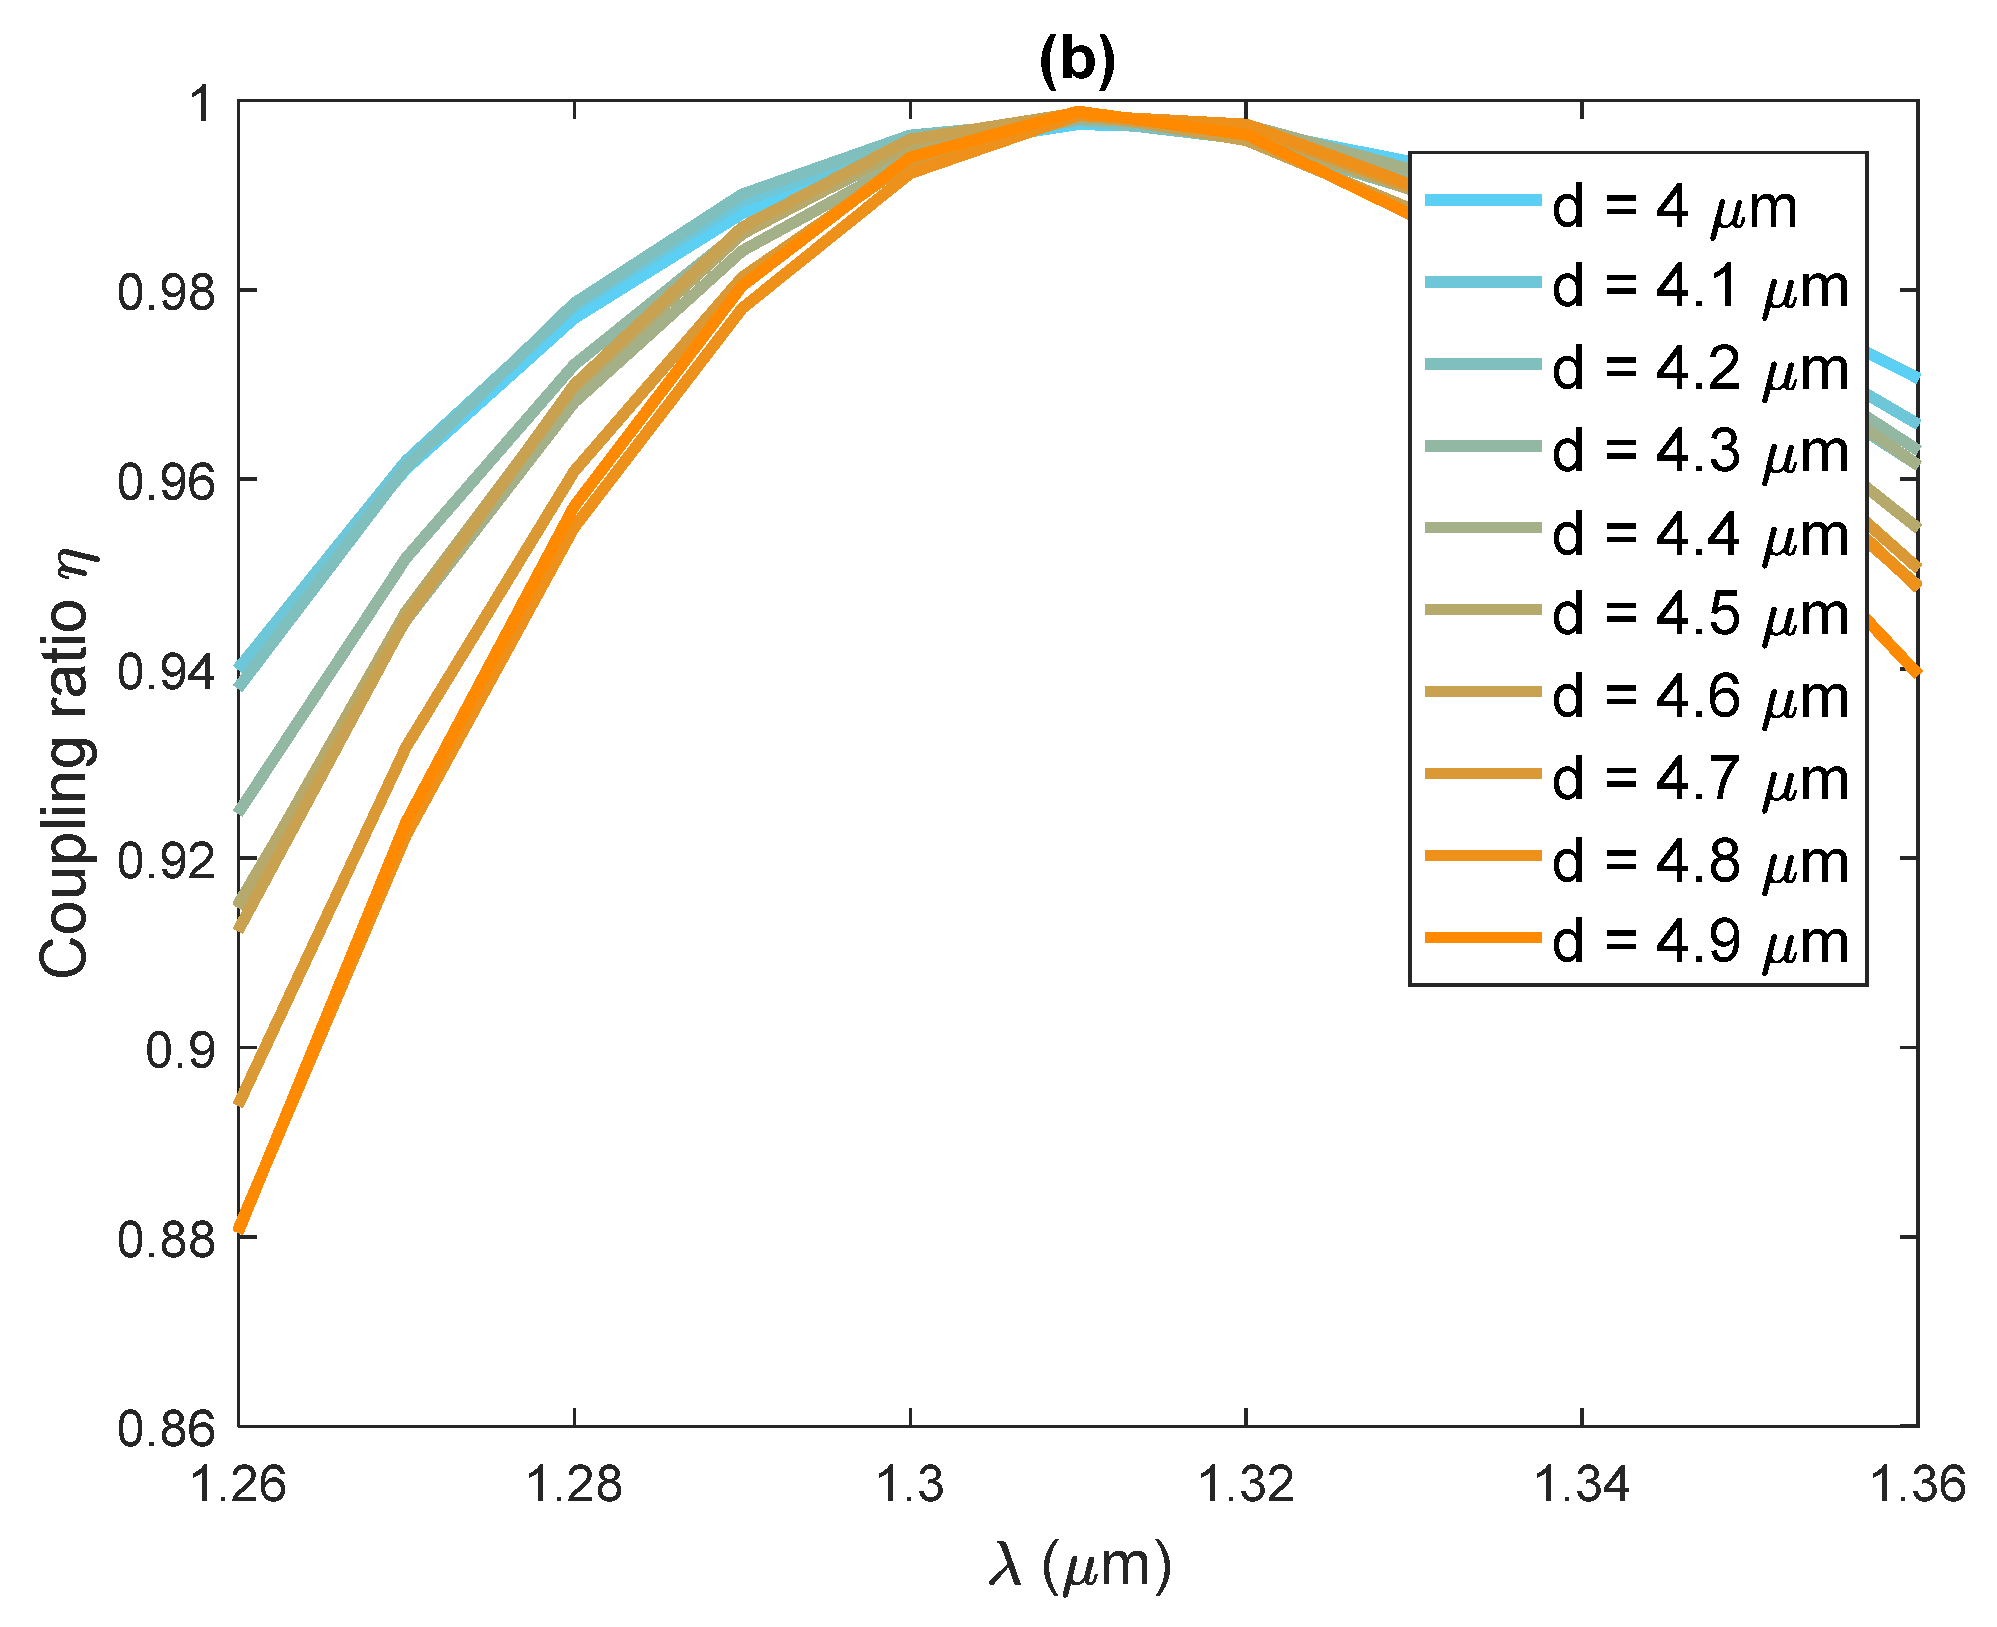
The coupling length , and the maximum coupling ratio η, present dependence on the core-to-core separation d and vary in different wavelengths as shown in Figure 4a,b, respectively. In general, coupler structures with larger d values have weaker coupling coefficients, thus, are associated with longer coupling length for maximum power transfer [29]. As shown in Figure 4b, all the maximum power transfers occur at 1.31 μm, as the phase matching condition is satisfied at this wavelength.
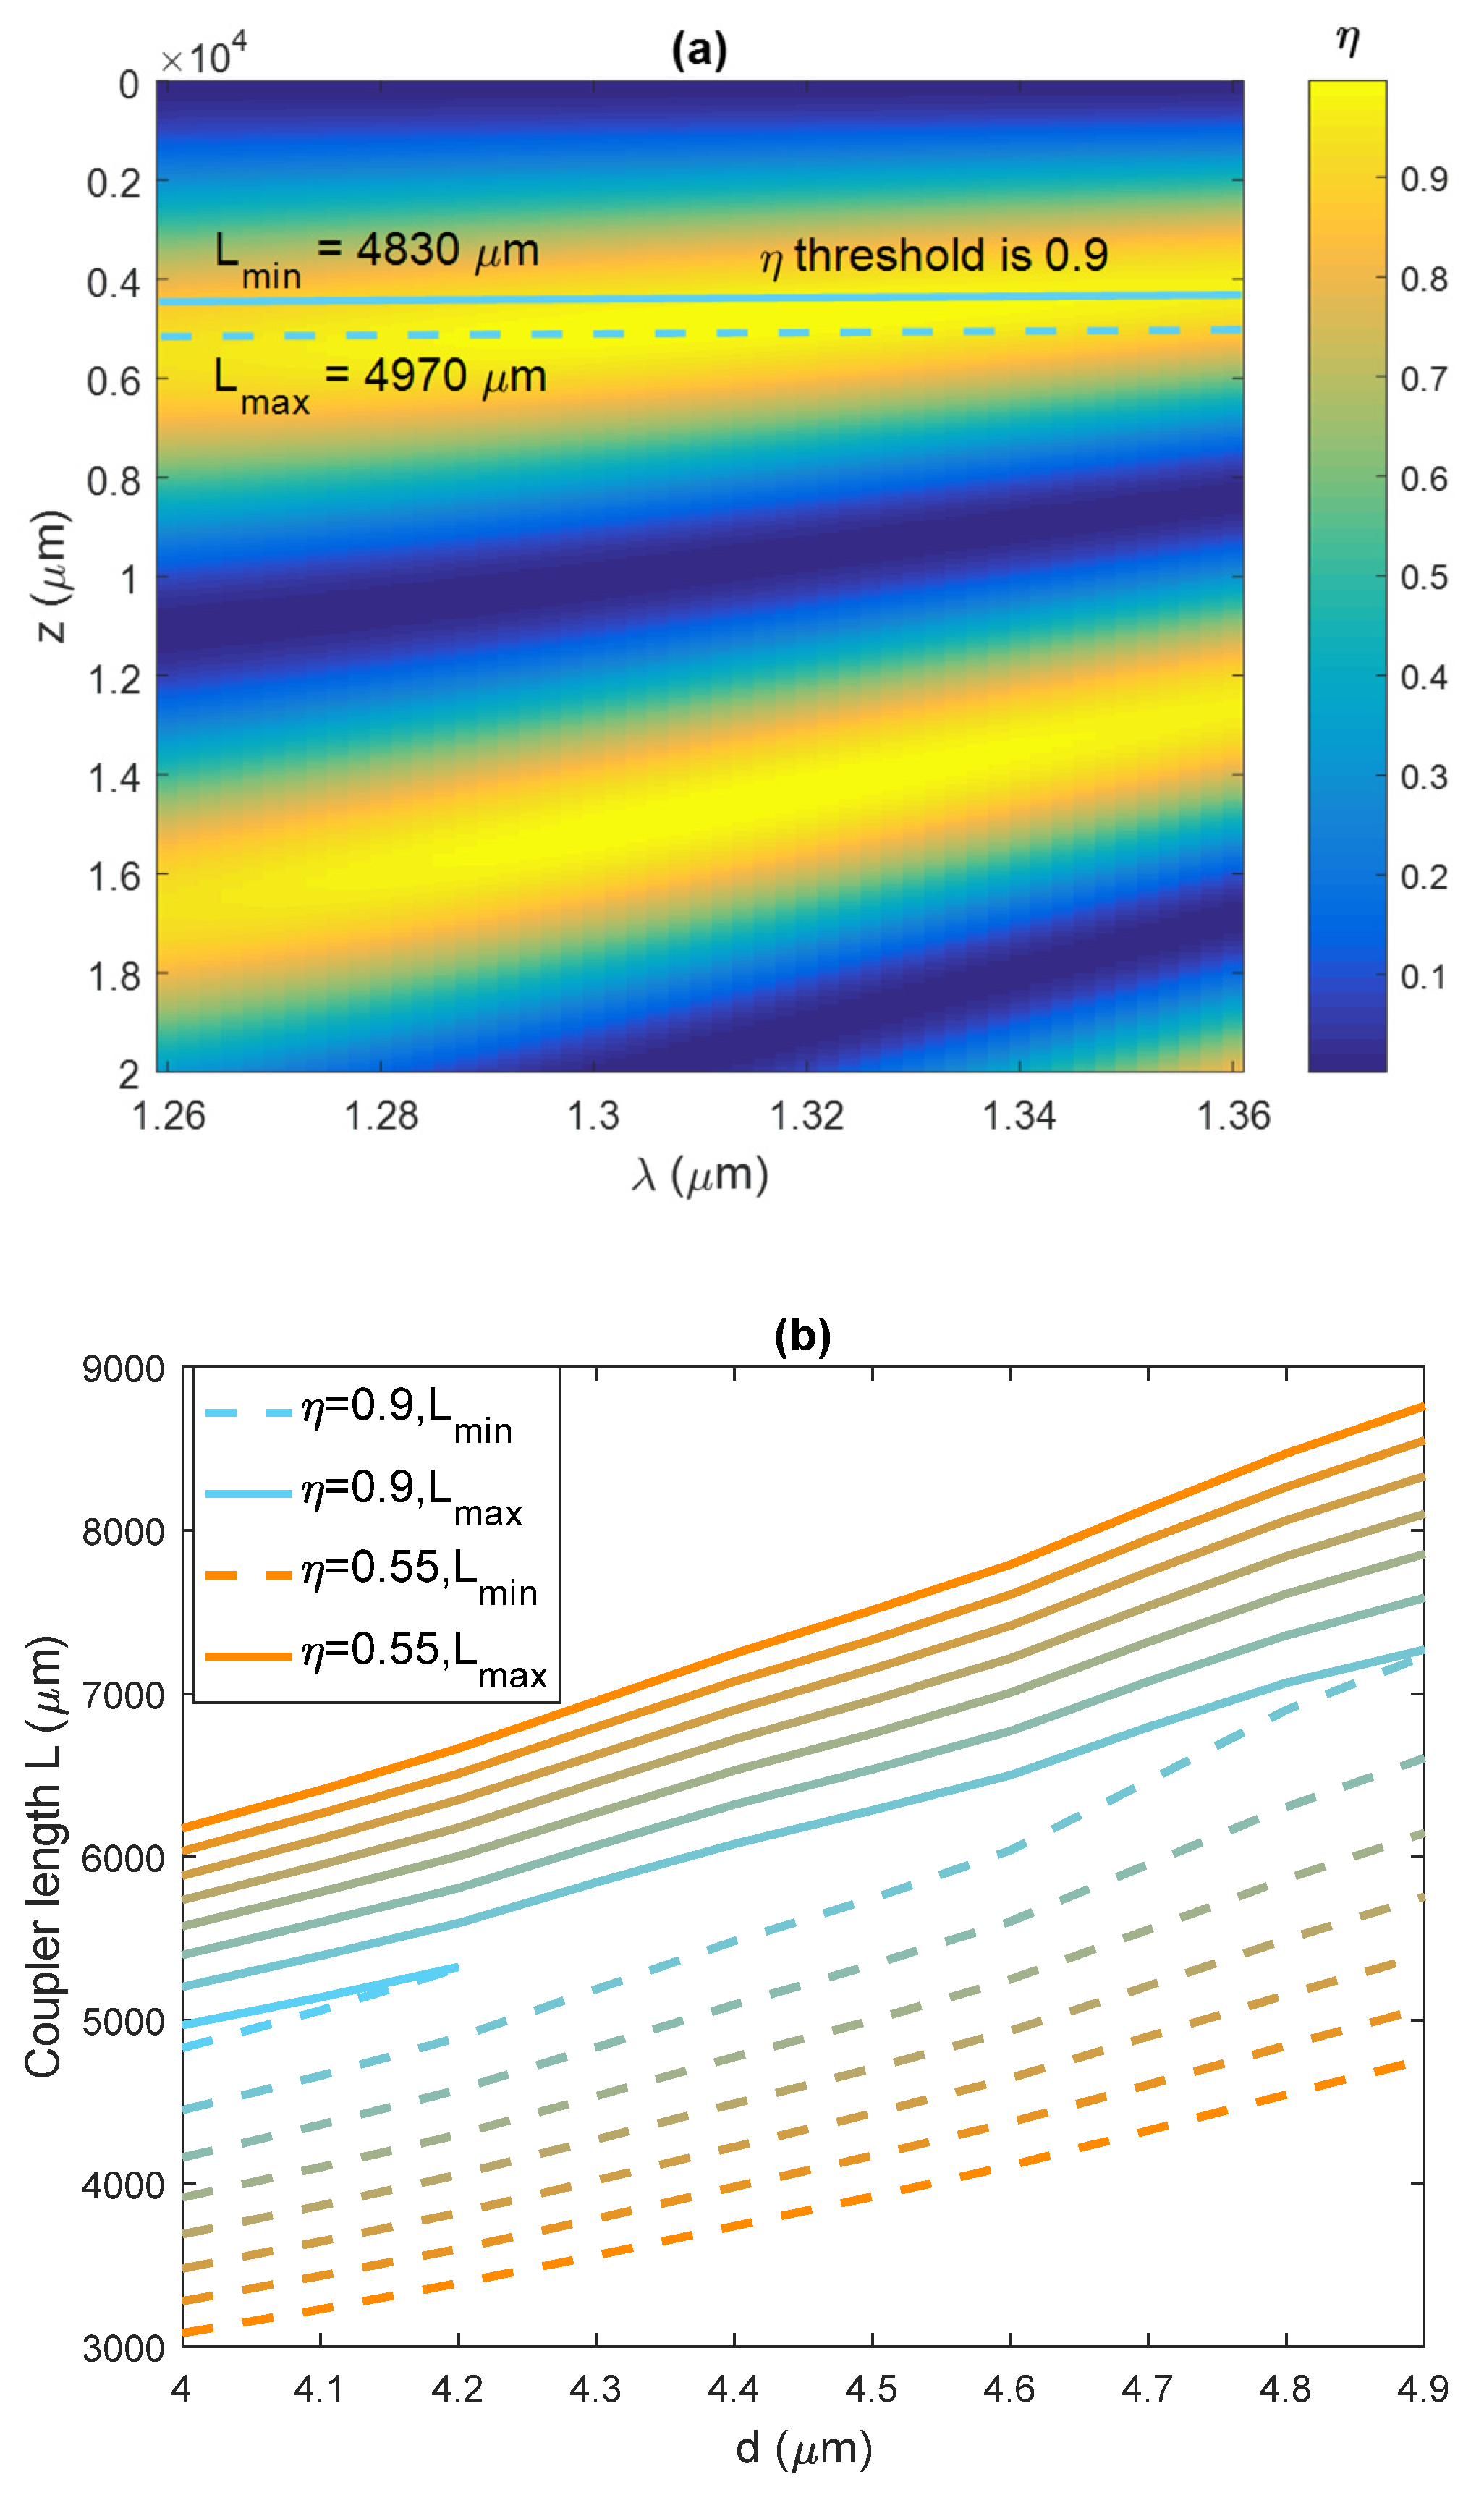
The coupler length L is another critical design parameter shown in the colormap of the broadband coupling ratio η in Figure 5a. The simulated coupler structure has core-to-core separation d = 4 μm. The two solid lines mark the permissible coupler length range to ensure the chosen coupler structure achieves a broadband coupling ratio above a threshold value of 0.9. For other selected threshold values of the broadband coupling ratio varying from 0.9 to 0.55 with an interval of 0.05 and varying core-to-core separation from 4 to 4.9 μm, the allowed coupler length range is plotted in Figure 5b. As the threshold value increases, the range of the coupler length becomes narrower. For a high coupling ratio threshold value of 0.9, the selection of core-to-core diameter values is critical as the maximum and minimum L curves close at d around d = 4.2 μm. In other words, coupler structures with d values above 4.2 μm would not provide a broadband coupling ratio at 0.9 regardless of the coupler length.
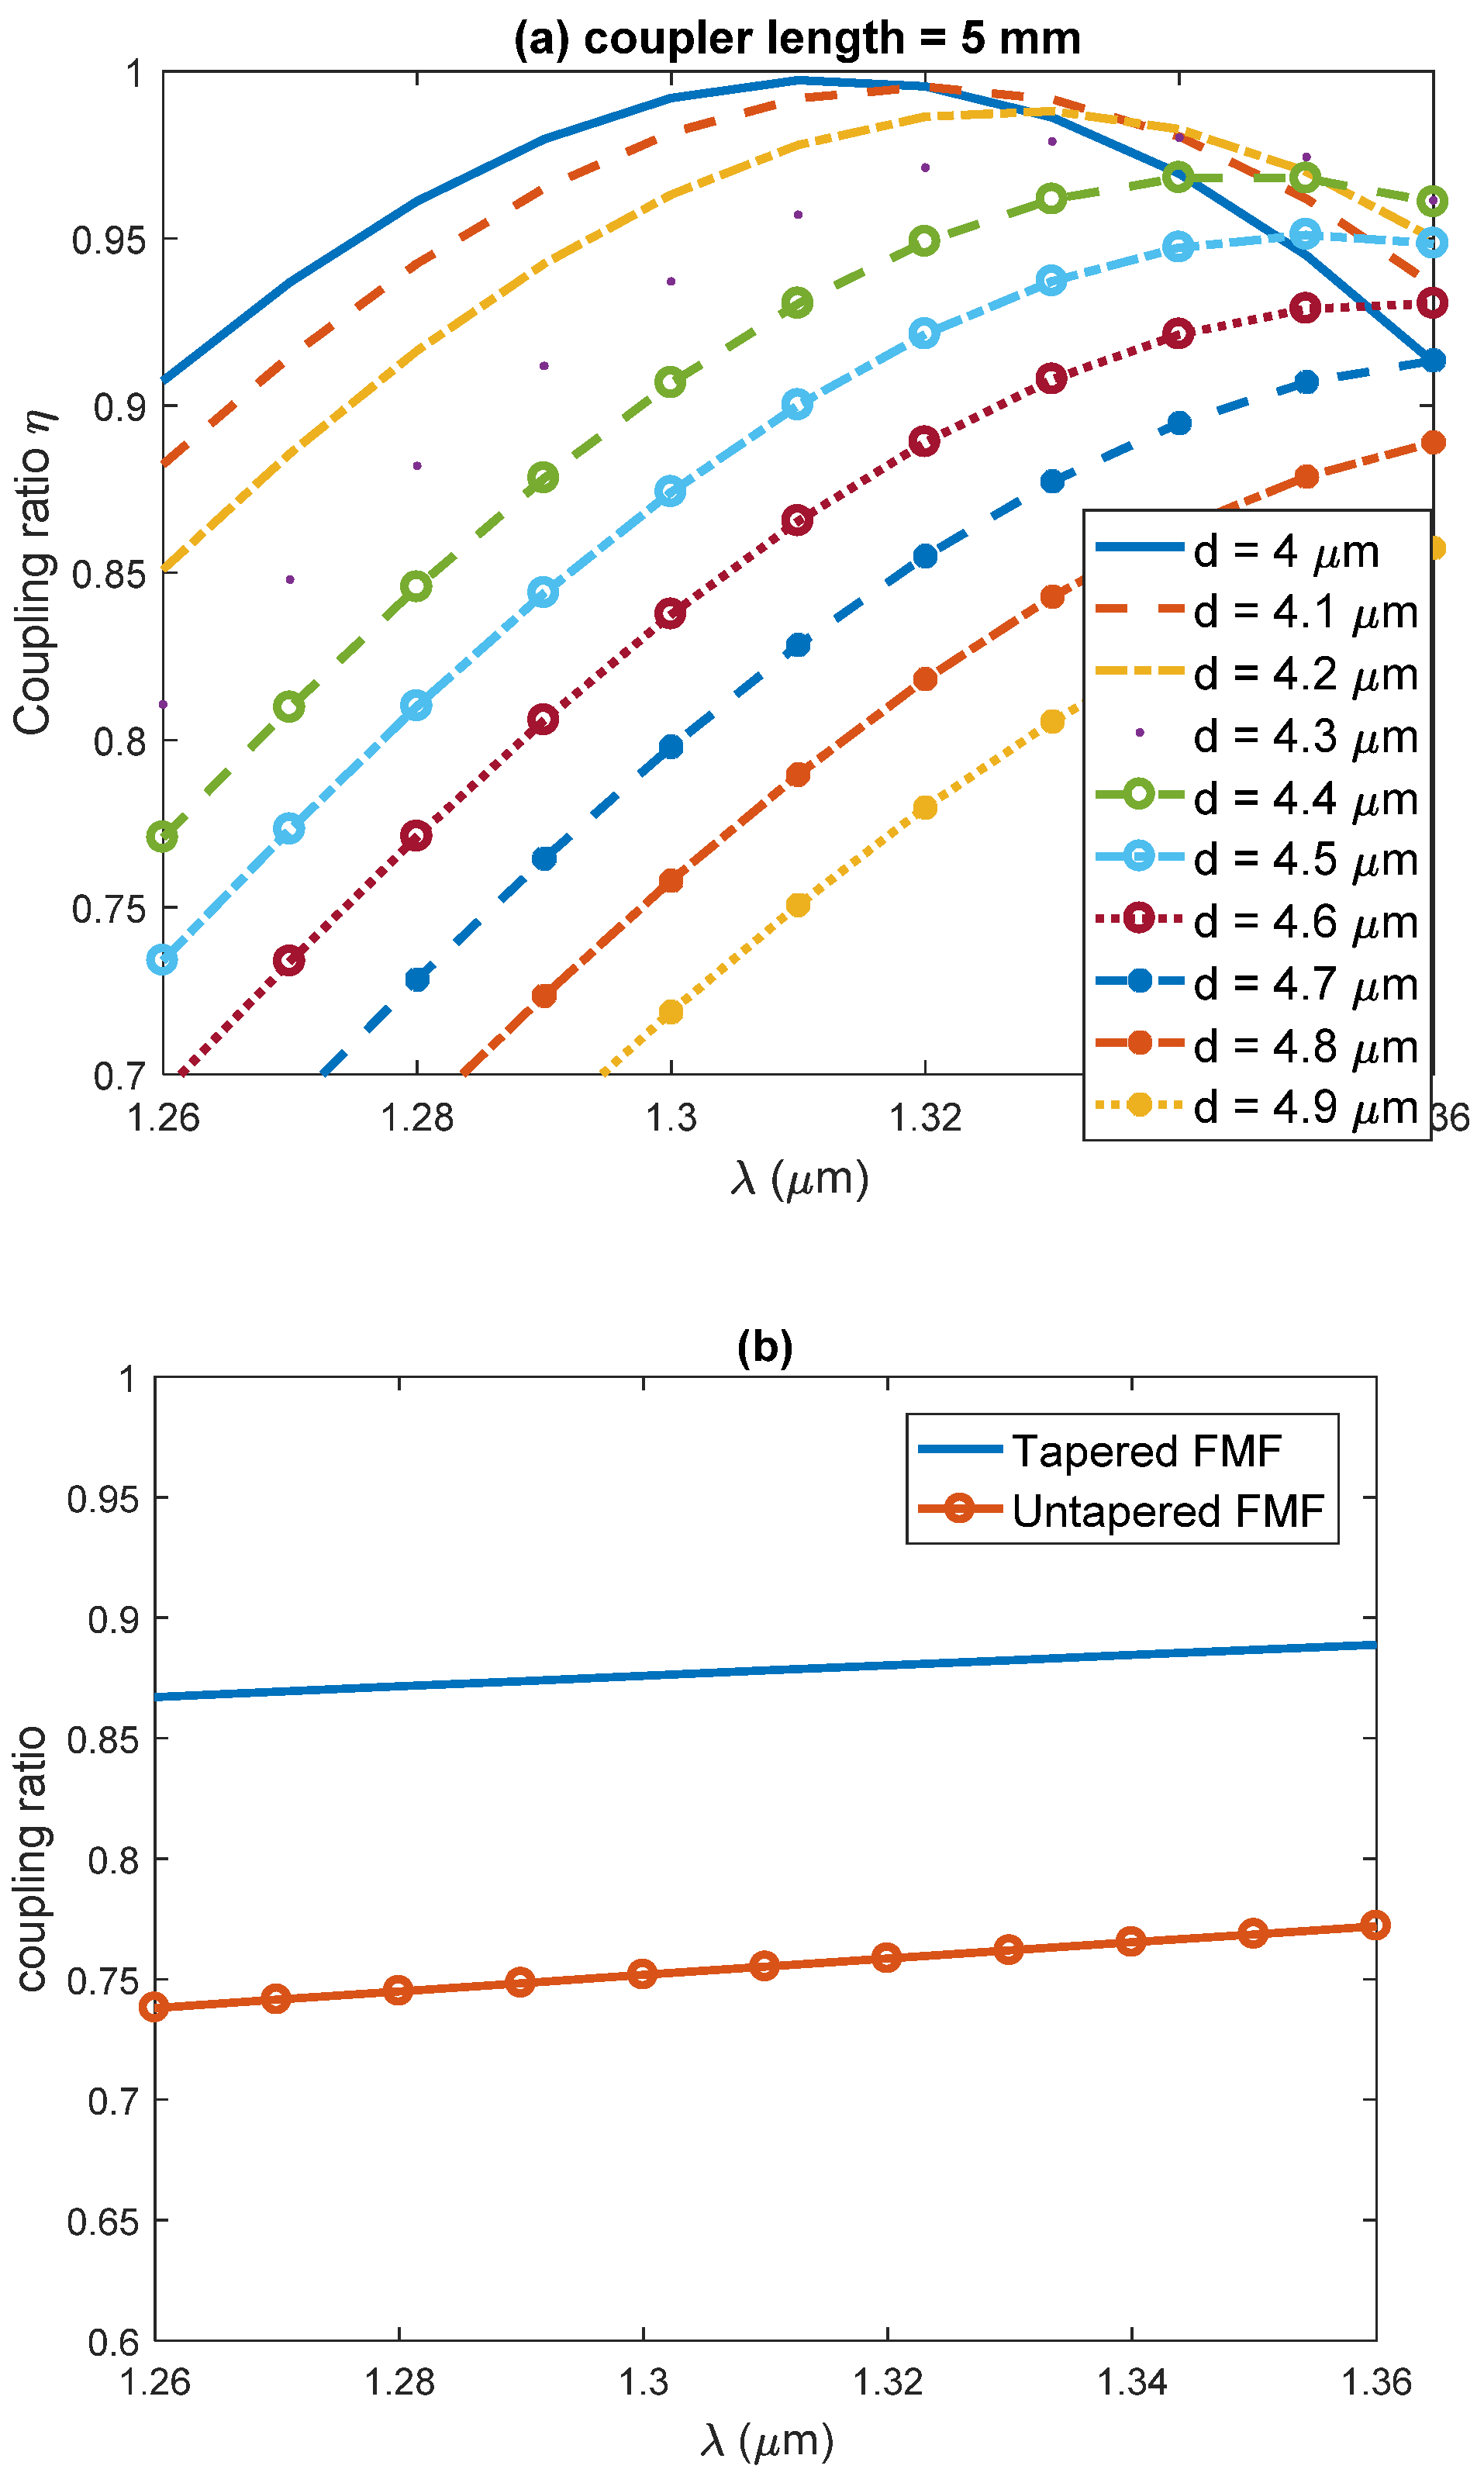
For a fixed coupler length, e.g., L = 5 mm, the coupling ratio in the O-band as a function of the core-to-core separation d varying from 4 to 4.9 μm is plotted in Figure 6a. Couplers with smaller separations are associated with a higher coupling ratio and are more desirable to achieve broadband coupling above a chosen threshold value. Specifically, the coupler with d = 4 μm can achieve broadband coupling above 0.9, as shown by the solid blue curve. For estimation purposes, assuming the LP11 mode power is equivalent to LP01 mode power and assuming the BS ratio is 90:10, the multimode detection using the selective mode coupler with output to BPD2 in the multimode OCT system as shown in Figure 1a could achieve 0.81 (0.9 × 0.9 = 0.81) or more for all wavelengths in the O-band.
The coupling of FMF LP01 to SMF LP01 mode is through direct fusion splicing between both fibers. The coupling ratio varies from 0.87 to 0.89 for tapered FMF with a diameter of 15.1 μm, whereas it varies from 0.74 to 0.77 for untapered FMF, as shown in Figure 6b. The LP01 mode detection using a conventional OCT signal is normalized to 1. The LP01 mode detection through two paths, by BPD1 and BPD3, could achieve greater than 0.88 (0.1 + 0.9 × 0.87 ≈ 0.88) if using tapered FMF butt coupled to SMF. The total detected power in the multimode OCT system is approximately 1.69 times of the conventional OCT signal.
The FMF LP01 mode and SMF LP01 mode are not phase-matched. Thus, the coupling efficiency would be very small. For example, the experiment result reported in a previous paper shows the coupling efficiency was 0.1% between the FMF LP01 mode and SMF LP01 mode as compared to the coupling efficiency of 78.9% for desirable mode coupling between the FMF LP11 mode and SMF LP01 mode at 1550 nm [26]. In addition, the noise primarily comes from the reference light. The mode coupling is restricted to the sample arm, and there is little effect on the imaging for two reasons. First of all, the optical path length difference between the crosstalk and the reference is very large so that the interference fringes due to crosstalk will not be detected by the detection electronics since it is essentially a low-pass filter. Second, for biomedical applications, in most cases, the sample reflectivity is a few orders of magnitude smaller than that of the reference light. Therefore, the sample power (or its variations) can be negligible in calculating the noise. According to Eq. 2 in Nassif et al. [18], the overall noise in electrons squared per readout cycle and per detector element is given by:
where e is the electron charge; is the reference arm power per detector element at the detection arm fiber tip; τi is the integration time, and Ev is the photon energy. is the electrical noise term, is the shot noise term, which is equal to the electrons from the reference light, and the rest of the right-hand side is the RIN term. In shot-noise OCT devices, the equation above can be reduced to .
Therefore, the improvement in SNR is the improvement in signal power, which is dependent on the beam-splitting ratio. The light attenuation in turbid media in biological tissue is normally modeled with the Beer-Lambert law, which means the penetration depth is approximately linearly related to the SNR. However, the improvement in penetration depth is dependent on the attenuation coefficient of the sample, so without knowledge of the sample, it is not possible to quantify penetration improvement. However, a simpler way to understand the advantage of the proposed method is in terms of imaging speed. For example, with a 90:10 beam splitter, the signal power will be 69% higher, thus improving SNR by 69%.
If FMF supports more than one higher-order mode, e.g., in addition to LP11 mode, LP21 and LP02 or even higher-order modes are also supported, the proposed FMF detection module will be modified to cascade additional mode-selective coupler to selectively phase match each higher-order mode to the LP01 mode in SMF for selective mode coupling in the O-band. In each mode-selective coupler, the tapering ratio of the FMF and the core-to-core separation need to be optimized specifically for the coupling between the selective higher-order mode of FMF and the LP01 mode in SMF. The optimization for other higher-order modes can be performed by the same procedure presented in this work. Taking the assumption of equal power distribution among all the optical modes in the FMF, the FMF detection module can be designed to achieve broadband mode coupling of coupling efficiency over η between each higher-order mode and the LP01 mode in SMF, e.g., for an N higher-order mode FMF, the proposed detection module could achieve 0.88 + Nη × 0.9 times of conventional OCT signal. However, it should be noted that propagating more higher-order modes in the FMF demands a good extinction ratio in the mode-selective coupler. The extinction ratio determines the ratio of the selective mode coupling to the desired mode compared to unwanted modes [26]. The extinction ratio will be a critical parameter to minimize crosstalk among higher-order modes at the detector, and thus it needs further study in the FMF coupler design optimization.
The presented results are based on simulations of the optimized FMF coupler only. We have not built the system yet. We will report the experimental results in future publications.
4. Conclusions
Our preliminary simulation results demonstrate that multimode detection in OCT can be efficiently realized using a broadband all-fiber mode coupler in the O-band. It enhances signal strength as the simulation demonstrates over 1.69 times of conventional OCT signal could be achieved. This approach will also improve penetration depth in OCT imaging. Furthermore, the proposed detection module makes it possible to suppress speckle noise by incoherent averaging OCT images of different modes as their speckles are not correlated.
Author Contributions
Conceptualization, D.J.J.H., and L.L.; Investigation and writing—original draft preparation, D.J.J.H.; writing—review and editing, D.J.J.H., L.L., H.D. and H.Z. All authors have read and agreed to the published version of the manuscript.
Funding
We acknowledge the funding support from the Singapore Ministry of Health’s National Medical Research Council under its Open Fund Individual Research Grant (MOH-000384) and the Ministry of Education Singapore under its Academic Research Funding Tier 2 (MOE-T2EP30120-0001) and Academic Research Funding Tier 1 (RG35/22).
Institutional Review Board Statement
Not applicable.
Informed Consent Statement
Not applicable.
Data Availability Statement
Not applicable.
Conflicts of Interest
The authors declare no conflict of interest.
References
- Huang, D.; Swanson, E.A.; Lin, C.P.; Schuman, J.S.; Stinson, W.G.; Chang, W.; Hee, M.R.; Flotte, T.; Gregory, K.; Puliafito, C.A. Optical coherence tomography. science 1991, 254, 1178–1181. [Google Scholar] [CrossRef] [PubMed]
- Drexler, W.; Liu, M.; Kumar, A.; Kamali, T.; Unterhuber, A.; Leitgeb, R.A. Optical coherence tomography today: Speed, contrast, and multimodality. J. Biomed. Opt. 2014, 19, 071412. [Google Scholar] [CrossRef]
- Vakoc, B.J.; Lanning, R.M.; Tyrrell, J.A.; Padera, T.P.; Bartlett, L.A.; Stylianopoulos, T.; Munn, L.L.; Tearney, G.J.; Fukumura, D.; Jain, R.K.; et al. Three-dimensional microscopy of the tumor microenvironment in vivo using optical frequency domain imaging. Nat. Med. 2009, 15, 1219–1223. [Google Scholar] [CrossRef] [PubMed]
- Cogliati, A.; Canavesi, C.; Hayes, A.; Tankam, P.; Duma, V.-F.; Santhanam, A.; Thompson, K.P.; Rolland, J.P. MEMS-based handheld scanning probe with pre-shaped input signals for distortion-free images in Gabor-domain optical coherence microscopy. Opt. Express 2016, 24, 13365–13374. [Google Scholar] [CrossRef] [PubMed]
- Wang, R.K. Signal degradation by multiple scattering in optical coherence tomography of dense tissue: A Monte Carlo study towards optical clearing of biotissues. Phys. Med. Biol. 2002, 47, 2281–2299. [Google Scholar] [CrossRef]
- Park, H.-Y.L.; Lee, N.Y.; Choi, J.A.; Park, C.K. Measurement of scleral thickness using swept-source optical coherence tomography in patients with open-angle glaucoma and myopia. Am. J. Ophthalmol. 2014, 157, 876–885. [Google Scholar] [CrossRef] [PubMed]
- Ikuno, Y.; Nouchi, T.; Yasuno, Y. Scleral and Choroidal Thickness in Normal Subjects Measured by High-Penetration Optical Coherence Tomography With Long Wavelength. Investig. Ophthalmol. Vis. Sci. 2010, 51, 1634. [Google Scholar]
- Willemse, J.; Gräfe, M.G.O.; Verbraak, F.D.; Boer, J.F.d. In Vivo 3D Determination of Peripapillary Scleral and Retinal Layer Architecture Using Polarization-Sensitive Optical Coherence Tomography. Transl. Vis. Sci. Technol. 2020, 9, 21. [Google Scholar] [CrossRef]
- Spaide, R.F.; Fujimoto, J.G.; Waheed, N.K.; Sadda, S.R.; Staurenghi, G. Optical coherence tomography angiography. Prog. Retin. Eye Res. 2018, 64, 1–55. [Google Scholar] [CrossRef]
- Yoshida, S.; Tanaka, S.; Hirata, M.; Mouri, R.; Kaneko, I.; Oka, S.; Yoshihara, M.; Chayama, K. Optical biopsy of GI lesions by reflectance-type laser-scanning confocal microscopy. Gastrointest. Endosc. 2007, 66, 144–149. [Google Scholar] [CrossRef]
- Bezerra, H.G.; Costa, M.A.; Guagliumi, G.; Rollins, A.M.; Simon, D.I. Intracoronary Optical Coherence Tomography: A Comprehensive Review. JACC Cardiovasc. Interv. 2009, 2, 1035–1046. [Google Scholar] [CrossRef] [PubMed]
- Liu, L.; Gardecki, J.A.; Nadkarni, S.K.; Toussaint, J.D.; Yagi, Y.; Bouma, B.E.; Tearney, G.J. Imaging the subcellular structure of human coronary atherosclerosis using micro–optical coherence tomography. Nat. Med. 2011, 17, 1010–1014. [Google Scholar] [CrossRef] [PubMed]
- Lee, H.C.; Ahsen, O.O.; Liang, K.; Wang, Z.; Figueiredo, M.; Giacomelli, M.G.; Potsaid, B.; Huang, Q.; Mashimo, H.; Fujimoto, J.G. Endoscopic optical coherence tomography angiography microvascular features associated with dysplasia in Barrett’s esophagus (with video). Gastrointest. Endosc. 2017, 86, 476–484.e3. [Google Scholar] [CrossRef]
- White, B.R.; Pierce, M.C.; Nassif, N.; Cense, B.; Park, B.H.; Tearney, G.J.; Bouma, B.E.; Chen, T.C.; de Boer, J.F. In vivo dynamic human retinal blood flow imaging using ultra-high-speed spectral domain optical Doppler tomography. Opt. Express 2003, 11, 3490–3497. [Google Scholar] [CrossRef]
- Leitgeb, R.; Hitzenberger, C.K.; Fercher, A.F. Performance of fourier domain vs. time domain optical coherence tomography. Opt. Express 2003, 11, 889–894. [Google Scholar] [CrossRef] [PubMed]
- You, J.-W.; Chen, T.C.; Mujat, M.; Hyle Park, B.; de Boer, J.F. Pulsed illumination spectral-domain optical coherence tomography for human retinal imaging. Opt. Express 2006, 14, 6739–6748. [Google Scholar] [CrossRef] [PubMed]
- Yun, S.H.; Tearney, G.J.; Bouma, B.E.; Park, B.H.; de Boer, J.F. High-speed spectral-domain optical coherence tomography at 1.3 µm wavelength. Opt. Express 2003, 11, 3598–3604. [Google Scholar] [CrossRef]
- Nassif, N.; Cense, B.; Hyle Park, B.; Yun, S.H.; Chen, T.C.; Bouma, B.E.; Tearney, G.J.; de Boer, J.F. In vivo human retinal imaging by ultrahigh-speed spectral domain optical coherence tomography. Opt. Lett. 2004, 29, 480–482. [Google Scholar] [CrossRef]
- Eugui, P.; Lichtenegger, A.; Augustin, M.; Harper, D.J.; Fialová, S.; Wartak, A.; Hitzenberger, C.K.; Baumann, B. Few-Mode Fiber Detection for Tissue Characterization in Optical Coherence Tomography. In Proceedings of the Optical Coherence Imaging Techniques and Imaging in Scattering Media II, Munich Germany, 25–29 June 2017; Wojtkowski, M., Ed.; [Google Scholar]
- Eugui, P.; Lichtenegger, A.; Augustin, M.; Harper, D.J.; Muck, M.; Roetzer, T.; Wartak, A.; Konegger, T.; Widhalm, G.; Hitzenberger, C.K.; et al. Beyond backscattering: Optical neuroimaging by BRAD. Biomed. Opt. Express 2018, 9, 2476–2494. [Google Scholar] [CrossRef]
- Sivry-Houle, M.P.d.; Beaudoin, S.B.; Brais-Brunet, S.; Dehaes, M.; Godbout, N.; Boudoux, C. All-fiber few-mode optical coherence tomography using a modally-specific photonic lantern. Biomed. Opt. Express 2021, 12, 5704–5719. [Google Scholar] [CrossRef]
- Chang, S.H.; Moon, S.-R.; Chen, H.; Ryf, R.; Fontaine, N.K.; Park, K.J.; Kim, K.; Lee, J.K. All-fiber 6-mode multiplexers based on fiber mode selective couplers. Opt. Express 2017, 25, 5734–5741. [Google Scholar] [CrossRef]
- Corral, J.L.; Garcia-Rodriguez, D.; Llorente, R. Mode-Selective Couplers for Two-Mode Transmission at 850 nm in Standard SMF. IEEE Photonics Technol. Lett. 2016, 28, 425–428. [Google Scholar] [CrossRef]
- Li, A.; Chen, X.; Amin, A.A.; Shieh, W. Fused Fiber Mode Couplers for Few-Mode Transmission. IEEE Photonics Technol. Lett. 2012, 24, 1953–1956. [Google Scholar]
- Bremer, K.; Schlangen, S.; Böhm, S.; Wellmann, F.; Steinke, M.; Neumann, J.; Roth, B.; Overmeyer, L. Investigation of grating assisted mode-selective few-mode fused fiber couplers. In Proceedings of the 2019 Conference on Lasers and Electro-Optics Europe and European Quantum Electronics Conference, Munich Germany, 23–27 June 2019. [Google Scholar]
- Park, K.J.; Song, K.Y.; Kim, Y.K.; Lee, J.H.; Kim, B.Y. Broadband mode division multiplexer using all-fiber mode selective couplers. Opt. Express 2016, 24, 3543–3549. [Google Scholar] [CrossRef] [PubMed]
- Hu, D.J.J.; Liu, L.; Dong, H.; Zhang, H. Design of a Tapered Few-Mode Fiber based Broadband Mode Coupler for Multimode OCT. In Proceedings of the Imaging and Applied Optics Congress 2022 (3D, AOA, COSI, ISA, pcAOP), Vancouver, BC, Canada, 11–15 July 2022. [Google Scholar]
- Malitson, H. Interspecimen Comparison of the Refractive Index of Fused Silica*,†. J. Opt. Soc. Am. 1965, 55, 1205–1209. [Google Scholar] [CrossRef]
- Okamoto, K. Fundamentals of Optical Waveguides; Academic press: Cambridge, MA, USA, 2010. [Google Scholar]
- Hu, D.J.J.; Shum, P.P.; Lim, J.L.; Cui, Y.; Milenko, K.; Wang, Y.; Wolinski, T. A Compact and Temperature-Sensitive Directional Coupler Based on Photonic Crystal Fiber Filled With Liquid Crystal 6CHBT. IEEE Photonics J. 2012, 4, 2010–2016. [Google Scholar] [CrossRef]
- Xu, Z.; Lim, J.; Hu, D.J.J.; Sun, Q.; Wong, R.Y.-N.; Li, K.; Jiang, M.; Shum, P.P. Investigation of temperature sensing characteristics in selectively infiltrated photonic crystal fiber. Opt. Express 2016, 24, 1699–1707. [Google Scholar] [CrossRef]
Figure 1.
(a) Multimode OCT schematic with the FMF-based mode-selective coupler. SMF: single mode fiber; FMF: few-mode fiber; BPD: balanced photodetectors; BS: beam splitter; (b) Proposed FMF detection module.
Figure 1.
(a) Multimode OCT schematic with the FMF-based mode-selective coupler. SMF: single mode fiber; FMF: few-mode fiber; BPD: balanced photodetectors; BS: beam splitter; (b) Proposed FMF detection module.


Figure 2.
Phase matching curves of the modes in FMF and SMF.

Figure 3.
(a): Mode coupling varies with coupler length wavelength; (b) Mode coupling varies with core-to-core separation.
Figure 3.
(a): Mode coupling varies with coupler length wavelength; (b) Mode coupling varies with core-to-core separation.


Figure 4.
(a): Coupling length as a function of wavelength and core-to-core separation d; (b) coupling ratio η as a function of wavelength and core-to-core separation d.
Figure 4.
(a): Coupling length as a function of wavelength and core-to-core separation d; (b) coupling ratio η as a function of wavelength and core-to-core separation d.


Figure 5.
(a): Color map of the coupling ratio η as a function of coupler length and wavelength. Two lines represent the allowed coupler length range to achieve the broadband coupling ratio 0.9; (b) Allowed coupler length range for chosen coupling ratio threshold, varying from 0.9 to 0.55 with an interval of 0.05.

Figure 6.
(a) Broadband coupling of the device with varying core-to-core separation d, from 4 to 4.9 μm, and a fixed coupler length L of 5 mm. (b) Mode coupling of SMF LP01 to FMF LP01 mode in tapered FMF (solid line) and untapered FMF (solid line with circles) through direct fusion splicing.
Figure 6.
(a) Broadband coupling of the device with varying core-to-core separation d, from 4 to 4.9 μm, and a fixed coupler length L of 5 mm. (b) Mode coupling of SMF LP01 to FMF LP01 mode in tapered FMF (solid line) and untapered FMF (solid line with circles) through direct fusion splicing.


Table 1.
Simulation parameters in the side coupling.
| Fiber Parameters | SMF | FMF |
|---|---|---|
| Core diameter (untapered) | 8 μm | 19 μm |
| Refractive index of the cladding | Sellmeier Equation for silica | Sellmeier Equation for silica |
| Numerical aperture (NA) | 0.12 | 0.12 |
| Tapering ratio | 1 | 0.7–0.9 |
| SMF core to FMF core separation | 4–4.9 μm | |
| Wavelength | 1.26–1.36 μm | |
| Coupler length | Up to 20 mm | |
Disclaimer/Publisher’s Note: The statements, opinions and data contained in all publications are solely those of the individual author(s) and contributor(s) and not of MDPI and/or the editor(s). MDPI and/or the editor(s) disclaim responsibility for any injury to people or property resulting from any ideas, methods, instructions or products referred to in the content. |
© 2023 by the authors. Licensee MDPI, Basel, Switzerland. This article is an open access article distributed under the terms and conditions of the Creative Commons Attribution (CC BY) license (https://creativecommons.org/licenses/by/4.0/).
Share and Cite
MDPI and ACS Style
Hu, D.J.J.; Liu, L.; Dong, H.; Zhang, H. Design of a Broadband Fiber Optic Mode Coupler for Multimode Optical Coherence Tomography. Photonics 2023, 10, 162. https://doi.org/10.3390/photonics10020162
AMA Style
Hu DJJ, Liu L, Dong H, Zhang H. Design of a Broadband Fiber Optic Mode Coupler for Multimode Optical Coherence Tomography. Photonics. 2023; 10(2):162. https://doi.org/10.3390/photonics10020162
Chicago/Turabian StyleHu, Dora Juan Juan, Linbo Liu, Hui Dong, and Hailiang Zhang. 2023. "Design of a Broadband Fiber Optic Mode Coupler for Multimode Optical Coherence Tomography" Photonics 10, no. 2: 162. https://doi.org/10.3390/photonics10020162
Note that from the first issue of 2016, this journal uses article numbers instead of page numbers. See further details here.