1. Introduction
Structural health monitoring of continuously welded heavy-haul railway lines continues to become increasingly important in the railway industry. These railway lines experience very large stresses due to high axle loads and varying environmental conditions, which may lead to train derailments. The major cause of derailments is usually complete rail breaks resulting from damage evolution in the rail. Defects such as cracks can initiate at any region within the rail cross-section and along its length. Over the years, extensive research has demonstrated the potential of guided wave ultrasound (GWU) to allow for full volumetric coverage when monitoring long structures such as rails and pipelines [
1,
2,
3,
4]. Firstly, the propagating modes are multi-modal in nature and are highly sensitive to different types of discontinuities, thereby causing reflections. Secondly, the modes can be used to target different cross-sectional regions in the waveguide, allowing for damage detection in those regions. Thirdly, modes with low attenuation can propagate over long-range distances.
In pipelines, a permanent GWU monitoring system uses a ring of transducers to excite a torsional mode that reflects strongly from the growth of defects produced by corrosion and erosion [
3]. Such a system has been used to investigate guided wave behavior in simple inspection set-ups for above-ground pipelines and in complex scenarios where sections of a pipe are inaccessible due to being insulated, coated, or buried underground [
4]. An ultrasonic broken rail detection (UBRD) system developed for railway lines is permanently installed on 840 km of rail between Sishen and Saldanha in South Africa [
1,
2,
5]. The system detects complete breaks by transmitting ultrasonic-guided waves in the head of the rail between permanently installed alternating transmit and receive transducers, spaced approximately 1 km apart. If the receive station does not detect the transmitted signals, an alarm is triggered, indicating a broken rail and train operation is stopped. The UBRD system has successfully reported several rail breaks, and in 2017, the contribution of the system was measured to be up to 56% of all rail breaks reported [
6]. This system was designed to detect only complete breaks, not cracks that occur before breaks.
In order to prevent complete rail breaks by first detecting damage such as cracks, the UBRD system will require the capability to track damage evolution from the initial stages of development. Other important features of a successful monitoring system include its defect detection techniques, the performance measure for different damage scenarios and the transducers employed. The tracking of damage evolution can be achieved by obtaining highly repeatable ultrasonic measurements of the same section of rail over a specified period. Damage can then be detected using the baseline subtraction technique, where the early measurement (the baseline) that was collected when the waveguide was in a known structural condition is subtracted from the current measurement signal [
7,
8]. However, the baseline subtraction technique is effective only if the changes in the collected measurements and the baseline are due to a change in the condition of the waveguide. In industrial applications, the waveguides are subjected to various environmental and operational conditions (EOCs) that introduce additional changes in the measured reflections making it difficult to distinguish them from those caused by damage evolution. The most common EOC in GWU has been identified as temperature. Other damage detection schemes that have been proven effective when applied to GWU are independent component analysis and singular value decomposition [
9,
10,
11]. However, the researcher will require compensation strategies to deal with the complexities introduced by temperature and other EOCs [
12,
13,
14,
15].
In addition to complex variations caused by changing EOCs, guided wave measurements are further complicated by their nature. When a wave propagates through a material, its energy will attenuate with time due to damping, and the multiple propagating modes will have different attenuation properties that change with frequency [
4,
16,
17]. Furthermore, the modes exhibit a dispersive nature, where their speed of wave propagation differs with frequency [
18]. Dispersion causes the wave packets to spread out as they propagate, adding more complexity to the response measurements. As the multiple modes attenuate and disperse during propagation, their reflections from discontinuities may interact with each other. For example, a single reflection could result from two coupled modes [
19]. Moreover, the reflections may overlap and further contain components caused by the excitation and reception of unwanted modes [
20]. These unwanted components are often known as coherent noise. Therefore, if we perform repeatable GWU measurements, we obtain unique inspection signals due to aleatoric uncertainty caused by noise as well as random EOC variations and their influence on the properties of the propagating modes. When these measurements are collected during damage evolution, more complexity will be introduced, making it difficult to detect the growing damage. As the defect evolves, its geometry may change with time, causing additional modes to start propagating at different stages of evolution and interact with other modes. Therefore, it is very important to understand these complexities to develop successful monitoring systems.
A technique to predict system performance when detecting small damage using ultrasonic guided waves has been demonstrated by researchers in references [
9,
10,
21] for pipeline waveguides. This technique evaluates system performance in terms of probability of detection vs. false alarm using receiver operator characteristic curves (ROCs). Despite their robustness, the challenge with the discussed damage detection techniques and ROCs is that, first, they require a lot of monitoring data collected under varying EOCs. Second, such data should contain damage signatures for different damage evolution stages. Inspection data containing damage evolution is unavailable for rail track applications since damaged sections are immediately replaced with new ones.
The challenge posed by the lack of inspection data for unavailable damage scenarios can be addressed through modeling and simulation capabilities that make it possible to predict data that are almost impossible to obtain from a physical system. Modeling and simulation further offer the ability to thoroughly interpret the inspection data to understand better how different properties affect wave propagation. Ramatlo et al. [
19,
22] developed a finite element modeling framework to simulate guided wave inspections in welded rails. The waves are excited by a resonant transducer model validated in reference [
23]. The model for calculating the scattering caused by complex discontinuities such as welds is based on a technique presented by Benmeddour et al. [
24] and validated by Long et al. [
25] for aluminothermic welds in rails. The physics-based modeling framework presented in [
22] only accounts for direct reflections from welds. In reference [
19], the method was improved to account for multiple reflections, which are most common when working in the web section of the rail. The physics-based model was validated using a field experiment from an operational railway line. The reflections from welds were accurately predicted, implying that it is possible to model and simulate realistic responses for unavailable damage scenarios. However, the limitation of this physics-based numerical model is that it cannot model and simulate unique repeatable ultrasonic measurements subjected to aleatoric uncertainty. Physics-based numerical models can only be used to produce a single solution approximating a measurement for a specified EOC and cannot deal with complex data variations due to uncertainty. Furthermore, when the researcher wants to gain insight into the behavior of guided waves for different propagation scenarios, the prediction of response signals for different combinations of modes becomes necessary. However, this will require the simulation process to be carried out multiple times, further imposing the challenge of high computational demands. To address these challenges, machine learning algorithms are of great use as they can recognize the pattern change due to aleatoric uncertainty and user-specified settings. Moreover, running the model requires fewer computational resources.
Recently, many demonstrations of machine learning techniques that address aleatoric uncertainty in guided wave measurements have started to emerge in the research community. These techniques show a great advantage as they can model complex behavior with high efficiency though they require extensive training data. Most of these studies focus on damage detection, severity, location, and characterization in the presence of uncertainty [
26] and achieve this using a convolutional layer that applies a filter to the training data to extract the underlying features. In references [
27,
28], a deep convolutional neural network-based framework for damage localization in the presence of uncertainty was proposed and applied to a 1m square plate. Damage location was modeled as a multi-modal probability distribution, which made it possible to identify multiple damage locations in the plate. The neural network was trained solely with simulated data, and the analysis was extended to experimental data with temperature variations [
28]. This approach proved to be robust to uncertainty and showed a competitive performance to traditional localization methods. The authors of [
27,
28] introduced environmental uncertainty in the training data as randomness in the wave velocity/wavenumber. The small changes in the wavenumber were approximated by a time-domain stretch computed from the scale transform method [
13]. In reference [
29], an uncertainty quantification study was carried out to predict GWU inspections in the context of crack sizing for pipelines. The training data used in this study contained aleatoric uncertainty due to noise inherent to the data generation process and epistemic uncertainty caused by ignorance of how the data was generated.
From a review of past literature, it was found that the application of machine learning techniques in GWU monitoring under uncertainty has only been carried out in a few areas. While research has been mostly restricted to damage detection and localization in the presence of uncertainty, generating repeatable inspection data containing uncertainty remains equally important. This is because to generate realistic inspection data for unavailable damage evolution scenarios, such data should account for aleatoric uncertainty. This paper seeks to make a contribution towards the modeling and simulation of inspection data for varying EOCs and user-specified complexities in GWU. In this paper, we introduce this topic through a proof of concept study by exploring the use of a data-driven technique to predict GWU inspection signals subject to varying user-specified settings. The user-specified setting that we focus on is that of different modes of propagation. Given an input baseline signal containing only the most dominant mode excited by a transducer attached to the head of the rail, we want to use the proposed data-driven physics-based digital twin model to predict an inspection signal with a specified combination of modes. The data-driven physics-based digital twin model is based on the physics-based digital model in [
19] that is used to generate the training and testing data, and a Variational Auto-Encoder (VAE) model used to learn the mapping from the input signal with just one mode to an output signal with a specified combination of modes. We consider an operational rail with multiple aluminothermic welds as discontinuities. The waves are excited by a piezoelectric transducer and propagated to distances up to 400 m in a pulse-echo set-up.
The prediction of response signals for different combinations of modes can be regarded as a tool to gain insight into the behavior of guided waves in different scenarios. These modes can interact with discontinuities in the rail in different ways, leading to different response signals. The tool can help the researcher better understand and interpret how each mode contributes to the total response. The researcher can then use this information, for example, to design transducers targeting specific modes, though the task can become computationally costly when physics-based models are used. The second objective of this paper is to demonstrate that once a variational auto-encoder is trained, it makes it possible to replace physics-based finite element models. The benefits of replacing a physics-based model with a data-driven model include increased efficiency and reduced computational costs. Physics-based finite element models are computationally expensive, especially in problems concerned with guided wave propagation, where the model has to be solved at discrete frequency points.
Traditionally, VAEs are used to reconstruct the input data through a lower-dimensional latent representation. In this paper, we extend the novelty of reconstructing an output target that is similar to the input data, but distinct in some respect, as proposed with denoising VAEs [
30]. Unlike the denoising VAEs that reduce the complexity of the input data by removing information from the input signal, we increase the complexity of the input data by adding information to the input signal in the form of the measured response in the presence of additional modes of propagation. Given a baseline signal with reflections caused by the most dominant mode, the reconstructed output will contain additional reflections from other modes specified by the user. Therefore, we propose an enhancing VAE as it adds more complexity and new features to the input signal. The performance of the trained VAE model is validated in a supervised setting by using simulated experimental data that enhances a baseline signal with additional modes. The proposed approach can be applied to different rail set-ups in terms of the types of discontinuities considered, the position of those discontinuities as well as different positions of the transducer. Every time the researcher considers a different rail set-up, appropriate data for the problem at hand will be required, and the VAE will have to be trained using that data. The training for each rail set-up will result in a unique model for that scenario, though the same architecture can be used. The presented approach is only applied to simulated data since modal decomposition is impossible in experimental field data. In the future, the procedure will be adapted to predict inspection signals for damage evolution for varying EOCs and other complexities encountered in operational data.
The physics-based model to simulate the virtual experimental data is described in
Section 2.
Section 3 explains the data used to train the VAE architecture in
Section 4, and the results are presented in
Section 5. The conclusions of the paper are drawn in
Section 6.
2. Simulation of Guided Wave Inspection in the Head of a Rail
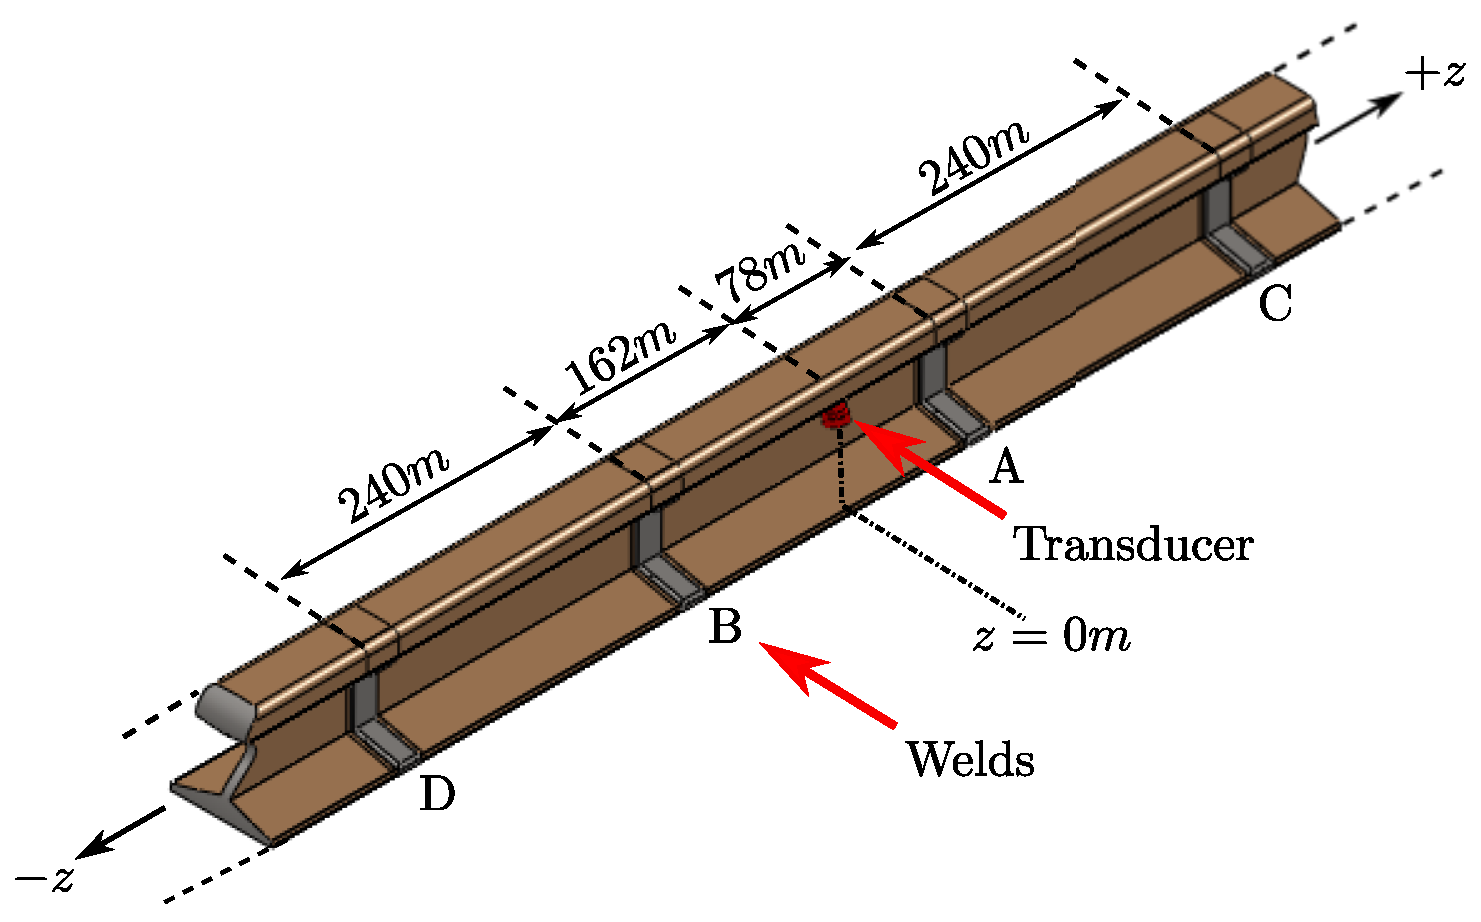
A field experiment was performed on a UIC60 rail in an operational heavy-haul rail track with 240-m-long sections welded together by four aluminothermic welds. The guided waves are excited using a piezoelectric transducer attached to the head of the rail and located at a distance of approximately 78 m from the nearest weld. The pulse-echo transducer was driven by a 17.5-cycle Hanning windowed tone burst voltage signal with a center frequency of 35 kHz. The excited guided waves were transmitted in both directions along the rail, and the transducer was used to measure the reflections from the welds. A schematic representation of the field layout of the section of rail considered is illustrated in
Figure 1.
The experimental set-up in
Figure 1 was approximated using a physics-based modeling framework presented and validated in reference [
19]. The digital model for the set-up considered in this paper is illustrated in
Figure 2. The model will be briefly explained for completeness, but the reader is referred to [
19,
22] for additional details.
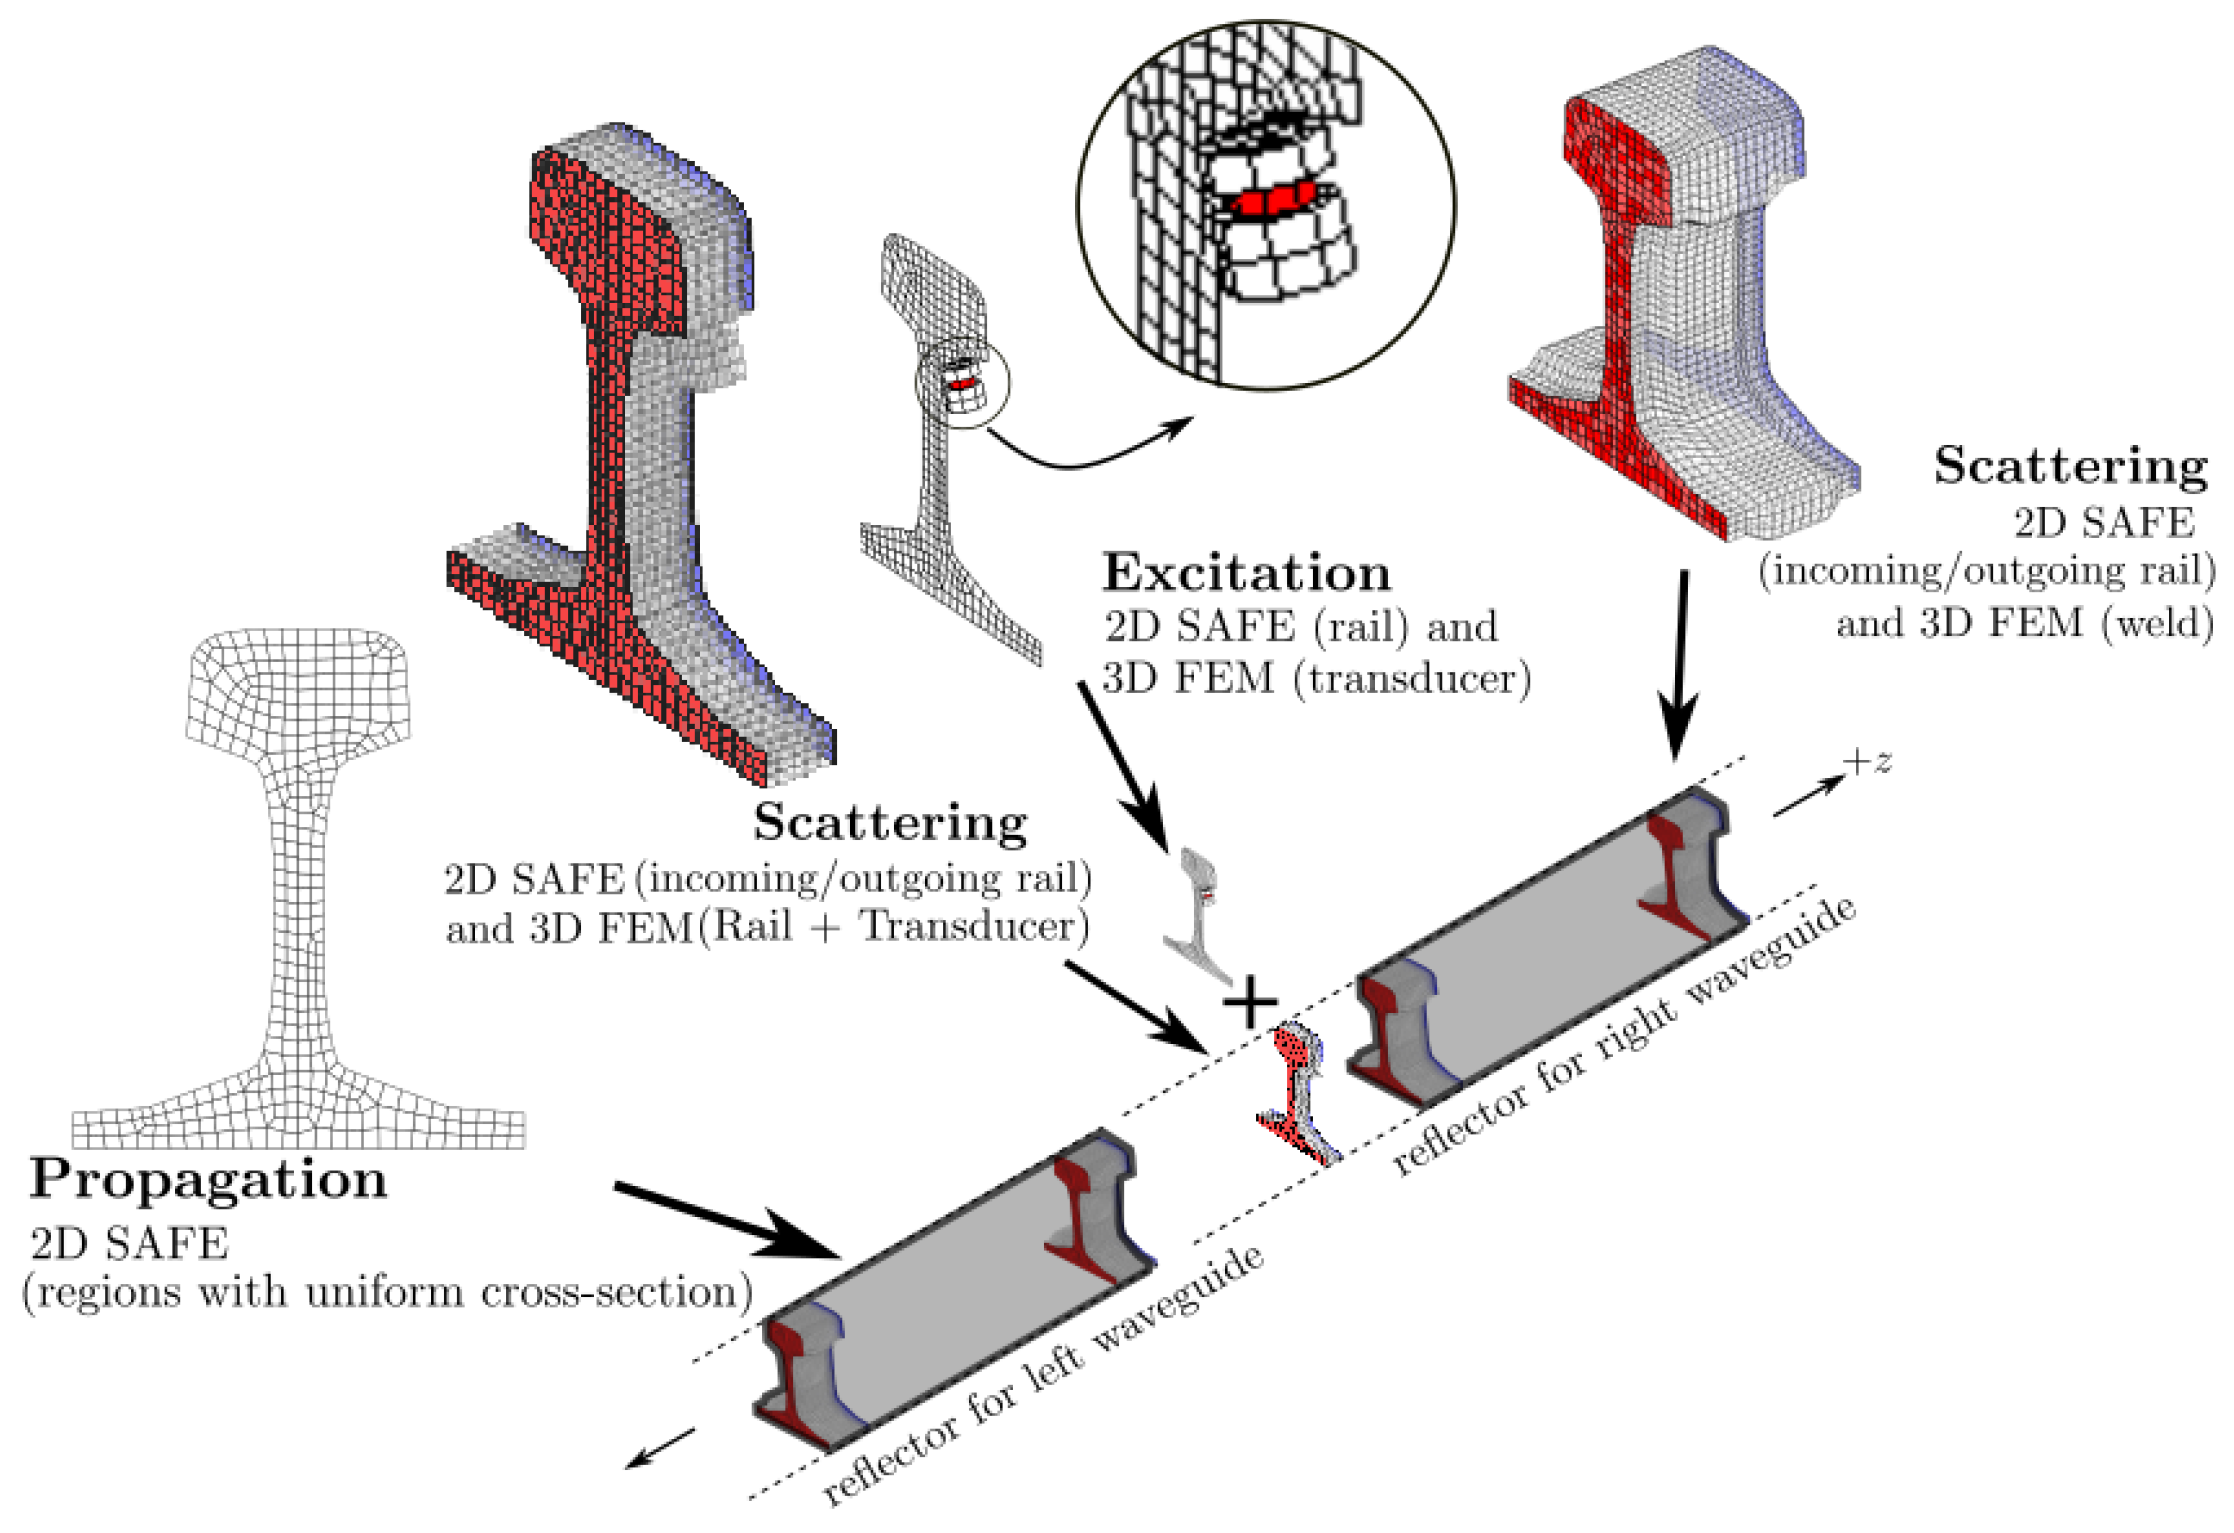
The three elements that form the basis of the modeling framework are excitation using a transducer, propagation of waves in regions of constant cross-section and scattering from discontinuities. The excitation model employs a piezoelectric transducer modeled using the traditional 3D FEM coupled to a 2D semi-analytical finite element (SAFE) cross-section of the waveguide through the computation of the frequency-dependant dynamic stiffness, as explained in [
23]. A 17.5-cycle Hanning windowed tone burst voltage signal with a center frequency of 35 kHz was applied to the transducer, and equivalent mechanical forces were applied to the 2D cross-section model using the dynamic stiffness matrix. The hybrid model combining the 3D model of the transducer and the 2D model of the rail computed the mode shapes and associated modal amplitudes resulting from the transducer excitation. These wave modes are then propagated along the length of the waveguide by applying analytical variations in the direction of propagation using the SAFE method [
31]. The scattering of guided waves from discontinuities such as welds is modeled using a second hybrid model, which couples a 3D FEM model of the reflector with two SAFE models to represent the semi-infinite incoming and outgoing rails on either side of the reflector. This method is explained in detail in reference [
24]. The propagation properties calculated from the SAFE models account for dispersion and attenuation in the rail. The results of the individual elements of the inspection set-up for the UIC60 rail considered were published in reference [
22].
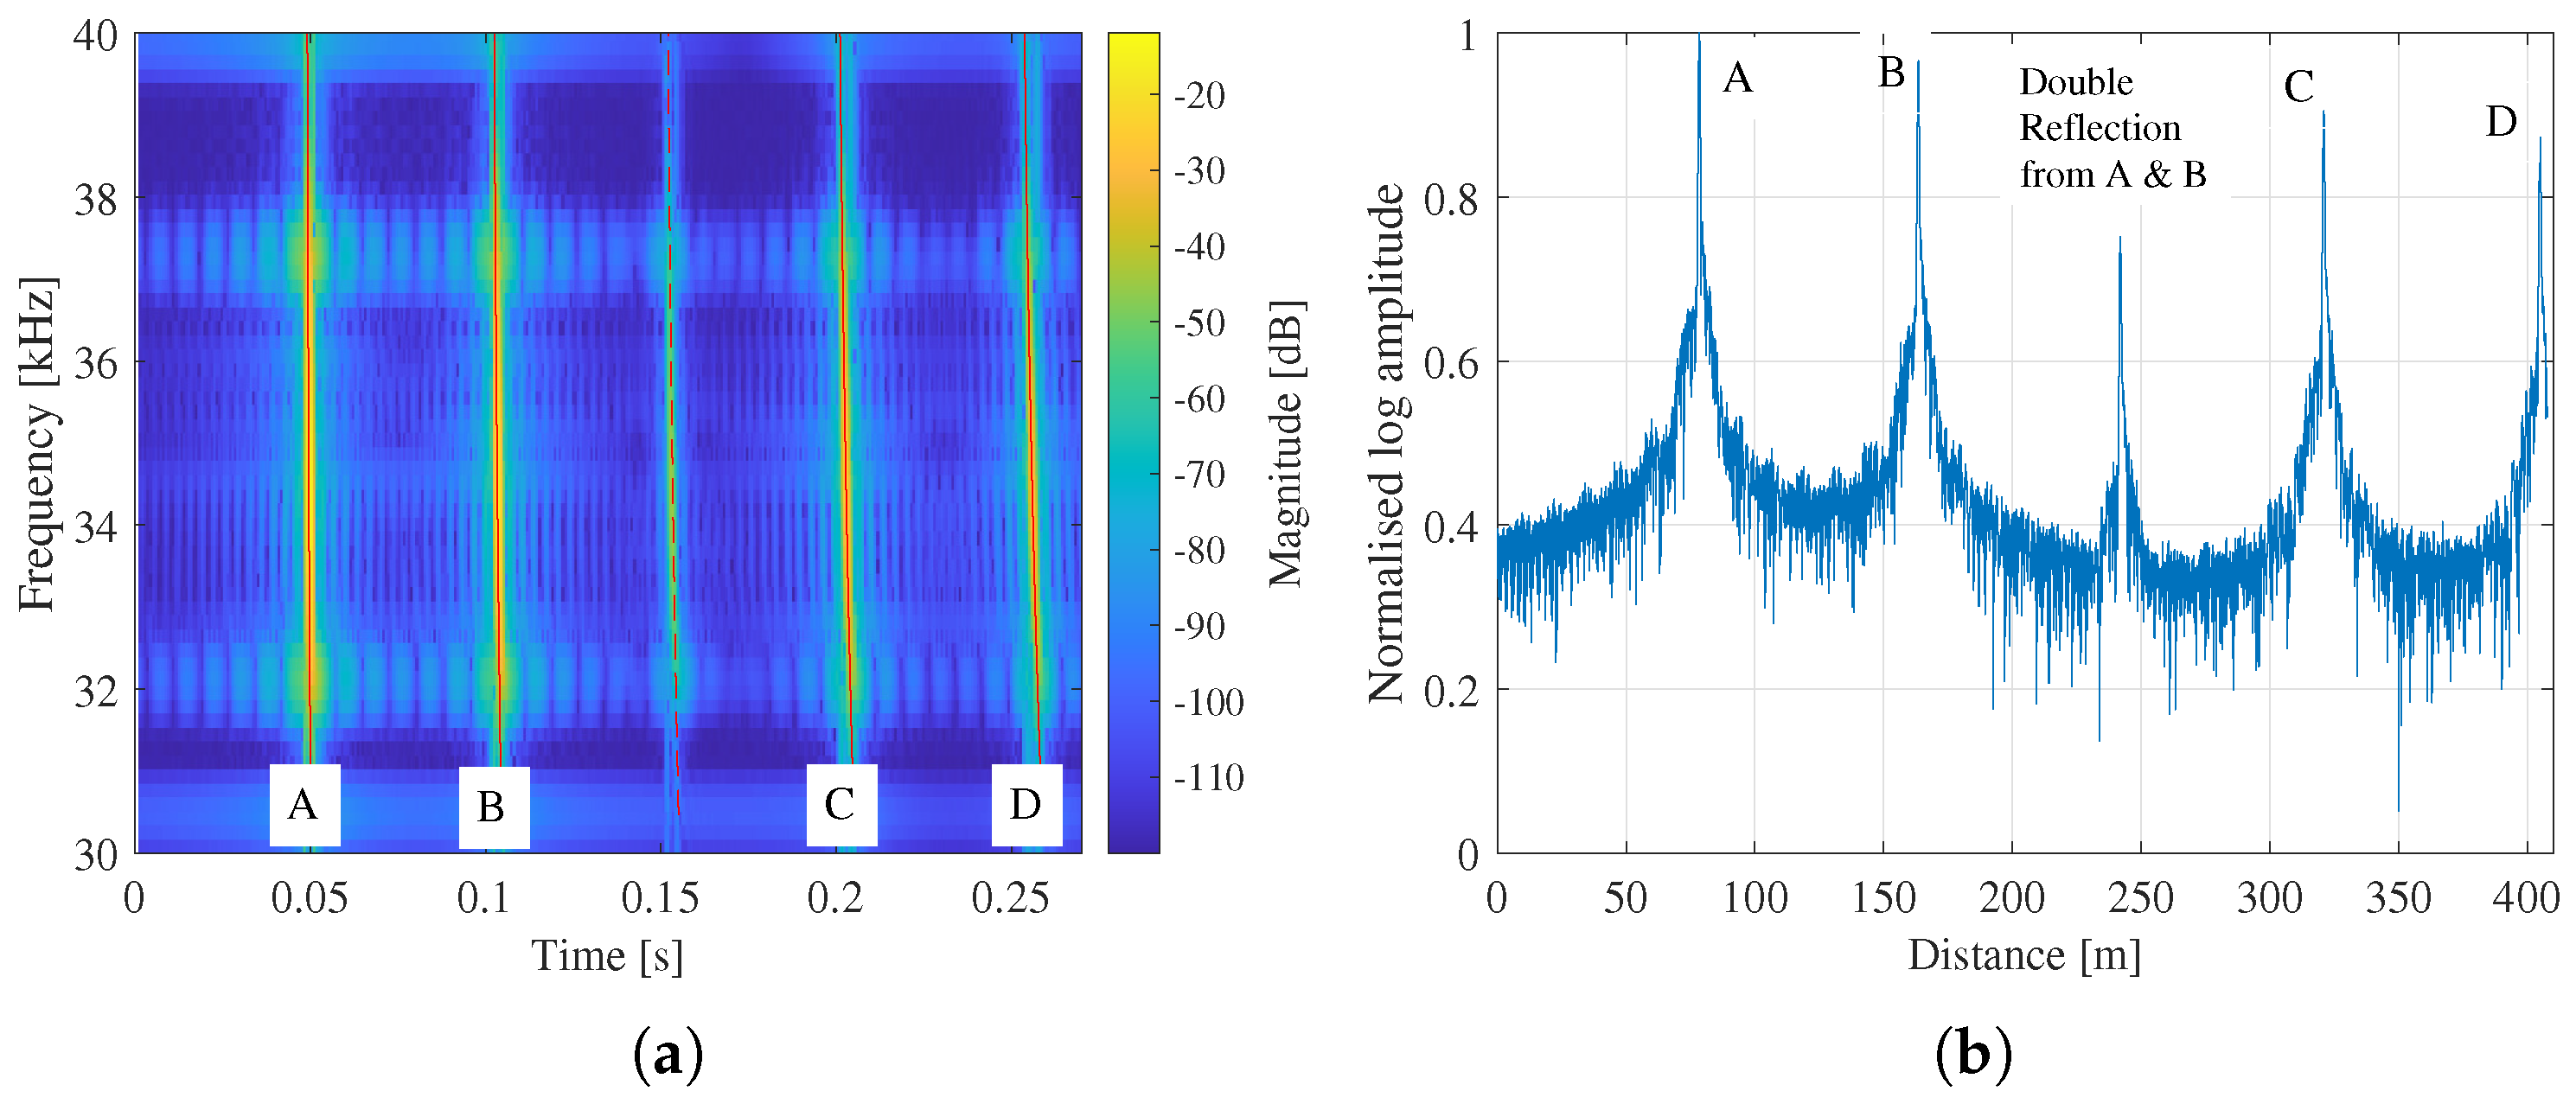
In a waveguide with multiple discontinuities, wave propagation is characterized by complex back-and-forth reverberations that occur between the discontinuities. This network of reverberations is accounted for by introducing a global scattering matrix according to [
32], where several local discontinuities are modeled as one reflector. This procedure is first applied to create a domain referred to as the right waveguide where welds A and C, located to the right of the transducer, are coupled together. The second domain of reflectors, the left waveguide, is created by coupling hybrid models of welds B and D together. The general scattering matrix for each region is computed using the reflection and transmission matrices for each weld and propagation terms from dispersion properties. The matrix accounts for infinite reverberations that occur during propagation. An example of a simple reverberation is a double reflection resulting when the waves reflect two times, first from weld A, then from weld B, before the transducer measures the response. This reverberation is called a double reflection in this paper. When a general scattering matrix is not employed, only a finite number of reflections can be included in the simulation result, and those reflections need to be included manually. The difference between the two approaches was discussed in reference [
22]. The general scattering matrix automatically accounts for infinite reverberations, thereby improving the accuracy of the simulated response.
The method of Baronian et al. [
32] is further employed according to Ramatlo et al. [
19] to create a model for the entire section of rail considered. To account for the computation of reverberating reflections, a scattering model of the transducer is included. The model was implemented by using a hybrid model combining the 3D FEM of the rail and the transducer with two SAFE models of the rail to represent the incoming and outgoing waveguides. The hybrid model was then used to predict the wave modes reflecting and transmitting through the transducer when an incident wave interacted with the transducer attached to the rail. The models of excitation and scattering from the transducer are thus coupled with models of the left and right waveguides, and the wave modes are propagated between these domains. Response signals are calculated at the transducer location in the frequency domain based on the specified number of modes:
where
is the mode shape, and the term
is the modal amplitude of the reflected mode at the transducer location. The response is then converted to the distance domain by applying an inverse Fourier Transform followed by a dispersion compensation procedure [
18]. Details of the coupling procedure and computation of response signals can be found in references [
19,
32].
4. VAE Predicting Virtual Experimental Data for a Specified Combination
of Modes
Dispersion behavior, modal interaction, and overlapping reflections from different sources add complexity to the response signals. Furthermore, in addition to direct reflections, multiple discontinuities introduce double reflections that occur when the waves reverberate between discontinuities. This increases the complexity of the response. In this section, a VAE has been developed, trained, and tested using virtual experimental signals from a physics-based model to add complexity in the form of more modes to a baseline signal with only one mode.
The proposed framework for generating synthetic data with damage signatures is based on the principle of dimensionality reduction. The VAE consists of two separate networks, an encoder, and a decoder, connected through a lower-dimensional latent space . The encoder compresses the input data to a lower-dimensional space that maps the data to a continuous latent vector . The decoder then takes the latent variable and maps it to a higher dimensional space to reconstruct an output approximating the target. Traditionally, VAEs are used to reconstruct an output target that approximates the input data. In this paper, we introduce the novelty of reconstructing an output target that is an enhanced input signal. Given a baseline signal with reflections of mode number 7 from welds as an input, the reconstructed output will contain a response in the presence of additional modes of propagation, which result in an increased number of reflections from welds. Therefore, the procedure we propose is an enhancing VAE as it adds more complexity and new features to the input signal.
4.1. Training and Testing Data
As explained in
Section 2, the simulation results will be used for training and testing the VAE for predicting the target signals. The VAE requires two sets of virtual experimental data to solve this task. The first set of input data is the baseline signal. This signal contains reflections from four identical weld geometries and contains the contribution of only mode number 7, as plotted in
Figure 4. The second set of data is response signals containing reflections caused by additional combinations of modes. The VAE model will then learn the mapping from the baseline signal with only mode number 7 to the target signal with additional mode combinations.
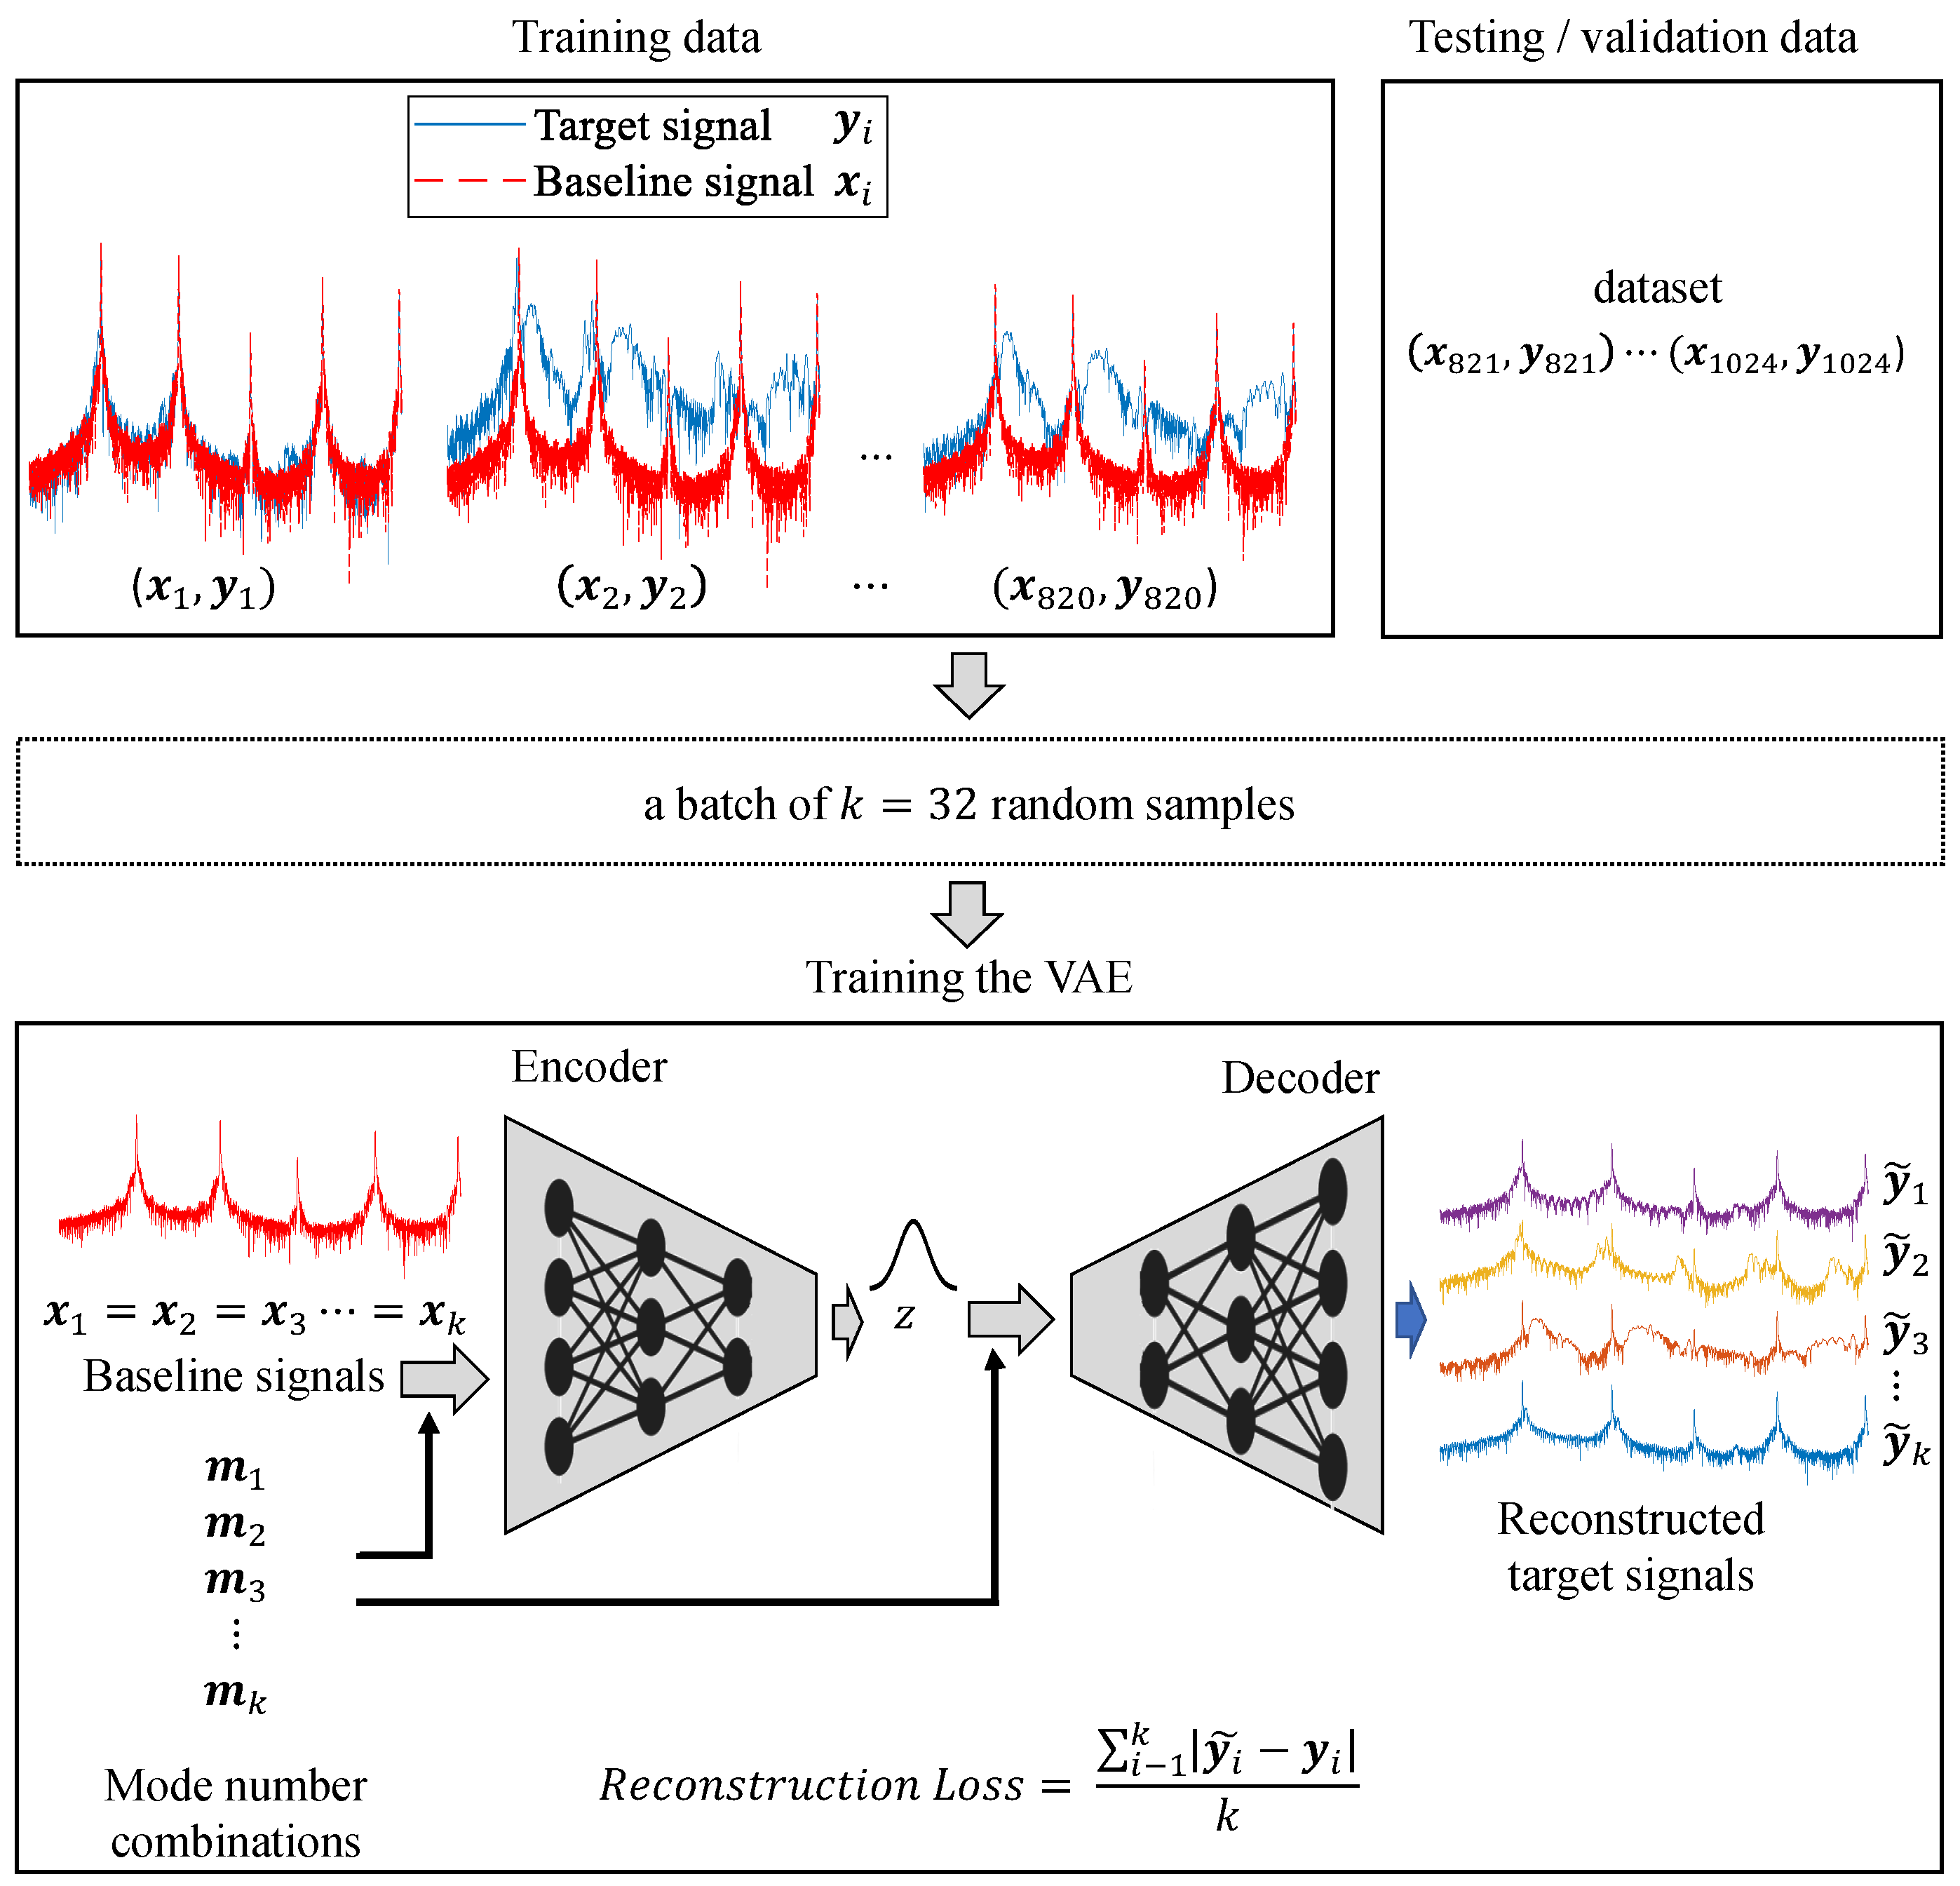
A total of 10 modes that contributed the most to the response signal when all modes were included in the simulation were selected. These are mode numbers {8, 9, 11, 13, 15, 16, 21, 22, 23, 24}. The 11th mode was mode 7, which was used to generate the baseline signal. For training and testing the VAE, the baseline signal and a dataset of samples of target signals with different mode combinations were simulated. These desired output or target signals were generated by, in addition to mode 7, including combinations of the said 10 mode numbers, taken 10 or fewer at a time. The VAE was trained using of this data (820 randomly selected signals), and the remaining (remaining 204 signals) were used for testing the model. The distance domain response signals obtained from applying dispersion compensation to the time domain responses were first normalized according to the amplitude of the reflection from weld A. The logarithm of the amplitude of the signals was then computed.
4.2. The VAE Architecture
Given a set of 820 baseline signals containing the contribution of mode 7 only, each denoted by vectors
where
is the length of the signal and a specified combination of modes; we want to train the VAE to fuse additional modes to each baseline signal. The distance domain baseline signals in
Figure 4 form the main inputs for our VAE. The second meaningful inputs are the mode numbers corresponding to the modes that should be included in the response. The VAE should be trained to approximate the target signals
with complexity introduced according to the combinations of modes given by vectors
. A batch size of
randomly selected samples was used for each training step. The VAE is trained by minimizing the reconstruction loss, which is the mean absolute error (MAE) between the original target
and the approximation
,
The VAE architecture used in this paper is illustrated in
Figure 6 and detailed in
Table 1. The design of this VAE architecture was guided by the nature of the input data, the task each layer could perform and reference [
33]. The architecture used in reference [
33] was for only one input variable and consisted of only three different types of layers: the Conv1D layers for extracting the underlying structure in the input signals, the Dense layers to decrease and increase dimensionality and to connect the encoder and the decoder through the latent space, and the Conv1DTranspose layers to apply a transposed 1D convolution operation. In this paper, we also include Embedding layers to capture the meaning and learn the interpretation of different mode combinations. This is achieved by placing similar inputs close together in the embedding space. We further included Concatenate and TimeDistributed Dense layers for dealing with the two input variables—the baseline signal and specified modes.
For each training step, the encoder receives as input sequences resulting from the concatenation of a batch of
…,
randomly sampled baseline signals
and the mode combination embeddings
. A TimeDistributed layer is then used to apply the same instances of a Dense layer to every temporal slice of the sequences. The encoder consists of a stack of three sequential Conv1D layers connected to a fully connected Dense layer with 150 nodes, which is then connected to two dense layers to approximate the mean
and the variance
of the 2D latent space as a normal distribution. The decoder samples from the 2D latent distribution
and increases the dimensionality of the data using two stacks of fully connected Dense layers, with 150 nodes and 150 × 2 nodes, respectively. A stack of three Conv1DTranspose layers is used to increase the dimensionality further. The generated sequences are then concatenated with the embedding layer and passed through a TimeDistributed Dense layer to approximate the target signals
containing the additional specified modes.
5. Results
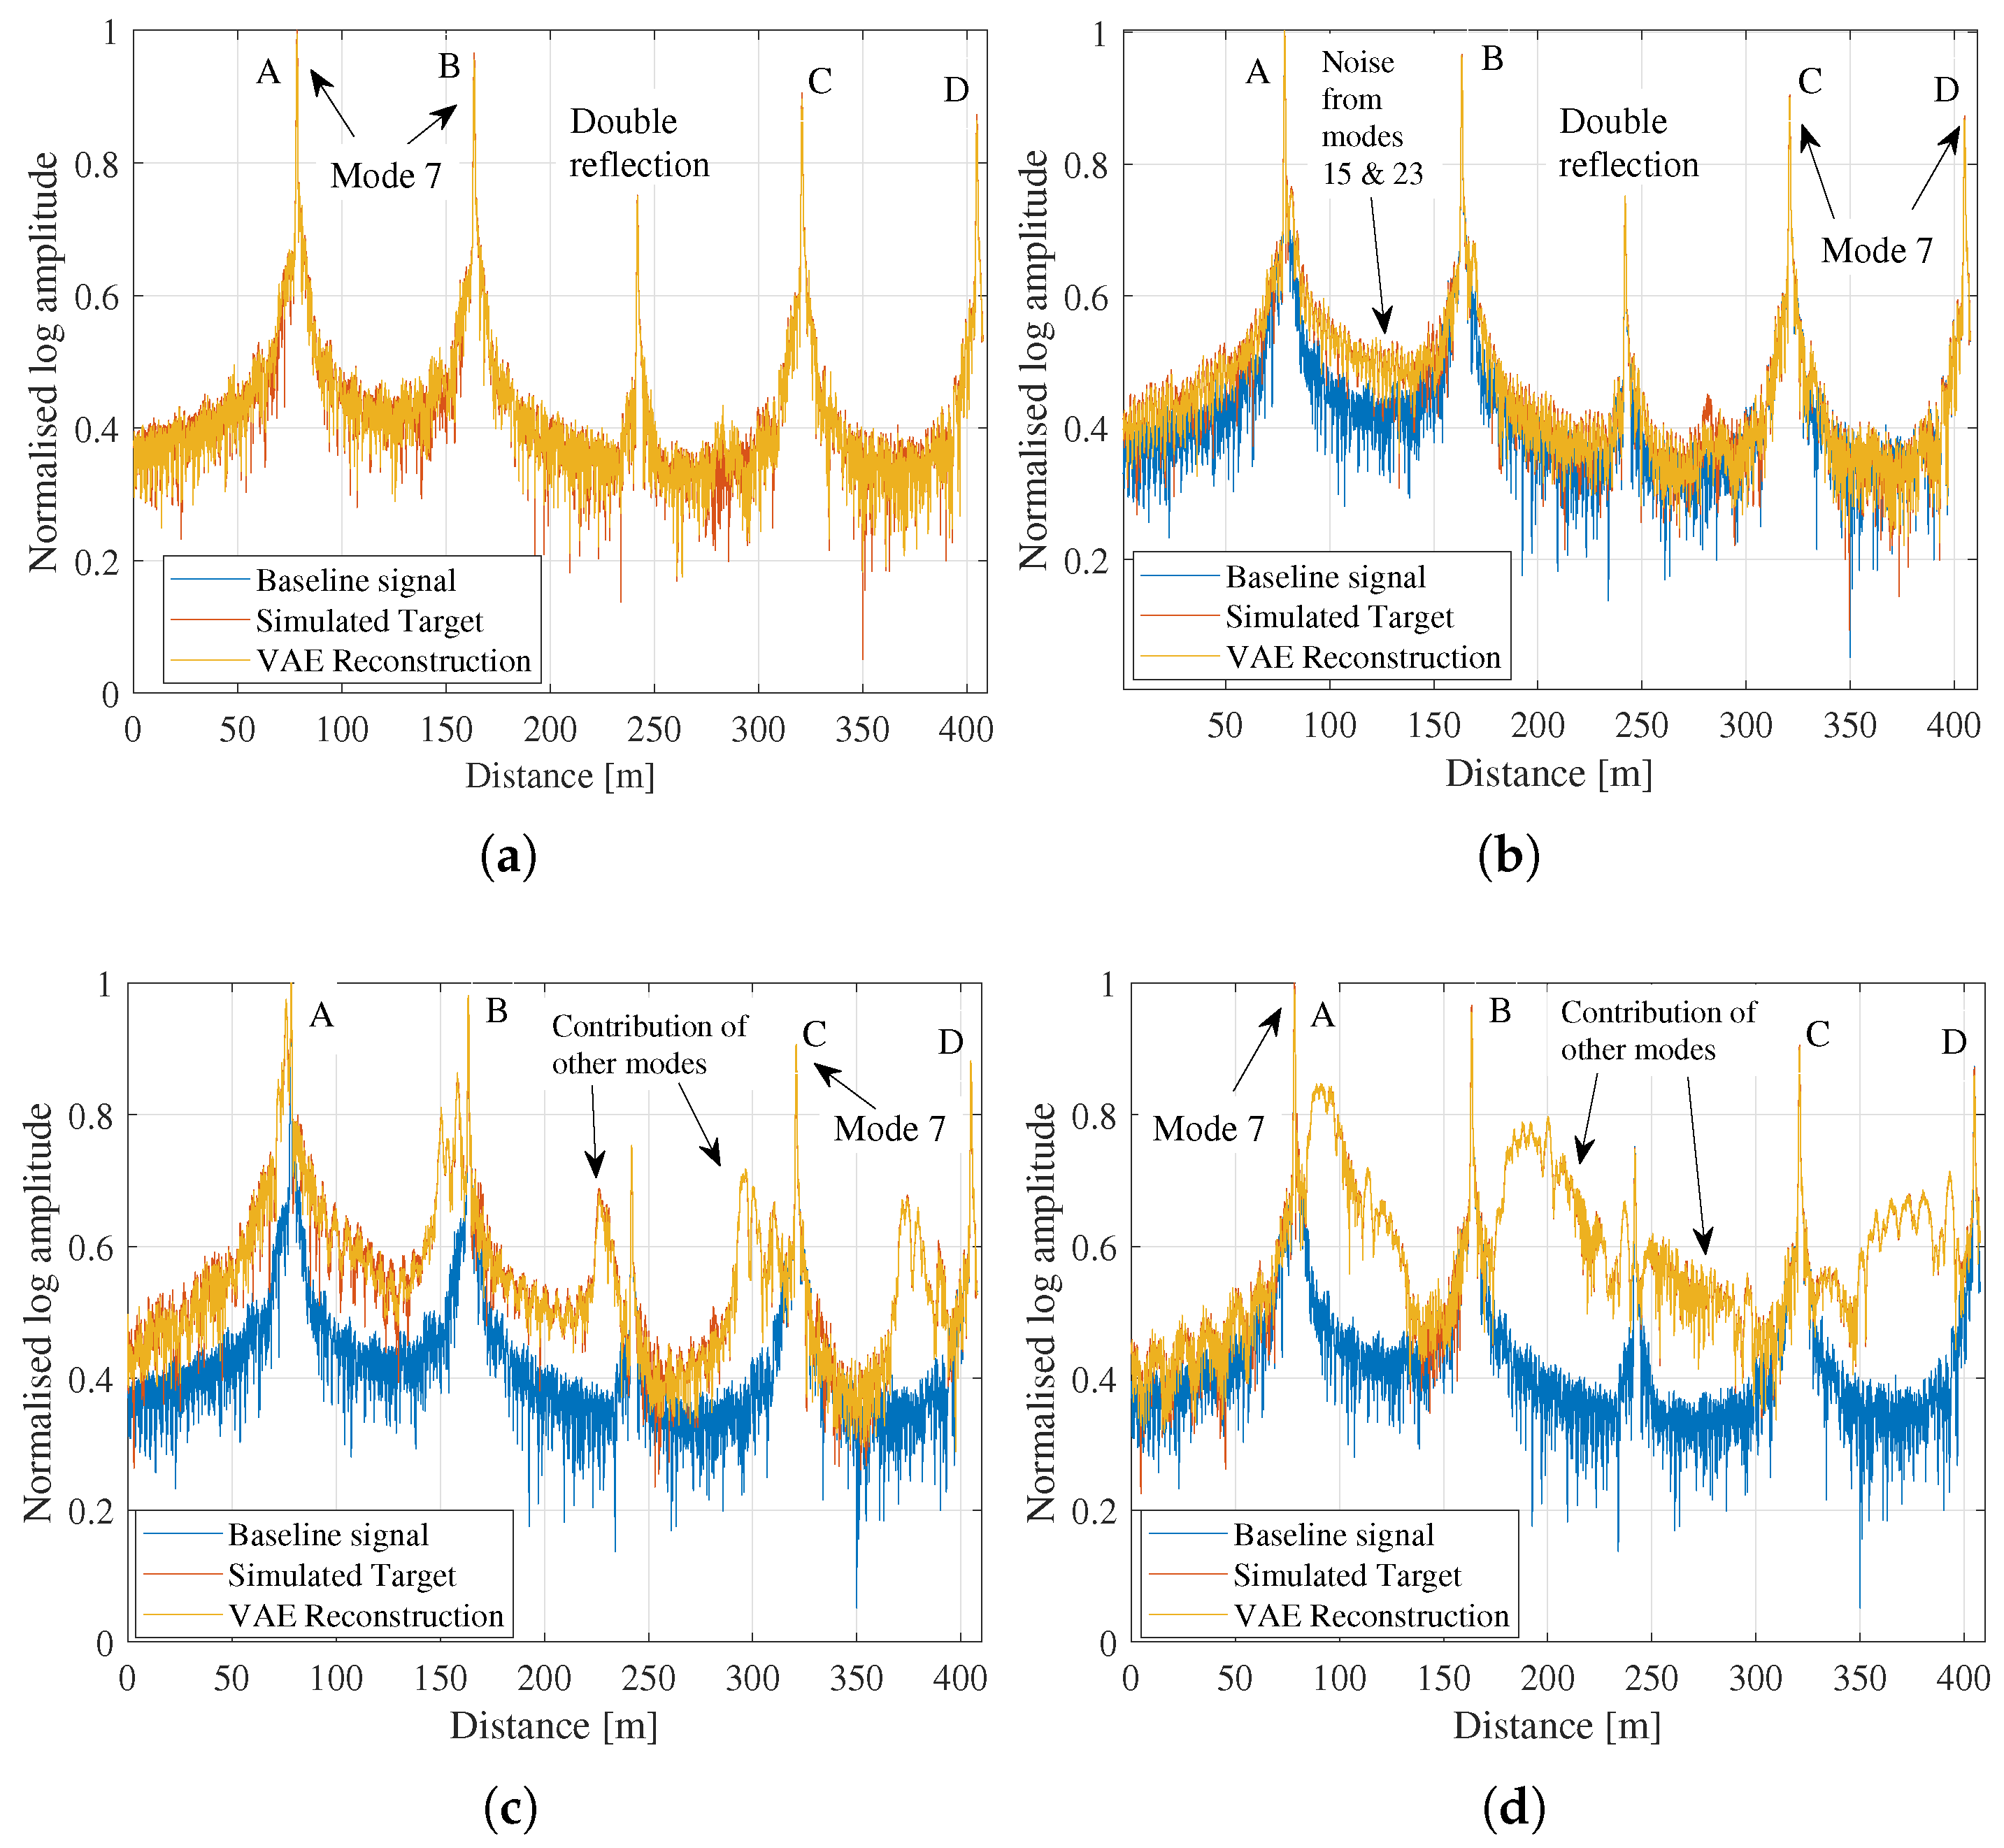
The results of the predicted inspection signals for different combinations of modes in the testing data are presented here. In
Figure 7, response signals reconstructed using a VAE model are compared to the original target responses for several cases of different mode combinations. The combination of modes that contributed to each response signal is highlighted in the figures.
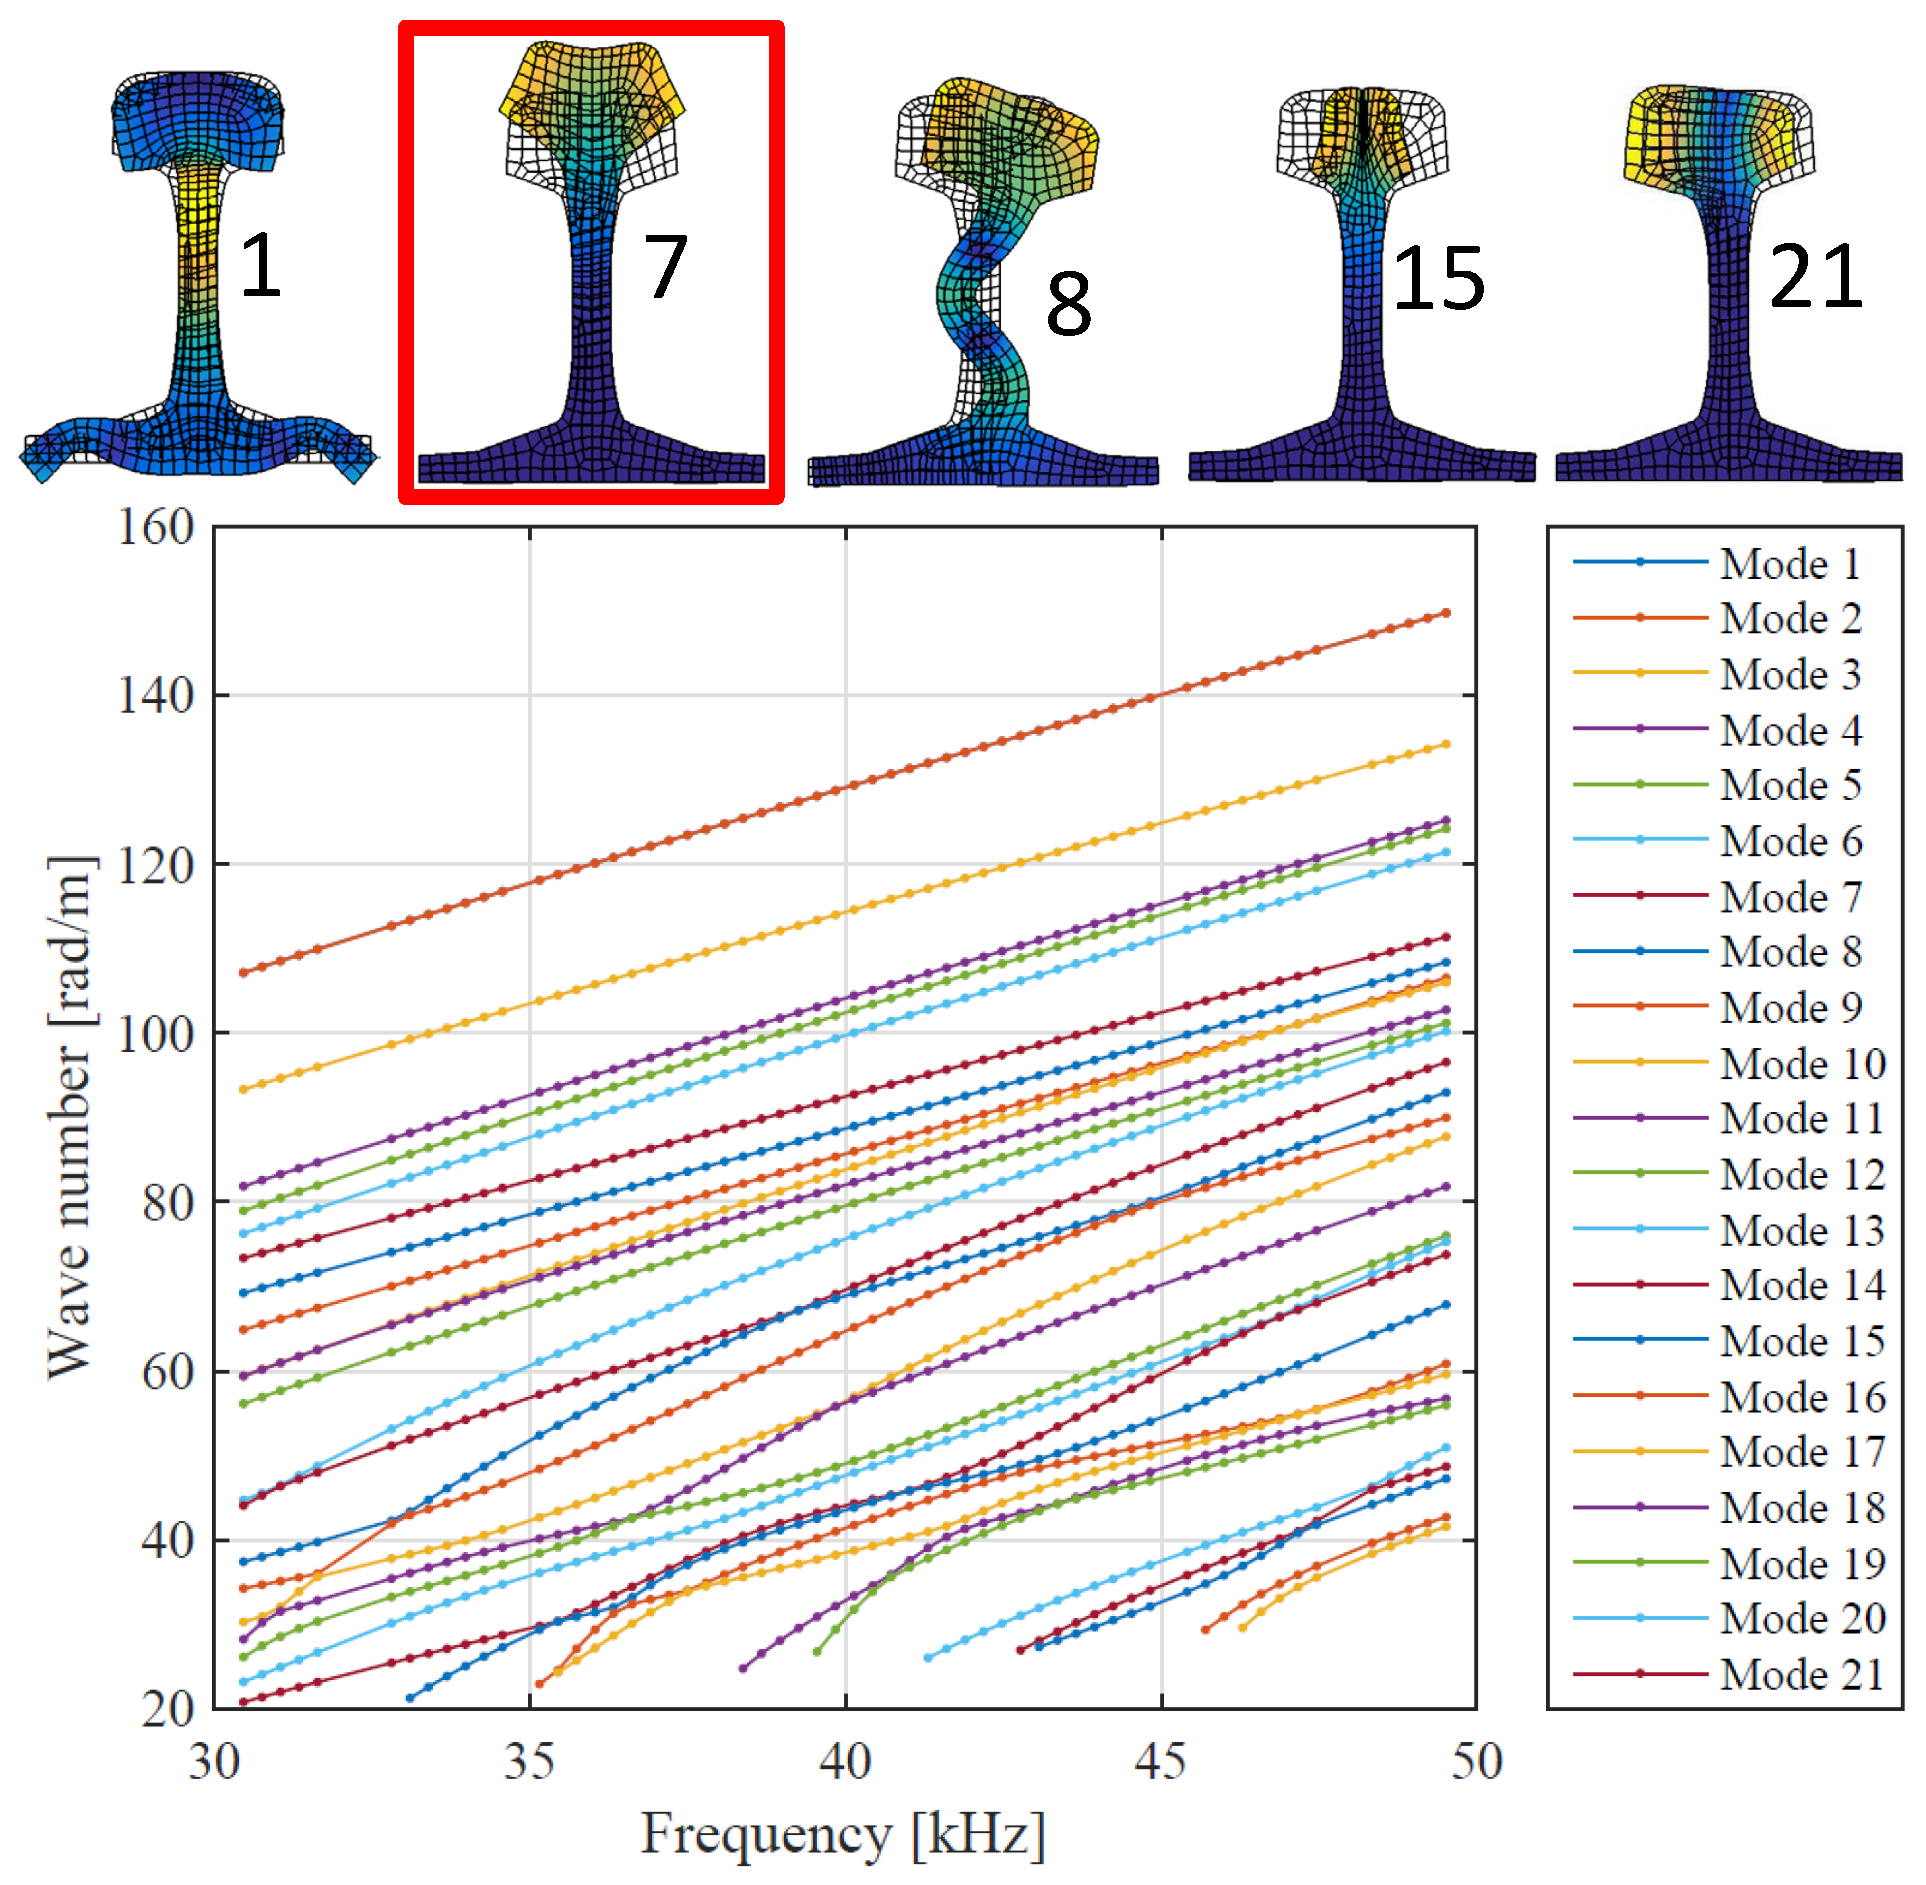
First, we notice that the VAE was able to capture the complex features in the reflected signals. For the rail set-up considered in this paper, the most dominant mode excited by the piezoelectric transducer is the least dispersive mode with energy concentrated in the head of the rail (mode 7), shown in
Figure 3. This mode was used to compensate for dispersion according to the procedure in [
18]. Hence, the mode is identified as a sharp peak in each reflection group. Other modes with energy in the head of the rail contribute to the response signals, as explained in detail in reference [
22]. Some of these modes exist individually, while others exist as coupled modes. These modes were not perfectly compensated for dispersion. Hence, their energies are spread out. In
Figure 7a–d, it is evident that the reflections from welds in the VAE reconstructed responses are comparable to the finite-element-simulated virtual experiment target. Furthermore, the VAE was able to reconstruct the double reflection located at ∼240 m, resulting from the reverberation of mode 7 between welds A and B, as shown in
Figure 7. In
Figure 7a, the original target and reconstructed result show that the specified modes, modes 9 and 11, did not have a significant contribution to the overall response. In
Figure 7b, the contribution of modes 15 and 23 to the overall response was also insignificant. These modes resulted in noise between the reflections from welds A and B.
Figure 7c,d illustrate a case where the reflections caused by additional modes are significant and overlap with other reflections.
Secondly, we notice that the VAE model successfully predicted inspection data by fusing more modes to the baseline signal. In all four cases of results considered, the reflection patterns associated with mode 7 and other contributing modes were well approximated.
The (mean absolute errors ) MAE for the VAE results compared to simulated targets in
Figure 7 are presented in
Table 2. For all the cases considered, the errors are very low, indicating that the VAE has a good reconstruction ability.
6. Conclusions
This paper attempts to develop a hybrid digital twin model that can predict inspection data for guided wave ultrasound in welded railway lines. The VAE model for predicting the inspection data containing different combinations of modes was presented. This task can be regarded as a tool to gain insight into the behavior of guided waves in different scenarios. The modes can interact with discontinuities in the rail in different ways, leading to different response signals. The tool can help the researcher understand better and interpret how each mode contributes to the total response. The researcher can then use this information, for example, to design transducers targeting specific modes, though the task can become computationally costly when physics-based models are used. The second objective of this paper is to demonstrate that once a variational auto-encoder is trained, it makes it possible to replace physics-based finite element models. The benefits of replacing a physics-based model with a data-driven model include increased efficiency and reduced computational costs. Physics-based finite element models are computationally expensive, especially in problems concerned with guided wave propagation, where the model has to be solved at discrete frequency points. The VAE model was given a baseline signal containing only one mode and trained to reconstruct an inspection signal with increased complexity by adding more modes. The training data were produced from a physics-based model that computes virtual experimental response signals using the SAFE and finite element procedures.
The VAE reconstructed response signals containing additional modes were nearly identical to the original target signals simulated using the physics-based model. The VAE was able to capture the complex features in the signals resulting from the interaction of multiple propagating modes in a multi-discontinuous waveguide. These complex features included reverberating reflections that resulted from the back-and-forth propagation of modes between welds A and B, though these reverberations are more significant when the inspection is in the web section of the rail. Overall, the VAE model successfully predicted inspection data by fusing reflections of mode 7 from welds with the reflection of other modes.
In conclusion, this study highlighted the benefit of a VAE in predicting inspection data with additional complexity. The proposed approach can be applied to different rail set-ups in terms of the types of discontinuities considered, the position of those discontinuities as well as different positions of the transducer. Whenever the researcher considers a different rail set-up, appropriate data for the problem at hand will be required, and the VAE will have to be trained using that data. The training for each rail set-up will result in a unique model for that scenario, though the same architecture can be used. The presented approach is only applied to simulated data since modal decomposition is impossible in experimental field data. In the future, the procedure will be adapted to predict inspection signals for damage evolution for varying EOCs and other complexities encountered in operational data.


