Article

Particle Cut Diameter Prediction of Uniflow Cyclone Systems with Fuzzy System Analysis

1
German Research and Development Center, LSTME Busan, 1276 Jisa-Dong, Busan 46742, Republic of Korea
2
Faculty of Engineering, Institute of Fluid Mechanics (LSTM), Friedrich-Alexander-University Erlangen-Nuremberg (FAU), Cauerstraße 4, 91058 Erlangen, Germany
*
Author to whom correspondence should be addressed.
Separations 2023, 10(6), 345; https://doi.org/10.3390/separations10060345
Submission received: 28 April 2023 / Revised: 31 May 2023 / Accepted: 2 June 2023 / Published: 5 June 2023
(This article belongs to the Collection Feature Paper Collection in Section 'Purification Technology')

Abstract

:
Cyclones are devices used in various industries to remove particulate matter from gases and liquids. Commonly used in the power generation, cement, and mining industries, cyclones improve the efficiency and longevity of equipment by removing dust and other small particles that can cause wear and damage. Among centrifugal separation, reverse-flow cyclones are primarily used for particle separation, which can reach heights of several meters on an industrial scale and therefore, are difficult to access for maintenance. A uniflow centrifugal segregation system avoids these drawbacks of reverse-flow cyclones since their accessibility is good and their height usually does not exceed their diameter. The efficiency is a critical aspect of separating systems. This study systematically examines the collection efficiency for particles ranging from 1 μ m to 29 μ m in diameter based on varying vane angles of the swirl inducer at flow rates ranging from 130 L s 1 to 236 L s 1 .

1. Introduction

Most emerging economies and industrialized nations are facing problems with fine dust pollution. In South Korea, extremely high fine and ultra-fine dust levels are experienced every winter and through out the spring [1]. Dust separators help to reduce the environmental impact of industrial operations by preventing the release of dust and other particles into the atmosphere [2,3]. The primary sources of fine and ultra-fine dust within the ambient air are fossil fuel combustion products [4] and road traffic effects such as tire and brake wear and suspension of road dust, especially under dry weather conditions [2,5]. Other natural sources, like dust storms, contribute to a higher fine dust concentration. To reduce the fine dust contamination of the environment and indoor contamination, fine dust must be collected before the release into the ambient air, which requires enclosed indoor air to be cleaned of the dust particle. Dust is classified scientifically according to particle size. Coarse particulate matter is defined as having a diameter d p between 2.5   μ m and 10 μ m [6]. While the fine particulate matter is defined as having a diameter smaller than 2.5   μ m , its size exhibits a significant health hazard. Further, ultra-fine dust is classified being smaller than 0.1   μ m . As a result, fine dust and ultra-fine dust contribute to various illnesses and health problems, including lung cancer, bronchial asthma, cardiovascular and cerebrovascular diseases, pulmonary mortality, arteriosclerosis, coronary heart disease, and early death [7].
Centrifugal separators, also called cyclones, collect fine and ultra-fine dust and are distinguished into two groups. First reverse-flow cyclones, most commonly known, have been widely researched during the last half of the previous century. Many tests with reverse-flow cyclones concerning the dependency of the efficiency from setup parameters have been conducted. Lapple and Stairmand [3] set the foundation of cyclone research in the 1950s. During their observations a particle cut diameter d p c of 1.38   μ m was achieved [8]. Dirgo [8] and Iozia [9], used vapor from mineral oil using a Laskin-Nozzle setup to generate aerosol particles. Unlike fine powders or dust, mineral oil droplets forms ideal sphere-shaped aerosol particles that do not re-entrain or rebound toward the cyclone wall. Furthermore, mineral oil droplets tend to agglomerate and deliver therefore commonly a better result in terms of particle cut diameter d p c and cyclone efficiency η . On the other hand, mineral oils can clog sensors or cover lenses from optical measurement devices, such as particle size analyzers and filters. Due to the solid nature of fine and ultra-fine dust particles, which can have different chemical compositions, they are rinsed off easily with water or ethanol from experimental setups while cleaning the system. Therefore fine and ultra-fine dust used as test dust exhibits benefits. In uniflow cyclone systems, the particle-laden flow does not change the flow direction, as is the case for reverse-flow cyclones. The main flow direction is parallel to the cyclone axis, and a swirl inducer or tangential inlet introduces the rotational motion of the gas. In this way, turbulence and pressure drop can be reduced [10]. Since the pressure drop of a cyclone system is proportional to the energy required for guiding contaminated gases through the cyclone, reducing the pressure drop of a cyclone is essential to design a highly efficient system. The particle cut diameter is a measure of the efficiency of a cyclone system. It is defined as the particle size of which 50% are separated, while 50% of the particles exit the separation system. Predicting the particle cut diameter in dependence on experimental data, reduces the total time of measurements necessary and supports the adjustment of the process parameter. Fuzzy logic system analysis, as part of machine learning [11], is an established method to build a predictive tool. It is a theory developed in the 1965s by Lotfi Zadeh, a professor at UC Berkeley. Unlike binary logic, fuzzy logic is variable-valued logic, where the degree of truth can represent any number between 0 and 1. Many applications in daily life use fuzzy logic, such as washing machines, air-conditioning systems, and subways [12]. Other examples are sheet rolling control in food processing [13], prediction of rainfall in particular regions using weather data [14], or surface roughness prediction based on milling machines parameters [11]. Fuzzy logic is used for process controlling and prediction based on limited amounts of data, which makes it an valuable method for predicting parameters. The aim of this work is to proof the excellent separation capabilities of uniflow cyclones in comparison with reverse-flow cyclones and to develop a prediction tool based on the experimental data using a fuzzy logic approach.

2. Materials and Methods

2.1. Experimental Setup and Velocity Measurements

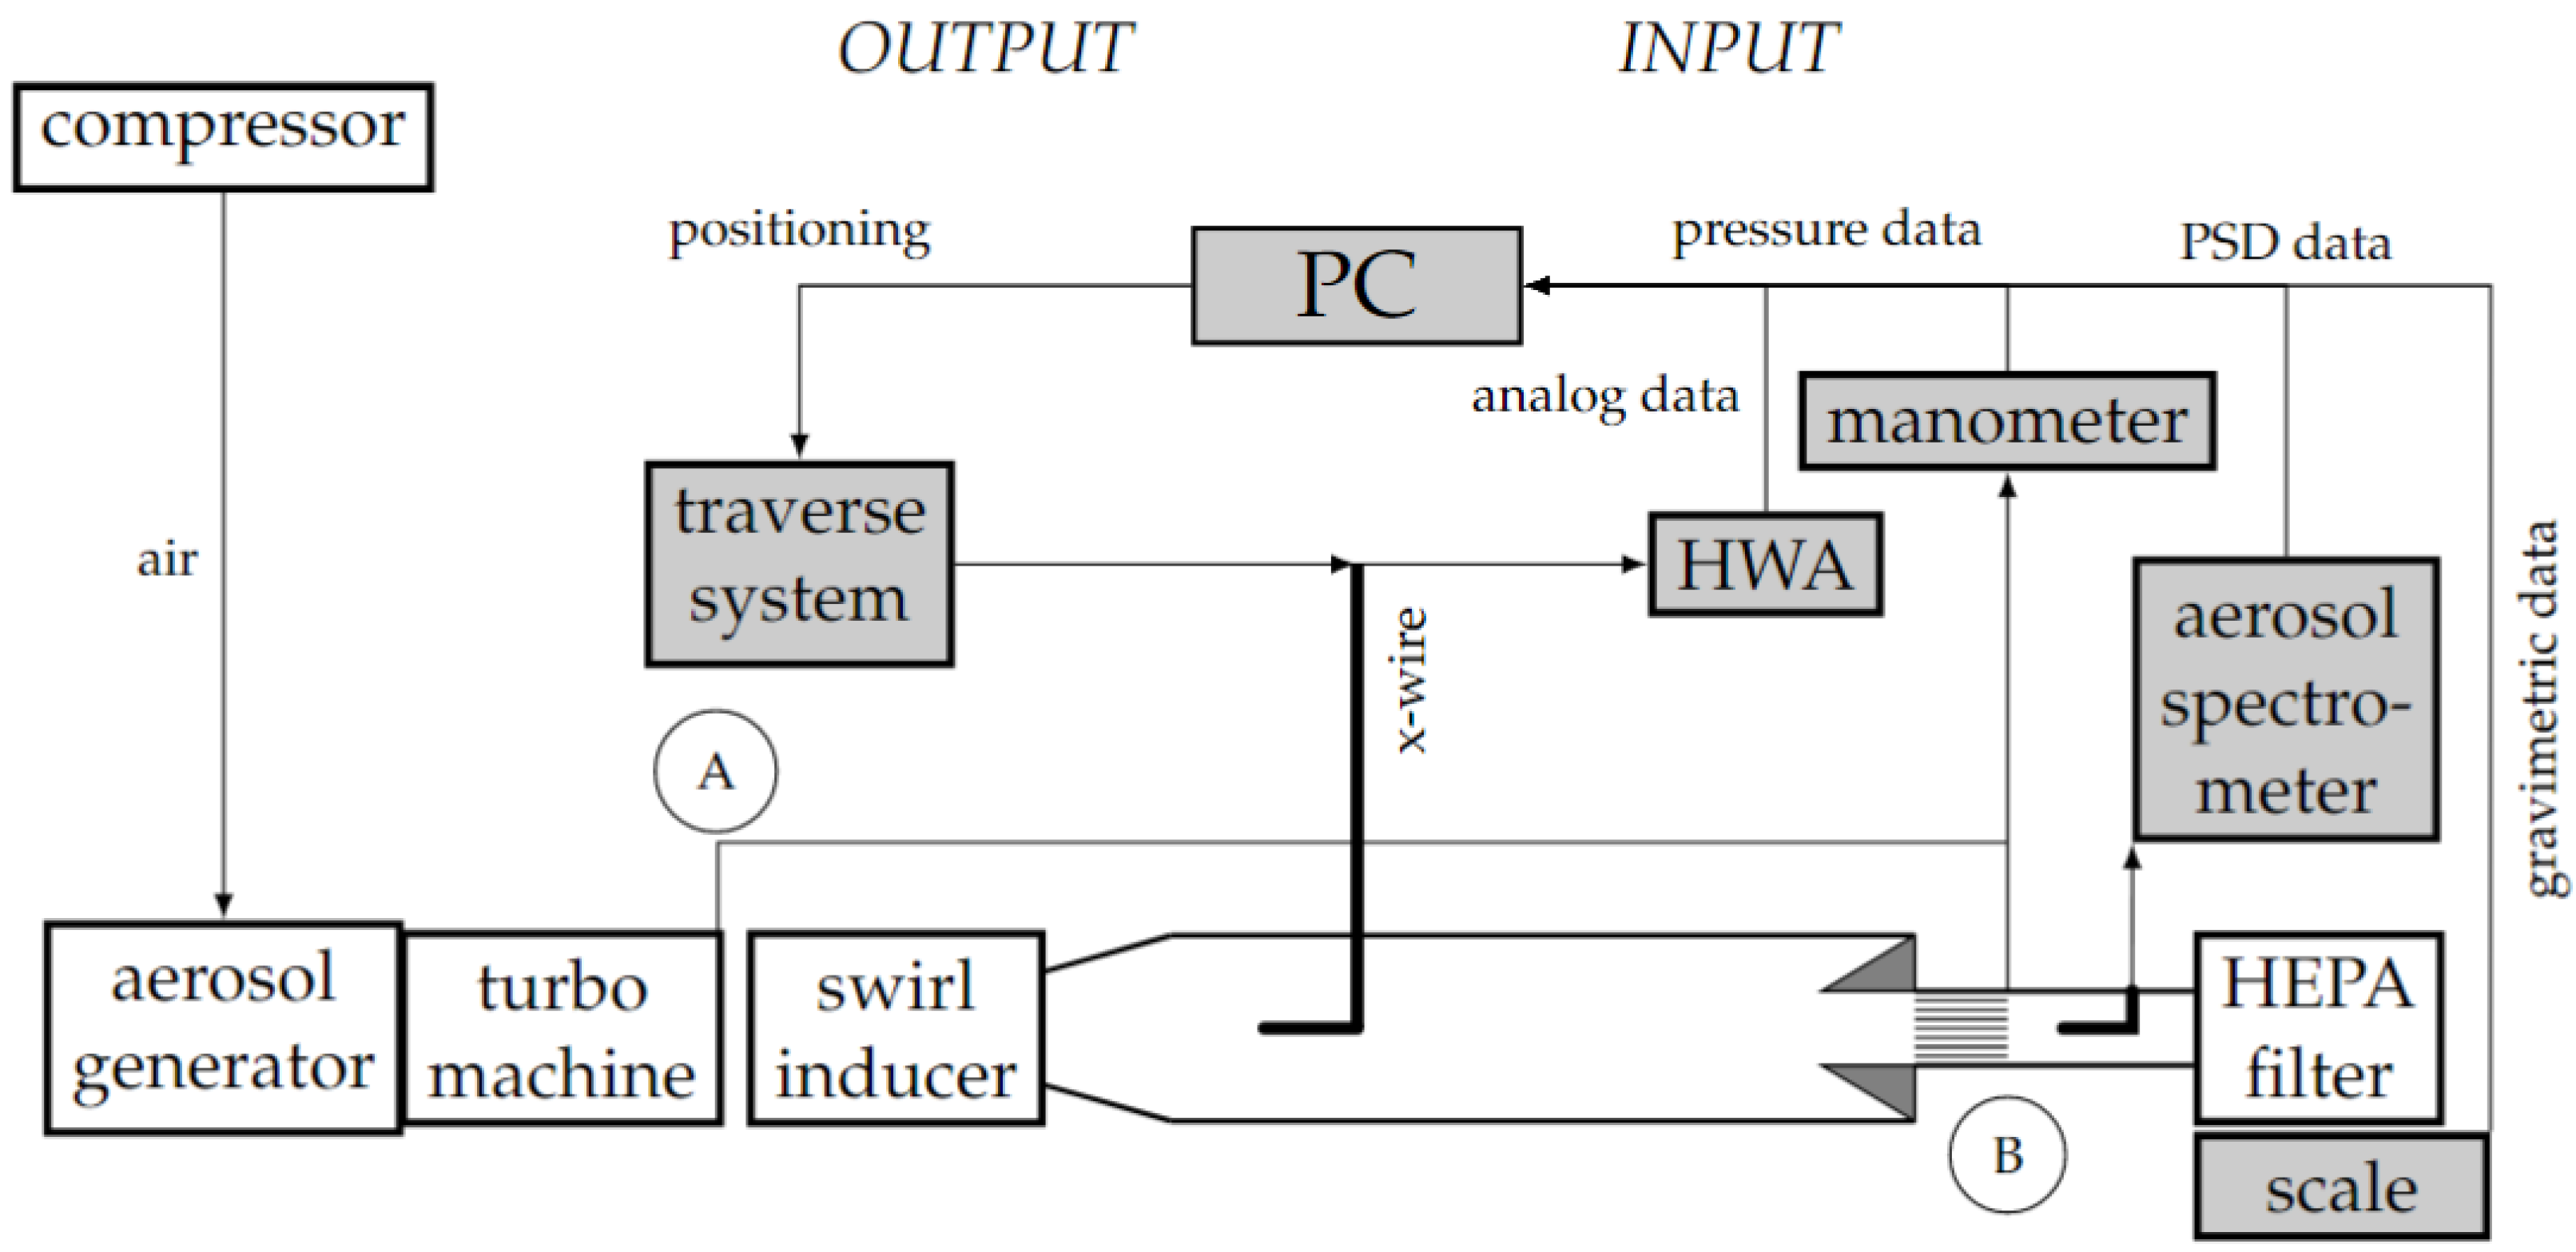
For the experimental measurements an uniflow cyclone system, consisting of a particle feeder, an axial blower, a separating chamber and a highly efficient particulate air filter (HEPA)-filter is set up. An axial rotating gas behind the blower (GBL80320, Greenworks©, Changzhou, China) [15] is further amplified in its rotating motion by swirl inducers with different vane angles β v . Each of the five swirl inducers are designed with four curved vanes that guide the air into the system (Figure 1). A diffuser connects the swirl inducer section point A (Figure 2) with the separation chamber. The separation chamber consists of a poly-acrylic tube (wall thickness = 5 m m , inner diameter = 150 m m , length = 1000 m m ). The flow is guided though the separation chamber into a hollow conical-shaped outlet duct point B (Figure 2), which consists of a FDM-printed annular cone connected with a poly-acrylic tube (wall thickness = 2 mm, inner diameter = 86 mm, length = 500 mm).
Inside the outlet tube, a multi-channel structure (length = 50 mm, channel diameter = 5 mm) is installed as a flow straightener, which reduces the rotation of the flow and conditions the air stream for distribution measurement with a particle spectrometer (Promo 2000, PALAS GmbH, Karlsruhe Germany). To prevent fine and ultra-fine dust particles from leaving the experimental setup and entering the environment, a HEPA-filter (SC-FIS-CT 26, Festool GmbH, Wendlingen, Germany) seals the end of the outlet tube.
The geometric parameters that characterize the swirl inducers, namely vane angle β v , twist ratio l d , pitch length l p and geometrical swirl number S g are given in Table 1. Labels are given with VA0 to VA60 based on the value of the vane angle β v of the swirl inducer. The geometrical swirl number S g is calculated as
S g = 2 3 1 d h u b / d i n 3 1 d h u b / d s 2 tan β v ,
following Litvinov [16]. Where d i is the diameter of the inlet, d s is the swirl tape diameter, d h u b is the diameter of the hub, and β v is the vane angle of the swirl inducer. A vane angle β v of 0 ° named as VA0, is used as a label for the setup without a swirl inducer. Each swirl inducer is separately placed between the axial turbo machine and the diffuser, connecting the separation chamber.
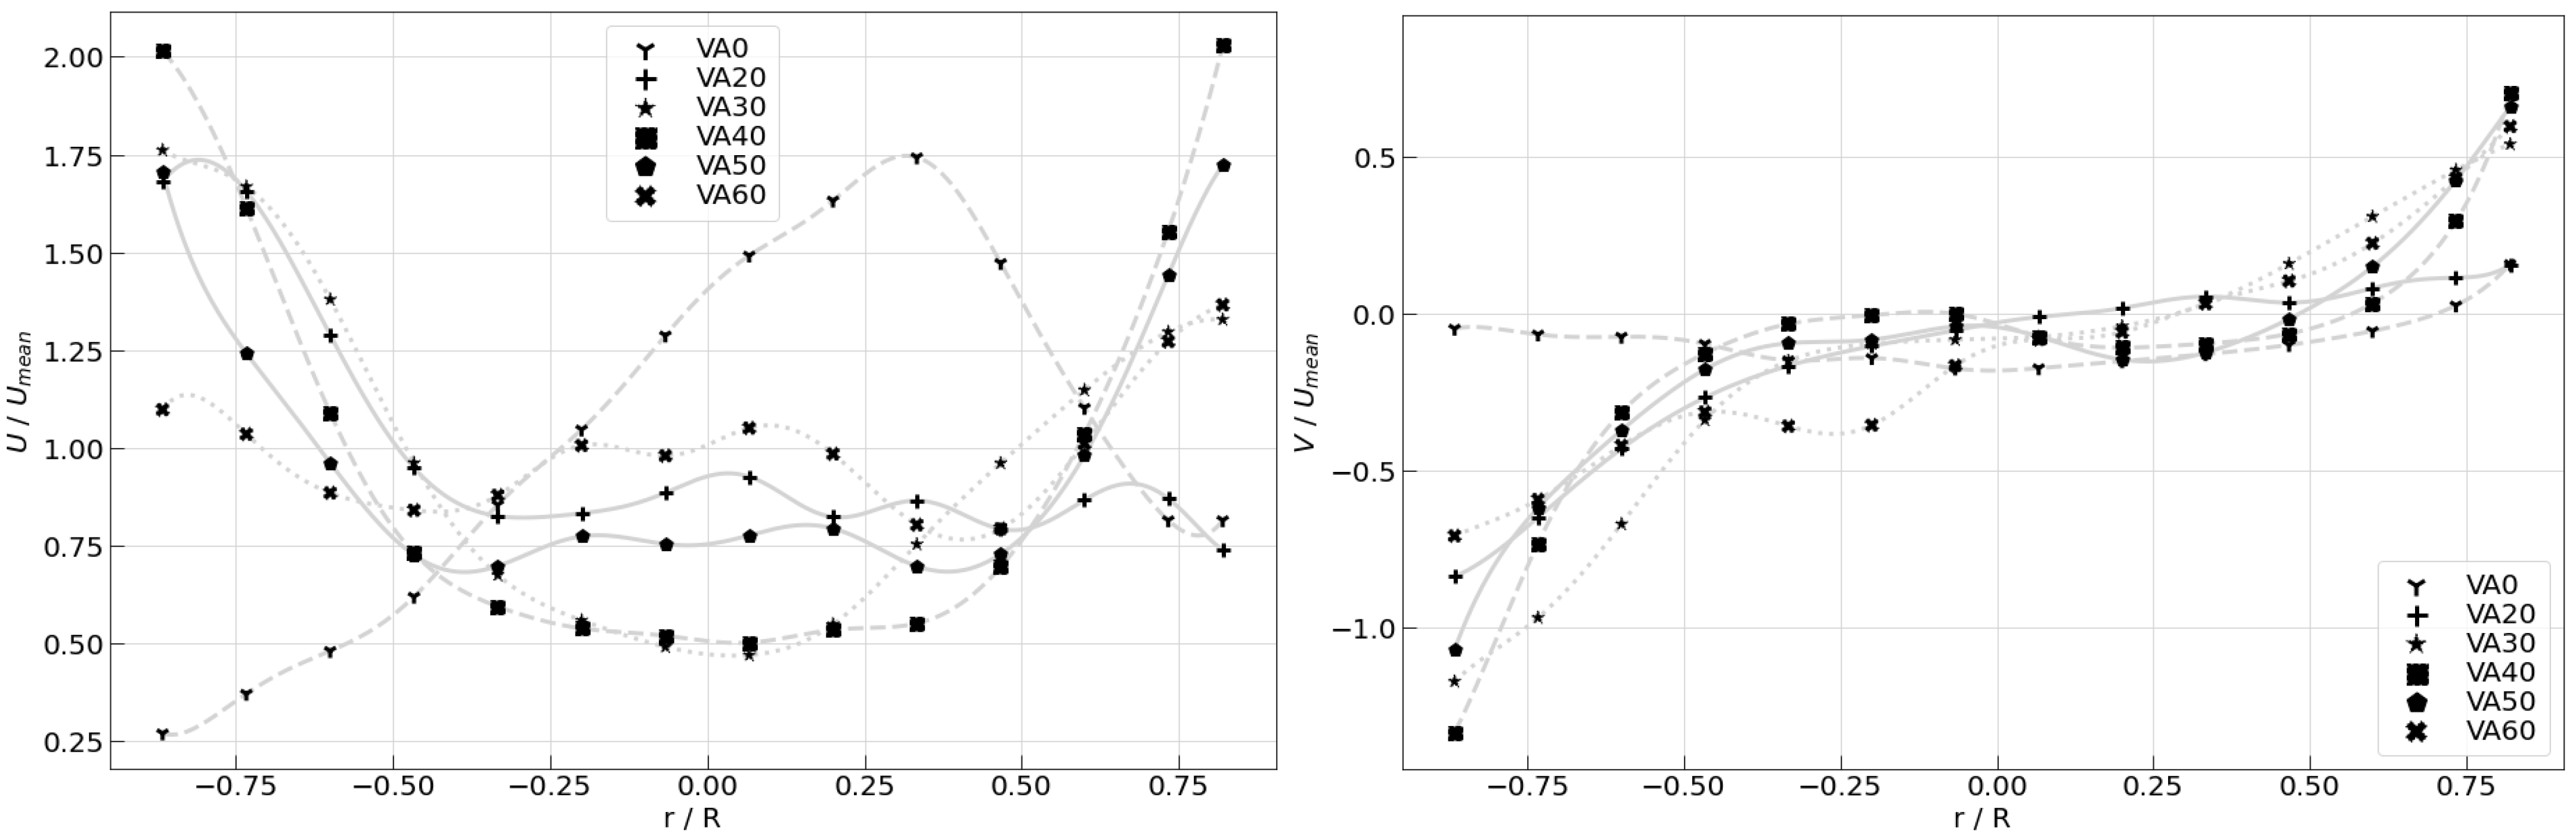
Prior to the fractional distribution measurements inside the outlet of the uniflow cyclone, the velocities at the entrance of the separation chamber are measured along the diameter of the tube with a Hot-Wire-Anemometer (Dantec Dynamic A/S, Skovlunde, Denmark) to quantify the intensity of rotation caused by each swirl inducer. The velocity measurements are conducted using an L-shaped probe holder fitted with an X-probe. The X-probe is positioned 250 m m from the swirl inducer and is guided into the separation chamber through a slot in the tube.
During the separation investigations, 18 setup configurations are examined, and the fractional separation efficiency is analyzed. While six different swirl inducer settings are applied, the volumetric flow rate V ˙ is changed in three steps between 0.130   m 3 s 1 to 0.236   m 3 s 1 . The Reynolds number R c is calculated as
R e c = v i n · d ν
using the mean axial velocity of the fluid v i at the entrance of the separation chamber of the cyclone, ν as the kinematic viscosity of the fluid and d i the diameter of the inlet [
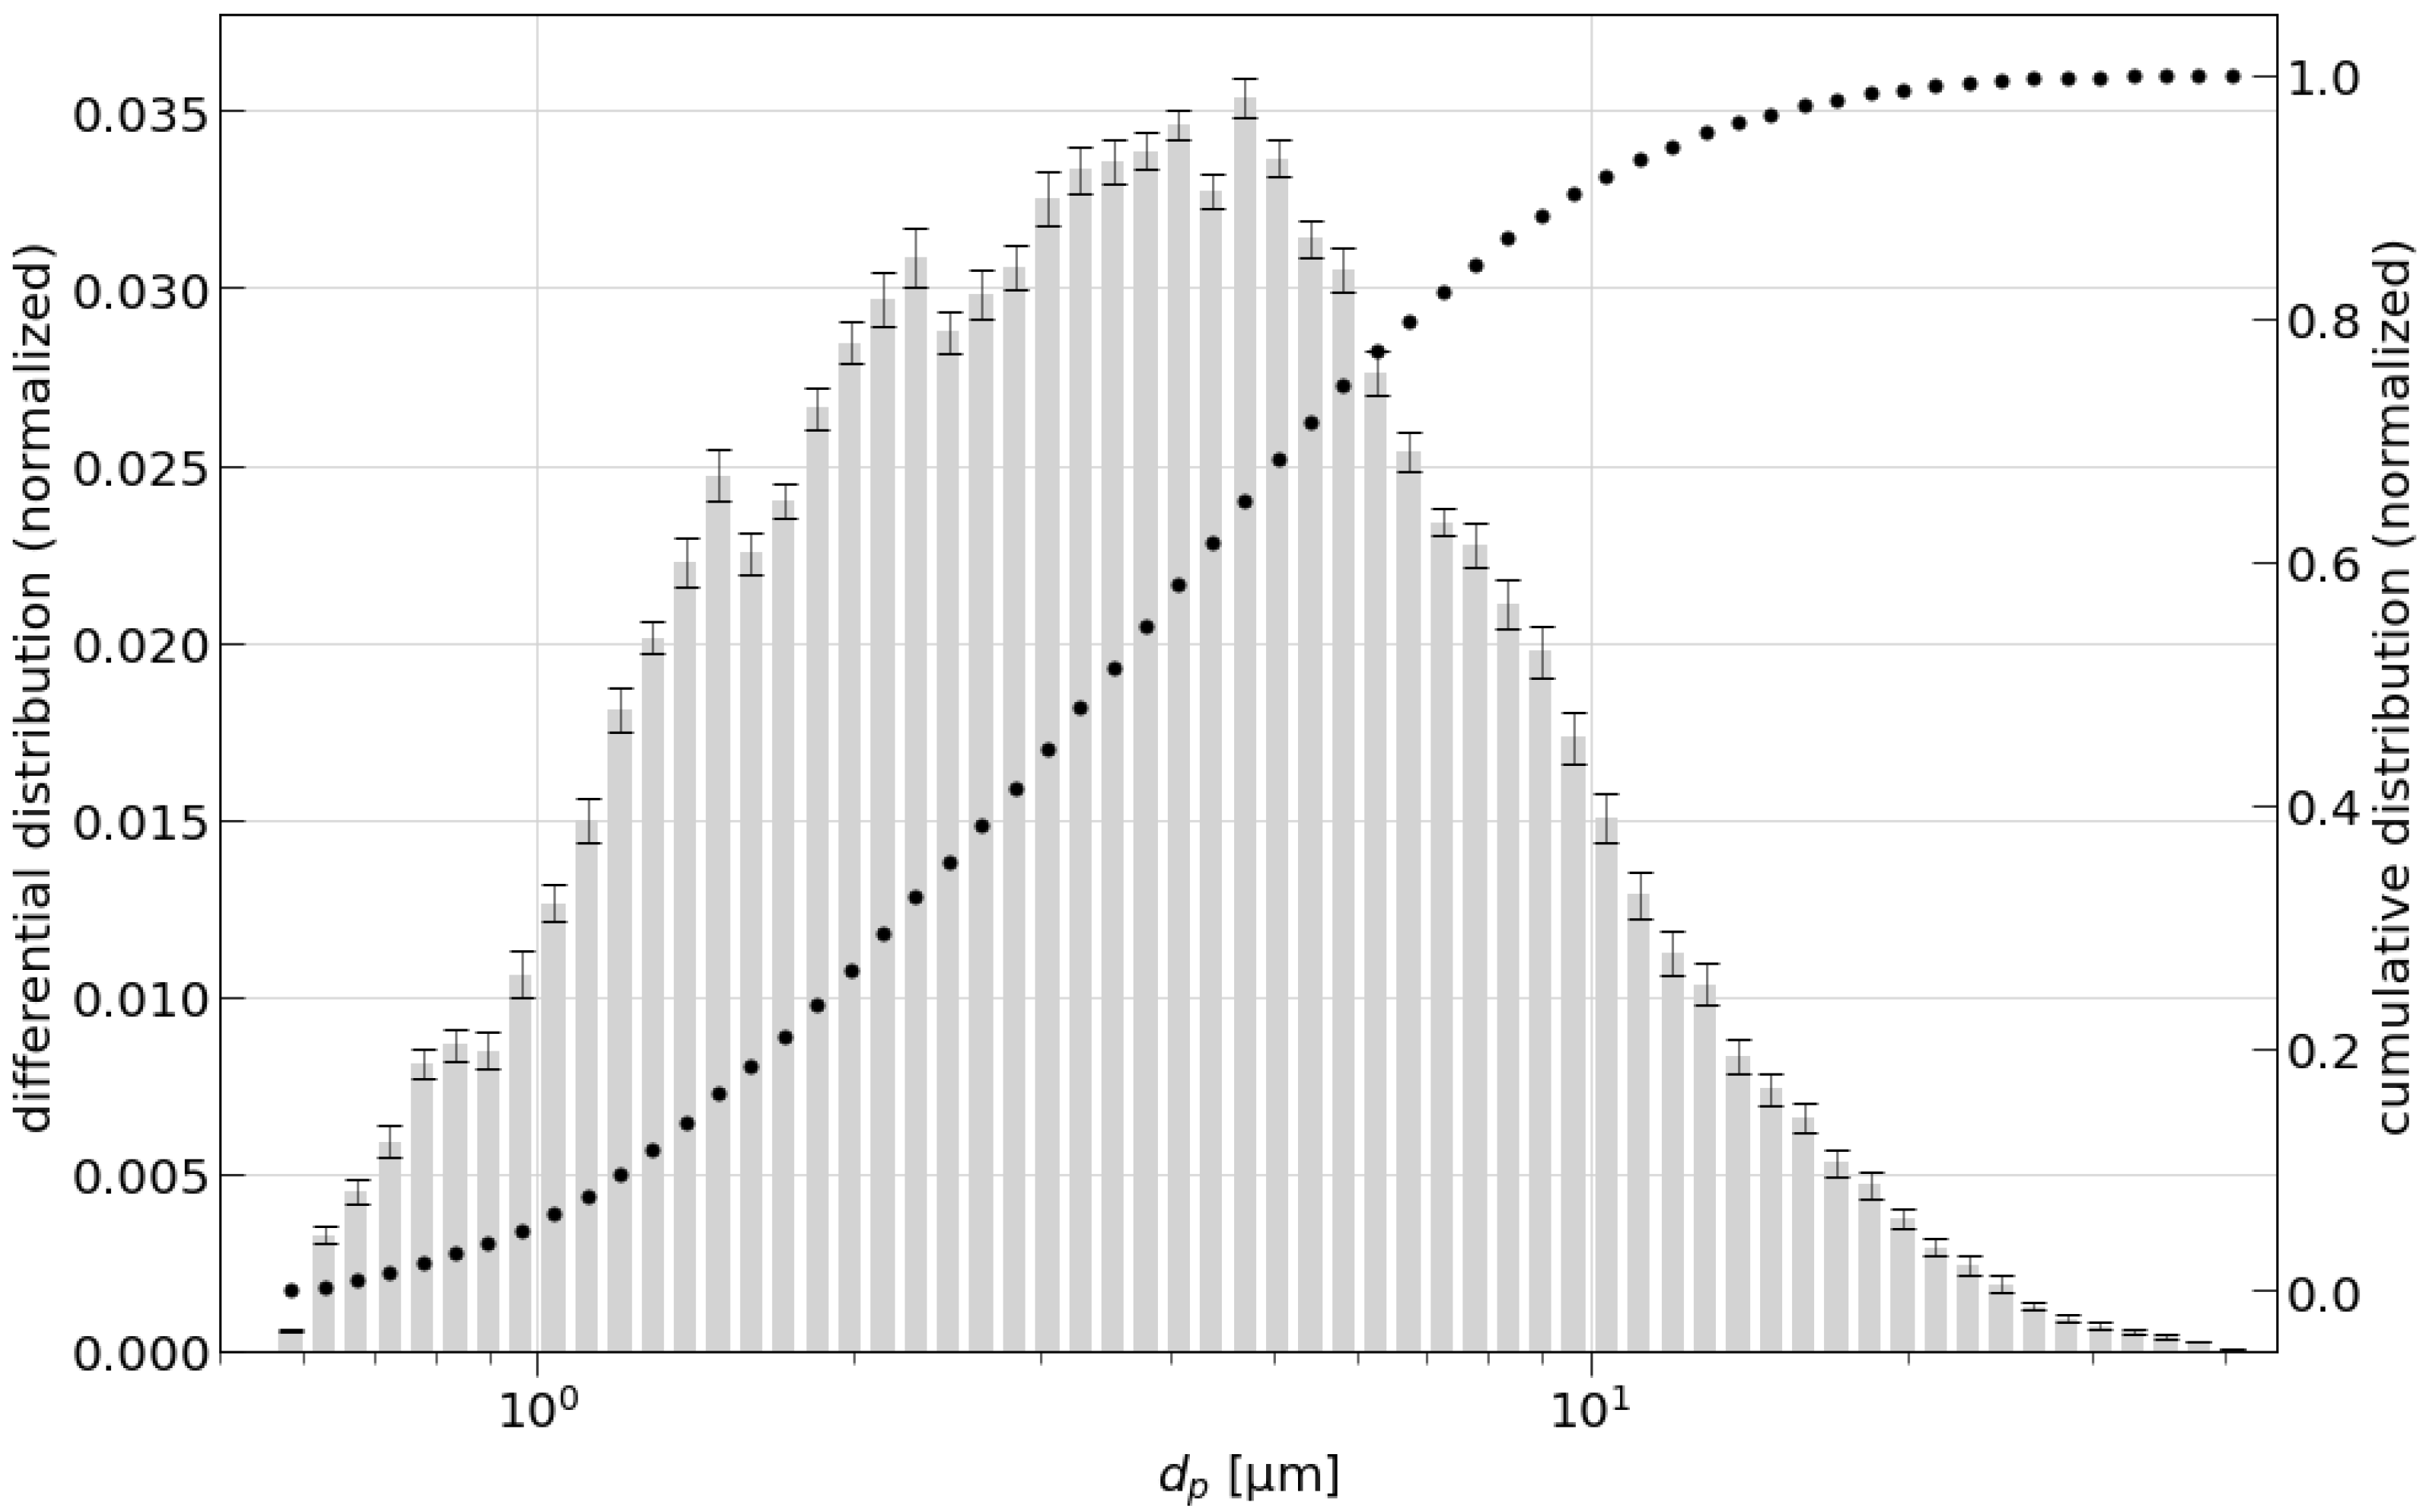
17]. The particle size distribution of the ultra-fine test dust (A1—Arizona test dust, Powder Technology Inc.©(PTI), Arden Hills, MN, USA), with a bulk density of ρ b = 500 k g m 3 and a particle density of ρ p = 2650 k g m 3 , is initially analyzed with a light-scattering aerosol spectrometer. The analysis of the test dust provided a mean particle size distribution in a particle size range of 0.5   μ m to 40 μ m , which matches the information in the data sheet provided by the supplier.
An aerosol generator with a rotating brush distributes the fine particles into the air stream. The brush transports the particulate matter from the reservoir of the aerosol generator into a pre-loaded air stream before it is released into the inlet of the turbo machine.
Next, the particle-laden gas undergoes a diffuser-controlled expansion, significantly reducing its velocity. The rotating motion caused by the swirl inducer originates centrifugal forces on the gas and particles within and further leads to a trajectory of the fine dust particles towards the cyclone wall. In the particle theory, these particles have a stokes number of S t k > > 1 [18]. For the simplicity of the design and a stable rotating flow, the separated particles are collected in the annular space between the cyclone and the conical outlet. This is possible due to the low particle load. Fine dust particles with a stokes number of S t k < < 1 remain within the gas flow and leave the separation chamber until finally collected inside the HEPA-filter. The pressure drop Δ p is measured over the cyclone between Point A and B shown in Figure 2, specifically over the inlet, the diffuser, the separation chamber, and the outlet, using a digital differential pressure sensor (SDP 810, Sensirion AG, Stäfa, Switzerland) with a bidirectional pressure range of Δ p = ± 600 Pa . The two pitot tubes used for the pressure drop measurement are placed in the center of the inlet and outlet tubes along the cyclone axis. Straightening fins behind the axial blower inside the inlet tube and the flow straightener inside the outlet tube are conditioning the flow for a correct pressure measurement. The recording is conducted with a sampling rate of 10 m s and a measurement period of 10 s .

2.2. Particle Separation Efficiency Measurements

Prior to the particle distribution measurements at the outlet of the uniflow cyclone, several pre-trials were performed to charge the cyclone walls with fine dust particles in order to minimize electro-static effects between cyclone wall and fine particles during the measurements. To calculate the separation efficiency and the particle cut diameter d p c of each of the swirl inducer configurations for the respective flow velocities, three measurements for each of the 18 process parameter settings are performed. Prior to and after each measurement, the weight of the fine test dust in the aerosol generator, and the weight of the HEPA-filter is determined to calculate the total weight of the fine dust particle m i n entering the system and the total weight of the particles m f that are leaving the system during the experiment and remain in the HEPA-filter. The fine dust powder injection, using an aerosol generator at the cyclone inlet, was performed at an average concentration of c i =   16.2   m g m 3 . The particle spectrometer analyzes the particle size distribution of the air stream entering the filter media during each trial for 120 s . With the known particle size distributions f i n of the fine dust (compare Figure 3) and the distribution of the particles that are leaving the uniflow cyclone f o u t , the fractional separation efficiency of a given particle size range is calculated using Equation (3) given by Faulkner [19]
η i = m i n · f i n , i m f · f o u t , i m i n · f i n , i .
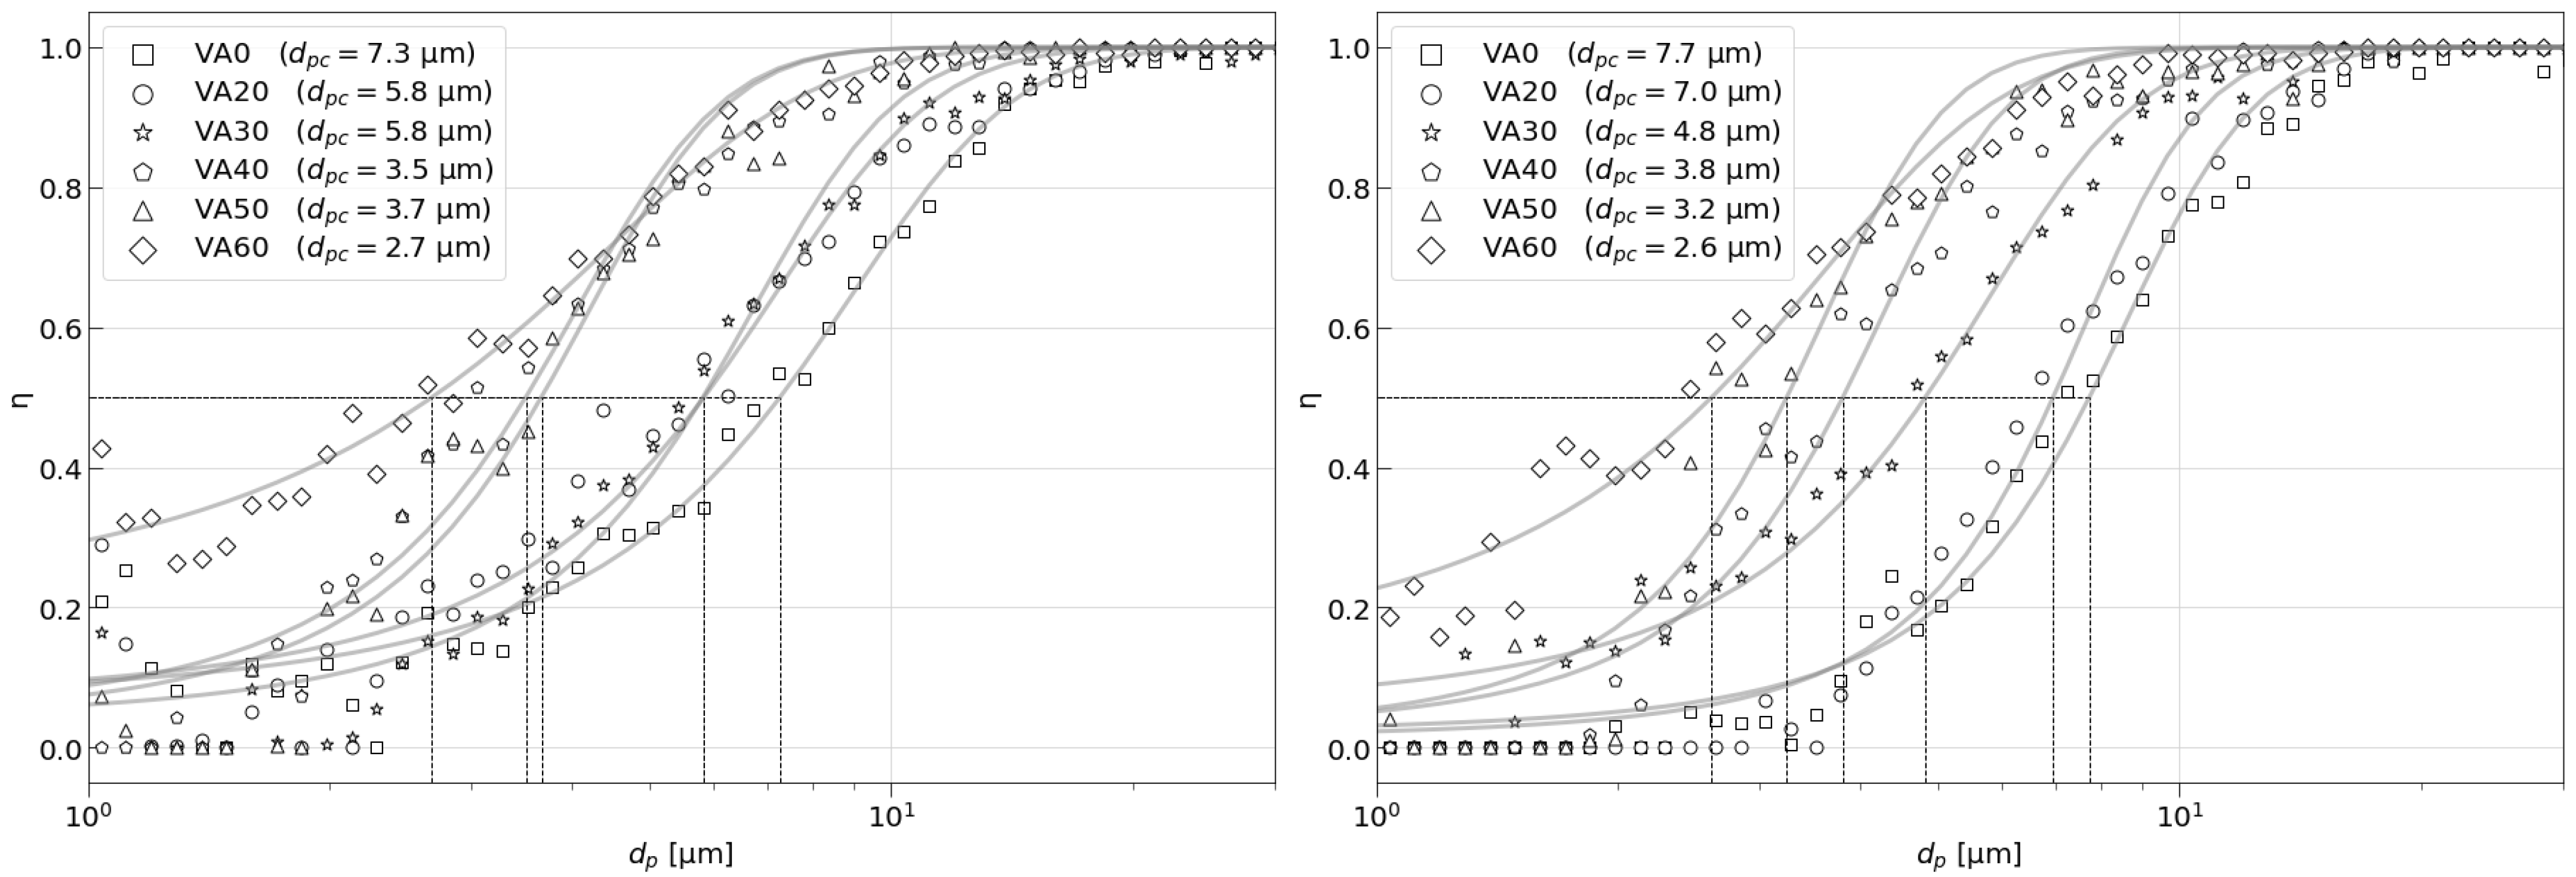
The fractional separation efficiencies calculated are displayed as a fractional separation efficiency curve, where the particle cut diameter d p c is calculated using an approximated logistic function proposed by Iozia and Leith [9]. The approximation of the logistic curve and the visualization of the data were conducted using Python.

2.3. Fuzzy Logic Prediction Model

In the fuzzy logic theory, knowledge is interpreted as a collection of elastic or equivalent fuzzy constraints on a collection of variables [20]. Compared to a crisp or binary set with clear boundaries, a fuzzy set is described in grades [21]. In a fuzzy set, close values have similar grades of membership and are therefore less prone to errors. More advantages of fuzzy logic models compared to other predictive models such as machine learning predictive models, are the clearness of the structure and that it is feasible also when the amount of data is scarce. In the case of the experimental data, the input parameters for a fuzzy system is represented by the pressure drop Δ p and the respective vane angle β v of the swirl inducer, which is described in a fuzzy set. The particle cut diameter d p c is a measure for the overall efficiency of the cyclonic system in relation with a specific particle size d p . Consequently the particle cut diameter d p c will be the output variable of the proposed fuzzy system (Figure 4).
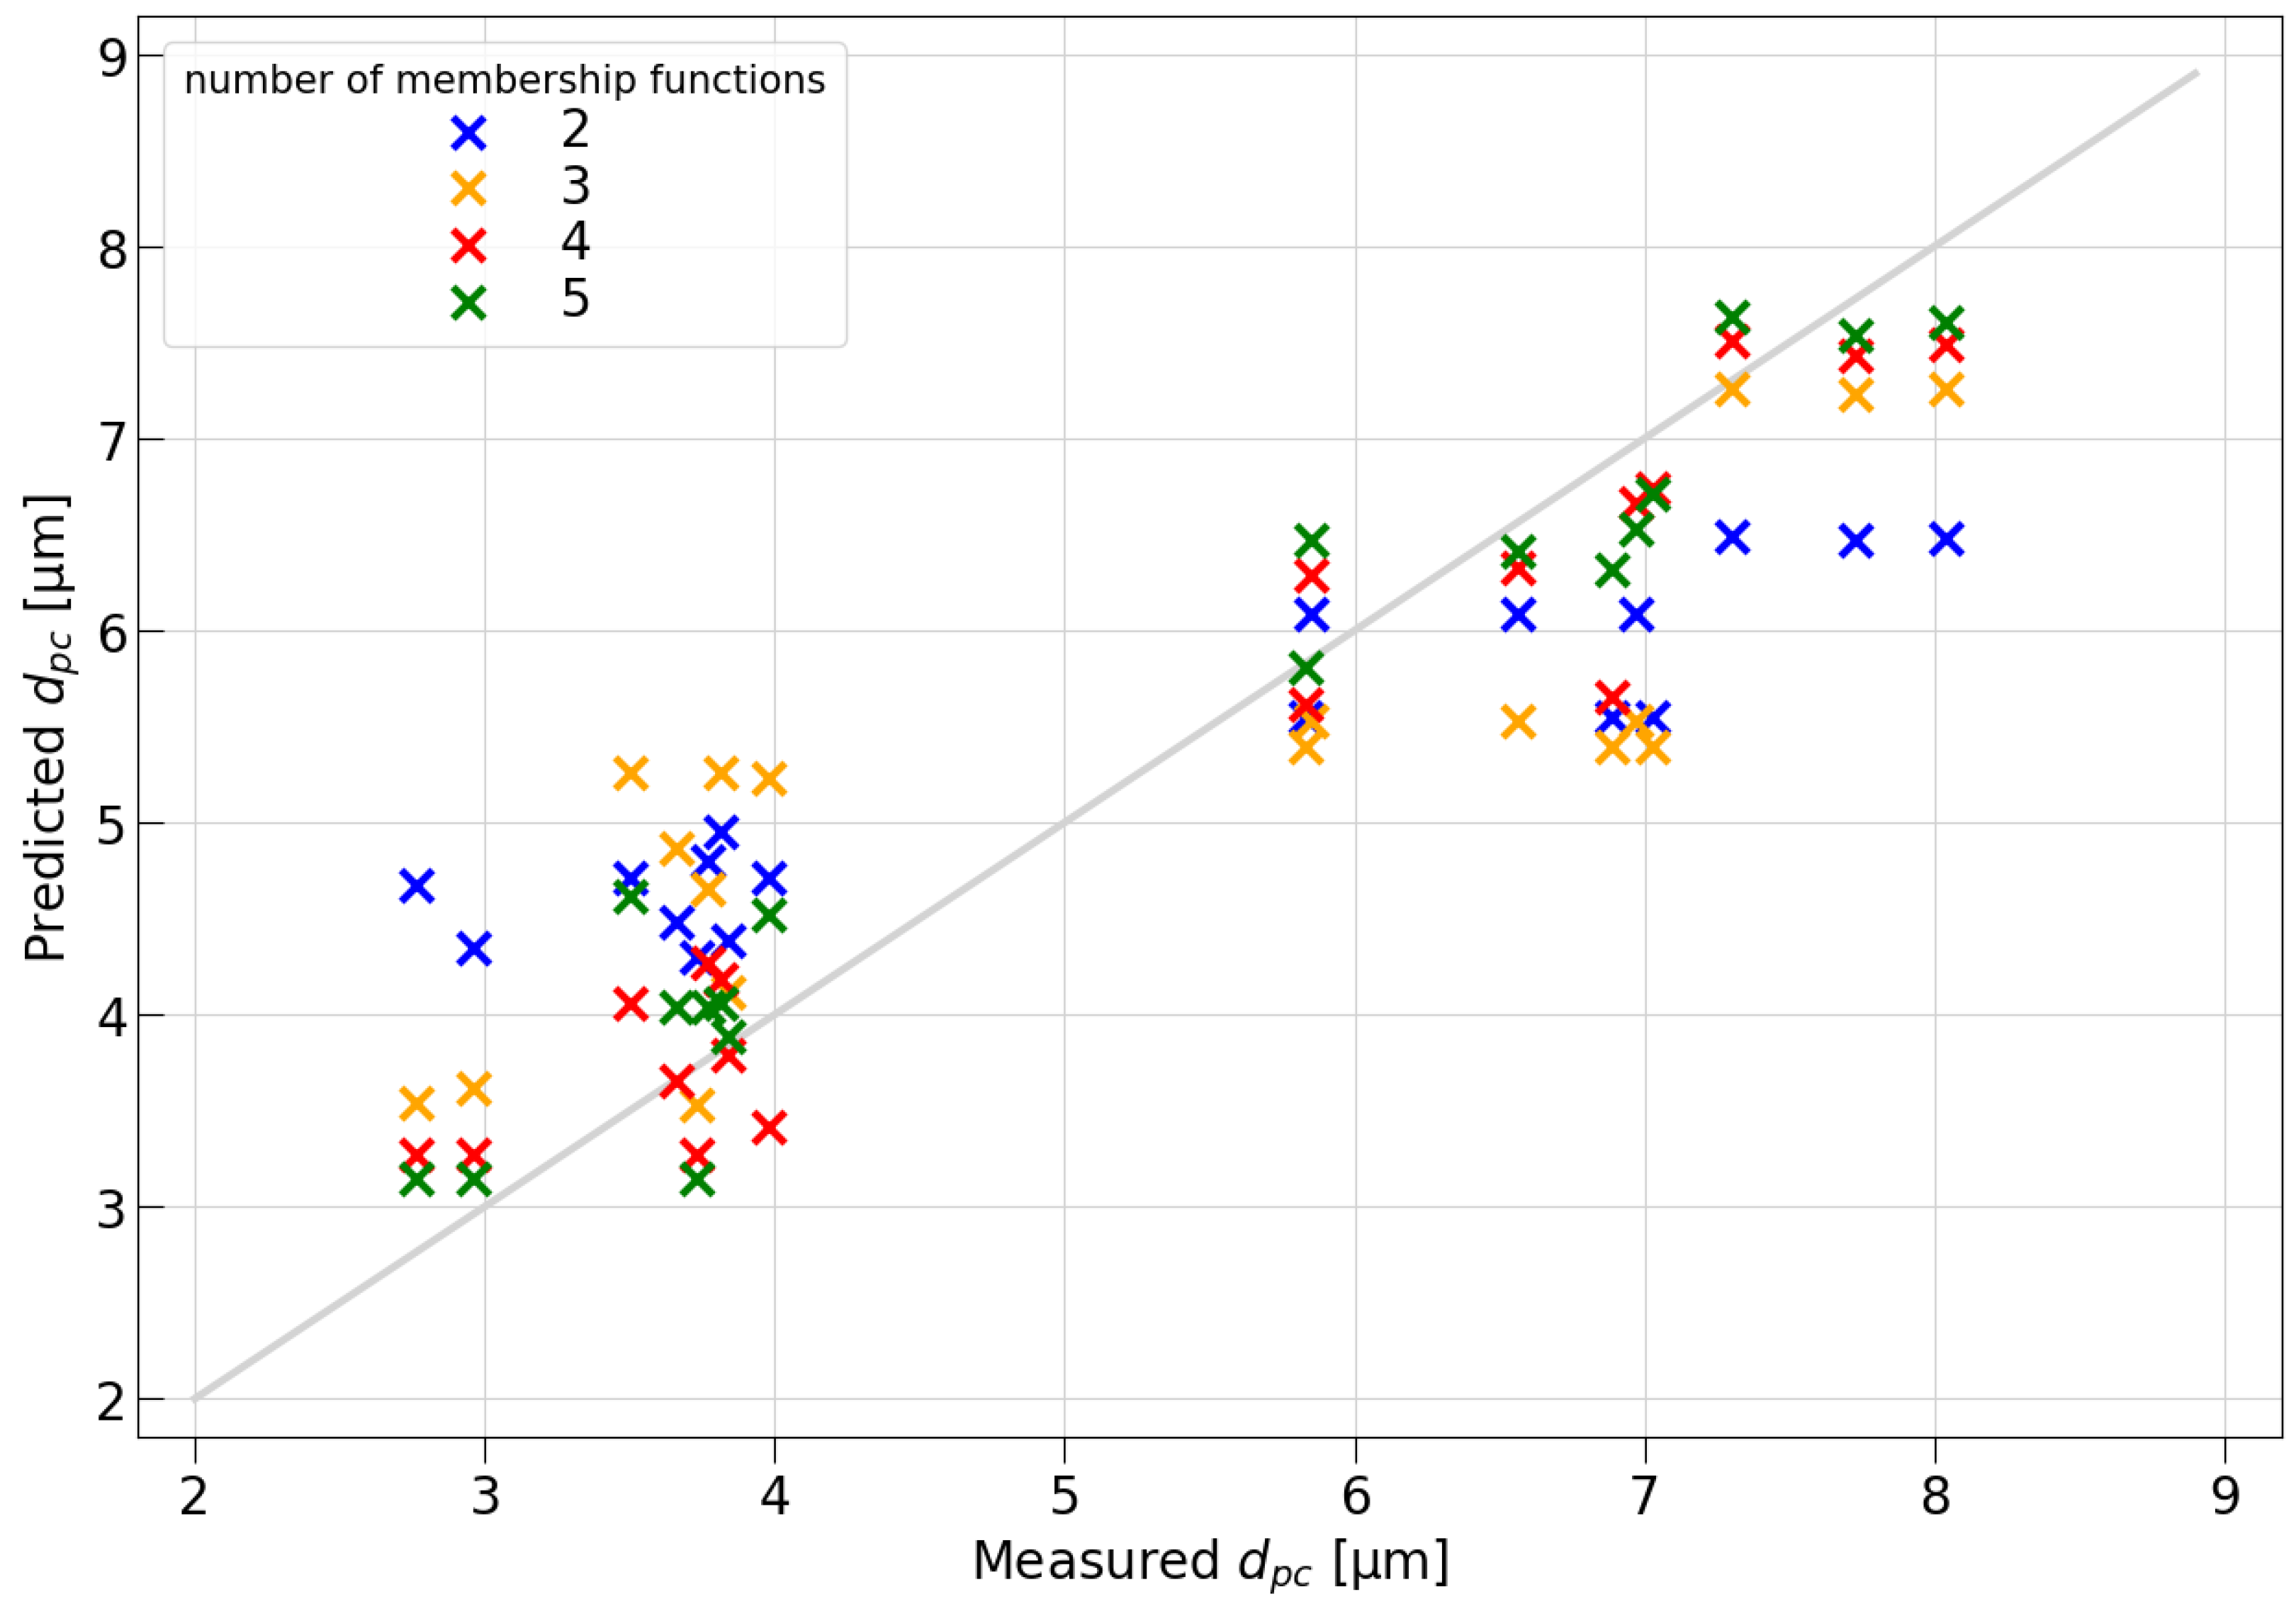
In a fuzzy logic model the accuracy of the prediction is proportional to the number of the parametric domains represented by the membership functions. With an increasing number of membership functions, the complexity of the model increases. 
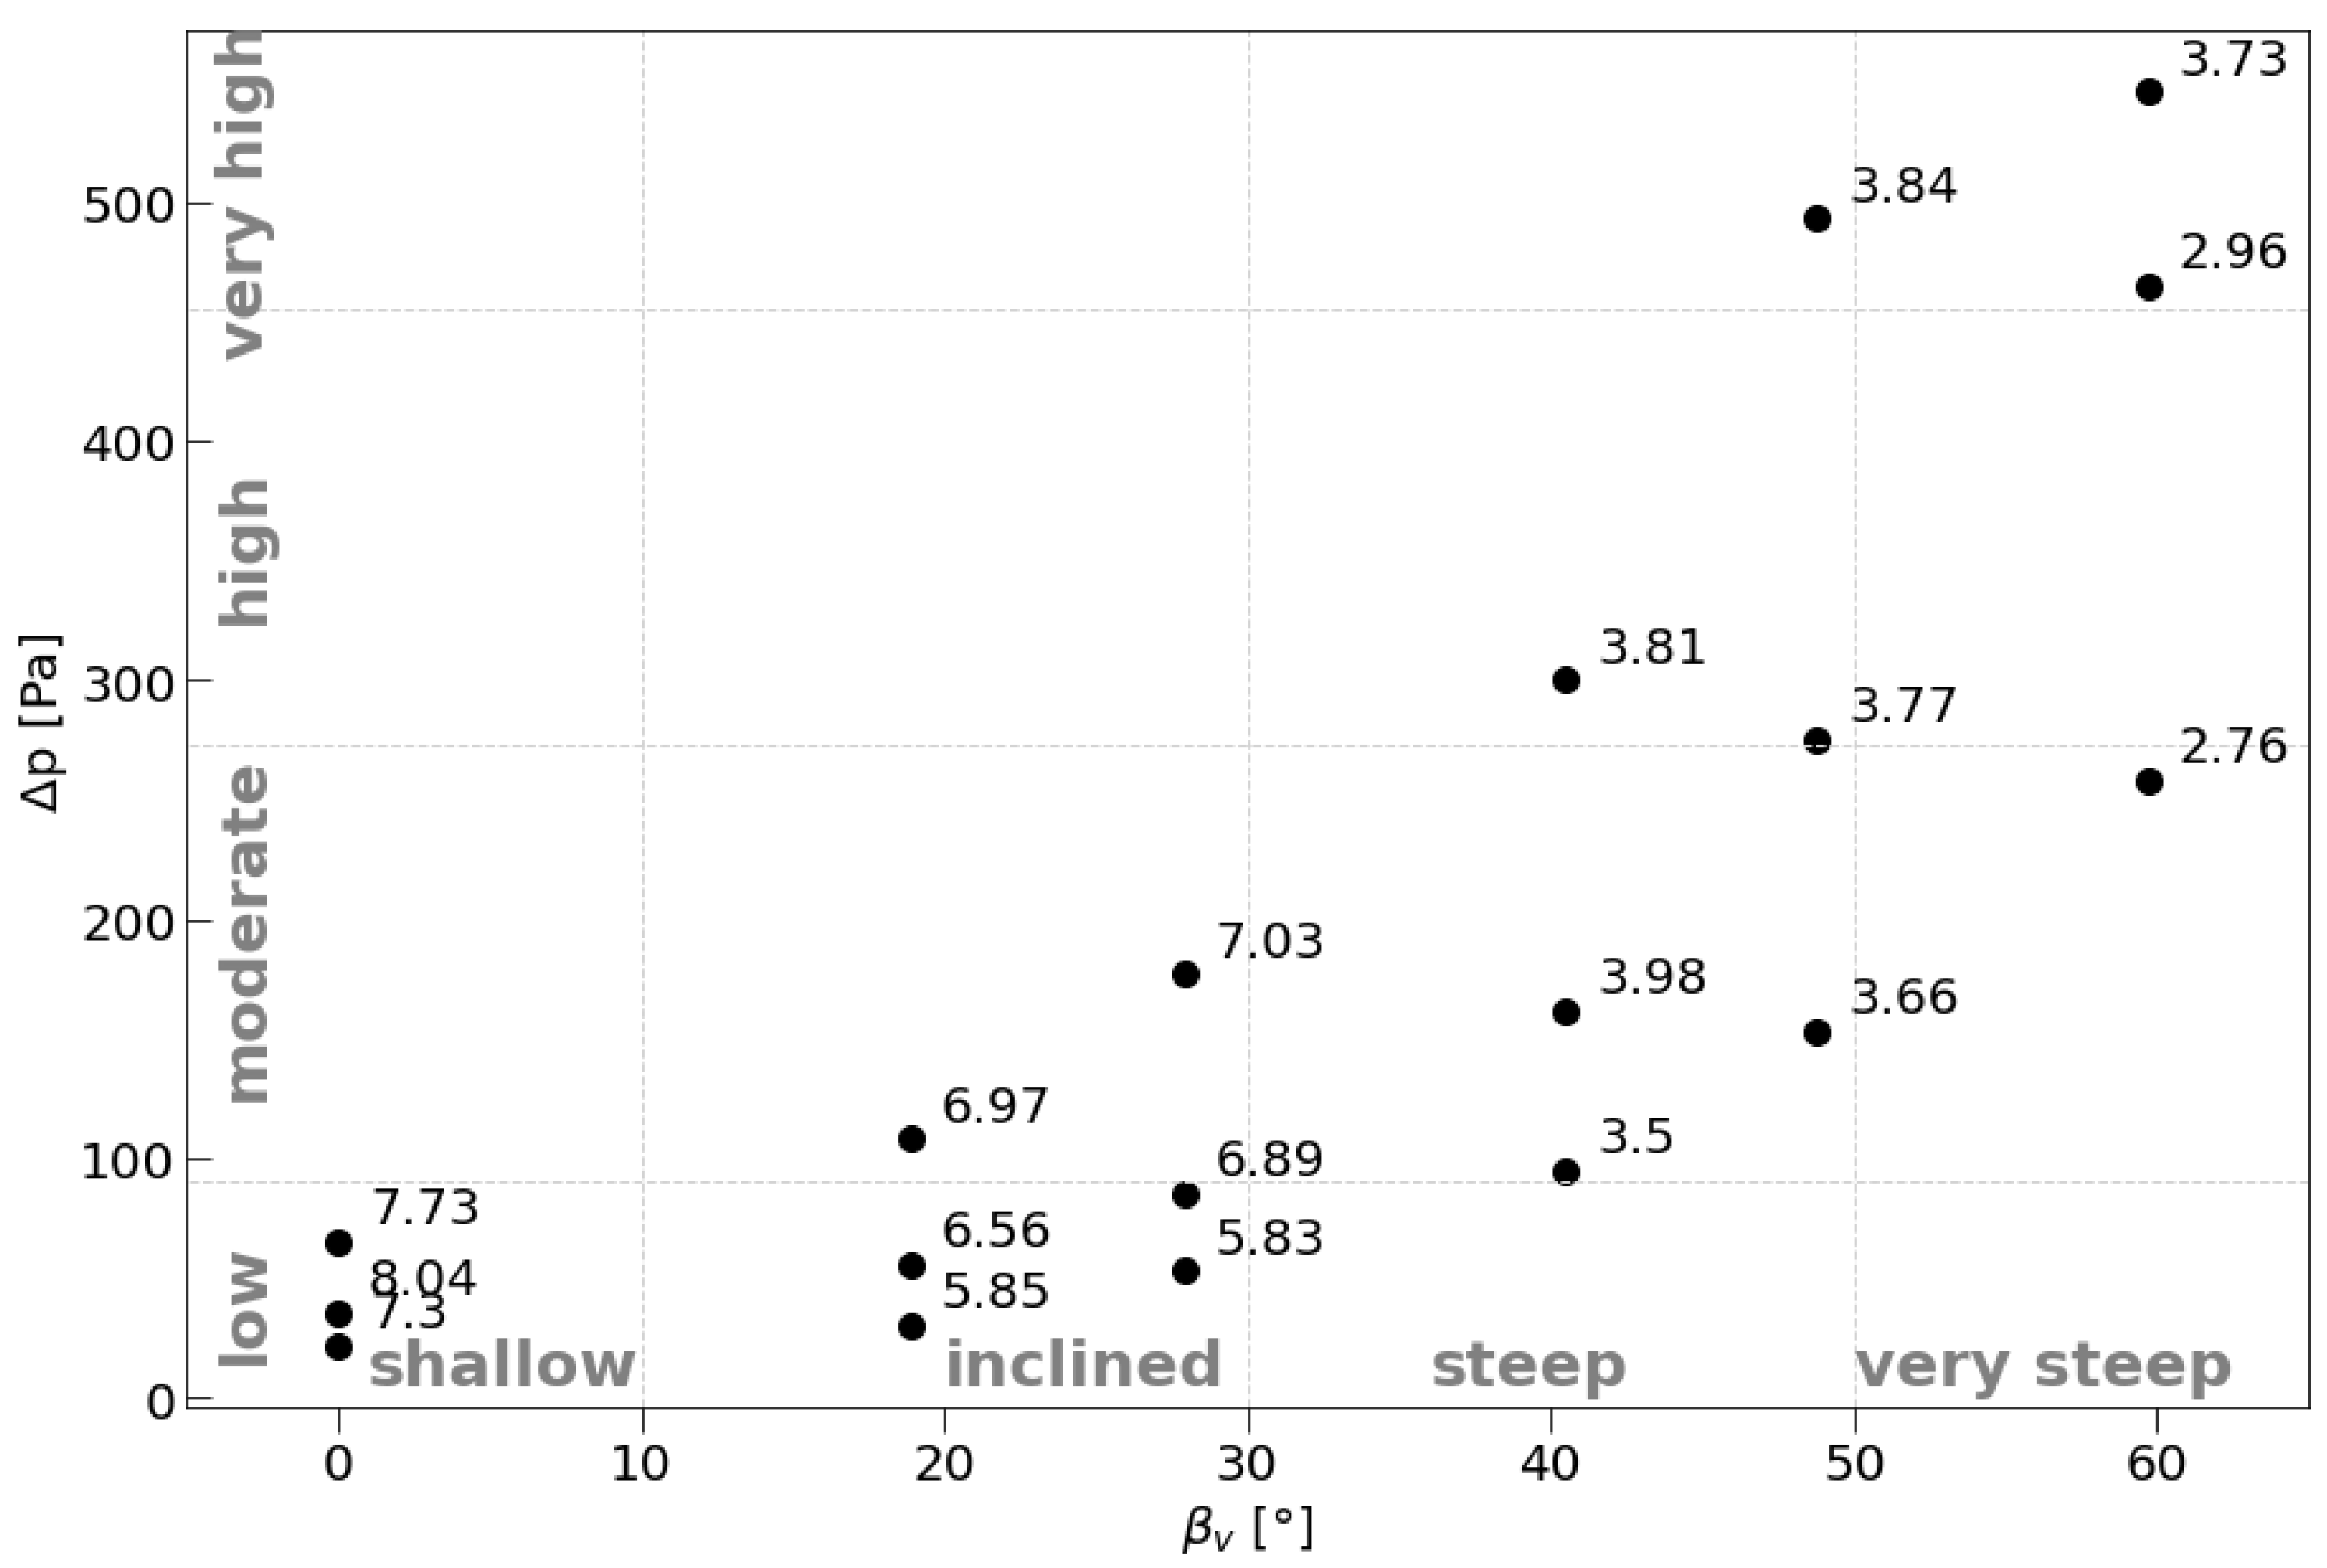
Figure 5 displays the results from the experimental investigations on the uniflow cyclone. The resulting particle cut diameter d p c are annotated next to the markers. It can be seen that the the pressure drop Δ p is a non-independent variable, which increases while the vane angle β v increases. Since the pressure drop Δ p is not solely depending on the vane angle β v , but as well on other variables such as flow velocity v i , geometric variables of the cyclone, surface roughness, to name a few, the pressure drop Δ p is applicable as an input variable for fuzzy logic prediction.
The range of the measured pressure drop values Δ p is categorized into four linguistic terms, called pressure domains, which are namely low, moderate, high, and very high pressure drop. Further, the range of the examined vane angle β v of the swirl inducers is classified into four designated domains as well: shallow, inclined, steep, and very steep. The exact range of the domains is listed in Table 2.

2.3.1. Membership Functions and Fuzzification

Membership functions describe the degree of membership or value of truth of a specific fuzzy input parameter and are either discrete or continuous. Being numerical representations of the linguistic concepts, membership functions can be built either through learning from data or experts’ opinion [12]. Describing a membership function, U is called the universe, and μ x is a fuzzy set of U. In the case of the fuzzy set for the pressure drop μ p Δ and the fuzzy set for the vane angle μ β v as well as the fuzzy set particle cut diameter μ d p c 
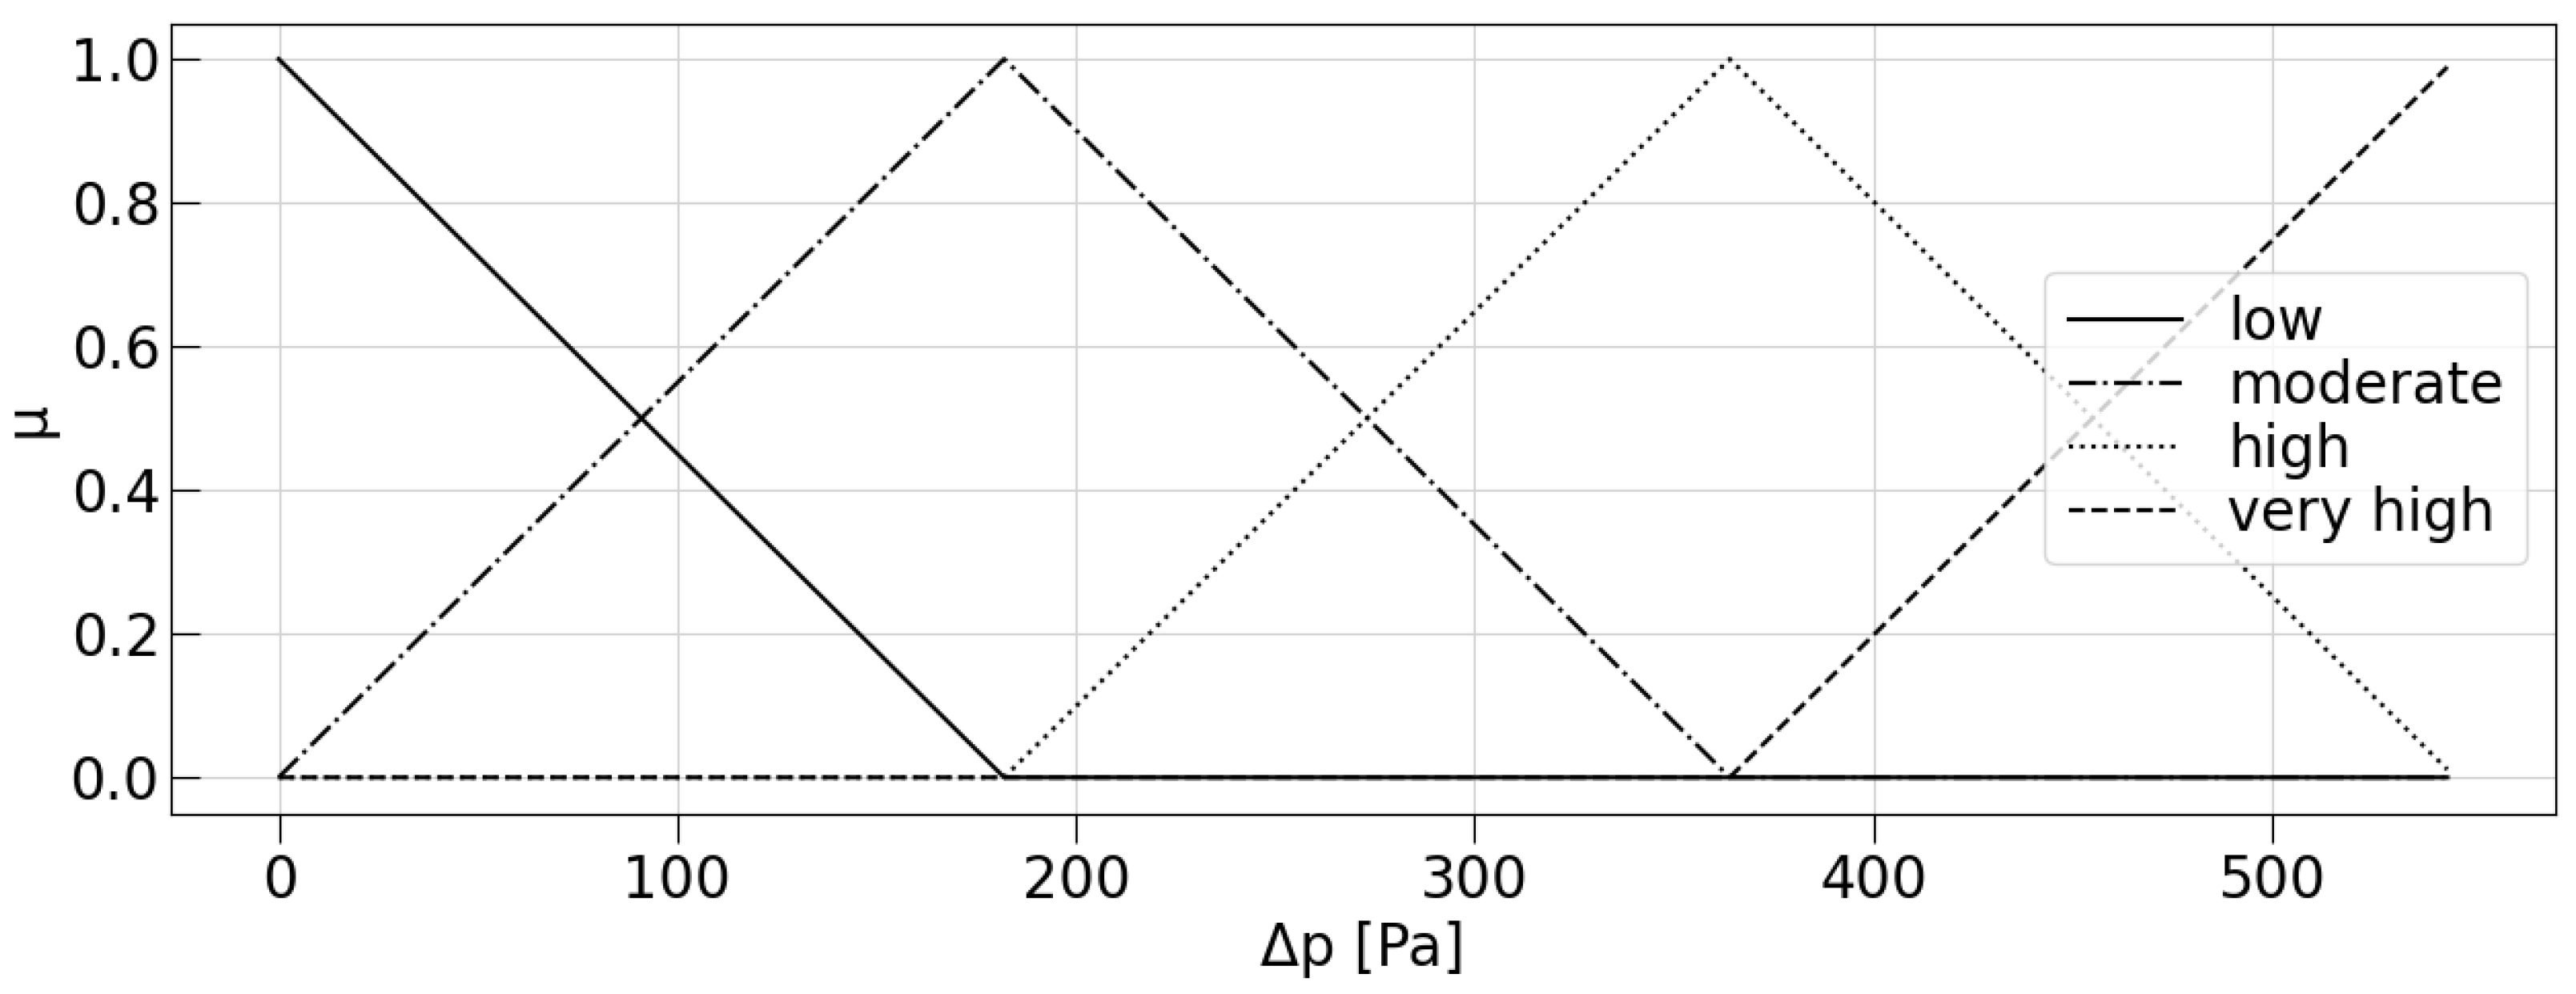
, triangular membership functions are used. The following fuzzy sets consist of one open-left, two closed, and one open-right membership function. The membership functions (Figure 6) of the fuzzy set μ p Δ are μ l p Δ , μ m p Δ , μ h p Δ and μ v h p Δ represent the fuzzy set as
μ p Δ = μ l p Δ + μ m p Δ + μ h p Δ + μ v h p Δ = 1 p Δ U .
The pressure is described by a certain degree of membership from the membership function, commonly referred to as fuzzification.
μ l p Δ = 0 f o r p Δ 0 182 p Δ 182 f o r 0 p Δ 182 0 f o r 182 p Δ
μ m p Δ = 0 f o r p Δ 0 p Δ 182 f o r 0 p Δ 182 364 p Δ 182 f o r 182 p Δ 364 0 f o r 364 p Δ
μ h p Δ = 0 f o r p Δ 182 p Δ 182 182 f o r 182 p Δ 364 546 p Δ 182 f o r 364 p Δ 546 0 f o r 546 p Δ
μ v h p Δ = 0 f o r p Δ 364 p Δ 364 182 f o r 364 p Δ 546 0 f o r 546 p Δ .
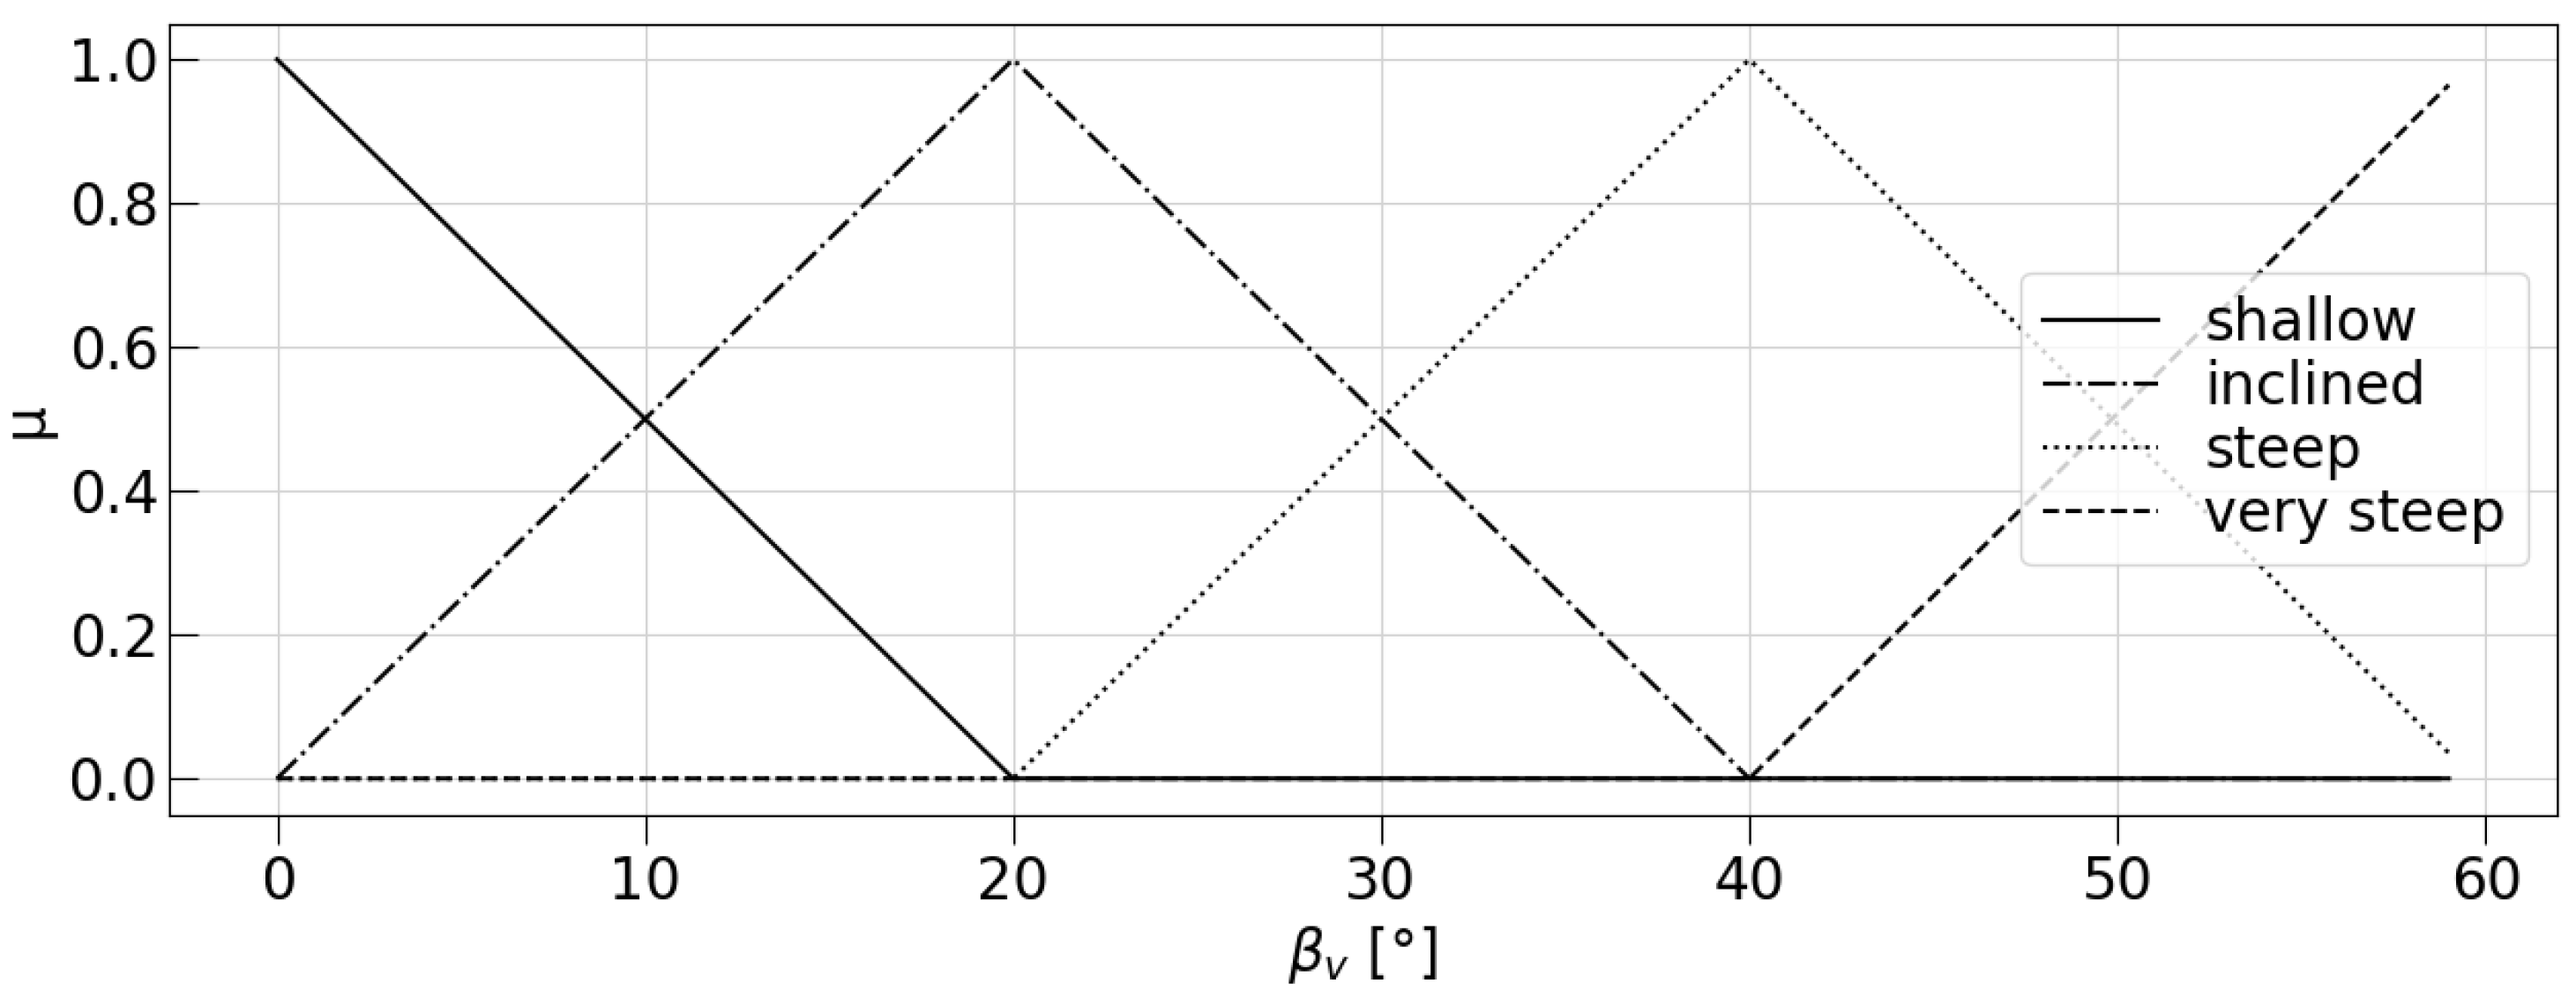
Similarly the fuzzy set μ β v , which represents the vane angle β v , is defined. The membership functions (Figure 7) of the fuzzy set μ β v are μ s β v , μ i β v , μ s β v and μ v s β v represent the fuzzy set in the universe V as
μ β v = μ s h β v + μ i β v + μ s t β v + μ v s β v = 1 β v V .
With the use of the membership functions the degree of membership can be calculated as
μ s h β v = 0 f o r β v 0 20 β 20 f o r 0 β v 20 0 f o r 20 β v
μ i β v = 0 f o r β v 0 β v 20 f o r 0 β v 20 40 β v 20 f o r 20 β v 40 0 f o r 40 β v
μ s t β v = 0 f o r β v 20 β v 20 20 f o r 20 β v 40 60 β v 20 f o r 40 β v 60 0 f o r 60 β v
μ v s β v = 0 f o r β v 40 β v 40 20 f o r 40 β v 60 0 f o r 60 β v .

2.3.2. Fuzzy Operators and Fuzzy Rules

The maximum possible rules of a fuzzy system depend on the number of input parameters and the number of linguistic terms used. As a matter of fact the number of rules do not exceed the number of linguistic terms to the power of input parameters chosen [12]. Therefore, a maximum number of sixteen fuzzy rules can be created with two input parameters and four linguistic terms each. On the other hand, not all rules must be formulated to achieve high prediction accuracy. Based on the experimental results in Figure 5, the rules are generated in connection to the defined domains. Since some domains are empty, the maximum number of rules can not be achieved (cp. Figure 5). For the empty domains, no data points have been recorded. Therefore no information can be retrieved from these domains. While the mathematical operations over two fuzzy sets A and B can be various such as union, intersection, equality, complement, dilation, and more, union and intersection operations are used for the fuzzy sets pressure drop μ p Δ and vane angle μ β v [20]. It is then possible to obtain a total number of ten rules, which can be found in Table 3.

2.3.3. Defuzzification

The fuzzy rules that form the boundaries of the fuzzy system (Table 3) usually have to be converted into a crisp output [20]. To transform the fuzzy results into crisp results, a defuzzification process is performed. The membership functions of the consequent fuzzy set μ d p c are displayed in Figure 8. Different methods of defuzzification are practiced, such as the center of gravity (COG), the center of sum (COS), the area center method (BOA), the weighted average method (WA), and the maximum methods (FOM, LOM, MOM). Each method leads to slightly different fuzzy results and is introduced in the following.
For the COS method, the center of the area under the membership functions of the fuzzy sets is recognized and weighted according to the size of the area. In the case of the COG method, all areas of the two fuzzy sets are handled separately, and the COG is calculated for each area. Further, the total COG of the unified or intersected area is calculated and weighted accordingly. The BOA method generates a value within the unified or intersected area where the size of the areas left and right to the value are equal in size. For the WA method, only symmetric membership functions are considered. The maximum membership value weights the center of each function, and all values are added and divided by the sum of the maxima to solve for the center of the whole fuzzy set. For FOM, the minimum (first) value of the domain x with a maximum membership value μ x is examined. In contrast, for LOM, the domain’s maximum (last) value is considered with the maximum membership value. MOM considers the mean value from maximum and minimum domain value x [
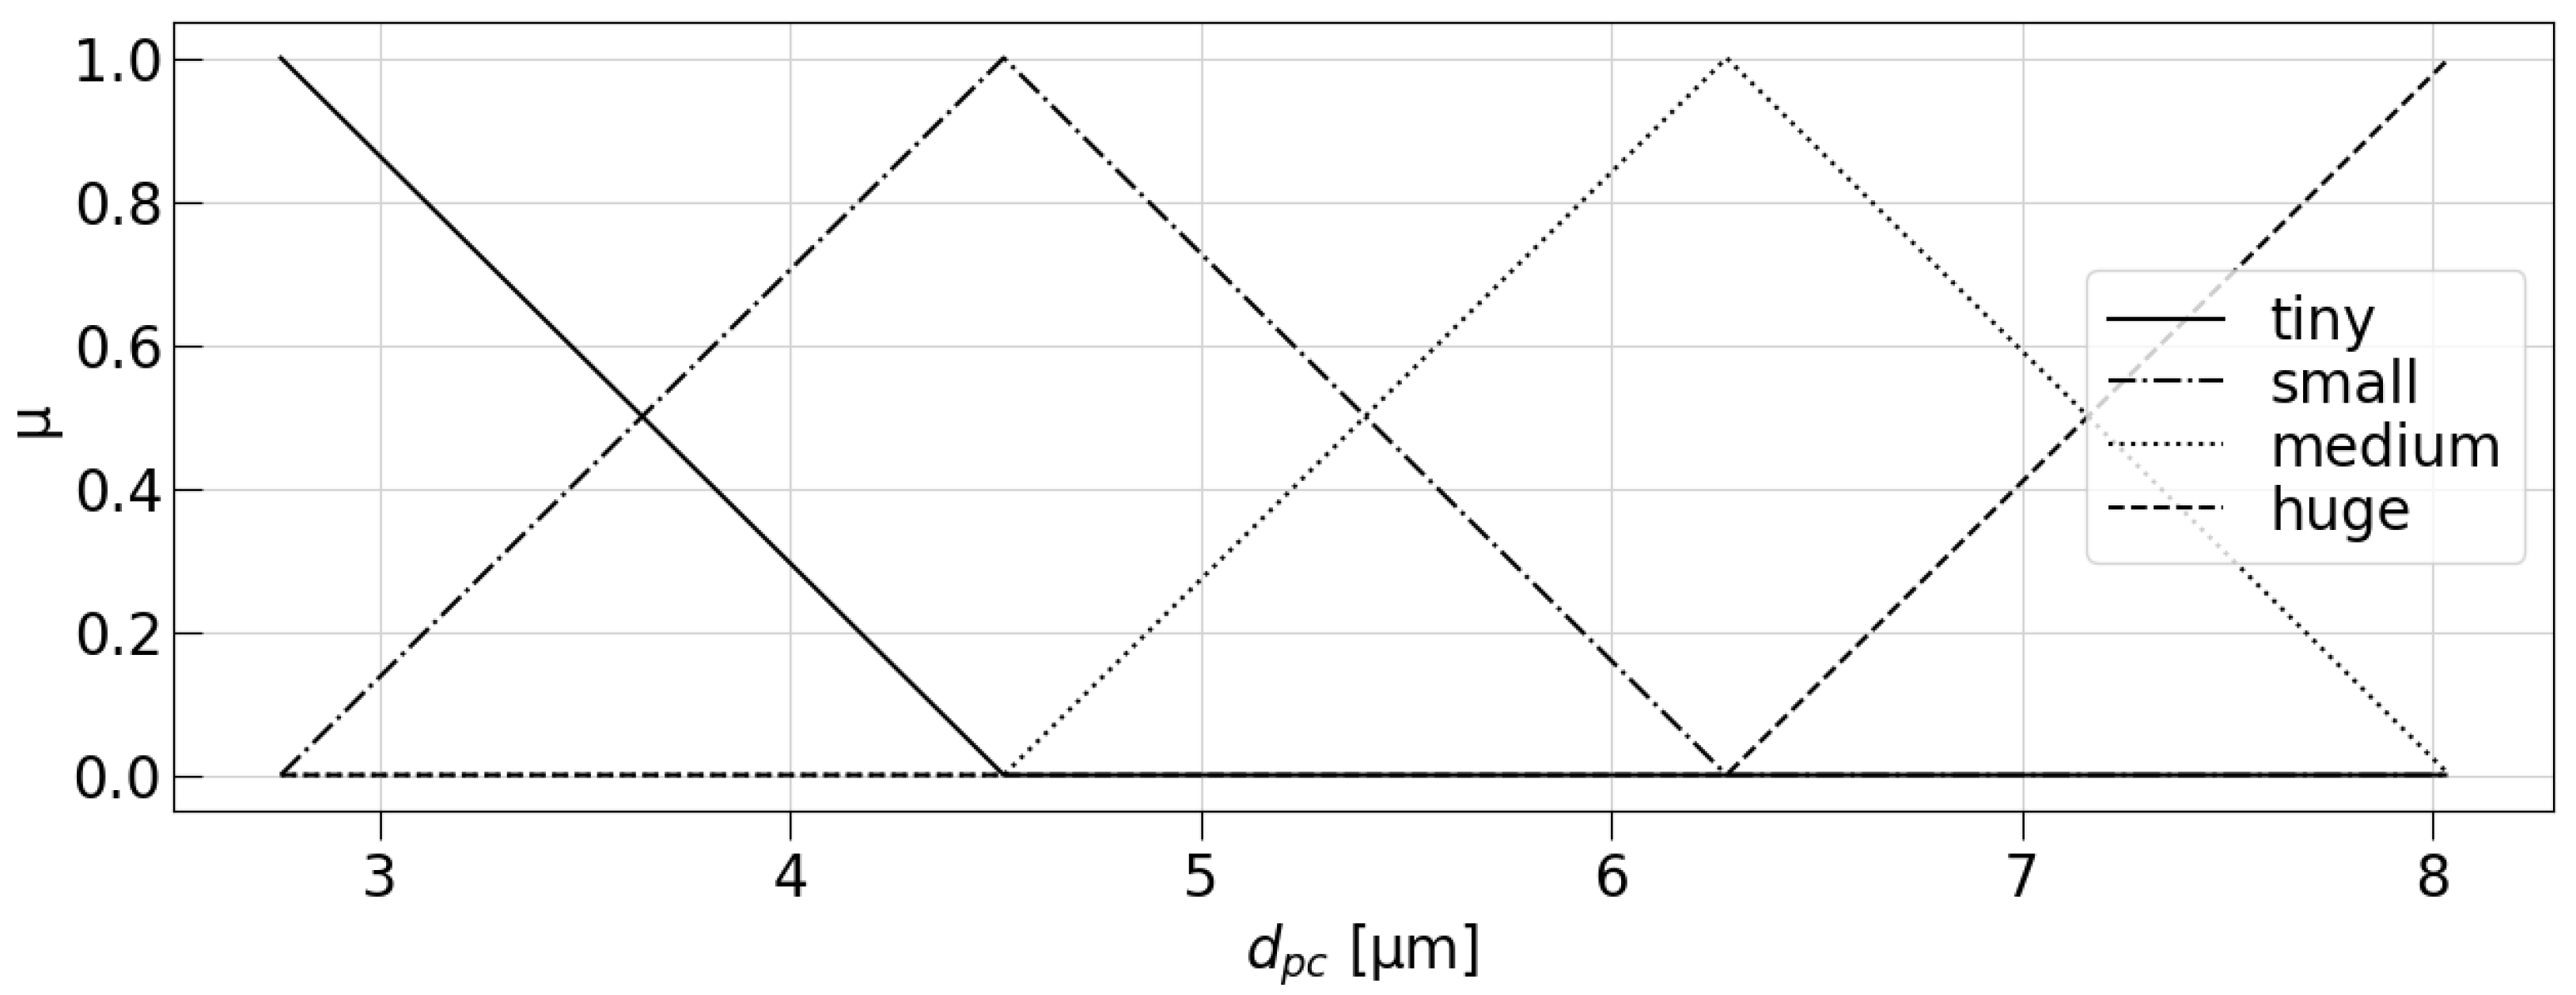
22]. The fuzzy sets describing the particle size of particle cut diameter d p c are namely μ t d p c , μ s d p c , μ m d p c and μ h d p c (cp. Table 2). In the case of the defuzzification of the membership functions of the consequent fuzzy set in the universe W
μ d p c = μ t d p c + μ s d p c + μ m d p c + μ h d p c = 1 d p c W
the defuzzification method BOA delivers the best results with the most minor error (cp. Table 4).
The definition of the membership function of the fuzzy set of the particle cut diameter can be found as
μ t ( d p c ) = 0 f o r d p c 2.76 4.52 d p c 2.76 f o r 2.76 d p c 4.52 0 f o r 4.52 d p c
μ s ( d p c ) = 0 f o r d p c 2.76 d p c 2.76 2.76 f o r 2.76 d p c 4.52 6.28 d p c 2.76 f o r 4.52 d p c 6.28 0 f o r 6.28 d p c
μ m ( d p c ) = 0 f o r d p c 4.52 d p c 4.52 2.76 f o r 4.52 d p c 6.28 8.04 d p c 2.76 f o r 6.28 d p c 8.04 0 f o r 8.04 d p c
μ h ( d p c ) = 0 f o r d p c 6.28 d p c 6.28 2.76 f o r 6.28 d p c 8.04 0 f o r 8.04 d p c .

3. Results and Discussion

3.1. Axial and Radial Velocities

As a base for the fuzzy logic prediction model for the particle cut diameter experimental data had to be acquired. The results of the experimental measurements are presented in the following. In Figure 9, the normalized axial velocity component U and the normalized radial velocity V can be seen for the specific Reynolds number R c = 13.9 × 10 4 .
For the setup without the swirl inducer (VA0), the normalized axial velocity component U exhibits high velocity ratios near the tube center. In contrast, the axial velocity ratios near the wall are lower. With increasing vane angle β v , the axial velocities decrease in the center and increase near the walls, resulting from the increased rotating motion around the tube axis. The normalized radial velocity shows a point symmetry around the tube axis due to the rotating motion of the swirled fluid (Figure 9). For VA0, the radial velocities are minimal. With increasing vane angle β v , the curves of the radial velocities become steeper and reach a maximum for VA40. Further increasing the vane angle exhibit lower radial velocities at the near-wall area. These findings underline the inertia-based particle segregation capabilities of the system using the swirl inducers. The measured pressure drop over the uniflow cyclone setup ranged from Δ p = 22 Pa to 546 Pa in dependence on the swirl inducer vane angle β v and the velocity setting (Figure 5), for which the Reynolds number R e c varied between R c = 13.9 × 10 4 and R c = 25.2 × 10 4 . The fractional efficiency curves for vane angles β v from 0 ° to 59.7 ° of the swirl inducer with different Reynolds numbers R c are calculated using the Equation (3). As suggested by Iozia [9], the data points of the fractional efficiency curve are approximated with a logistic curve
f d p = 1 1 + e β d p d p c .
While the midpoint of the logistic curve at a fractional efficiency of 50% represents the particle cut diameter d p c , the slope parameter β describes the steepness of the midpoint.

3.2. Fractional Particle Separation Efficiency and Particle Cut Diameter

To determine the particle separation performance of the uniflow cyclone the fractional particle separation efficiencies for a particle diameter range d p of 1 μ m to 29 μ m is measured with a particle spectrometer. The particle cut diameter d p c is a measure for the overall separation efficiency within the given particle diameter range for the specific experimental setup. The fractional particle separation efficiencies for different swirl inducer vane angles β v at a Reynolds number of R c = 13.9 × 10 4 are displayed in Figure 10.
Overall the particle cut diameter d p c is calculated as in the range of 7.3   μ m to 8 μ m for vane angle β v = 0 ° (VA0), 5.8   μ m to 7 μ m for vane angle β v = 18.9 ° (VA20), 4.3   μ m to 5.8   μ m for vane angle β v = 29.7 ° (VA30), 3.5   μ m to 4 μ m for vane angle β v = 40.5 ° (VA40), 3.2   μ m to 3.8   μ m for vane angle β v = 48.8 ° (VA50) and 2.6   μ m to 3 μ m for vane angle β v = 59.7 ° VA60. All results on the particle cut diameter findings for Reynolds number R c = 13.9 × 10 4 to R c = 25.2 × 10 4 can be found in Table 5.
The uniflow cyclone fractional particle separation efficiency curve exhibits lower fractional separation efficiencies for the fine dust for small particle diameters. In contrast, the efficiencies increase for larger particles as expected. The effect of the vane angle β v of the swirl inducers is significant, as for larger vane angles β v , the particle cut diameter d p c is minimized (cp. Figure 10). Further, it is recognized that lower Reynolds numbers R c , and therefore lower inlet velocity v i , tend to have a positive but minor effect on the separation efficiency of the uniflow cyclone (Table 5). The lowest particle cut diameter d p c of 2.6   μ m is achieved with the swirl inducer vane angle of β v = 59.7 ° , while for the lowest and highest tested Reynolds number R e c , the particle cut diameter d p c shows only a difference of 0.1   μ m .
When comparing the particle cut diameter results for reverse-flow cyclones of past experimental research, the separation efficiency results of this study using a uniflow cyclone setup are promising, while reaching values close to the results of Stairmand and Dirgo & Leith [8].
While the particle density ρ p ranges from 860 k g m 3 to 2650 k g m 3 in past studies [8,10], flow rates v ˙ from 15.0   L s 1 to 231.8   L s 1 were applied on cyclones with diameters d c from 41 m m to 305 m m [8]. The achieved particle cut diameter d p c ranges from 1.38   μ m [8] to 5 μ m [10]. This means that the achieved particle cut diameter d p c in this study is comparable with the performance of past reverse-flow cyclone setups. Dirgo [8] and Iozia [9] used the mineral oil (Arcoprime 200) for their cyclone efficiency studies. Their achieved particle cut diameter d p c was slightly larger than Stairmands results, but with higher pressure losses for similar cyclone diameters d c . Beekmans [17], Klujszo [10], and Faulkner [19], on the other hand, used solid aerosol particles for their experiments. Klujszo [10] conducted experiments with a uniflow cyclone system. However, for a particle diameter range d p of 4 μ m to 100 μ m with a particle density ρ p of 2650 k g m 3 , the achieved particle cut diameter d p c = 5 μ m is the largest value in the considered research and the results of this study are out-performing the particle cut diameter d p c achieved by Klujszo [10]. Previous experimental cyclone research has found various correlations with test parameters and the particle cut diameter d p c . Consolidating the theories of Leith-Licht [23] and Barth [24], it was found that an increase in the cyclone diameter generally leads to a decrease in the particle cut diameter. These findings were confirmed by Beekmans [17], who used larger cyclone diameters d c between 76 m m to 152 m m instead. Faulkner [19], on the other hand, achieved almost equal separation efficiencies η , while examining inlet velocities v i from 10 m s 1 to 20 m s 1 (Table 6). The experimental data of Iozia [9] agreed very much with the findings of his predecessors. The discussed correlations and some of the empirical findings were partly numerically verified with computational fluid dynamic (CFD) by Gimbun [25], who analyzed the relationship between cyclone diameter d c , fluid temperature T a m b , particle density ρ p , and the separation efficiency η . An increase of each of these parameters was found to increase the separation efficiency η .

3.3. Performance of the Model

Since empirical models extracted from reverse-flow cyclone experiments only estimate the particle cut diameter for uniflow cyclones to a certain extent, developing prediction models is crucial. A fuzzy model is designed to predict the particle cut diameter of a uniflow cyclone. Based on the experimental data, linguistic domains, and fuzzy sets are created. After the defuzzification process described in the previous section, a crisp format is derived from the fuzzy membership functions. The predicted values of the particle cut diameter d p c are further named d p c p r e d . The particle cut diameter from the logistic curve d p c m e a s (cp. Table 5) is compared with the predicted particle cut diameter d p c p r e d gained from the defuzzification of the fuzzy logic system, and the relative error ε is calculated as
ε = d p c p r e d , i d p c m e a s , i d p c m e a s , i n .
The coefficient of determination R 2 is a statistical measure to describe the performance of a model, which defines how well the predicted data fit the measured data. The coefficient of determination R 2 is computed as
R 2 = 1 d p c m e a s d p c p r e d 2 d p c m e a s d p c m e a s n 2 .
The mean squared error (MSE), is calculated as
M S E = 1 n d p c p r e d , i d p c m e a s , i 2 ,
represents the mean distance between the predicted d p c p r e d and the measured particle cut diameter d p c m e a s . The prediction of the particle cut diameter d p c p r e d using the experimental data set, is conducted with two to five fuzzy membership functions. The predicted particle cut diameter d p c p r e d is displayed in Figure 11 as a function of the measured values.
While with two and three membership functions, the particle cut diameter d p c p r e d does not match well with the particle cut diameter d p c m e a s . The biggest effect in the reduction of the mean relative error ε is observed when increasing the membership functions from three to four. The mean relative error ε is reduced from ε = 0.195 to 0.084 , while the coefficient of determination R 2 increases from 0.66 to 0.93 . The computation of the particle cut diameter d p c p r e d using five membership functions in the fuzzy sets of the antecedent and consequent variables does not show a further decrease in the average relative error ε nor a valuable increase of the coefficient of determination R 2 (Table 7). A further increase of the amount of the fuzzy membership functions for the antecedent and consequent variables will increase the risk of over-fitting the logical model further. When the model focuses to much on reducing the MSE over-fitting is likely [26]. For test and train datasets this means that the relative error ε of the train dataset might be very low but in consequence the relative error ε of the a test dataset can be much higher. In the case of large data sets the use of a higher amount of linguistic terms and therefor of membership functions can be necessary. As the number of possible rules to define the fuzzy logic system are depending on the number of membership functions to the power of input variables, the computation time highly depends on the amount of rules used.

4. Conclusions

In this work, the performance of a uniflow cyclone system is examined. The particle size distribution is measured inside the cyclone outlet for three different Reynolds numbers R c and six swirl inducer configurations with different vane angles β v . The pressure drop Δ p is measured for these 18 different combinations and the particle cut diameter d p c is derived from a logistic curve that approximates the measured fractional particle separation efficiencies recorded for each particle size. The average fine dust injected into the cyclone system equals an air quality index (AQI) of 294. A similar AQI level can be found in Seoul, the Republic of Korea, and other densely populated cities worldwide on several days of the year. Therefore the particle density within the induced air is simulating a realistic fine dust pollution scenario. Compared with past experimental research, the data suggest that with a uniflow cyclone a particle cut diameter d p c close to reverse-flow cyclone setups can be achieved for fine test dust with a particle diameter range d p of 1 μ m to 29 μ m . Hence the experimental data underlines that uniflow cyclones perform on an almost equal level with reverse-flow cyclones while having the benefit of minor pressure losses and lower installation heights that usually do not exceed the cyclone diameter d c . Consequently, uniflow cyclones can be installed in applications where the height is limited and easy access for maintenance is necessary.
The developed prediction model based on the fuzzy logic method provides excellent prediction results for the particle cut diameter d p c , considering the experimental data and the clear structure of the model. Overall, the potential for uniflow cyclones is high, while their advantages compared to reverse-flow cyclone systems stand out. It is shown that with fuzzy logic models, a good prediction performance of the particle cut diameter d p c requires careful consideration of the amount of used membership functions. Further highlighting the relationship between pressure drop Δ p , swirl inducer vane angle β v , and the cyclone efficiency, namely the particle cut diameter d p c , this research provides the foundation for further cyclone research, especially in the case of uniflow cyclone systems.

5. Patents

During this research a resulting patent has been registered. The patent with the title “Method for removing particles by centrifugation based on rotating systems and centrifugal forces” has been registered at the Korean Intellectual Property Office under the patent no. 10-2490691.

Author Contributions

Conceptualization, V.K. and A.D.; methodology, V.K. and A.D.; software, V.K.; validation, V.K., G.L. and A.D.; formal analysis, V.K. and B.P.; investigation, V.K.; resources, V.K., A.D.; writing—original draft preparation, V.K.; writing—review and editing, V.K., B.P. and G.L.; visualization, V.K. and B.P.; supervision, V.K., G.L. and A.D.; project administration, V.K. All authors have read and agreed to the published version of the manuscript.

Funding

This research received no external funding.

Data Availability Statement

Any extra data needed can be provided by authors upon request.

Conflicts of Interest

The authors declare no conflict of interest.

Abbreviations

The following abbreviations are used in this manuscript:
BOAbisector of area
COGcenter of gravity
COScenter of sum
FDMfuse-deposition modeling
FOMfirst value of maximum
HEPAhigh efficiency particulate air [filter]
LOMlast value of maximum
MOMmean value of maximum
MSEmean squared error
PSDparticle size distribution
VAvane angle

References

  1. Herald, K. Artificial Rain Test Failed to Ease Fine Dust Level. 2019. Available online: www.koreaherald.com/view.php?ud=20190227000638 (accessed on 28 September 2022).
  2. Staudt, J.E. Control Technologies to Reduce Conventional and Hazardous Air Pollutants from Coal-Fired Power Plants. 2011. Available online: /www-f.nescaum.org/documents/coal-control-technology-nescaum-report-20110330.pdf/view (accessed on 3 October 2022).
  3. Lapple, C.E. Gravity and Centrifugal Separation. Am. Ind. Hyg. Assoc. Q. 1950, 11, 40–48. [Google Scholar] [CrossRef]
  4. Wadenpohl, C.; Löffler, F. Electrostatic agglomeration and centrifugal separation of diesel soot particles. Chem. Eng. Process. Process Intensif. 1994, 33, 371–377. [Google Scholar] [CrossRef]
  5. ISO 5167; Measurement of Fluid Flow by Means of Pressure Differential Devices Inserted in Circular Cross-Section Conduits Running Full. 2nd ed. International Organisation for Standardization: Geneva, Switzerland, 2003.
  6. ISO 7708; Air Quality—Particle Size Fraction Definitions for Health-Related Sampling. 1st ed. International Organisation for Standardization: Geneva, Switzerland, 1995.
  7. Nel, A.; Xia, T. Toxic Potential of Materials at the Nanolevel. Science 2006, 311, 7. [Google Scholar] [CrossRef] [PubMed] [Green Version]
  8. Dirgo, J.; Leith, D. Cyclone Collection Efficiency: Comparison of Experimental Results with Theoretical Predictions. Aerosol Sci. Technol. 1985, 4, 401–415. [Google Scholar] [CrossRef] [Green Version]
  9. Iozia, D.L.; Leith, D. The Logistic Function and Cyclone Fractional Efficiency. Aerosol Sci. Technol. 1990, 12, 598–606. [Google Scholar] [CrossRef] [Green Version]
  10. Klujszo, L.A.; Rafaelof, M.; Rajamani, R.K. Dust collection performance of a swirl air cleaner. Powder Technol. 1999, 103, 130–138. [Google Scholar] [CrossRef]
  11. Ngerntong, S.; Butdee, S. Surface roughness prediction with chip morphology using fuzzy logic on milling machine. Mater. Today Proc. 2020, 26, 2357–2362. [Google Scholar] [CrossRef]
  12. Kasabov, N.K. Foundations of Neural Networks, Fuzzy Systems, and Knowledge Engineering; MIT Press: Cambridge, MA, USA, 1996. [Google Scholar]
  13. Mahadevappa, J.; Groß, F.; Delgado, A. Fuzzy logic based process control strategy for effective sheeting of wheat dough in small and medium-sized enterprises. J. Food Eng. 2017, 199, 93–99. [Google Scholar] [CrossRef]
  14. Janarthanan, R.; Balamurali, R.; Annapoorani, A.; Vimala, V. Prediction of rainfall using fuzzy logic. Mater. Today Proc. 2021, 37, 959–963. [Google Scholar] [CrossRef]
  15. Greenworkstools 80V Cordless Brushless Blower GBL80320—Owner’s Manual. 2014. Available online: https://cdn.shopify.com/s/files/1/0593/9537/5264/files/GBL80321_E.pdf?v=3671320346805040703 (accessed on 3 October 2022).
  16. Litvinov, I.; Suslov, D.; Gorelikov, E.; Shtork, S. Swirl number and nozzle confinement effects in a flat-vane axial swirler. Int. J. Heat Fluid Flow 2021, 91, 108–812. [Google Scholar] [CrossRef]
  17. Beeckmans, M. Analysis of the efficiency of reverse flow cyclones. Can. J. Chem. Eng. 1977, 55, 4. [Google Scholar] [CrossRef]
  18. White, F. Fluid Mechanics; McGraw-Hill Series in Mechanical Engineering; McGraw Hill: New York, NY, USA, 2011. [Google Scholar]
  19. Faulkner, W.B.; Shaw, B.W. Efficiency and pressure drop of cyclones across a range of inlet velocities. Appl. Eng. Agric. 2006, 22, 155–161. [Google Scholar] [CrossRef] [Green Version]
  20. Debasis, S. Soft-Computing Applications. 2015. Available online: https://cse.iitkgp.ac.in/~dsamanta/courses/sca/index.html (accessed on 15 November 2022).
  21. Dehzangi, O.; Zolghadri, M.J.; Taheri, S.; Fakhrahmad, S.M. Efficient Fuzzy Rule Generation: A New Approach Using Data Mining Principles and Rule Weighting. In Proceedings of the Fourth International Conference on Fuzzy Systems and Knowledge Discovery (FSKD 2007), Haikou, China, 24–27 August 2007; IEEE: Haikou, China, 2007; pp. 134–139. [Google Scholar] [CrossRef]
  22. Dutu, L.C.; Mauris, G.; Bolon, P. A Fast and Accurate Rule-Base Generation Method for Mamdani Fuzzy Systems. IEEE Trans. Fuzzy Syst. 2018, 26, 715–733. [Google Scholar] [CrossRef] [Green Version]
  23. Leith, D.; Licht, W. The Collection Efficiency of Cyclone Type Particle Collectors—A New Theoretical Approach. Atmos. Environ. (1967) 1972, 68, 196–206. [Google Scholar]
  24. Barth, W. Berechnung und Auslegung von Zyklonabscheidern aufgrund neuerer Untersuchungen. Brennst. Warme Kraft 1956, 8, 1–9. [Google Scholar]
  25. Gimbun, J.; Choong, T.S.Y.; Fakhru’l–Razi, A.; Chuah, T.G. Prediction of the Effect of Dimension, Particle Density, Temperature, and Inlet Velocity on Cyclone Collection Efficiency. J. Teknol. 2012, 40, 37–50. [Google Scholar] [CrossRef] [Green Version]
  26. Jin, Y. On Generating FC Fuzzy Rule Systems from Data Using Evolution Strategies. PART B 1999, 29, 831–832. [Google Scholar]
Figure 1. General swirl inducer dimensions.
Separations 10 00345 g001
Figure 2. Schematic diagram of the experimental setup.
Separations 10 00345 g002
Figure 3. Differential and cumulative particle size distribution of the used fine test dust.
Separations 10 00345 g003
Figure 4. Schematic diagram of the fuzzy logic model.
Separations 10 00345 g004
Figure 5. The particle cut diameter d p c as a result of pressure drop Δ p and the vane angle β v with the domain of the linguistic terms.
Separations 10 00345 g005
Figure 6. Membership functions of the pressure drop Δ p .
Separations 10 00345 g006
Figure 7. Membership functions of the vane angle β v .
Separations 10 00345 g007
Figure 8. Membership functions of the particle cut diameter d p c .
Separations 10 00345 g008
Figure 9. Normalized axial velocity U (left) and radial velocity V (right) at the entrance of the separation chamber for different vane angles β v at Reynolds number R c = 13.9 × 10 4 .
Separations 10 00345 g009
Figure 10. Fractional particle separation efficiencies η and particle cut diameter d p c of the used swirl inducers for Reynolds number R c = 13.9 × 10 4 (left) and R c = 25.2 × 10 4 (right).
Separations 10 00345 g010
Figure 11. Comparison of the amount of membership functions and the respective prediction of the particle-cut diameter d p c p r e d .
Separations 10 00345 g011
Table 1. Overview of the examined swirl inducers.
SymbolUnitVA0VA20VA30VA40VA50VA60
length l s mm0112.567.54567.545
diameter d s mm07777777777
vane angle β v ° 018.929.740.548.859.7
twist ratio l d --1.460.880.580.880.58
pitch length l p mm-45027018013590
geom. swirl nb S g --0.230.380.570.761.14
Table 2. Linguistic terms of the fuzzy sets and their respective ranges.
ParameterLinguistic TermAbbreviationRangeUnit
pressure drop Δ p lowl0–91 Pa
moderatem91–273 Pa
highh273–455 Pa
very highvh455–546 Pa
vane angle β v shallowsh0–10 °
inclinedi10–30 °
steepst30–50 °
very steepvs50–60 °
particle cut diameter d p c tinyt2.76–3.64 μ m
smalls3.64–5.40 μ m
mediumm5.40–7.16 μ m
hugeh7.16–8.04 μ m
Table 3. Obtained rules.
RuleInputsOutput
β v Operator Δ p d pc
1shallowlowhuge
2inclinedlowmedium
3steeplowsmall
4inclinedmoderatehuge
5steepmoderatetiny
6very steepmoderatetiny
7steephighsmall
8very steephightiny
9steepvery hightiny
10very steepvery hightiny
Table 4. Prediction error of different defuzzification methods using four membership functions.
Defuzzification MethodBOAMOMLOMFOMCOG
Relative error ε in %8.3612.1914.3511.8210.20
Table 5. Particle cut diameter d p c in μ m in dependence of the swirl inducer vane angle β v and Reynolds number R e c .
ReVA0VA20VA30VA40VA50VA60
13.9 × 10 4 7.35.85.83.53.72.7
20.0 × 10 4 8.06.64.34.03.83.0
25.2 × 10 4 7.77.04.83.83.22.6
Table 6. Experimental parameters and results from previous studies in comparison (* indicates Stairmand-type cyclones).
Particle ParameterGeometrical ParameterProcess Parameter
CategoryAerosol TypeParticle DensityCyclone TypeCyclone Dia.Cyclone 0Outlet Dia.Particle RangeFeed RateInlet VelocityFlow RatePressure DropCut Dia.
Symbol ρ p d c l c d e d p c i v i v ˙ Δ p d pc
Unit kg m 3 mmm μ mg m 3 m s 1 L s 1 kPa μ m
Stairmand (cited in [8])n.a.2000reverse-flow *0.2030.80.1n.a.1015.262.6n.a. (∼0.785)1.38
Beeckmans [17]uraninen.areverse-flow0.150.60.0750.6–4.7n.a.6.119.1n.a.4.7
Dirgo & Leith [8]min. oil860reverse-flow *0.3051.20.151–70.0525231.82.211.8
Iozia & Leith [9]min. oil876reverse-flow0.251.00.075–0.1751.4–7.4n.a.15.295.00.403.2
Faulkner [19]starch1500reverse-flow0.150.6160.07217.95216.342.50.32–1.034.7–5
Klujszo [10]Arizona test dust A42650uniflow0.150.11–0.060.0514–100<57.415.0n.a.5
This studyArizona test dust A12650uniflow0.151.00.0861-400.016249.4236.00.5462.6
Table 7. Relative error ε , coefficient of determination R 2 and mean squared error (MSE) for different amount of membership functions.
Membership
Functions
Relative Error ε Coefficient of
Determination R 2
MSE
20.21890.62901.17
30.19470.65791.08
40.08360.9288 2.24 × 10 01
50.08430.9344 2.06 × 10 01
Disclaimer/Publisher’s Note: The statements, opinions and data contained in all publications are solely those of the individual author(s) and contributor(s) and not of MDPI and/or the editor(s). MDPI and/or the editor(s) disclaim responsibility for any injury to people or property resulting from any ideas, methods, instructions or products referred to in the content.

