
Experimental Design Approach for Development of HPLC Method for Simultaneous Analysis of Triamcinolone, Nystatin, and Gramicidin in Industrial Wastewater


Abstract
:1. Introduction
2. Materials and Methods
2.1. Chemicals and Reagents
2.2. Instrumentation
2.3. Chromatographic Conditions
2.4. Standard Solutions
2.5. Software
2.6. Method Development
2.7. Method Validation
2.8. Application
3. Results and Discussion
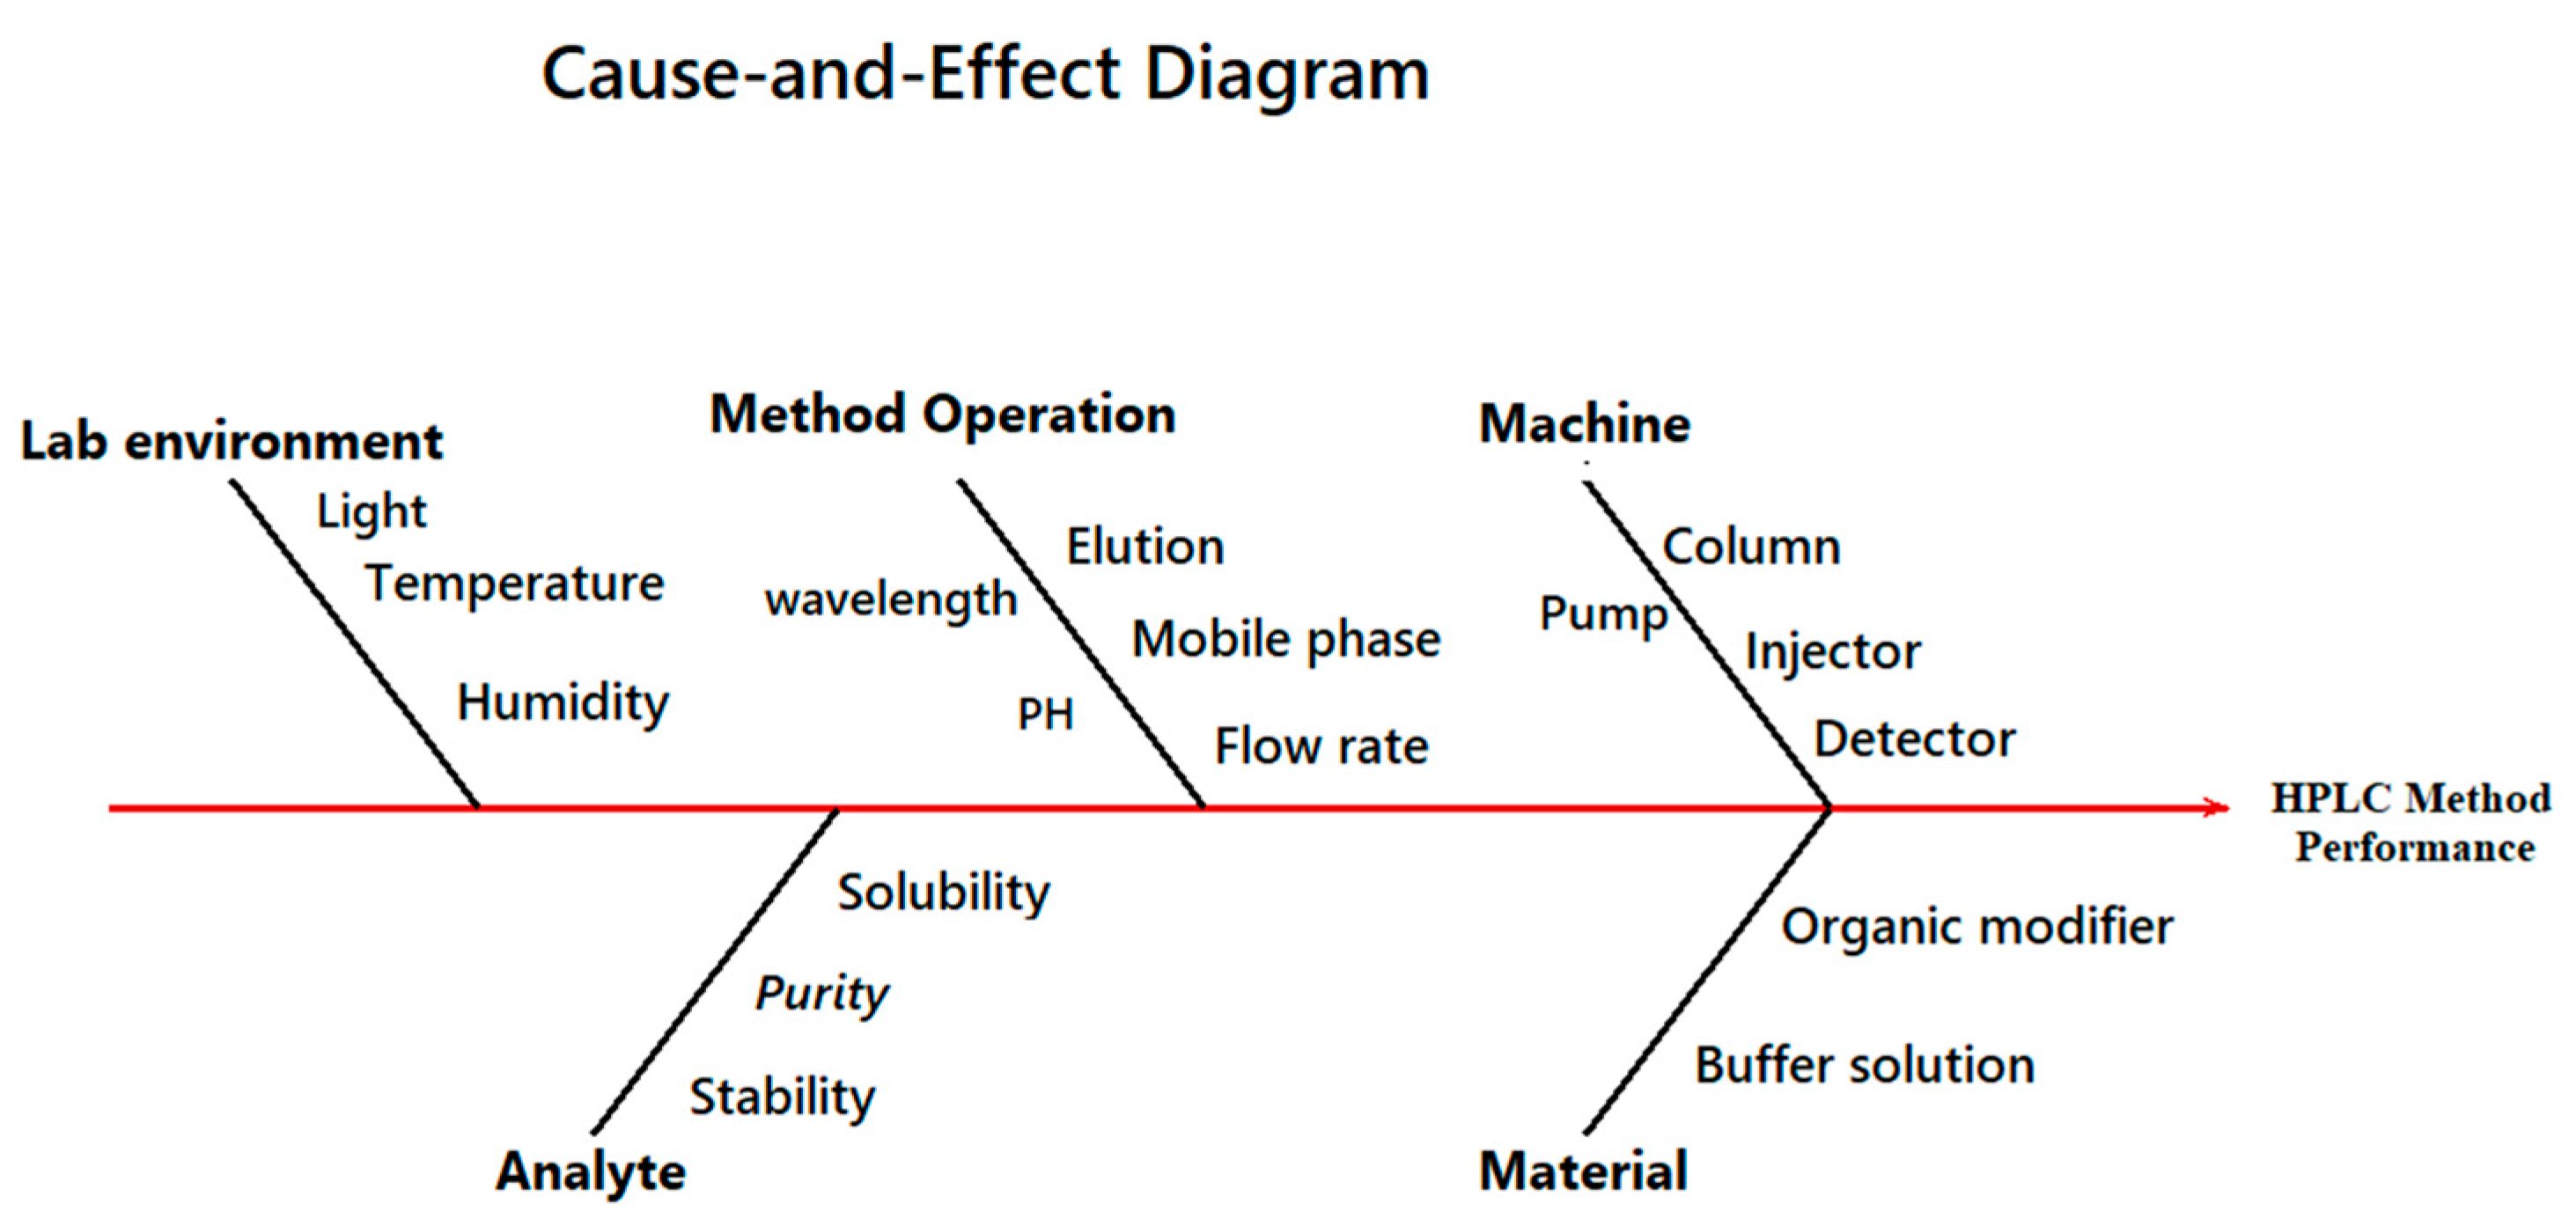
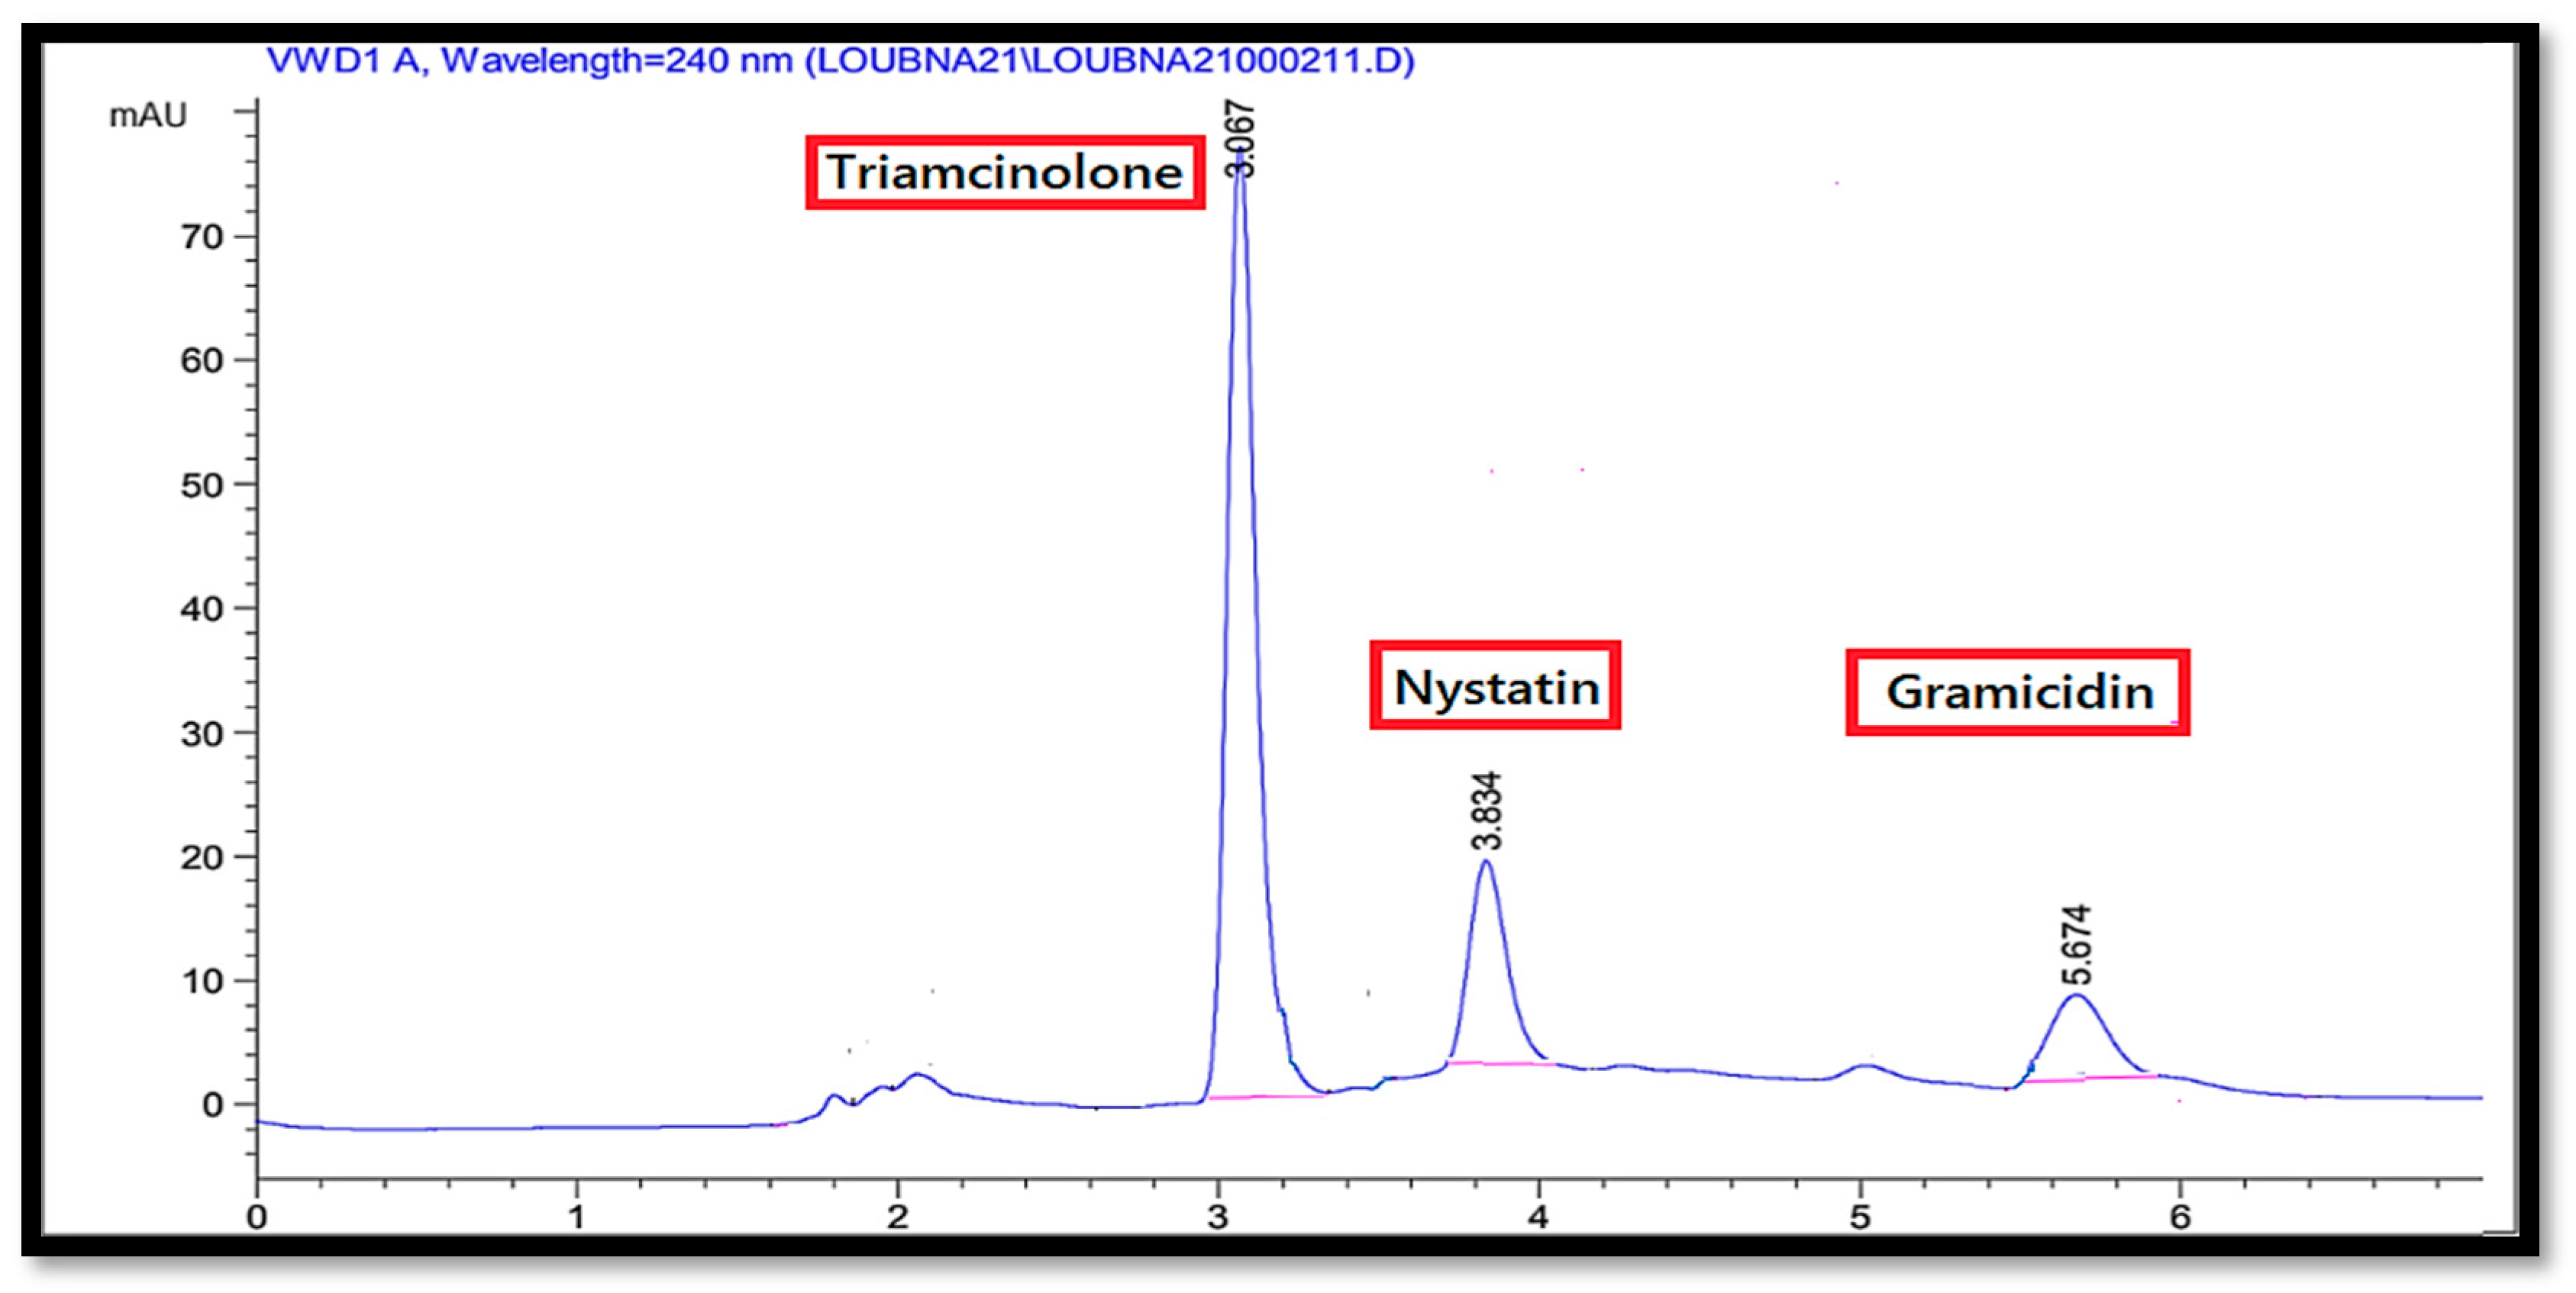
3.1. Method Development
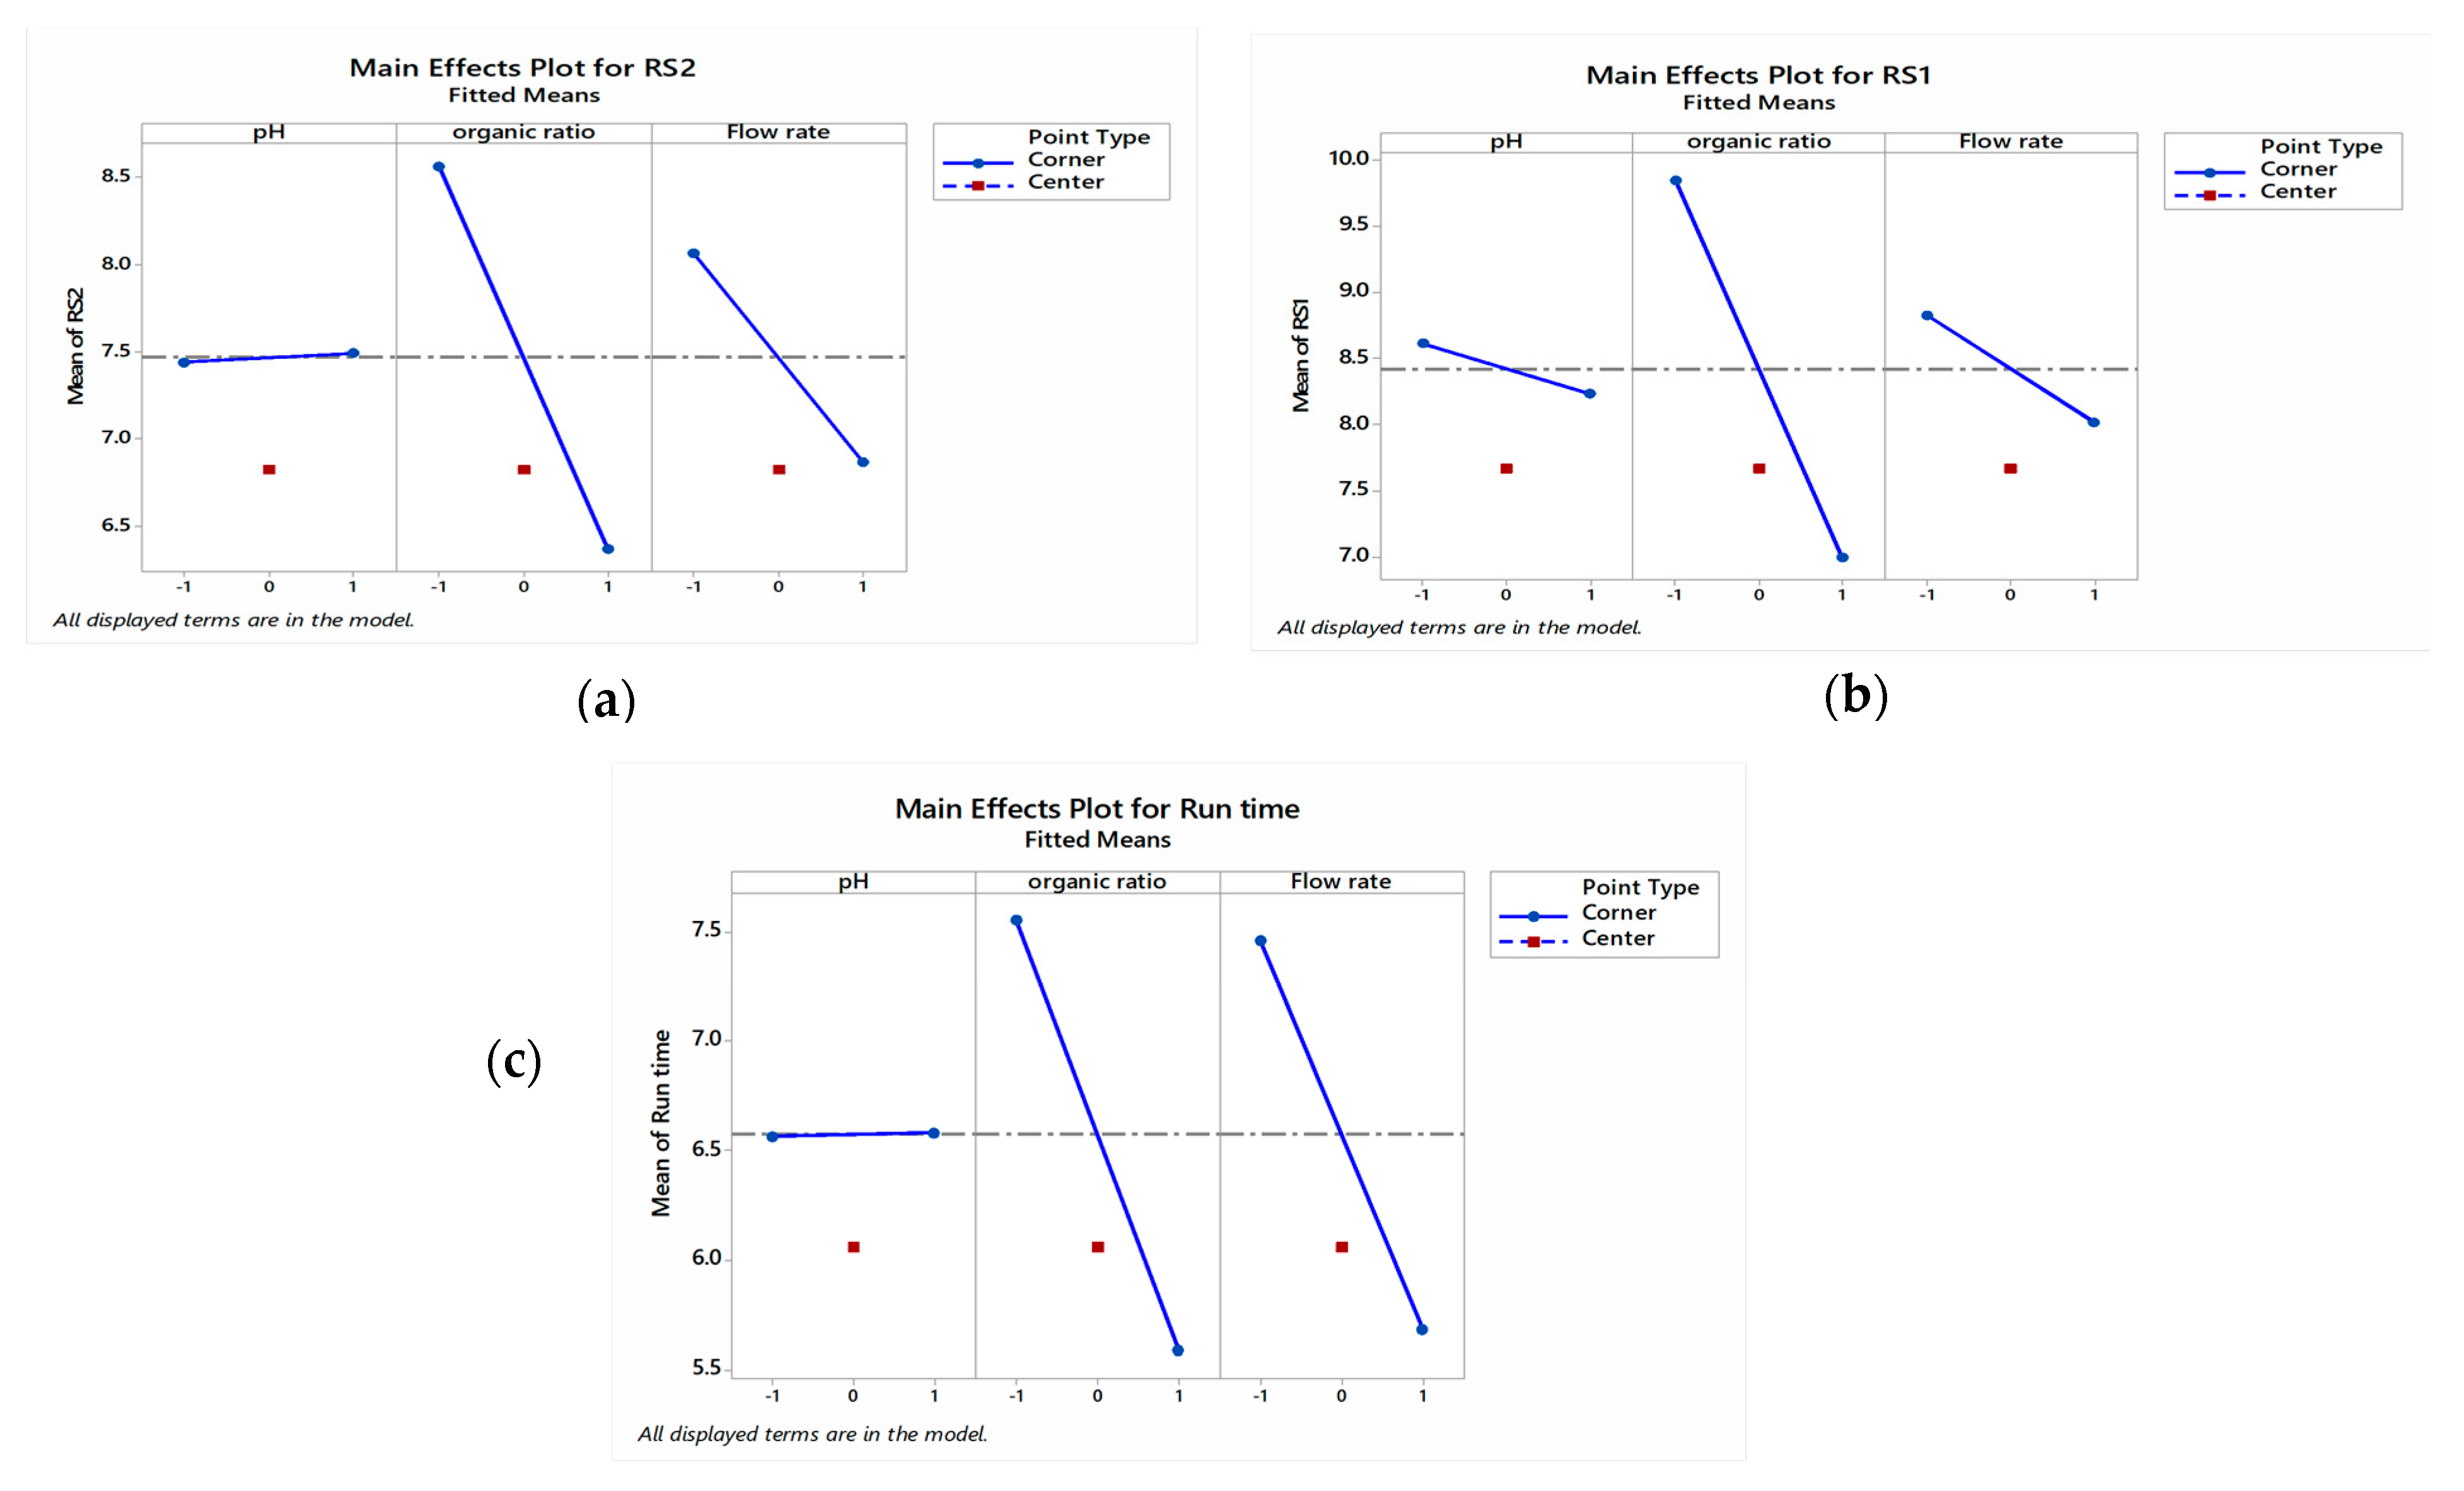
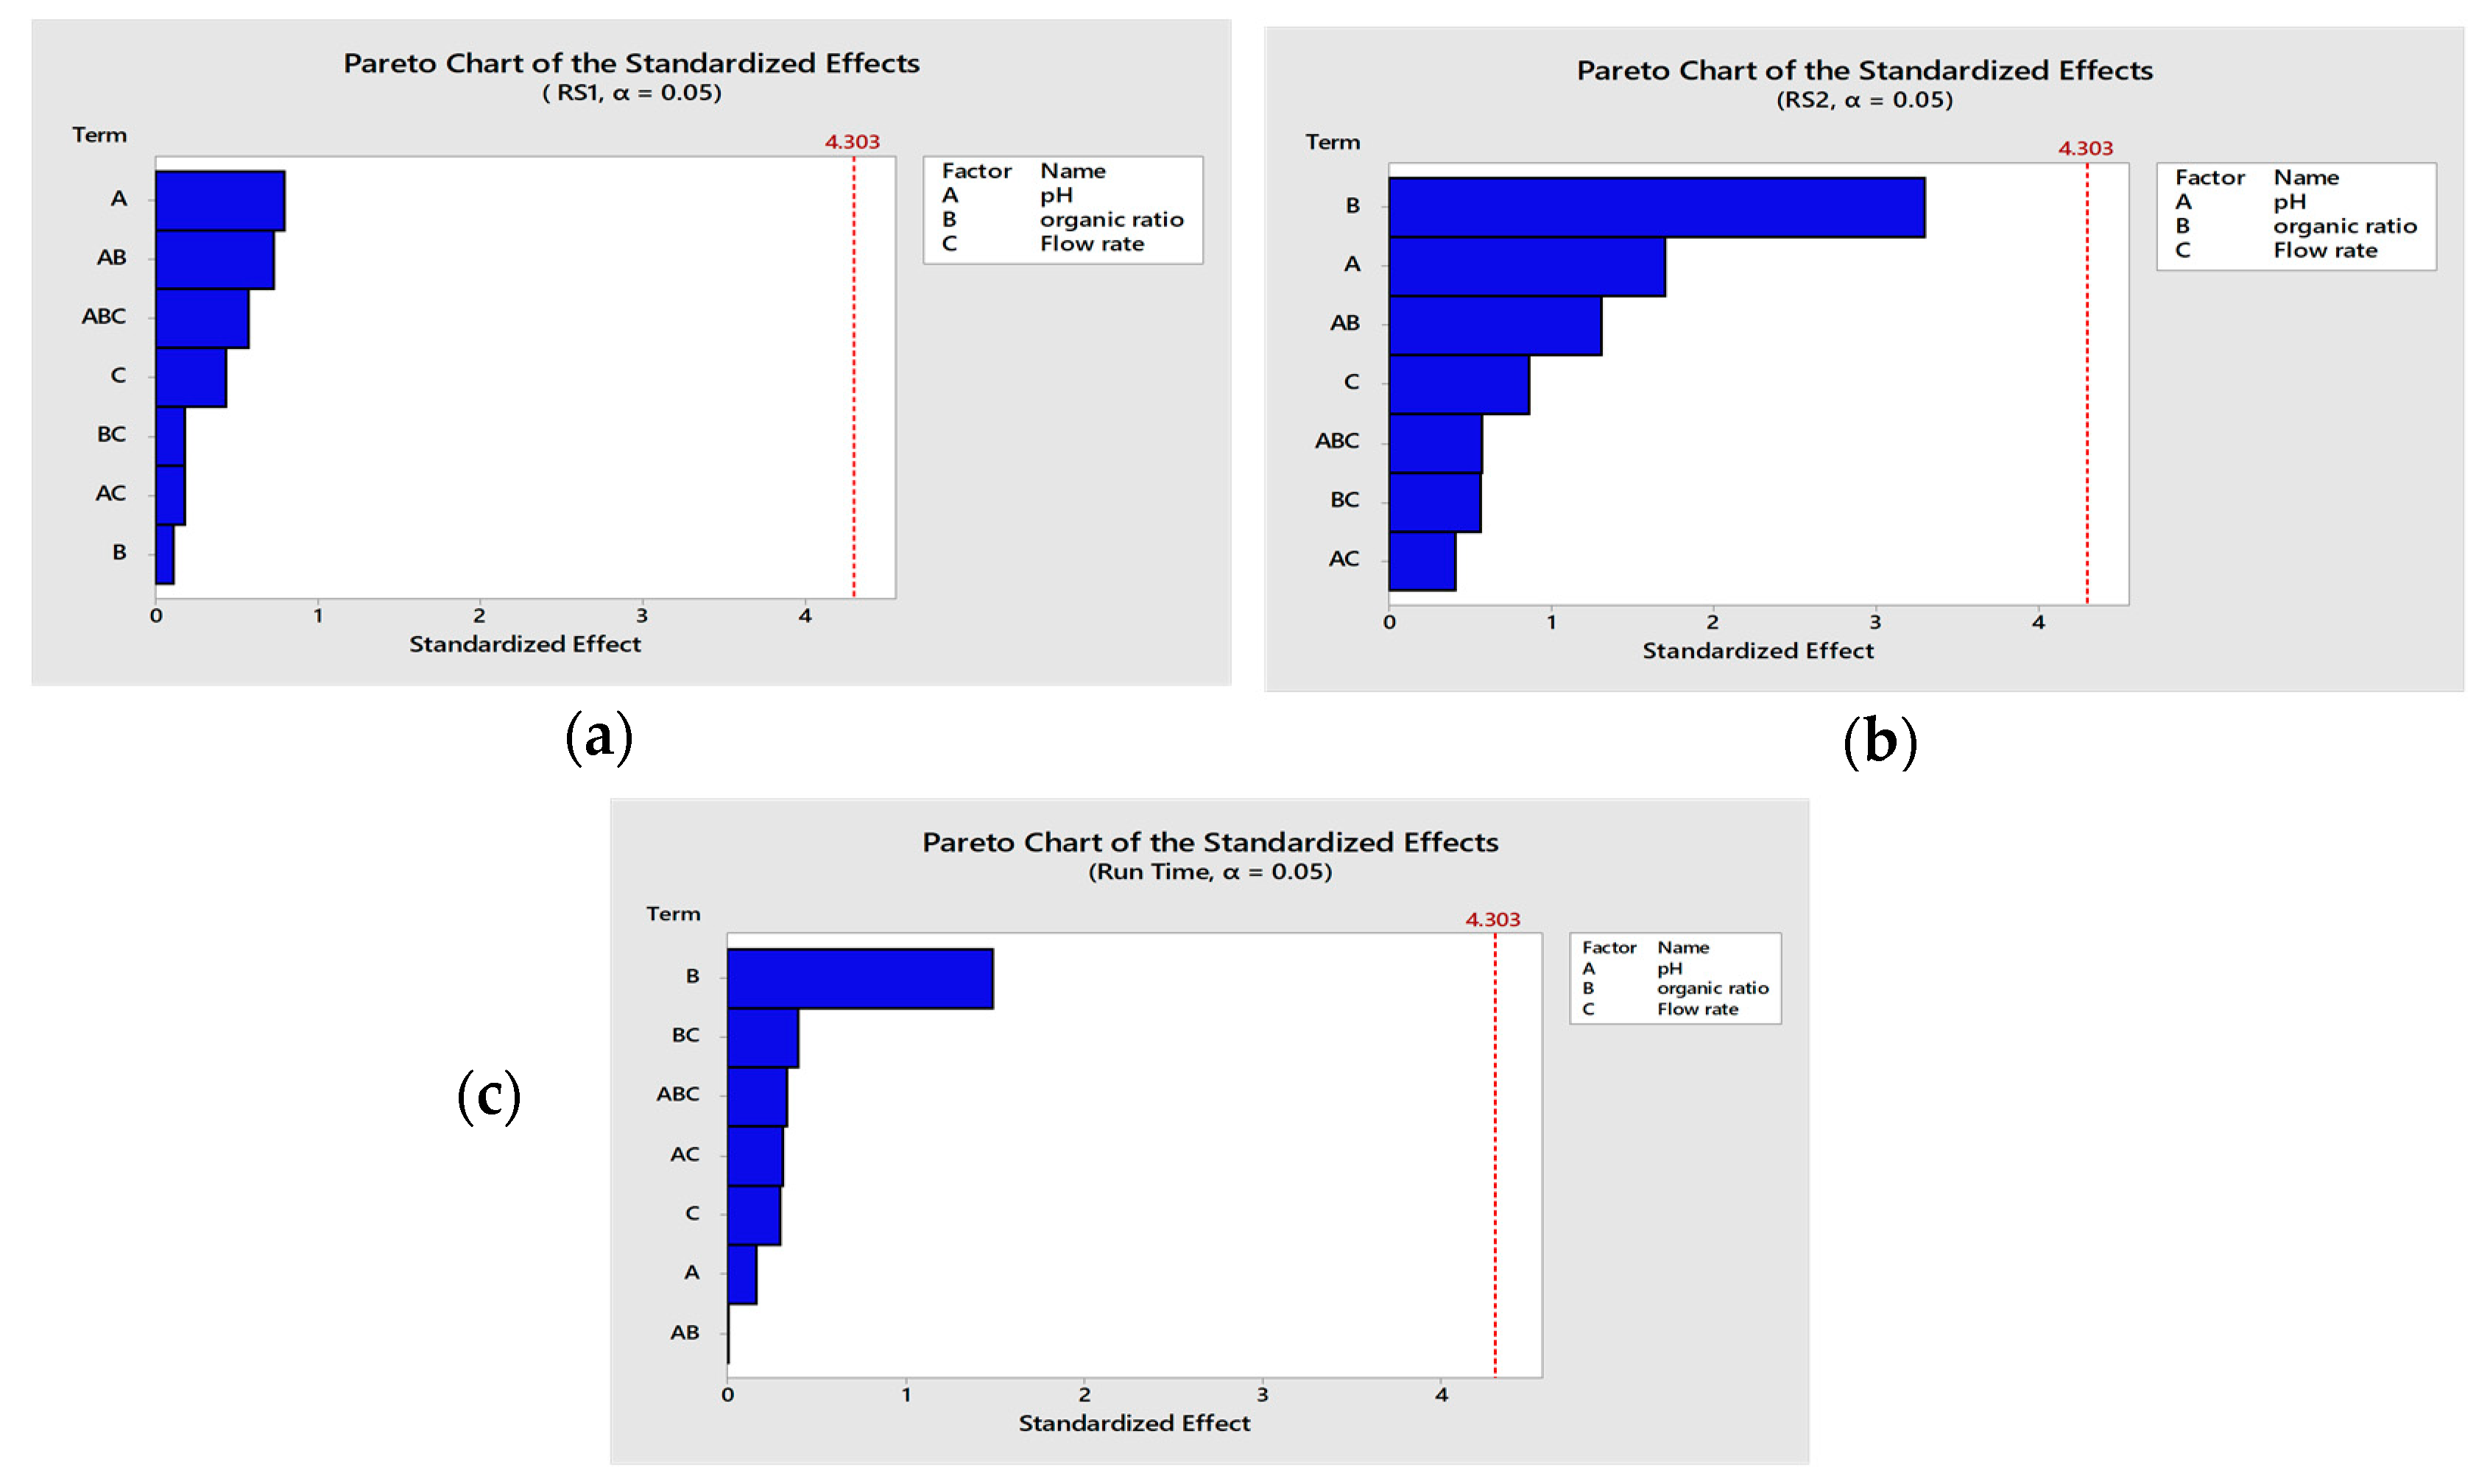
3.2. Screening Design
pH· methanol − 0.098 flow rate· methanol − 0.26 pH · methanol· flow rate.
pH· methanol + 5.09 pH· methanol + 6.85 pH· methanol· flow rate.
+ 0.28 pH· methanol + 0.18 pH· methanol· flow rate.
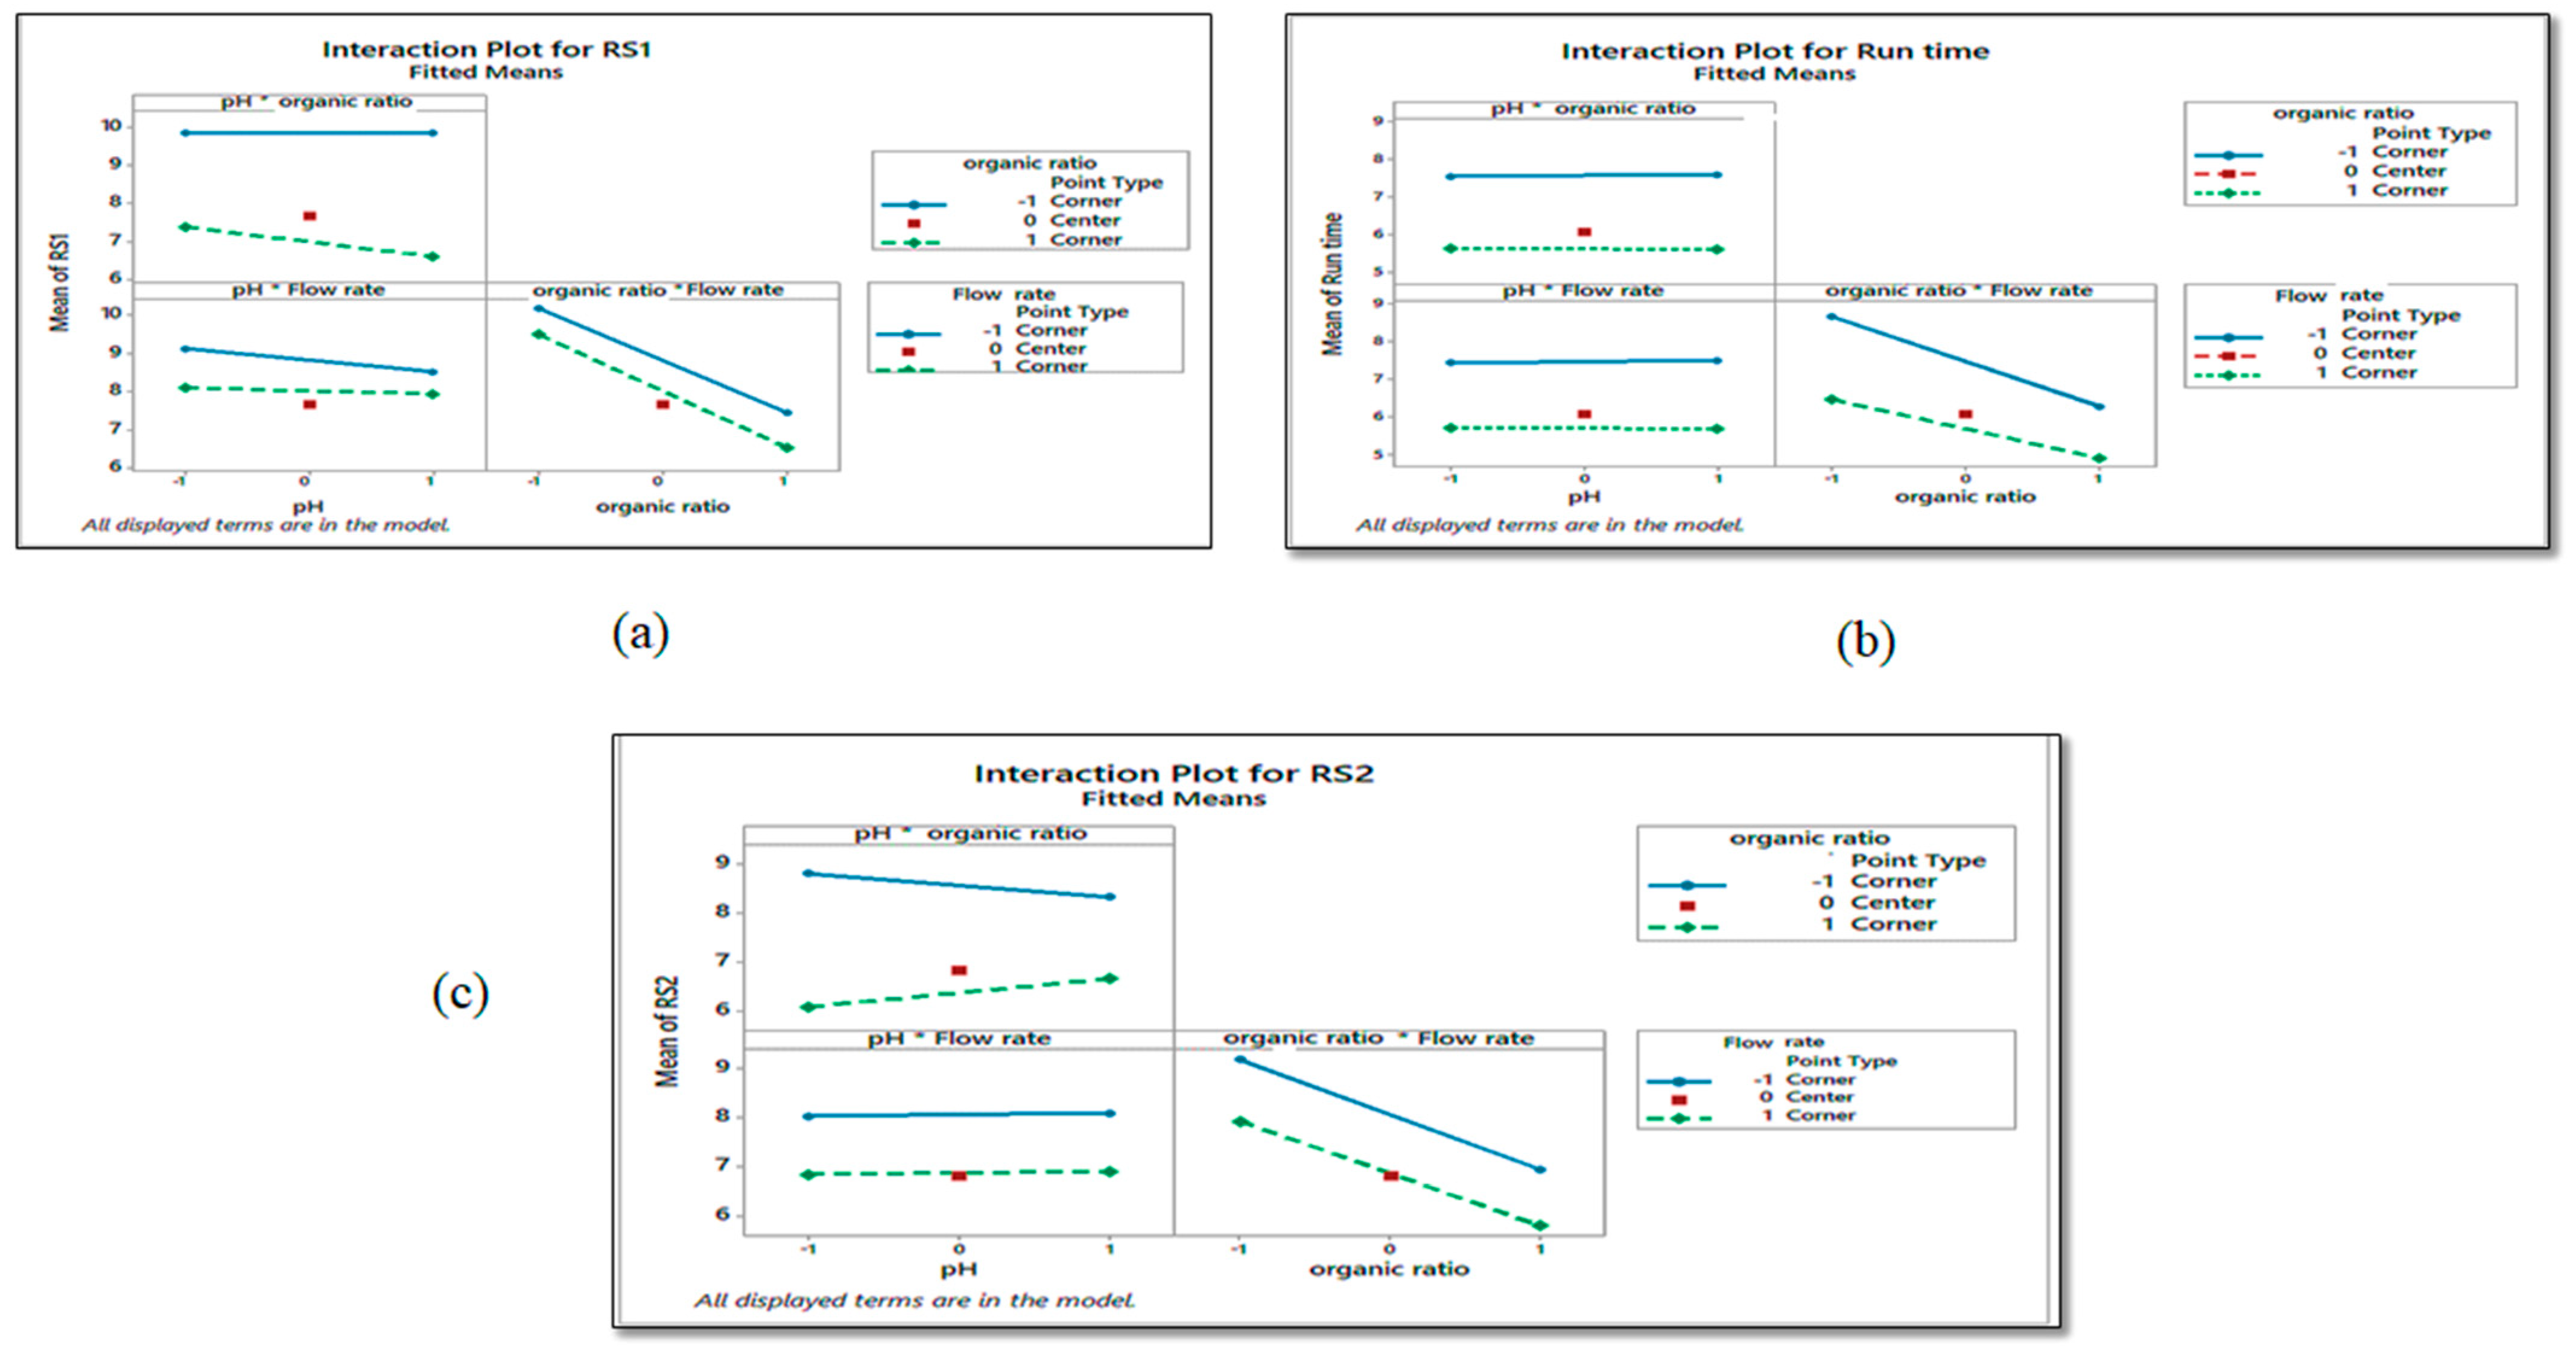
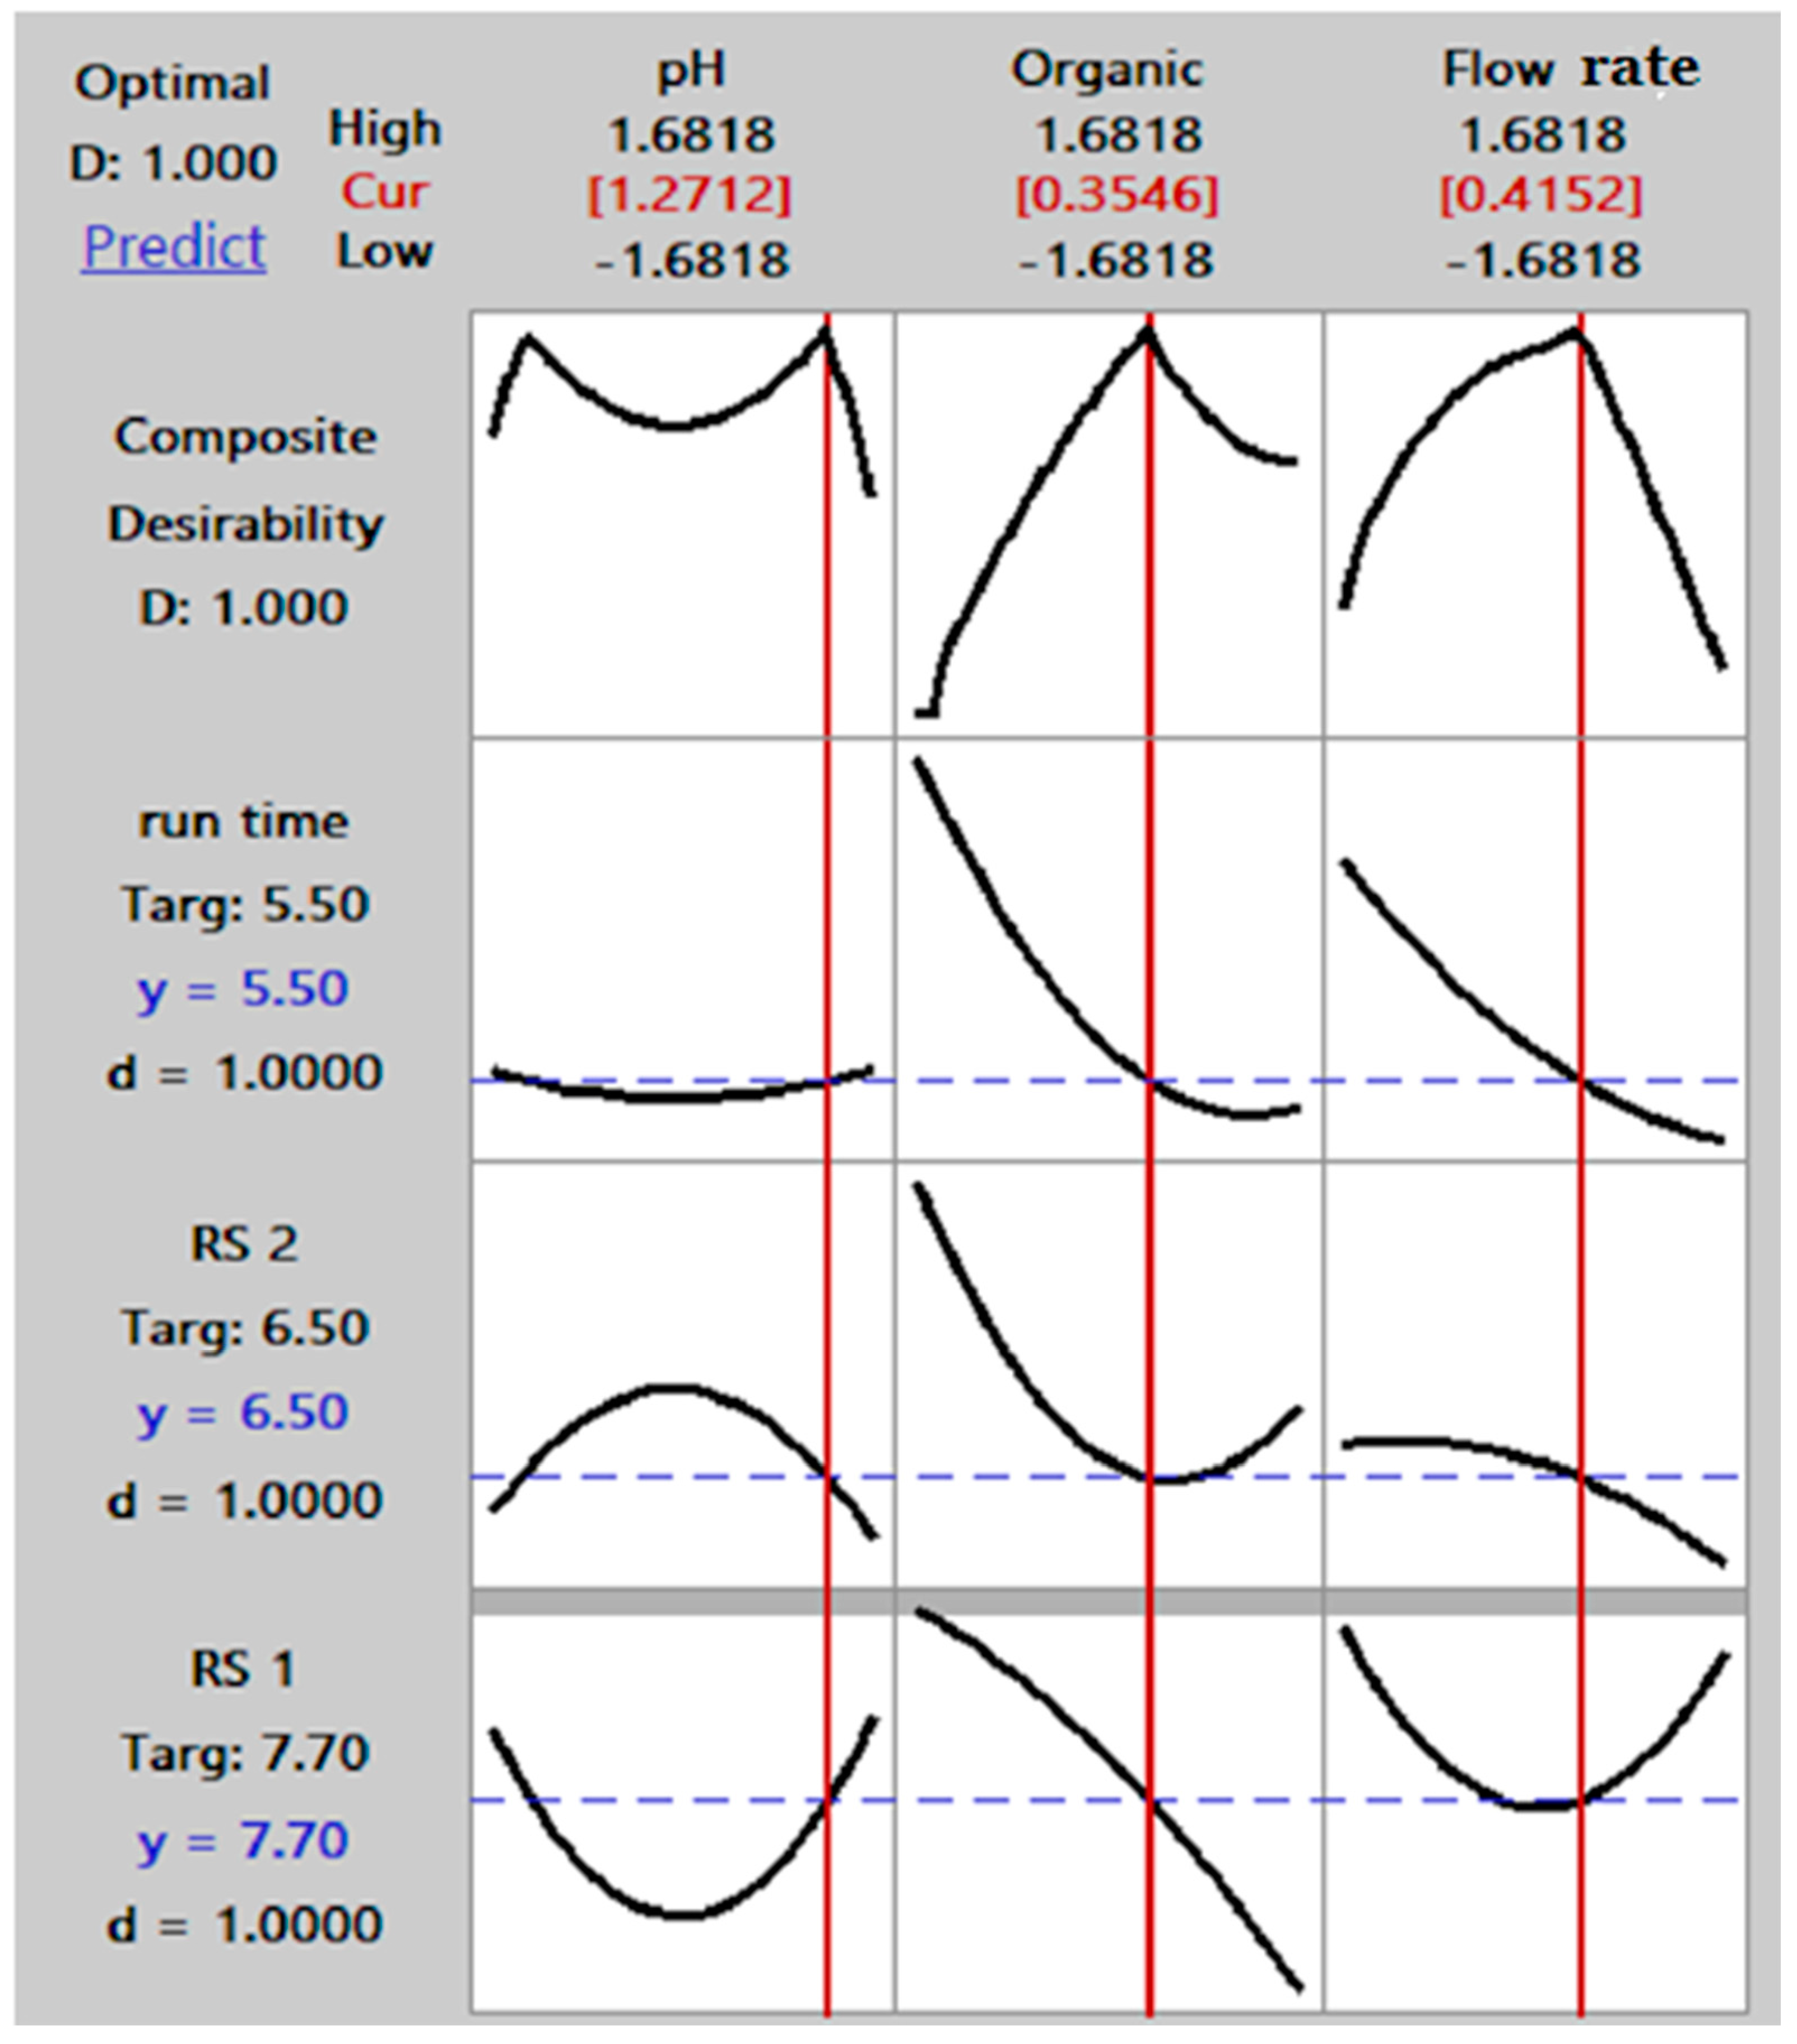
3.3. Optimization Design
methanol. methanol − 0.28 flow-rate. Flow rate + 0.3 pH. methanol + 3.3 pH. flowrate + 3.5 methanol. flow-rate.
methanol. methanol − 0.19 flow-rate. flow-rate + 0.086 pH. methanol + 0.02pH. flow-rate + 0.16 methanol. flow-rate.
3.4. Method Validation
3.4.1. Linearity
3.4.2. Accuracy
3.4.3. Precision
3.4.4. LOD and LOQ
3.5. Robustness
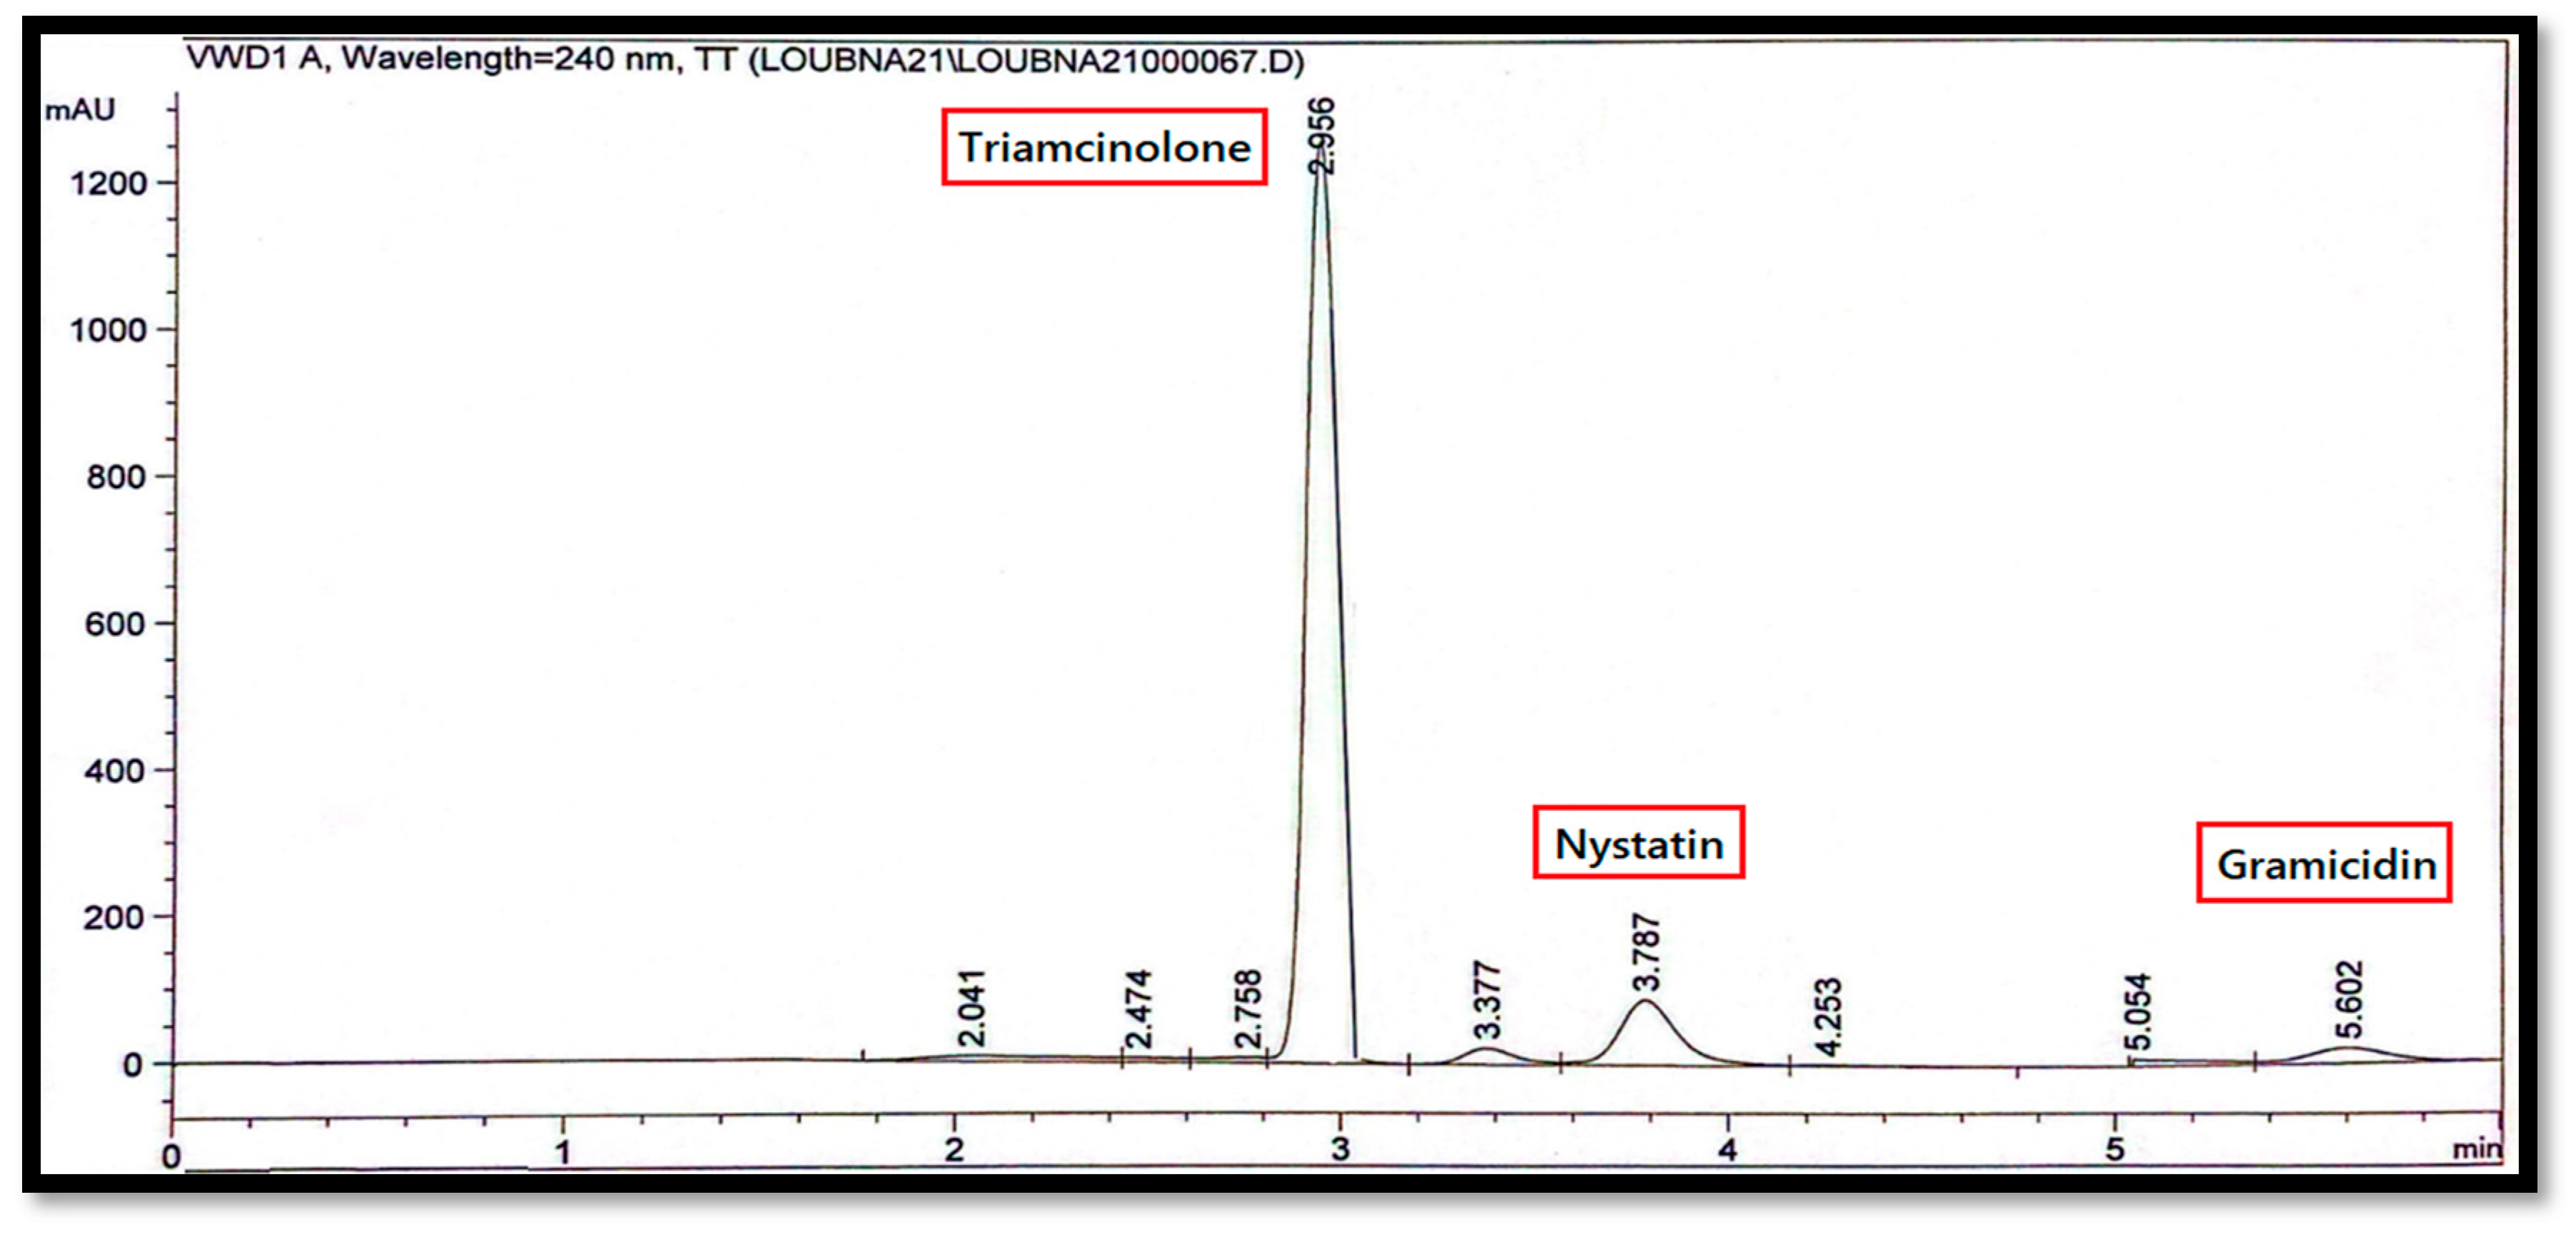
4. Application
5. Conclusions
Supplementary Materials
Author Contributions
Funding
Data Availability Statement
Conflicts of Interest
References
- Elbalkiny, H.T.; Yehia, A.M.; Riad, S.M.; Elsaharty, Y.S. Derivative constant wavelength synchronous fluorescence spectrometry for the simultaneous detection of cefadrine and cefadroxil in water samples. Spectrochim. Acta-Part. A Mol. Biomol. Spectrosc. 2020, 229, 117903. [Google Scholar] [CrossRef] [PubMed]
- Semreen, M.H.; Shanableh, A.; Semerjian, L.; Alniss, H.; Mousa, M.; Bai, X.; Acharya, K. Simultaneous Determination of Pharmaceuticals by Solid-phase Extraction and Liquid Chromatography-Tandem Mass Spectrometry: A case study from sharjah sewage treatment plant. Molecules 2019, 24, 633. [Google Scholar] [CrossRef] [PubMed]
- Kempin, D.; Kot-wasik, A. The use of RP-HPLC-Q-TOF-MS as a powerful tool for wastewater composition profiling and selection of water pollution marker specific to wastewater contamination. Mon. Für Chem.-Chem. Mon. 2018, 0123456789, 1595–1604. [Google Scholar] [CrossRef] [PubMed]
- van Heugten, A.J.P.; de Boer, W.; de Vries, W.S.; Markesteijn, C.M.A.; Vromans, H. Development and validation of a stability-indicating HPLC-UV method for the determination of triamcinolone acetonide and its degradation products in an ointment formulation. J. Pharm. Biomed. Anal. 2018, 149, 265–270. [Google Scholar] [CrossRef] [PubMed]
- Muralidharan, S.; Venugopal, V.; Kumar, J.; Parasuraman, S. Development and Validation of a New RP-HPLC Method for the Analysis of Triamcinolone in Human Plasma. Turk. J. Pharm. Sci. 2016, 13, 9–16. [Google Scholar]
- Silva, A.A.; Formariz, T.P.; Scarpa, M.V.; De Oliveira, A.G. Development and validation of HPLC method for quantitative analysis of triamcinolone in biodegradable microparticles. Rev. De Ciências Farm. Básica E Apl. 2006, 27, 119–126. [Google Scholar]
- Redasani, V.K.; Tamboli, P.S.; Surana, S.J. Development and Validation of a Stability Indicating Rp-Hplc Method for the Estimation of Triamcinolone in Bulk and in Tablet Formulation. J. Anal. Pharm. Res. 2015, 1, 5–9. [Google Scholar] [CrossRef]
- Sebaiy, M.M.; El-Adl, S.M.; Baraka, M.M.; Mohram, M.S.; Elkady, Y.M. Stability Indicating HPLC Method for the Simultaneous Estimation of Triamcinolone Acetonide and Benzyl Alcohol in Pure Form and Epirelefan® Vial. Am. J. Med. Chem. 2021, 123, 1–6. [Google Scholar] [CrossRef]
- Abbas, S.S.; Hegazy, M.A.; Hendawy, H.A.M.; Weshahy, S.A.; Abdelwahab, M.H. Resolution and quantitation of triamcinolone acetonide and its coformulated drug in the presence of its impurities and degradation products by HPTLC and HPLC. J. AOAC Int. 2018, 101, 981–991. [Google Scholar] [CrossRef] [PubMed]
- Groll, A.H.; Mickiene, D.; Werner, K.; Piscitelli, S.C.; Walsh, T.J. High-performance liquid chromatographic determination of liposomal nystatin in plasma and tissues for pharmacokinetic and tissue distribution studies. J. Chromatogr. B Biomed. Sci. Appl. 1999, 735, 51–62. [Google Scholar] [CrossRef] [PubMed]
- Llabot, J.M.; Allemandi, D.A.; Manzo, R.H.; Longhi, M.R. HPLC method for the determination of nystatin in saliva for application in clinical studies. J. Pharm. Biomed. Anal. 2007, 45, 526–530. [Google Scholar] [CrossRef]
- Heneedak, H.M.; Salama, I.; Mostafa, S.; El-Sadek, M. HPLC and chemometric methods for the simultaneous determination of miconazole nitrate and nystatin. J. Chromatogr. Sci. 2012, 50, 855–861. [Google Scholar] [CrossRef] [PubMed]
- Pradesh, A. UPLC method design and development for gramicidin, neomycin and triamcinolone acetonide in bulk pharmaceutical formulation. Anal. Chim. Acta 2020, 4, 23. [Google Scholar]
- Baii, M.C.; Brace, L.; Abad, C. HPLC study on the ‘history’ dependence of gramicidin A conformation in phospholipid model membranes. Sci. Pharm. 1989, 250, 67–71. [Google Scholar]
- Arie, Y.; Miyai, H.; Suzuki, A.; Okabe, T.; Takashima, M.; Takata, M.; Kurasawa, T.; Ito, M.; Arakawa, R.; Ogura, Y.; et al. Comparative study on pharmacokinetics and toxicity of intravitreal and sub-Tenon injection of triamcinolone acetonide in ocular tissues. Int. J. Ophthalmol. 2020, 13, 1864–1871. [Google Scholar] [CrossRef] [PubMed]
- Amir, A.; Levin-khalifa, M.; Dvash, T.; Methyl, N. Water Soluble Nystatin and Derivative. J. Antibiot. 2020, 20, 182–187. [Google Scholar] [CrossRef] [PubMed]
- Swierstra, J.; Kapoerchan, V.; Knijnenburg, A.; van Belkum, A.; Overhand, M. Structure, toxicity and antibiotic activity of gramicidin S and derivatives. Eur. J. Clin. Microbiol. Infect. Dis. 2016, 35, 763–769. [Google Scholar] [CrossRef] [PubMed]
- Mandpe, S.R.; Parate, V.R.; Naik, J.B. Experimental design approach, screening and optimization of system variables, analytical method development of flurbiprofen in nanoparticles and stability-indicating methods for high-pressure liquid chromatography. Futur. J. Pharm. Sci. 2022, 8, 38. [Google Scholar] [CrossRef]
- Topic Q2 (R1) Validation of Analytical Procedure: Text and Methedology. In Proceedings of the International Conference of Harmonization, Incheon, Republic of Korea, 15–16 November 2022.
- Minitab (Version 17) Software. 2013. Available online: http://www.minitab.com/en-US/products/minitab/default.aspx (accessed on 28 August 2013).
- Orwa, J.A. A validated ultra-performance liquid chromatography-tandem mass spectrometry method for the quantification of polymyxin B in mouse serum and epithelial lining fluid: Application to pharmacokinetic studies. Liq. Chromatogr. 2001, 52, 17–21. [Google Scholar] [CrossRef]
- Center for Drug Evaluation and Research (CDER). Reviewer Guidance’ Validation of Chromatographic Methods; Center for Drug Evaluation and Research (CDER): Washington, DC, USA, 1994. [Google Scholar]


| pH | Organic Solvent % | Flow Rate mL/min | RS1 | RS2 | Run Time |
|---|---|---|---|---|---|
| −1 | 1 | −1 | 8.08 ± 0.03 | 6.82 ± 0.04 | 6.28 ± 0.03 |
| 0 | 0 | 0 | 7.80 ± 0.01 | 6.88 ± 0.01 | 6.06 ± 0.02 |
| 1 | −1 | 1 | 9.50 ± 0.05 | 7.53 ± 0.03 | 6.46 ± 0.05 |
| −1 | 1 | 1 | 6.69 ± 0.05 | 5.35 ± 0.06 | 4.93 ± 0.06 |
| 0 | 0 | 0 | 7.60 ± 0.03 | 6.80 ± 0.06 | 6.06 ± 0.02 |
| 0 | 0 | 0 | 7.60 ± 0.04 | 6.80 ± 0.06 | 6.06 ± 0.01 |
| 1 | −1 | −1 | 10.23 ± 0.03 | 9.13 ± 0.10 | 8.72 ± 0.03 |
| 1 | 1 | 1 | 6.40 ± 0.06 | 6.26 ± 0.05 | 4.88 ± 0.01 |
| −1 | −1 | −1 | 10.19 ± 0.01 | 9.27 ± 0.06 | 8.59 ± 0.03 |
| −1 | −1 | 1 | 9.51 ± 0.09 | 8.34 ± 0.57 | 6.47 ± 0.06 |
| 1 | 1 | −1 | 6.83 ± 0.06 | 7.07 ± 0.01 | 6.29 ± 0.03 |
| pH | Organic Solvent % | Flow Rate (mL/min) | RS1 | RS2 | Run Time |
|---|---|---|---|---|---|
| 0 | 0 | 0 | 8.40 ± 0.07 | 9.30 ± 0.05 | 6.06 ± 0.04 |
| 0 | 1.68 | 0 | 8.20 ± 0.04 | 7.85 ± 0.02 | 5.95 ± 0.01 |
| 0 | 0 | −1.68 | 9.00 ± 0.07 | 9.85 ± 0.01 | 7.60 ± 0.02 |
| 0 | 0 | 1.68 | 7.85 ± 0.03 | 7.70 ± 0.11 | 5.20 ± 0.02 |
| −1 | 1 | 1 | 7.20 ± 0.06 | 6.00 ± 0.05 | 4.90 ± 0.10 |
| −1 | 1 | −1 | 8.20 ± 0.06 | 6.70 ± 0.05 | 6.30 ± 0.30 |
| 0 | −1.68 | 0 | 8.30 ± 0.16 | 8.50 ± 0.06 | 6.2 ± 0.05 |
| 1 | −1 | −1 | 10.68 ± 0.07 | 9.48 ± 0.06 | 8.55 ± 0.02 |
| 1 | −1 | 1 | 10.00 ± 0.14 | 8.20 ± 0.03 | 6.50 ± 0.01 |
| 0 | 0 | 0 | 7.80 ± 0.08 | 8.80 ± 0.05 | 6.01 ± 0.01 |
| 0 | 0 | 0 | 8.20 ± 0.07 | 8.60 ± 0.01 | 6.06 ± 0.20 |
| 1 | 1 | 1 | 8.00 ± 0.27 | 5.05 ± 0.04 | 4.90 ± 0.03 |
| −1.68 | 0 | 0 | 10.00 ± 0.17 | 6.90 ± 0.02 | 6.19 ± 0.10 |
| 0 | 0 | 0 | 7.80 ± 0.01 | 6.88 ± 0.07 | 6.06 ± 0.02 |
| 1.68 | 0 | 0 | 7.70 ± 0.01 | 7.80 ± 0.01 | 6.20 ± 0.05 |
| 0 | 0 | 0 | 7.60 ± 0.02 | 6.80 ± 0.02 | 6.06 ± 0.01 |
| −1 | −1 | 1 | 7.60 ± 0.01 | 8.70 ± 0.07 | 6.40 ± 0.02 |
| 1 | 1 | −1 | 8.80 ± 0.01 | 5.93 ± 0.06 | 6.30 ± 0.09 |
| 0 | 0 | 0 | 7.60 ± 0.01 | 6.80 ± 0.02 | 6.06 ± 0.01 |
| −1 | −1 | −1 | 10.10 ± 0.21 | 9.95 ± 0.1 | 8.40 ± 0.03 |
| Variable Validation | Triamcinolone | Nystatin | Gramicidin | |
|---|---|---|---|---|
| Values | Values | Values | ||
| Linearity Range (µg/mL) | 1.00–25.00 | 1.00–25.00 | 10.00–50.00 | |
| Slope | 45.131 | 18.333 | 5.4181 | |
| SE of Slope | 0.25 | 0.24 | 0.06 | |
| Intercept | 31.309 | 21.659 | 18.907 | |
| SE of Intercept | 3.24 | 3.18 | 1.92 | |
| Correlation Coefficient | 0.9999 | 0.9993 | 0.9995 | |
| Accuracy a | 99.07 ± 0.04 | 101.01 ± 0.12 | 100.52 ± 0.14 | |
| Precision (%RSD) | Intra-day a | 0.31 | 0.97 | 0.40 |
| Inter-day b | 0.57 | 0.70 | 0.46 | |
| LOD (µg/mL) | 0.24 | 0.57 | 1.17 | |
| LOQ (µg/mL) | 0.72 | 1.73 | 3.54 | |
| Variables | Triamcinolone | Nystatin | Gramicidin | |||
|---|---|---|---|---|---|---|
| HPLC Method | Reported Method a [4] | HPLC Method | Reported Method b [12] | HPLC Method | Reported Method c [21] | |
| Mean | 99.43 | 100.03 | 98.56 | 99.58 | 100.75 | 100.03 |
| SD | 0.94 | 0.68 | 1.31 | 1.11 | 0.94 | 0.68 |
| Variance | 0.88 | 0.46 | 1.28 | 1.24 | 0.88 | 0.46 |
| t-test d (2.23) | 1.29 | ---- | 1.58 | ---- | 1.56 | ---- |
| F-test d (5.05) | 1.90 | ---- | 1.03 | ---- | 1.89 | ---- |
| Sample Number a | Triamcinolone | Nystatin | Gramicidin |
|---|---|---|---|
| 1 | 49.48 µg/mL | 1.62 µg/mL | 4.41 µg/mL |
| 2 | 4.78 µg/mL | 1.06 µg/mL | N.D. |
| 3 | 1.32 µg/mL | N.D. | N.D. |
| 4 | N.D. | N.D. | N.D. |
| 5 | N.D. | N.D. | N.D. |
| 6 | N.D. | N.D. | N.D. |
Disclaimer/Publisher’s Note: The statements, opinions and data contained in all publications are solely those of the individual author(s) and contributor(s) and not of MDPI and/or the editor(s). MDPI and/or the editor(s) disclaim responsibility for any injury to people or property resulting from any ideas, methods, instructions or products referred to in the content. |
© 2023 by the authors. Licensee MDPI, Basel, Switzerland. This article is an open access article distributed under the terms and conditions of the Creative Commons Attribution (CC BY) license (https://creativecommons.org/licenses/by/4.0/).
Share and Cite
Elsharkawy, L.; Hegazy, M.A.; Elgendy, A.E.; Ahmed, R.M. Experimental Design Approach for Development of HPLC Method for Simultaneous Analysis of Triamcinolone, Nystatin, and Gramicidin in Industrial Wastewater. Separations 2023, 10, 342. https://doi.org/10.3390/separations10060342
Elsharkawy L, Hegazy MA, Elgendy AE, Ahmed RM. Experimental Design Approach for Development of HPLC Method for Simultaneous Analysis of Triamcinolone, Nystatin, and Gramicidin in Industrial Wastewater. Separations. 2023; 10(6):342. https://doi.org/10.3390/separations10060342
Chicago/Turabian StyleElsharkawy, Loubna, Maha A. Hegazy, Ahmed E. Elgendy, and Rasha M. Ahmed. 2023. "Experimental Design Approach for Development of HPLC Method for Simultaneous Analysis of Triamcinolone, Nystatin, and Gramicidin in Industrial Wastewater" Separations 10, no. 6: 342. https://doi.org/10.3390/separations10060342