Article

Quantitative Analysis of Eight Compounds in Traditional Korean Medicine, Gongjindan Using HPLC, UPLC–MS/MS, and GC–MS/MS Systems

KM Science Research Division, Korea Institute of Oriental Medicine, Daejeon 34054, Republic of Korea
*
Author to whom correspondence should be addressed.
Separations 2023, 10(4), 231; https://doi.org/10.3390/separations10040231
Submission received: 28 February 2023 / Revised: 20 March 2023 / Accepted: 23 March 2023 / Published: 28 March 2023
(This article belongs to the Collection Feature Paper Collection in Section Chromatographic Separations)

Abstract

:
Gongjindan (GJD) is a traditional Korean medicine consisting of four herbal medicines and two animal-derived medicines, and is taken as a tonic in Republic of Korea. In this study, the goal was to develop and validate a simultaneous analytical method to quantify eight compounds in commercially available GJD samples using high-performance liquid chromatography (HPLC), ultra-performance liquid chromatography with tandem mass spectrometry (UPLC–MS/MS), and gas chromatography with tandem mass spectrometry (GC–MS/MS) systems. In HPLC and UPLC–MS/MS, seven components (gallic acid, 5-(hydroxymethyl)furfural, morroniside, loganin, nodakenin, decursin, and decursinol angelate) were separated and quantified using a distilled water–acetonitrile mobile phase system on a Capcell Pak UG80 C18 column and an Acquity UPLC BEH C18 column, respectively. Muscone was quantified using GC–MS/MS. The developed assays were validated by evaluating the linearity, limit of detection, limit of quantitation, recovery, and precision. In the regression equations of all compounds, the coefficient of determination was ≥0.9917, showing good linearity. The recovery was 93.70–108.17%, and the relative standard deviation values in the precision test were all <1.50%. Using the developed analysis methods, GJD samples were determined to contain the eight target compounds in concentrations from non-detected to 10.75 mg/g. The analytical assays developed and validated in this study can be used to obtain data for the quality control of commercially available GJDs and for the further expansion of efficacy and clinical studies.

1. Introduction

Herbal medicine preparations are usually composed of two or more types of herbal medicines, animal-derived medicines, and mineral medicines, and these types of medicines have long been used to treat and prevent various diseases, and to improve health. Gongjindan (GJD) is a traditional Korean medicine consisting of four herbal medicines (Angelica gigas Nakai, Cornus officinalis Seibold & Zucc., Panax ginseng C.A. Meyer, and Rehmannia glutinosa (Gaertn.) DC.) and two animal-derived medicines (Moschus moschifrus L. and Cervus nippon Temminck), and is one of the best-known tonics in Republic of Korea [1]. When GJD has been used in animal models, liver protection [1], antioxidant [2], neuroprotective [3], anti-fatigue [4], and Alzheimer’s-disease-protective [5] effects have been demonstrated.
Each of the herbal medicines that comprise GJD contain various ingredients, including coumarins (e.g., nodakenin, decursin, and decursinol angelate) from A. gigas [6], iridoids (e.g., loganin, morroniside, and cornuside) from C. officinalis [7], triterpenoid saponins (e.g., ginsenoside Rb1 and ginsenoside Rg1) from P. ginseng [8], miscellaneous compounds (e.g., 5-(hydroxymethyl)furfural; 5-HMF) from R. glutinosa [9], macrocyclic ketones (e.g., muscone and normuscone) and steroids (e.g., cholesterol, cholestane-3-ol, and lanosterol) from M. moschifrus [10,11,12], and peptidoglycans and gangliosides from C. nippon [13,14].
A range of analytical methods have been developed for the quality assessment of each constituent crude drug of GJD, based on high-performance liquid chromatography (HPLC), gas chromatography (GC), GC with mass spectrometry (GC–MS), ultra-performance liquid chromatography (UPLC), and ultra-performance liquid chromatography with tandem mass spectrometry (UPLC–MS/MS) [6,7,8,12,14,15,16,17,18]. However, the analysis of GJD as a preparation containing a combination of six types of herbal and animal-derived medicines has not yet been reported. Previously, Hong et al. [4] and Lee et al. [19] reported an analysis method using HPLC and GC–MS for GJD, which was composed of five herbal medicines, excluding R. glutinosa. However, R. glutinosa, which was excluded from these reports, is an important herbal medicine that exhibits immunomodulatory [20], hepatoprotective [21], and neuroprotective [22] activities.
In this study, a simultaneous quantitative analysis method was developed and validated for seven compounds (gallic acid, 5-HMF, morroniside, loganin, nodakenin, decursin, and decursinol angelate) using HPLC with a photodiode array detector (HPLC–PDA) and UPLC–MS/MS to evaluate the quality of GJD. In addition, muscone, a target compound of M. moschifru, was quantitatively analyzed and validated using gas chromatography with tandem mass spectrometry in selected ion monitoring mode (GC–MS/MS SIM).

2. Materials and Methods

2.1. Chemical and Reagents

The reference standards used in this study were purchased from standard manufacturers: gallic acid (CAS No. 149-91-7, purity of 100.0%, catalog No. G7384), 5-HMF (CAS No. 67-47-0, purity of ≥99.0%, catalog No. W501808), and cyclopentadecanone (internal standard; IS, CAS No. 502-72-7, purity of 99.2%, catalog No. C111201) from Merck KGaA (Darmstadt, Germany); morroniside (CAS No. 25406-64-8, purity of 99.9%, catalog No. BP0960), loganin (CAS No. 18524-94-2, purity of ≥98.0%, catalog No. BP0884), and decursinol angelate (CAS No. 130848-06-5, purity of 98.3%, catalog No. BP1812) from Biopurify Phytochemicals (Chengdu, China); nodakenin (CAS No. 495-31-8, purity of 99.5%, catalog No. CFN90232) from ChemFaces Biochemical (Wuhan, China); decursin (CAS No. 5928-25-6, purity of 98.7%, catalog No. DR11193) from Shanghai Sunny Biotech (Shanghai, China); muscone (CAS No. 541-91-3, purity of 97.7%, catalog No. AL-M141496) from Aladdin Biochemical Technology (Shanghai, China) (Figure S1). All other solvents (methanol, acetonitrile, and distilled water) and reagents (formic acid and acetic acid) were either HPLC- or LC–MS-grade. GJD samples were commercial products supplied by different Korean pharmaceutical companies, and the composition is shown in Table S1.

2.2. HPLC–PDA Analysis

A Shimadzu Prominence LC–20A series system (Kyoto, Japan) controlled by the LabSolution software (version 5.54, SP3) was used for the simultaneous quantitation of the seven target components (gallic acid, 5-HMF, morroniside, loganin, nodakenin, decursin, and decursinol angelate) selected from GJD samples. All analytes were separated using a Capcell Pak UG80 C18 analytical column (250 mm length × 4.6 mm ID, particle size 5 µm, Shiseido, Tokyo, Japan) and a mobile phase of distilled water–acetonitrile (both containing 0.1% (v/v) formic acid). Table S2 presents the HPLC operating conditions for the quantitative analysis in more detail.
For each analyte, a standard stock solution was prepared at a concentration of 1000 µg/mL using methanol. The prepared standard stock solution was kept refrigerated and serially diluted at the time of measurement. Separately, for the sample solution for HPLC quantitative analysis, 100 mg of a GJD sample was accurately taken and 10 mL of 70% methanol was added. After ultrasonic extraction at room temperature for 60 min, the sample solution was filtered using a 0.2 µm syringe filter (Pall Life Sciences, Ann Arbor, MI, USA) before HPLC analysis.

2.3. UPLC–MS/MS Analytical Conditions and Sample Preparation

The simultaneous analysis of the seven analytes in commercial GJD samples was conducted with a UPLC–MS/MS system consisting of a Waters Acquity UPLC system and a TQD MS system (Milford, MA, USA). UPLC and MS/MS analytical conditions for the simultaneous analysis are presented in Table S3, and UPLC–MS/MS MRM factors such as ion mode, MRM transition, cone voltage, and collision energy are shown in Table 1.
The sample (approximately 50 mg) was accurately weighed into a 10 mL volumetric flask and made up with 70% methanol. Ultrasonic extraction for 5 min followed by vortexing for 1 min were carried out, and then the mixture was filtered through a 0.2 µm hydrophobic filter (SSOLKOREA Co., Ltd., Daejeon, Republic of Korea) to obtain the sample solution.

2.4. GC–MS/MS SIM Analysis

GC–MS/MS SIM analysis of muscone in GJD samples was conducted with a Shimadzu GC–MS–TQ8050 (Tokyo, Japan) consisting of a GC-2010 Plus GC system and a TQ8050 MS system. As described for the GC–MS/MS SIM analysis conditions presented in Table S4, the chromatographic separation and quantitative analysis of the IS and muscone were carried out with a Restek Rxi-5Sil MS column (20 m length, 0.18 mm ID, 0.18 µm DF, Bellefonte, PA, USA) and temperature control: 60.0 °C (1 min) → 15 °C/min → 200 °C (2 min) → 30 °C/min → 280 °C (2 min). These data were acquired and processed with the GCMSsolution software (version 4.45, Shimadzu, Tokyo, Japan).
Both stock solutions of muscone and IS were prepared at 1000 µg/mL using methanol, stored in a refrigerator, and then diluted and used during analysis while cold. Separately, for the quantification of muscone in GJD samples, approximately 50 mg of the sample was accurately weighed into a 10 mL volumetric flask, followed by ultrasonic extraction for 30 min with 50 µL of cyclopentadecanone as an IS and 3 mL of methanol. Methanol was added to adjust the volume to 10 mL to give the sample solution, which was filtered with a 0.2 µm hydrophobic filter (SSOLKOREA Co., Ltd.) before injection into the GC–MS/MS system.

2.5. Validation of Developed Analytical Method

The optimized assay was assessed by evaluating the linearity, limit of detection (LOD), limit of quantitation (LOQ), and precision based on the International Conference on Harmonisation guidelines [23]. Briefly, linearity was evaluated using the coefficient of determination (r2) value in the regression equation for each analyte. LOD and LOQ were calculated using 3.3 × σ/S and 10 × σ/S (σ: the standard deviation (SD) of the y-intercept; S: the slope of the regression equation). Recovery (%) was measured by a standard addition method in which three different concentrations (low, medium, and high) of analytes were added, and it was calculated as found amount/spiked amount × 100. Finally, precision was assessed by the relative standard deviation (RSD, %) values of the analytes measured on one day and on three consecutive days (RSD (%) = SD/mean × 100). Validation of recovery and precision was performed only by HPLC and GC–MS/MS analysis methods.

3. Results and Discussion

3.1. HPLC–PDA Analysis

3.1.1. Determination of Target Compounds in GJD for Analytical Method Development Using HPLC–PDA

To identify compounds suitable for the simultaneous analysis of GJD using HPLC, the main components contained in each herbal medicine were investigated and analyzed. The compounds examined were nodakenin, decursin, and decursinol angelate from A. gigas; gallic acid, loganin, morroniside, and cornuside from C. officinalis; ginsenoside Rb1 and ginsenoside Rg1 from P. ginseng, and 5-HMF from R. glutinosa. As shown in Figure S2, the suitability of HPLC analysis to detect these 10 compounds in GJD samples was assessed. Except for the ginsenosides from P. ginseng and cornuside from C. officinalis, seven of the components were detected and selected as target compounds of GJD, and subsequent analysis was conducted.

3.1.2. HPLC Simultaneous Analysis Conditions

Optimal HPLC analysis conditions were set for the seven target compounds selected in Section 3.1.1. First, in column selection, C18 columns (4.6 mm × 250 mm, 5 µm) from different manufacturers, such as XBridge (Waters, Milford, MA, USA), Capcell Pak UG80 (Shiseido, Tokyo, Japan), and Quasar SPP (PerkinElmer, Buckinghamshire, UK), were compared. As shown in Figure S3, the elution and peak shape of gallic acid were more appropriately detected on the Capcell Pak UG80 column than on the other columns. Second, we sought to compare the effects of acids such as formic acid and acetic acid in the primary determined column. As a result, when formic acid was used, the capacity factor (k’) of gallic acid was better than that of acetic acid, and the resolution of morroniside was better in the sample solution (Figure S4). Third, after determining the column and acid, the column oven temperature (30, 40, and 50 °C) was compared. As a result of the test, the peak of gallic acid was not sharp at 50 °C, and in the case of morroniside, it was detected overlapping with another unknown peak (Figure S5). Finally, an assay for the separation and quantification of the seven target compounds was established using a gradient elution of distilled water–acetonitrile (both containing 0.1% (v/v) formic acid) on a Capcell Pak UG80 C18 column (Shiseido, Tokyo, Japan) maintained at 40 °C with a Shimadzu Prominence LC-20A system coupled to a PDA (Table S2). As a result, all components were baseline separated with a resolution of ≥1.55 within 50 min, without interference from neighboring peaks (Figure 1 and Figure S6).

3.1.3. Validation of the Developed HPLC Analytical Method

The system suitability parameters of the developed HPLC assay were calculated to be k’, 0.96–15.59; separation factor (α), 1.01–1.83; theoretical plate number (N), 12,882.85–1,481,856.87; resolution (Rs), 1.55–31.28; and tailing factor (Tf), 1.01–1.24 (Table S5). The assay validation factors obtained for the simultaneous analysis of the seven target components in GJD samples are presented in Table 2, Table 3 and Table 4. For each of the calibration curves, prepared by measuring the peak areas at a series of concentration levels, the r2 values were all 1.0000, showing excellent linearity (Table 2). The LOD and LOQ values of the components were 0.02–0.05 µg/mL and 0.06–0.16 µg/mL, respectively (Table 2). The tested recoveries (%), measured by adding three concentrations of each component, were 93.70–108.17% (RSD ≤ 2.06%, Table 3). Finally, intra- and interday precision and repeatability were evaluated for all target components and the RSD values were calculated to be ≤1.22% (Table 4 and Table S6). The satisfactory results obtained for all the validation factors confirmed that the present analytical method is appropriate for the simultaneous analysis of GJD using the seven selected target components.

3.1.4. Simultaneous Quantitation of the Seven Target Components in GJD Samples Using the HPLC System

The HPLC assay developed herein was successfully applied to analyze the seven target components (gallic acid, 5-HMF, morroniside, loganin, nodakenin, decursin, and decursinol angelate) simultaneously in GJD samples. These analytes were monitored and quantified at the wavelengths given in Table 2, based on the UV maximum absorption wavelength. As shown in Table 5, commercially available GJD samples were found to contain 0.01–7.06 mg/g of the seven target analytes. Among these analytes, decursin and decursinol angelate, the major components of A. gigas, were the most abundant in all samples (2.27–7.06 mg/g). In previously reported studies [4,19], decursin derived from A. gigas showed high content of 7.92 mg/g. In our study, similar to the results of previous studies, decursin and decursinol angelate (isomer of decursin), the main components of A. gigas, were detected as the most abundant.

3.2. UPLC–MS/MS Analysis

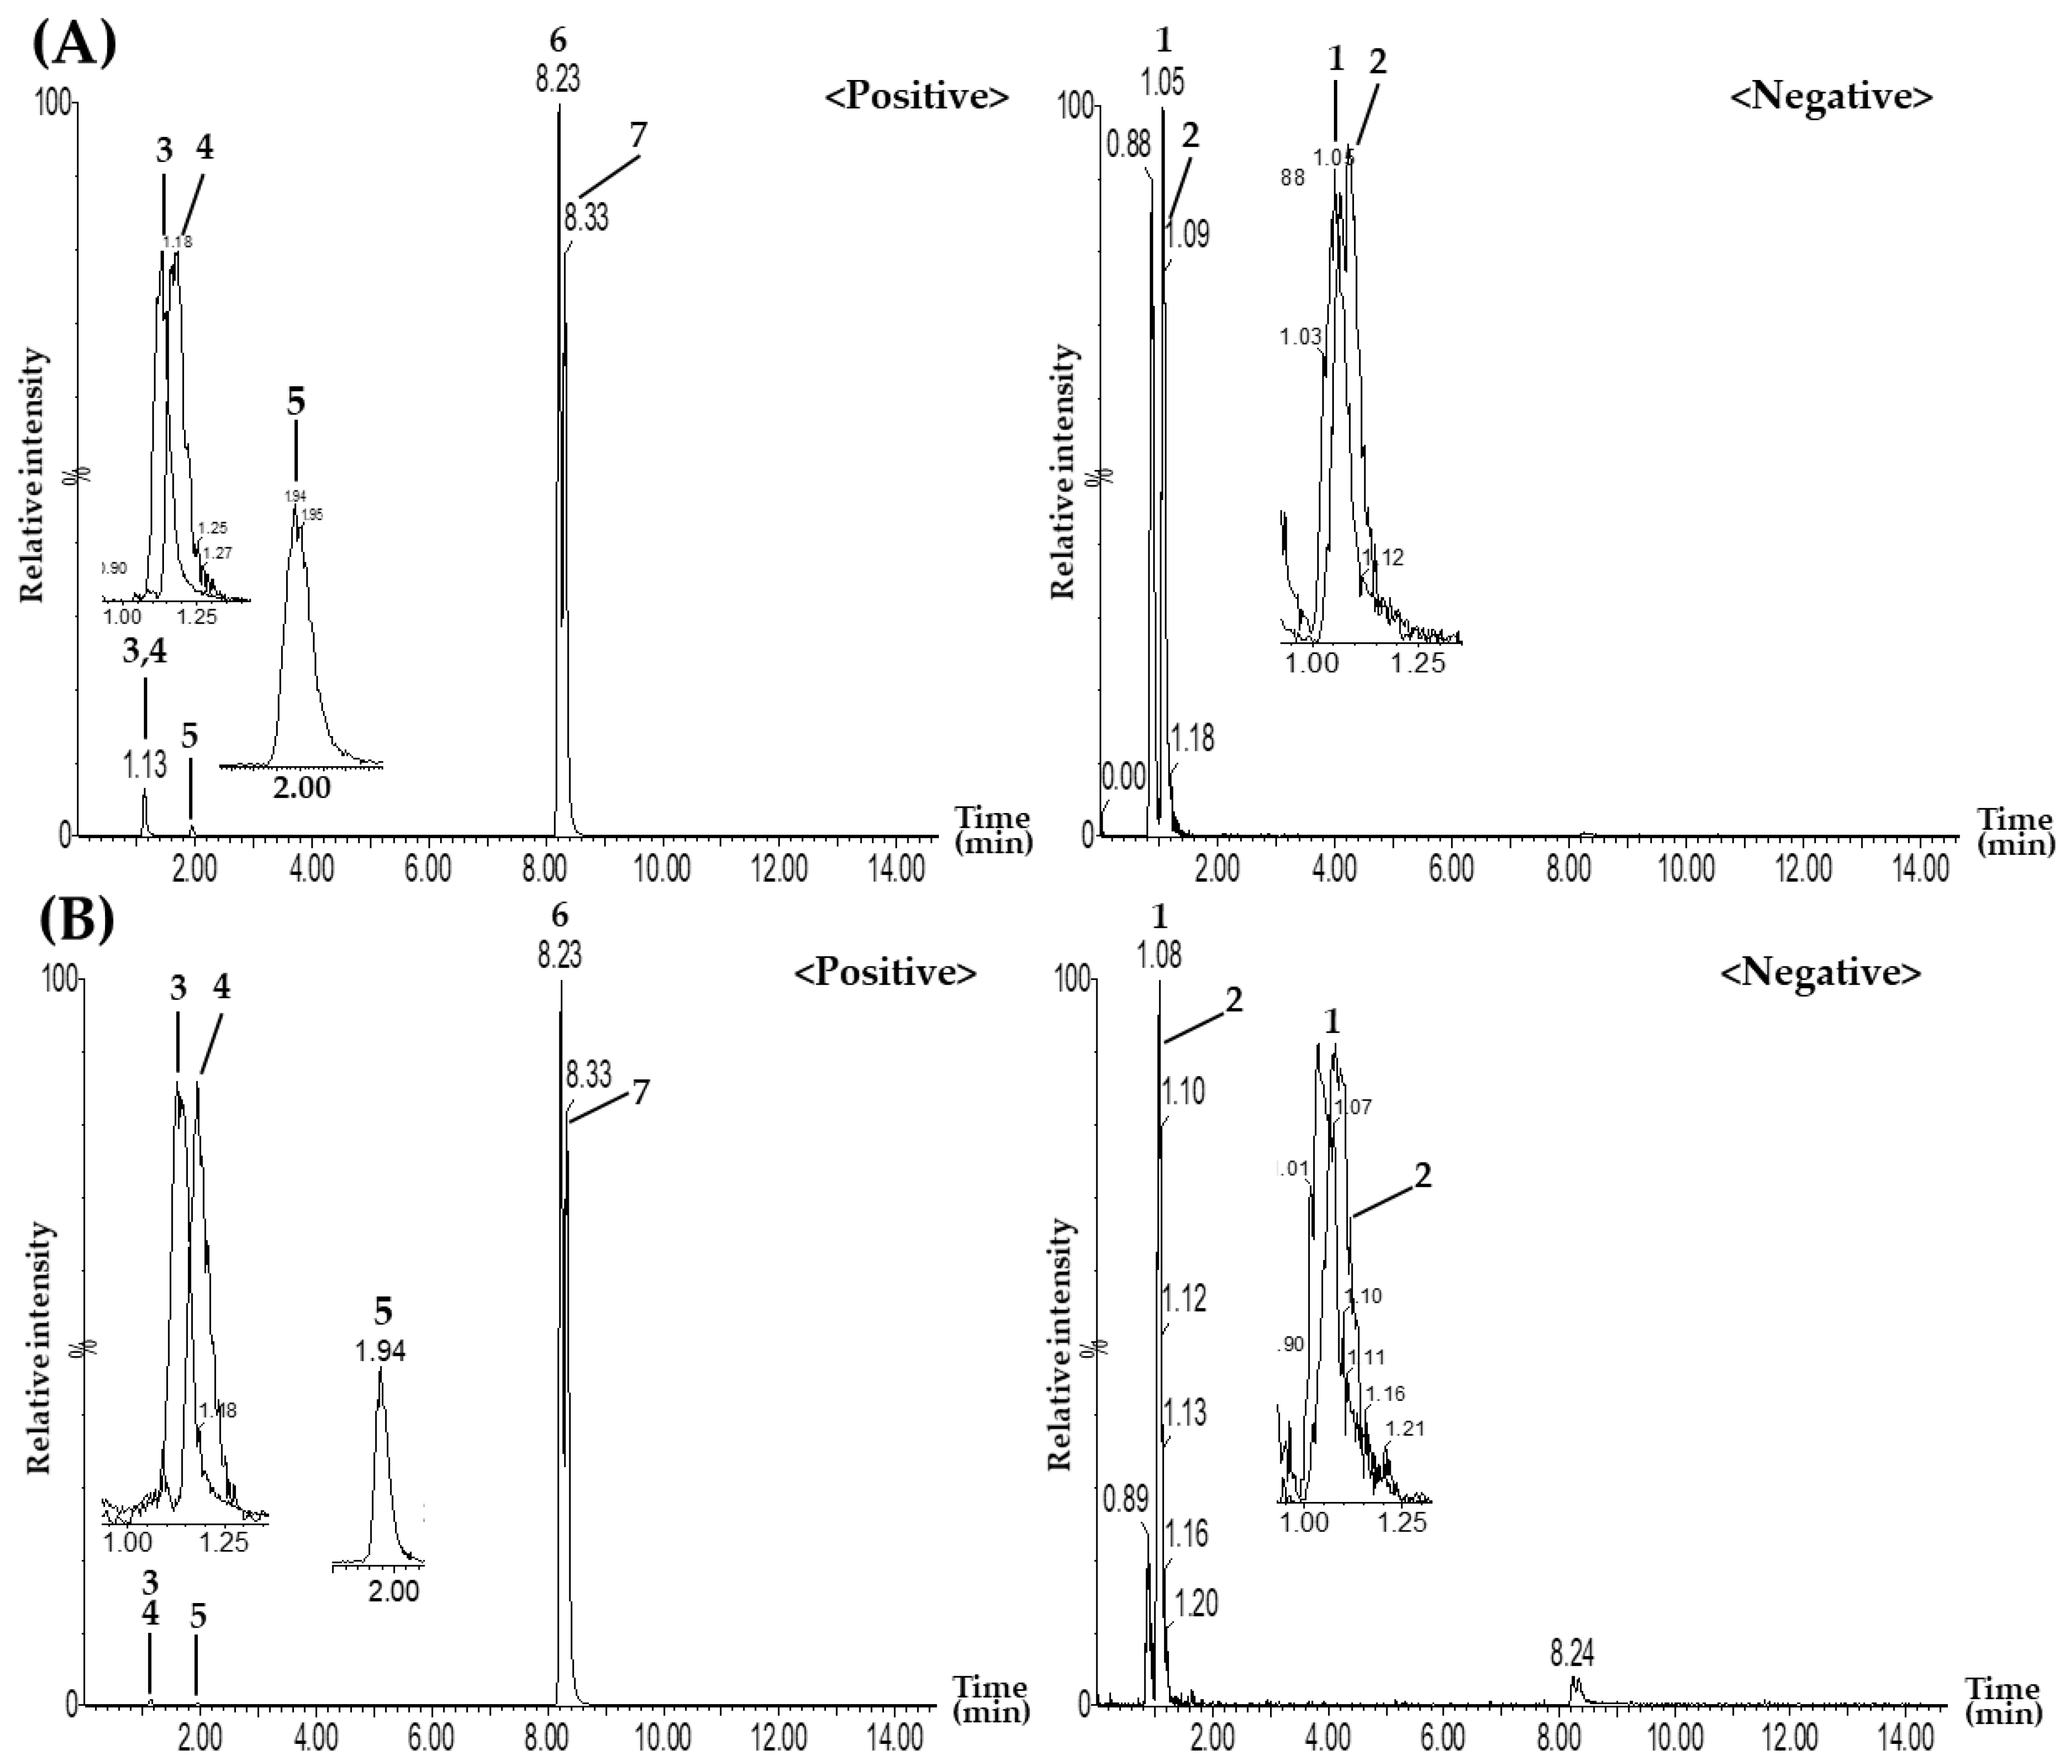
3.2.1. UPLC–MS/MS Multiple Reaction Monitoring (MRM) Method for Simultaneous Analysis

UPLC–MS/MS quantitative analysis was performed on the seven target components selected in the HPLC analytical method. A UPLC–MS/MS system (Waters, Milford, MA, USA) consisting of a Waters Acquity UPLC I–Class system and a tandem quadrupole MS detector system with an electrospray ionization source was used. UPLC–MS/MS MRM analysis was conducted with a Waters Acquity UPLC BEH C18 column (2.1 mm × 100 mm, 1.7 µm) and a distilled water–acetonitrile mobile-phase system (Table S3 and Table 1). Gallic acid and morroniside were detected in negative ion mode as [M−H], and 5-HMF, loganin, nodakenin, decursin, and decursinol angelate were detected in positive ion mode as [M+H]+, within 10.0 min (Figure 2 and Figure S7).
For quantitative analysis, the MRM conditions (precursor ion (Q1) and product ion (Q3)) of the seven analytes were set as shown in Table 5. The Q3 peaks of gallic acid and 5-HMF were set to m/z 125.0 and 109.0 in the form of [M–H–COO] and [M+H–H2O]+, respectively, in which a carboxyl group (COO) and water (H2O) molecule were lost from each Q1 peak [24,25]. For MRM transitions of iridoid-type compounds morroniside and loganin, the Q1 peak was detected at m/z 405.4 and 391.4 in the form of [M–H] and [M+H]+, respectively. All of the detected ions were in the form of aglycone in which the glucose group was lost, and Q3 peaks were detected at m/z 243.2 ([M–H–Glu]) and 229.2 ([M+H–Glu]+) [26,27]. For nodakenin, the Q3 peak was set at m/z 247.2, corresponding to the [M+H−Glu]+ form, where one molecule of glucose was removed from the Q1 peak at m/z 409.4 [28]. The Q3 peak for the two coumarin derivatives, decursin and decursinol angelate, was set at m/z 229.0 for the [M+H−C5H8O2]+ form, with the isoprenyl backbone and hydroxy group removed from the Q1 peak at m/z 329.2 [15].

3.2.2. Quantitation of the Seven Target Components in GJD Samples

The values for the regression equations r2, LOD, LOQ, and retention times of the seven analytes prepared at a concentration of 0.10–5.00 µg/mL are presented in Table 6. In GJD samples, concentrations of the seven investigated analytes ranged from non-detected to 10.75 mg/g (Table 7). As a result of UPLC–MS/MS analysis, decursin and decursinol angelate, the main components of A. gigas, were found with the highest content (3.86–10.75 mg/g and 2.95–7.81 mg/g, respectively), which is consistent with the results obtained by HPLC analysis.

3.3. GC–MS/MS Analysis

3.3.1. Establishment of the GC–MS/MS Method

Muscone, which was selected as a target compound for M. moschifrus in GJD samples, was quantitatively analyzed with cyclopentadecanone as IS using the GC–MS/MS SIM method. For GC–MS/MS SIM quantitation, the quantitative ions of muscone and IS were set to m/z 238.23 → 85 and m/z 224.21 → 55, respectively, and analyzed under the conditions shown in Table S4.

3.3.2. GC–MS/MS Method Validation for Analysis of Muscone

Data for calibration curves, LOD, LOQ, recovery, and precision were recorded to validate the method. The regression equation (y = 1.02x − 1.62 × 10⁻²) of the calibration curve was prepared using the area ratio of IS and muscone in the range of 0.5–1.0 µg/mL, and the r2 value was 0.9998, showing good linearity. LOD and LOQ values were calculated with signal-to-noise ratios of 3 and 10, respectively, and were 0.13 µg/mL and 0.38 µg/mL, respectively. Recovery (%) was found to be 99.13–107.33%, and the RSDs for intra- and interday precision were all ≤1.44% (Table 8 and Table 9). The above data confirm that the assay established for the quantitation of muscone in GJD samples was appropriate.

3.3.3. Quantitation of Muscone in GJD Samples Using the GC–MS/MS Method

The established GC–MS/MS SIM method was applied to the efficient analysis of real GJD samples, and both the IS and muscone were detected at 10.02 min and 10.26 min without interference from other peaks, respectively (Figure 3 and Figure S8). Muscone was detected at 0.44–0.52 mg/g in samples of GJD–1 to GJD–5 (Table 10).

4. Conclusions

In this study, a method has been developed and validated for the simultaneous analysis of eight components in commercially available GJD, a traditional herbal prescription widely used as a tonic, using HPLC, UPLC–MS/MS, or GC–MS/MS systems. These analytical methods were appropriately applied to effectively analyze GJD samples. Among the seven analytes, except for muscone, in these analysis methods, decursin and decursinol angelate, the main components of A. gigas, were detected the most abundantly by the HPLC and UPLC–MS/MS methods. In general, the UPLC–MS/MS MRM method has the advantages of a shorter analysis time, higher sensitivity, and easy multi-component analysis compared to the HPLC method. Nevertheless, as an analysis method for the quality control of GJD samples using the seven analytes, it is considered that the analytical method using HPLC, which is the most widely used and easy to operate today, is more appropriate. Finally, these assays can be used to obtain basic data for clinical trials and for efficacy verification.

Supplementary Materials

The following supporting information can be downloaded at: https://www.mdpi.com/article/10.3390/separations10040231/s1, Figure S1: Chemical structures of the eight target components and internal standard (IS) in GJD; Figure S2: HPLC chromatograms of the solution of standard mixture (A) and 70% methanol solution of GJD–1 sample (B). Gallic acid (1), 5-(hydroxymethyl)furfural (2), morroniside (3), loganin (4), nodakenin (5), cornuside (6), ginsenoside Rg1 (7), ginsenoside Rb1 (8), decursin (9), and decursinol angelate (10); Figure S3: HPLC chromatograms according to columns. Standard mixture (A) and GJD sample (B) using Capcell Pak UG80 C18 column, standard mixture (C) and GJD sample (D) using Quasar SPP C18 column, and standard mixture (C) and GJD sample (D) using XBridge C18 column; Figure S4: HPLC chromatograms according to acids. Standard mixture (A) and GJD sample (B) using 0.1% (v/v) formic acid and standard mixture (C) and GJD sample (D) using 1.0% (v/v) acetic acid; Figure S5: HPLC chromatograms according to column temperatures. Standard mixture (A) and GJD sample (B) at 30 °C, standard mixture (C) and GJD sample (D) at 40 °C, and standard mixture (E) and GJD sample (F) at 50 °C; Figure S6: HPLC chromatograms of GJD–2 to GJD–5 samples (A) and each reference compound (B). Gallic acid (1), 5-(hydroxymethyl)furfural (2), morroniside (3), loganin (4), nodakenin (5), decursin (6), and decursinol angelate (7); Figure S7: Total ion chromatograms of GJD–2 to GJD–5 samples by UPLC–MS/MS MRM method. Gallic acid (1), morroniside (2), 5-(hydroxymethyl)furfural (3), loganin (4), nodakenin (5), decursin (6), and decursinol angelate (7); Figure S8: GC–MS/MS chromatograms of GJD–2 to GJD–5 samples; Table S1: Composition of Gongjindan one-pill; Table S2: Analytical conditions for simultaneous determination of the seven components in GJD by HPLC; Table S3: LC–MS/MS MRM analysis conditions for quantification of the target components in GJD; Table S4: GC–MS/MS selective ion monitoring (SIM) analytical conditions for quantification of muscone in GJD samples; Table S5: System suitability for HPLC simultaneous analysis of the seven components using a standard solution; Table S6: Repeatability of retention time and peak area of the seven analytes using HPLC (n = 6).

Author Contributions

Conceptualization, C.-S.S. and H.-K.S.; methodology, validation, formal analysis, investigation, data curation, writing—original draft preparation, writing—review and editing, C.-S.S.; project administration, funding acquisition, H.-K.S. All authors have read and agreed to the published version of the manuscript.

Funding

This research was funded by the Korea Institute of Oriental Medicine (KSN2022310 and KSN1823311).

Institutional Review Board Statement

Not applicable.

Informed Consent Statement

Not applicable.

Data Availability Statement

All data of this study can be found in this paper.

Conflicts of Interest

The authors declare no conflict of interest.

Sample Availability

Samples of the compounds are available after consultation with the authors.

References

  1. Han, M.G.; Kim, K.S.; Joo, J.H.; Choi, H.S.; Kim, S.M. Favorable hepatoprotective effects of Gongjin-dan on the acute ethanol—induced liver damaged C57BL/6 mice. J. Physiol. Pathol. Korean Med. 2016, 30, 279–288. [Google Scholar] [CrossRef]
  2. Choi, K.H.; Park, C.S. An analysis of the Gongjindan’s ingredients and its efficacy on anti-oxidation. Kor. J. Herbol. 2007, 22, 51–63. [Google Scholar]
  3. Moon, E.; Her, Y.; Lee, J.B.; Park, J.H.; Lee, E.H.; Kim, S.H.; Oh, M.S.; Jang, C.G.; Kim, S.Y. The multi-herbal medicine Gongjin-dan enhances memory and learning tasks via NGF regulation. Neurosci. Lett. 2009, 466, 114–119. [Google Scholar] [CrossRef] [PubMed]
  4. Hong, S.S.; Lee, J.; Lee, J.S.; Lee, H.W.; Kim, H.G.; Lee, S.K.; Park, B.K.; Son, C.G. The traditional drug Gongjin-dan ameliorates chronic fatigue in a forced-stress mouse exercise model. J. Ethnopharmacol. 2015, 168, 268–278. [Google Scholar] [CrossRef]
  5. Hwang, S.M.; Chung, D.K. The effects of Kongjin-dan (KJD) on the Alzheimer’s disease model induced by CT105. J. Orient. Neuropsychiatry 2004, 15, 103–118. [Google Scholar]
  6. Jeong, S.Y.; Kim, H.M.; Lee, K.H.; Kim, K.Y.; Huang, D.S.; Kim, J.H.; Seong, R.S. Quantitative analysis of marker compounds in Angelica gigas, Angelica sinensis, and Angelica acutiloba by HPLC/DAD. Chem. Pharm. Bull. 2015, 63, 504–511. [Google Scholar] [CrossRef] [Green Version]
  7. Jiang, Y.; Chen, H.; Wang, L.; Zou, J.; Zheng, X.; Liu, Z. Quality evaluation of polar and active components in crude and processed Fructus corni by quantitative analysis of multicomponents with single marker. J. Anal. Methods Chem. 2016, 2016, 6496840. [Google Scholar] [CrossRef] [Green Version]
  8. Shan, S.M.; Luo, J.G.; Huang, F.; Kong, L.Y. Chemical characteristics combined with bioactivity for comprehensive evaluation of Panax ginseng C.A. Meyer in different ages and seasons based on HPLC-DAD and chemometric methods. J. Pharm. Biomed. Anal. 2014, 89, 76–82. [Google Scholar] [CrossRef]
  9. Lee, J.Y.; Lee, E.J.; Kim, J.S.; Lee, J.H.; Kang, S.S. Phytochemical studies on Rehmanniae Radix Preparata. Kor. J. Pharmacogn. 2011, 42, 117–126. [Google Scholar]
  10. Fujimoto, S.; Yoshikawa, K.; Itoh, M.; Kitahara, T. Synthesis of (R)- and (S)-muscone. Biosci. Biotechnol. Biochem. 2002, 66, 1389–1392. [Google Scholar] [CrossRef] [Green Version]
  11. Oh, S.H. The Korean Herbal Pharmacopoeia, 5th ed.; Shinilbooks: Seoul, Republic of Korea, 2016; pp. 97–99. [Google Scholar]
  12. Liu, K.; Xie, L.; Deng, M.; Zhang, X.; Luo, J.; Li, X. Zoology, chemical composition, pharmacology, quality control and future perspective of Musk (Moschus): A review. Chin. Med. 2021, 16, 46. [Google Scholar] [CrossRef] [PubMed]
  13. Jiang, W.; Yin, Y.; Zhou, Y.; He, G.; Qi, Y. Isolation and characterization of peptidoglycan recognition protein 1 from antler base of silka deer (Cervus nippon). Int. J. Biol. Macromol. 2014, 64, 313–318. [Google Scholar] [CrossRef] [PubMed]
  14. Choi, H.O.; Kim, J.W.; Jo, S.J.; Kim, J.H.; Han, B.H. A new HPLC-analytical method for total sphingosine contents as an indirect index for the ganglioside contents of deer antlers. Nat. Prod. Sci. 2011, 17, 315–320. [Google Scholar]
  15. Ahn, M.J.; Lee, M.K.; Kim, Y.C.; Sung, S.H. The simultaneous determination of coumarins in Angelica gigas root by high performance liquid chromatography–diode array detector coupled with electrospray ionization/mass spectrometry. J. Pharm. Biomed. Anal. 2008, 46, 258–266. [Google Scholar] [CrossRef] [PubMed]
  16. Hwang, S.Y.; Hwang, H.Y.; Choi, W.H.; Jung, H.J.; Huh, J.D.; Lee, K.S.; Ro, J.S. Quantitative determination of 5-hydroxymethyl-2-furaldehyde in the Rehmanniae Radix Preparata samples at various processing stages. Kor. J. Pharmacogn. 2001, 32, 116–120. [Google Scholar]
  17. Jin, C.; Yan, C.; Luo, Y.; Li, B.; He, J.; Xiao, X. Fast and direct quantification of underivatized muscone by ultra performance liquid chromatography coupled with evaporative light scattering detection. J. Sep. Sci. 2013, 36, 1762–1767. [Google Scholar] [CrossRef] [PubMed]
  18. Zhang, H.; Tao, Y.; Hong, X.; Wang, Z. Steroids in musk by gas chromatography/mass spectrometry. Chin. Tradit. Pat. Med. 2005, 27, 79–83. [Google Scholar]
  19. Lee, J.S.; Hong, S.S.; Kim, H.G.; Lee, H.W.; Kim, W.Y.; Lee, S.K.; Son, C.G. Gongjin-dan enhances hippocampal memory in a mouse model of scopolamine-induced amnesia. PLoS ONE 2016, 11, e0159823. [Google Scholar] [CrossRef] [Green Version]
  20. Huang, Y.; Jiang, C.; Hu, Y.; Zhao, X.; Shi, C.; Yu, Y.; Liu, C.; Tao, Y.; Pan, H.; Feng, Y.; et al. Immunoenhancement effect of Rehmannia glutinosa polysaccharide on lymphocyte proliferation and dendritic cell. Carbohydr. Polym 2013, 96, 516–521. [Google Scholar] [CrossRef]
  21. Liu, Y.F.; Liang, D.; Luo, H.; Hao, Z.Y.; Wang, Y.; Zhang, C.L.; Zhang, Q.J.; Chen, R.Y.; Yu, D.Q. Hepatoprotective iridoid glycosides from the roots of Rehmannia glutinosa. J. Nat. Prod 2012, 75, 1625–1631. [Google Scholar] [CrossRef]
  22. Zhang, X.; Zhang, A.; Jiang, B.; Bao, Y.; Wang, J.; An, L. Further pharmacological evidence of the neuroprotective effect of catalpol from Rehmannia glutinosa. Phytomedicine 2008, 15, 484–490. [Google Scholar] [CrossRef] [PubMed]
  23. International Conference on Harmonisation (ICH). Guidance for Industry, Q2B, Validation of Analytical Procedures: Methodology; Food and Drug Administration: Rockville, MD, USA, 1996. [Google Scholar]
  24. Jiang, M.; Zhou, M.; Han, Y.; Xing, L.; Zhao, H.; Dong, L.; Bai, G.; Luo, G. Identification of NF-κB inhibitors in Xuebijing injection for sepsis treatment based on bioactivity-integrated UPLC-Q/TOF. J. Ethnopharmacol. 2013, 147, 426–433. [Google Scholar] [CrossRef] [PubMed]
  25. Ye, J.; Zhang, X.; Dai, W.; Yan, S.; Huang, H.; Liang, X.; Li, Y.; Zhang, W. Chemical fingerprinting of Liuwei Dihuang Pill and simultaneous determination of its major bioactive constituents by HPLC coupled with multiple detections of DAD, ELSD and ESI-MS. J. Pharm. Biomed. Anal. 2009, 49, 638–645. [Google Scholar] [CrossRef] [PubMed]
  26. Dan, G.; Cho, C.W.; Vinh, L.B.; Kim, J.H.; Cho, K.W.; Kim, Y.H.; Kang, J.S. Simultaneous qualitative and quantitative analysis of morroniside and hederacoside D in extract mixture of Cornus officinalis and Stauntonia hexaphylla leaves to improve benign prostatic hyperplasia by HPLC–UV. Anal. Sci. Technol. 2020, 33, 224–231. [Google Scholar]
  27. Song, Y.; Li, S.L.; Wu, M.H.; Li, H.J.; Li, P. Qualitative and quantitative analysis of iridoid glycosides in the flower buds of Lonicera species by capillary high performance liquid chromatography coupled with mass spectrometric detector. Anal. Chim. Acta 2006, 564, 211–218. [Google Scholar] [CrossRef]
  28. Kim, M.K.; Yang, D.H.; Jung, M.; Jung, E.H.; Eom, H.Y.; Suh, J.H.; Min, J.W.; Kim, U.; Min, H.; Kim, J.; et al. Simultaneous determination of chromones and coumarins in Radix Saposhnikoviae by high performance liquid chromatography with diode array and tandem mass detectors. J. Chromatogr. A 2011, 1218, 6319–6330. [Google Scholar]
Figure 1. Representative HPLC chromatograms of the standard solution (A) and GJD–1 sample (B). Gallic acid (1), 5-(hydroxymethyl)furfural (5-HMF, 2), morroniside (3), loganin (4), nodakenin (5), decursin (6), and decursinol angelate (7). The concentrations of the compounds in the mixed standard solution were 20.00 µg/mL (compounds 2 and 5), 30.00 µg/mL (compounds 1, 3, and 6), and 40.00 µg/mL (compounds 4 and 7).
Separations 10 00231 g001
Figure 2. Representative total ion chromatograms of the standard solution (A) and GJD–1 sample (B) using UPLC–MS/MS MRM. Gallic acid (1), morroniside (2), 5-HMF (3), loganin (4), nodakenin (5), decursin (6), and decursinol angelate (7). The concentration of all analytes in the mixed standard solution was 5.00 µg/mL.
Separations 10 00231 g002
Figure 3. Representative GC–MS/MS chromatograms of the standard solution (A) and GJD–1 sample (B). The concentrations of muscone and IS in the mixed standard solution were 5.00 µg/mL and 1.00 µg/mL, respectively.
Separations 10 00231 g003
Table 1. Parameters for UPLC–MS/MS MRM analysis of the seven analytes.
Analyte 1Ion ModeMolecular WeightMRM ConditionsCone Voltage (V)Collision Energy (eV)
1negative170.02169.0 → 125.02515
2negative406.15405.4 → 243.23013
3positive126.03127.0 → 109.02010
4positive390.15391.4 → 229.22010
5positive408.14409.4 → 247.23015
6positive328.13329.2 → 229.03520
7positive328.13329.2 → 229.03520
1 Gallic acid (1), morroniside (2), 5-HMF (3), loganin (4), nodakenin (5), decursin (6), and decursinol angelate (7).
Table 2. Method validation with respect to measured wavelength, linear range, regression equation, coefficient of determination (r2), limit of detection (LOD), and limit of quantitation (LOQ) values for simultaneous determination of seven target components using HPLC–PDA.
Analyte 1Measured Wavelength
(nm)
Linear Range (µg/mL)Regression Equation 2
y = a x + b
r2LOD (µg/mL)LOQ (µg/mL)
12700.31–20.00y = 66,489.40x + 3119.591.00000.030.10
22800.47–30.00y = 92,324.67x + 666.451.00000.030.09
32400.31–20.00y = 47,649.17x + 2644.871.00000.020.06
42350.47–30.00y = 22,917.18x + 1539.241.00000.040.13
53350.31–20.00y = 45,241.57x + 2789.691.00000.020.06
63301.56–100.00y = 48,629.16x + 25,391.821.00000.050.16
73301.56–100.00y = 32,740.22x + 12,709.591.00000.040.11
1 Gallic acid (1), 5-(hydroxymethyl)furfural (5-HMF, 2), morroniside (3), loganin (4), nodakenin (5), decursin (6), and decursinol angelate (7). 2 y: peak area of compounds; x: concentration (µg/mL) of compounds.
Table 3. Recovery (%) of the seven target components for the developed HPLC method.
Analyte 1Spiked Amount (µg/mL)Found Amount (µg/mL)Recovery (%)SD 2RSD (%)
11.001.04104.001.691.62
2.002.11105.651.050.99
4.004.17104.140.560.54
22.001.9497.191.741.79
4.003.9799.370.740.74
8.007.7496.730.530.55
31.001.03102.811.381.34
2.002.13106.410.560.53
4.004.28107.040.720.68
41.000.9797.161.751.80
2.002.01100.300.150.15
4.004.03100.751.301.29
51.001.02102.071.621.59
2.002.05102.542.112.06
4.004.21105.311.201.14
66.006.03100.290.830.83
15.0015.77105.160.310.29
30.0032.44108.170.470.43
78.007.5093.700.620.67
20.0019.4097.010.230.24
40.0040.92102.300.530.52
1 Gallic acid (1), 5-HMF (2), morroniside (3), loganin (4), nodakenin (5), decursin (6), and decursinol angelate (7). 2 SD: standard deviation.
Table 4. Precision test of target compounds 17 in the developed HPLC method.
Analyte 1Conc. (µg/mL)Intraday (n = 5)Interday (n = 5)
Observed Conc. (µg/mL)Precision (RSD, %)Accuracy (%)Observed Conc. (µg/mL)Precision (RSD, %)Accuracy (%)
15.005.190.17103.885.210.53104.27
10.0010.410.89104.1210.441.01104.37
20.0020.380.32101.8820.520.94102.59
27.507.890.28105.137.910.96105.52
15.0015.740.70104.9415.771.22105.12
30.0030.930.63103.1031.081.08103.60
35.005.180.17103.625.210.52104.17
10.0010.390.68103.8710.420.96104.20
20.0020.400.40101.9820.540.91102.71
47.507.780.18103.807.810.48104.11
15.0015.560.65103.7315.621.00104.13
30.0030.550.47101.8430.790.90102.62
55.005.190.06103.825.220.52104.30
10.0010.400.86104.0110.431.00104.29
20.0020.330.32101.6520.480.88102.42
625.0026.010.08104.0326.130.48104.52
50.0052.090.69104.1952.220.94104.44
100.00101.910.38101.91102.530.84102.53
725.0026.060.08104.2426.180.46104.71
50.0052.060.77104.1352.190.92104.37
100.00102.100.38102.10102.650.85102.65
1 Gallic acid (1), 5-HMF (2), morroniside (3), loganin (4), nodakenin (5), decursin (6), and decursinol angelate (7).
Table 5. Amounts (mg/g) of the seven target components in commercial products, determined using the developed HPLC method 1.
Analyte 2GJD–1GJD–2GJD–3GJD–4GJD–5
Mean (mg/g)RSD (%)Mean (mg/g)RSD (%)Mean (mg/g)RSD (%)Mean (mg/g)RSD (%)Mean (mg/g)RSD (%)
10.190.850.090.900.130.610.060.890.230.42
20.770.290.150.230.011.660.081.691.990.16
30.390.360.120.300.430.400.440.210.150.15
40.580.410.420.270.710.290.650.030.380.19
50.280.350.220.320.910.700.220.200.300.62
62.780.183.240.107.060.112.760.182.570.03
74.030.283.870.216.540.032.350.203.240.06
1 GJD–1 to GJD–5: commercial products supplied by Korean pharmaceutical companies. 2 Gallic acid (1), 5-HMF (2), morroniside (3), loganin (4), nodakenin (5), decursin (6), and decursinol angelate (7).
Table 6. Retention time, linear range, regression equation, r2, LOD, and LOQ values for simultaneous determination of the seven analytes using the UPLC–MS/MS method.
Analyte 1Retention Time
(min)
Linear Range (µg/mL)Regression Equation 2
y   =   a x   +   b
r2LOD (ng/mL)LOQ (ng/mL)
11.060.10–5.00y = 0.61x − 14.810.99673.279.82
21.080.10–5.00y = 0.47x − 6.360.99173.5010.49
31.130.10–5.00y = 23.77x + 425.40.99291.614.82
41.180.10–5.00y = 1.01x + 12.560.99219.9229.75
51.940.10–5.00y = 5.33x + 114.230.99433.5610.68
68.230.10–5.00y = 189.03x + 1684.860.99450.150.46
78.330.10–5.00y = 168.94x + 2700.370.99590.160.48
1 Gallic acid (1), morroniside (2), 5-HMF (3), loganin (4), nodakenin (5), decursin (6), and decursinol angelate (7). 2 y: peak area of compounds; x: concentration (µg/mL) of compounds.
Table 7. Amounts (mg/g) of the seven analytes in GJD–1 to GJD–5 samples determined using the UPLC–MS/MS method 1.
Analyte 2GJD–1GJD–2GJD–3GJD–4GJD–5
Mean (mg/g)RSD (%)Mean (mg/g)RSD (%)Mean (mg/g)RSD (%)Mean (mg/g)RSD (%)Mean (mg/g)RSD (%)
10.303.970.112.310.191.160.061.570.372.62
20.672.450.291.840.730.690.784.790.243.79
30.440.930.114.57ND 30.023.581.340.85
40.643.200.572.410.913.440.781.950.462.62
50.752.470.641.302.414.650.771.710.872.80
64.030.674.892.2310.751.204.441.533.860.81
74.490.494.453.087.812.162.950.243.620.33
1 GJD–1 to GJD–5: commercial products supplied by Korean pharmaceutical companies. 2 Gallic acid (1), 5-HMF (2), morroniside (3), loganin (4), nodakenin (5), decursin (6), and decursinol angelate (7). 3 ND: not detected.
Table 8. Recovery (%) of muscone by the GC–MS/MS method (n = 5).
AnalyteSpiked Amount (µg/mL)Found Amount (µg/mL)Recovery (%)SDRSD (%)
Muscone110.00109.0099.132.532.55
275.00277.30100.841.491.48
550.00590.30107.330.830.77
Table 9. Verification of intra- and interday precision for muscone using the GC–MS/MS method (n = 5).
AnalyteConc. (µg/mL)Intraday (n = 5)Interday (n = 5)
Observed Conc. (µg/mL)Precision (RSD, %)Accuracy (%)Observed Conc. (µg/mL)Precision (RSD, %)Accuracy (%)
Muscone2.502.490.6799.722.521.30100.68
5.004.910.9798.194.970.9599.40
10.0010.260.66102.5610.221.44102.19
Table 10. Amounts (mg/g) of muscone in commercial products determined using the GC–MS/MS method 1.
AnalyteGJD–1GJD–2GJD–3GJD–4GJD–5
Mean (mg/g)RSD (%)Mean (mg/g)RSD (%)Mean (mg/g)RSD (%)Mean (mg/g)RSD (%)Mean (mg/g)RSD (%)
Muscone0.483.430.5114.310.524.130.494.610.442.45
1 GJD–1 to GJD–5: commercial products supplied by Korean pharmaceutical companies.
Disclaimer/Publisher’s Note: The statements, opinions and data contained in all publications are solely those of the individual author(s) and contributor(s) and not of MDPI and/or the editor(s). MDPI and/or the editor(s) disclaim responsibility for any injury to people or property resulting from any ideas, methods, instructions or products referred to in the content.

