
Isolation and Purification of Single Gold Nanoclusters by Alternate Pumping Chromatography
by
 , and
, and
Malvina Supper
1 ,
,
Virginia Birner
1,
Lukas Gromotka
2,
Wolfgang Peukert
2 and
Malte Kaspereit
1,* 1
Institute for Separation Science & Engineering, Friedrich-Alexander-Universität Erlangen-Nürnberg, Egerlandstr. 3, 91058 Erlangen, Germany
2
Institute of Particle Technology, Friedrich-Alexander-Universität Erlangen-Nürnberg, Cauerstr. 4, 91058 Erlangen, Germany
*
Author to whom correspondence should be addressed.
Separations 2023, 10(3), 214; https://doi.org/10.3390/separations10030214
Submission received: 17 February 2023
/
Revised: 1 March 2023
/
Accepted: 4 March 2023
/
Published: 18 March 2023
(This article belongs to the Topic Advances in Chemistry and Chemical Engineering)
Abstract
:Alternate pumping chromatography is applied to obtain atomically precise glutathione-stabilized gold nanoclusters in high purity from synthesized mixtures. On the basis of anion exchange chromatography, the feasibility of isolating a single cluster, AuGSH, as well as two different clusters simultaneously (AuGSH and AuGSH) is demonstrated. In addition, AuGSH, which is present only in trace amounts, is successfully enriched. A simple design procedure is proposed that allows using columns with different retention behavior. Successful experiments with large injection amounts confirm the potential of the concept for preparative-scale productions of high-quality nanoparticulate products.
1. Introduction
The quality of nanoparticulate products depends on their particle size distribution (PSD). The narrower a product’s PSD, the higher its value, since the more defined its properties, such as light absorption and emission, color brilliance and catalytic and physiological activity. While many laboratory-scale syntheses can deliver narrow PSDs, scaling up to industrial conditions generally leads to less favourable, broader PSDs, which limits the product quality. Achieving well-defined properties then requires a subsequent classification. Yet, for nanoparticles (NPs) with their sizes between 1 and 100 nm, suitable industrial-scale separation technologies are still missing.
Such classification is challenging due to the very small property differences between the NPs within a PSD as well as by their tendency to agglomerate. For such types of problem, chromatography appears promising, since it exhibits unprecedented resolution power, has scalability from the milligram to multi-ton scale and has high flexibility given by the multitude of exploitable retention mechanisms [1]. At the analytical scale, chromatography is already applied for size-selective separations of nanomaterials. In many cases, size exclusion chromatography (SEC) is used, for example, for separations of CdS and ZnS-NPs [2], AuNPs [3,4,5,6] and ZnS quantum dots [7].
Fischer [8] also performed semi-preparative SEC of CdS colloids using a column with 32 mm ID. More details on SEC for NPs are given in [9,10]. Due to its limited separation power, SEC appears suitable for the classification of broader or multimodal systems as in [6] and for the removal of impurities. Aiming at high resolution of narrow PSDs requires exploiting the higher separation efficiency of interaction-based chromatography. For example, reversed-phase HPLC was applied for identifying small cationic metal clusters [11] and monitoring the PSDs of Au/Pt-NPs [12,13]. Furthermore, separations of Au nanoclusters (AuNCs), which are in the scope of this work, were accomplished by interaction-based retention mechanisms, ranging from conventional and non-aqueous reversed-phase [14,15] over ion-pairing [16,17,18] and hydrophilic interactions [19,20] to anion exchange [20].
Apart from the achievements at analytical-scale, a systematic development of preparative chromatography for the classification of nanoparticulate products is missing. This is hampered by several challenges. Syntheses mixtures are often complex, containing various species of different sizes together with impurities. Furthermore, despite the efficiency of modern columns, separation among individual nanoclusters or providing nanoparticles with narrow size fractions remains very challenging. In conjunction with the large injection amounts required in preparative chromatography, this limits the achievable resolution.
Several process concepts exist that provide enhanced performance in preparative applications; for overviews, see [21,22,23]. These include gradients, multi-column schemes, such as the simulated moving bed concept [24,25], as well as recycling processes. The latter are particularly interesting for the problem at hand. They enhance resolution by recycling the chromatogram, or parts thereof, several times over the same column. The simplest mode, closed-loop recycling (CLR) [26,27,28,29,30], utilizes a single column and a recycle pump.
The backmixing by the latter, however, limits the achievable separation. This is resolved by alternate pumping (AP) [31,32,33], also known as twin-column recycling, which does not need a recycle pump. In AP, the unresolved portion of the chromatogram is transferred from one column directly into a second one. Afterward, the column order is reversed, and this is repeated as often as needed. The rather simple concept greatly increases efficiency. It was used successfully for challenging separations of macromolecules [32], isomers [33], enantiomers [34], drug impurities [35] and natural products [36].
The most striking examples are the baseline resolution of enantiomers and isotopes with selectivities as low as 1.01 [37]. The concept has been extended further by also incorporating gradient steps [38,39,40]. To our knowledge, the only application of AP to NPs was presented by Al-Somali et al. [41], who separated thiol-stabilized AuNPs by SEC. While baseline separation was not possible for the studied case (see below), the authors found that CLR and specifically AP increased the resolution strongly enough to detect a multimodal PSD.
Conventional NPs have a continuous PSD, which makes baseline separations impossible. In contrast, nanoclusters (NCs) are discrete, atomically precise structures consisting of a few up to few hundred atoms. NCs, and specifically gold nanoclusters (AuNCs) as studied here, are a particularly attractive field of application. In contrast to AuNPs, they have discrete electronic energy levels, giving them exceptional physico-chemical properties [42]. Importantly, these properties strongly depend on the size of the cluster. Differently sized AuNCs have been studied extensively for applications in optics, catalysis, sensing and analysis, biotechnology and medicine.
Current applications include, among many others, the sensing of molecular interactions [43], nanoprobes for neurotransmitters [44] and catalysts for the electrochemical reduction of CO [45]. An overview on the field is given in [46]. However, conventional synthesis protocols deliver mixtures of various cluster sizes along with impurities. For the optimization of product properties, it is of great interest to devise methods capable of isolating single clusters from such mixtures.
The scope of this work is to experimentally investigate the applicability of alternate pumping as a high-resolution scheme for the separation of discrete NCs. For this, we exploit the significantly higher—in comparison to SEC—separation power of interaction-based chromatography. As an example problem, we apply anion-exchange chromatography to separate small glutathione-stabilized AuNCs that contain between 10 and 29 gold atoms. To our knowledge, neither the use of alternate pumping for nanoparticulate products on the basis of interaction chromatography nor its application to isolate atomically precise nanoclusters has been investigated.
The paper is organized as follows. After a short discussion of the principle of AP and its practical implementation, different experimental case studies are presented. In a first step, the simultaneous isolation of two larger AuNCs is studied, followed by the purification of a single, smaller cluster. Thereafter, the isolation of an intermediately-sized cluster, that is present only in trace amounts, is investigated. Finally, the applicability of the concept under preparative conditions is evaluated by experiments with strongly increased injection amounts.
2. Experimental
2.1. Materials
For synthesis of the AuNCs, sodium tetrachloroaurate(III) dihydrate (NaAuCl, purity 99%), reduced glutathione (GSH, ≥98%) and ammonium acetate (NHAc, ≥99%) were purchased from Sigma-Aldrich. Methanol (HPLC gradient grade), BisTris buffer (≥99%) and sodium borohydride (NaBH, ≥97%) were from Carl Roth. Ammonium acetate (analysis grade) used for chromatography was purchased from Merck.
2.2. Synthesis
The samples separated in this work were synthesized along the procedures described in [19,20]. For this, 12.5 mL solution of 5 mM sodium tetrachloroaurate (NaAuCl) and 20 mM GSH were prepared in methanol, stirred for 30 min at room temperature, then cooled to 0 °C and stirred for another 30 min. Subsequently, under vigorous stirring, 3.13 mL of aqueous 150 mM sodium borohydride (NaBH), also cooled to 0 °C, were added as reducing agent. After 3 h reaction time, the produced Au nanoclusters were centrifuged off, washed three times with methanol and dried under ambient conditions.
2.3. Chromatography
The chromatographic experiments were performed using an Ultimate3000 HPLC system (Dionex, Germany) equipped with a quaternary gradient pump (model LPG-3400A), an autosampler (WPS-3000SL), a thermostatted column compartment (TCC-3000) and a diode array detector (DAD-3000). Column switching in the AP experiments was realized using two electrically driven analytical-scale six-port/three-channel switching valves (Knauer, Germany). Due to pressure drop constraints of the detector placed between the columns, for liquid connections PEEK tubing with a relatively large bore of 0.25 mM was used.
Chromatographic conditions were adapted from [20]. Two anion chromatography columns PRP-X100, 4.6 × 250 mm, particle size 10 m, pore size 100 Å, ion exchange capacity 0.019 mequiv/g (PS-DVB functionalized with triethyl ammonium; Hamilton, USA) were used in the experiments. An aqueous eluent buffered with 20 mM BisTris and a varying content of ammonium acetate (500 to 1000 mM) was applied. The latter serves as a modifying salt to adjust the elution strength. The pH of the mobile phase was not adjusted but resulted as 7.5.
Eluents were prepared with ultrapure water from an Aquinity2 unit (MembraPure, Germany). The flow rate was either 0.4 or 0.7 mL/min. All experiments were conducted at 25 °C. For improved reproducibility, the column was regenerated between the experiments by flushing for 10 min with 1000 mM NHAc, followed by 40 min re-equilibration with the eluent at the same flow rate as in the experiments. Sample suspensions were prepared in the eluent to the required concentration.
3. Principle and Basic Design of Alternate Pumping
Recycling concepts are a type of straightforward approach to enhance the resolution of a chromatographic separation. The most frequently used one is closed-loop recycling (CLR) [26,27,28,29]. In CLR, an only partially resolved chromatogram is recycled as often as needed over the same column until sufficient resolution is achieved. Ideally, this corresponds to interconnecting several columns in series, by which the column length and efficiency are increased without increasing the pressure drop. In technical plants, however, the required recycle pump causes strong band broadening, which sacrifices the beneficial effect to a large extent. Thus, CLR is limited when it comes to high-resolution separation.
Alternate pumping (AP) is a two-column approach that circumvents the dispersion problem, since it does not require a recycle pump. In AP, the unresolved portion of a chromatogram leaving one column is transferred directly into a second (usually identical) column. After the transfer, the column order is reversed. This ‘recycling’ is repeated as often as necessary. The peak resolution increases with the square root of cycles [47], which facilitates a remarkable resolution power as shown in [37]. It is worth mentioning that AP differs in several aspects from CLR. In CLR, the complete column content is recycled, which essentially fixes the cycle time.
More flexibility can be achieved by so-called peak shaving, by which sufficiently pure product fractions are removed in each cycle [30]. However, by the CLR principle impurities are ’trapped’ within the system and may spread over the elution profiles. Targeted removal of such impurities would require additional fractionations and is very difficult for impurities closely eluting to the target peak. In contrast, the use of two columns in AP offers more degrees of freedom. Removal (‘shaving’) of impurities occurs inherently in each cycle, minimizing the spreading of their bands.
As will be shown in a later example, impurity removal can be enhanced further by asymmetric switching operations such that, during operation, specific peaks are either retained within the process or removed. Finally, the implementation of additional peak shaving as well as gradient steps are rather straightforward [40]. The price to be paid for the enhanced efficiency and flexibility of AP is the higher solvent consumption. While CLR does not require additional solvent, in AP, fresh solvent is introduced permanently.
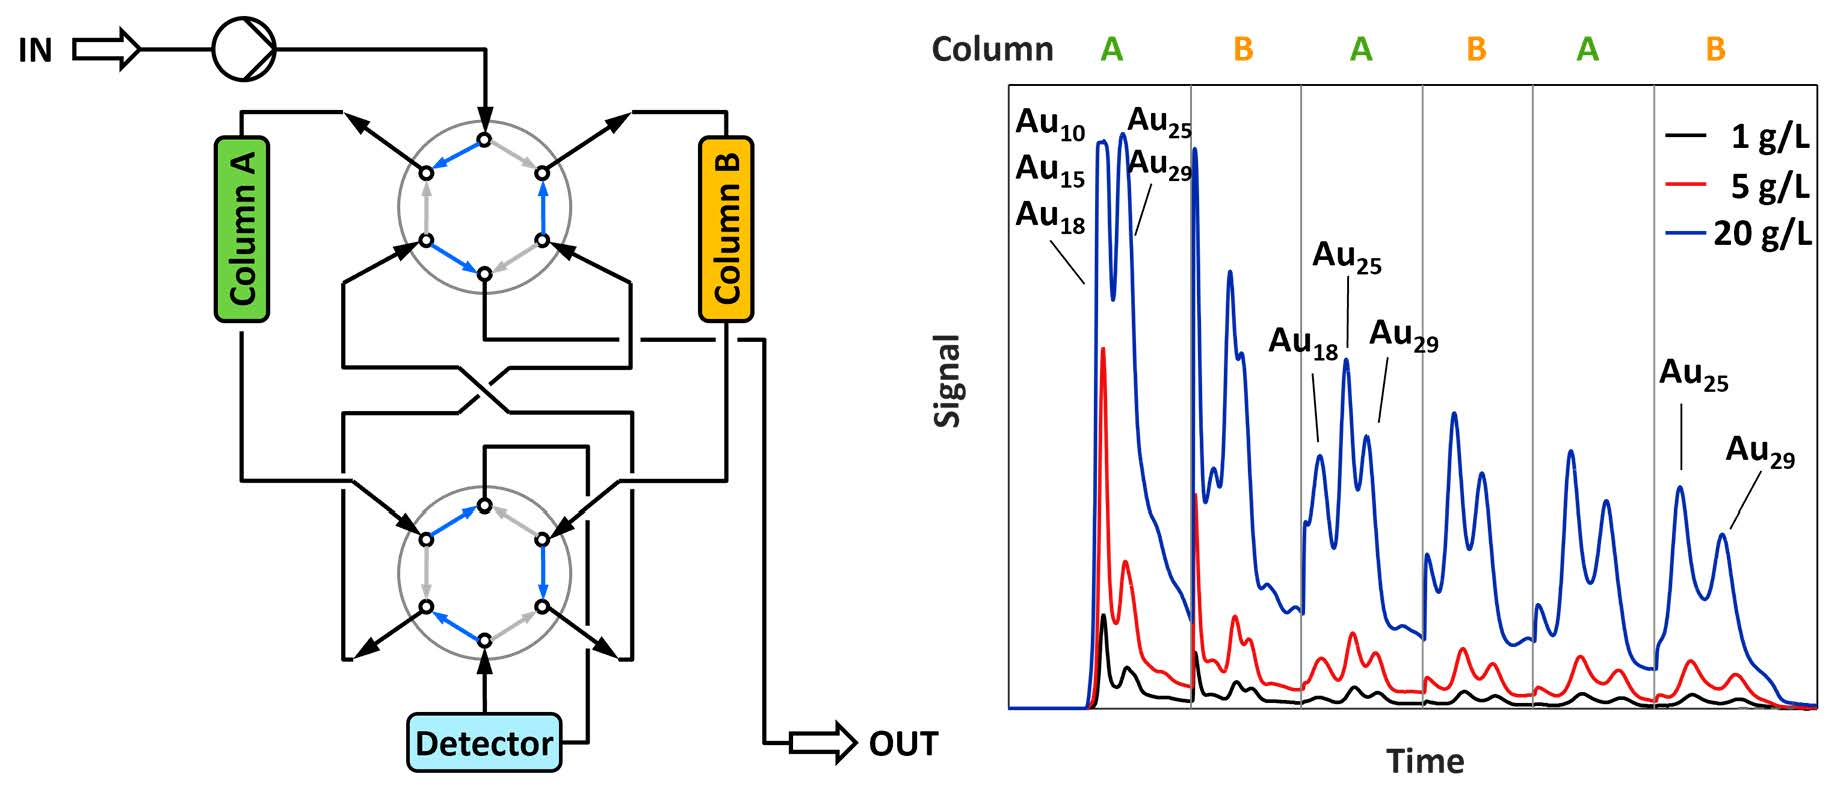
AP processes can be realized by different setups, usually based on one or two conventional multiport switching valves. Here, we apply the scheme in Figure 1 with two columns (A, B), a detector (D) and two six-port/three-channel switching valves (V1, V2). The two switching positions of the valves (I, II) facilitate four different arrangements of columns and detector as listed in the allocation table in Figure 1. Such a setup is particularly suited when only a single detector is available, since the latter can be placed at any column outlet at the desired times. Using two detectors, both column outlets can be monitored permanently.
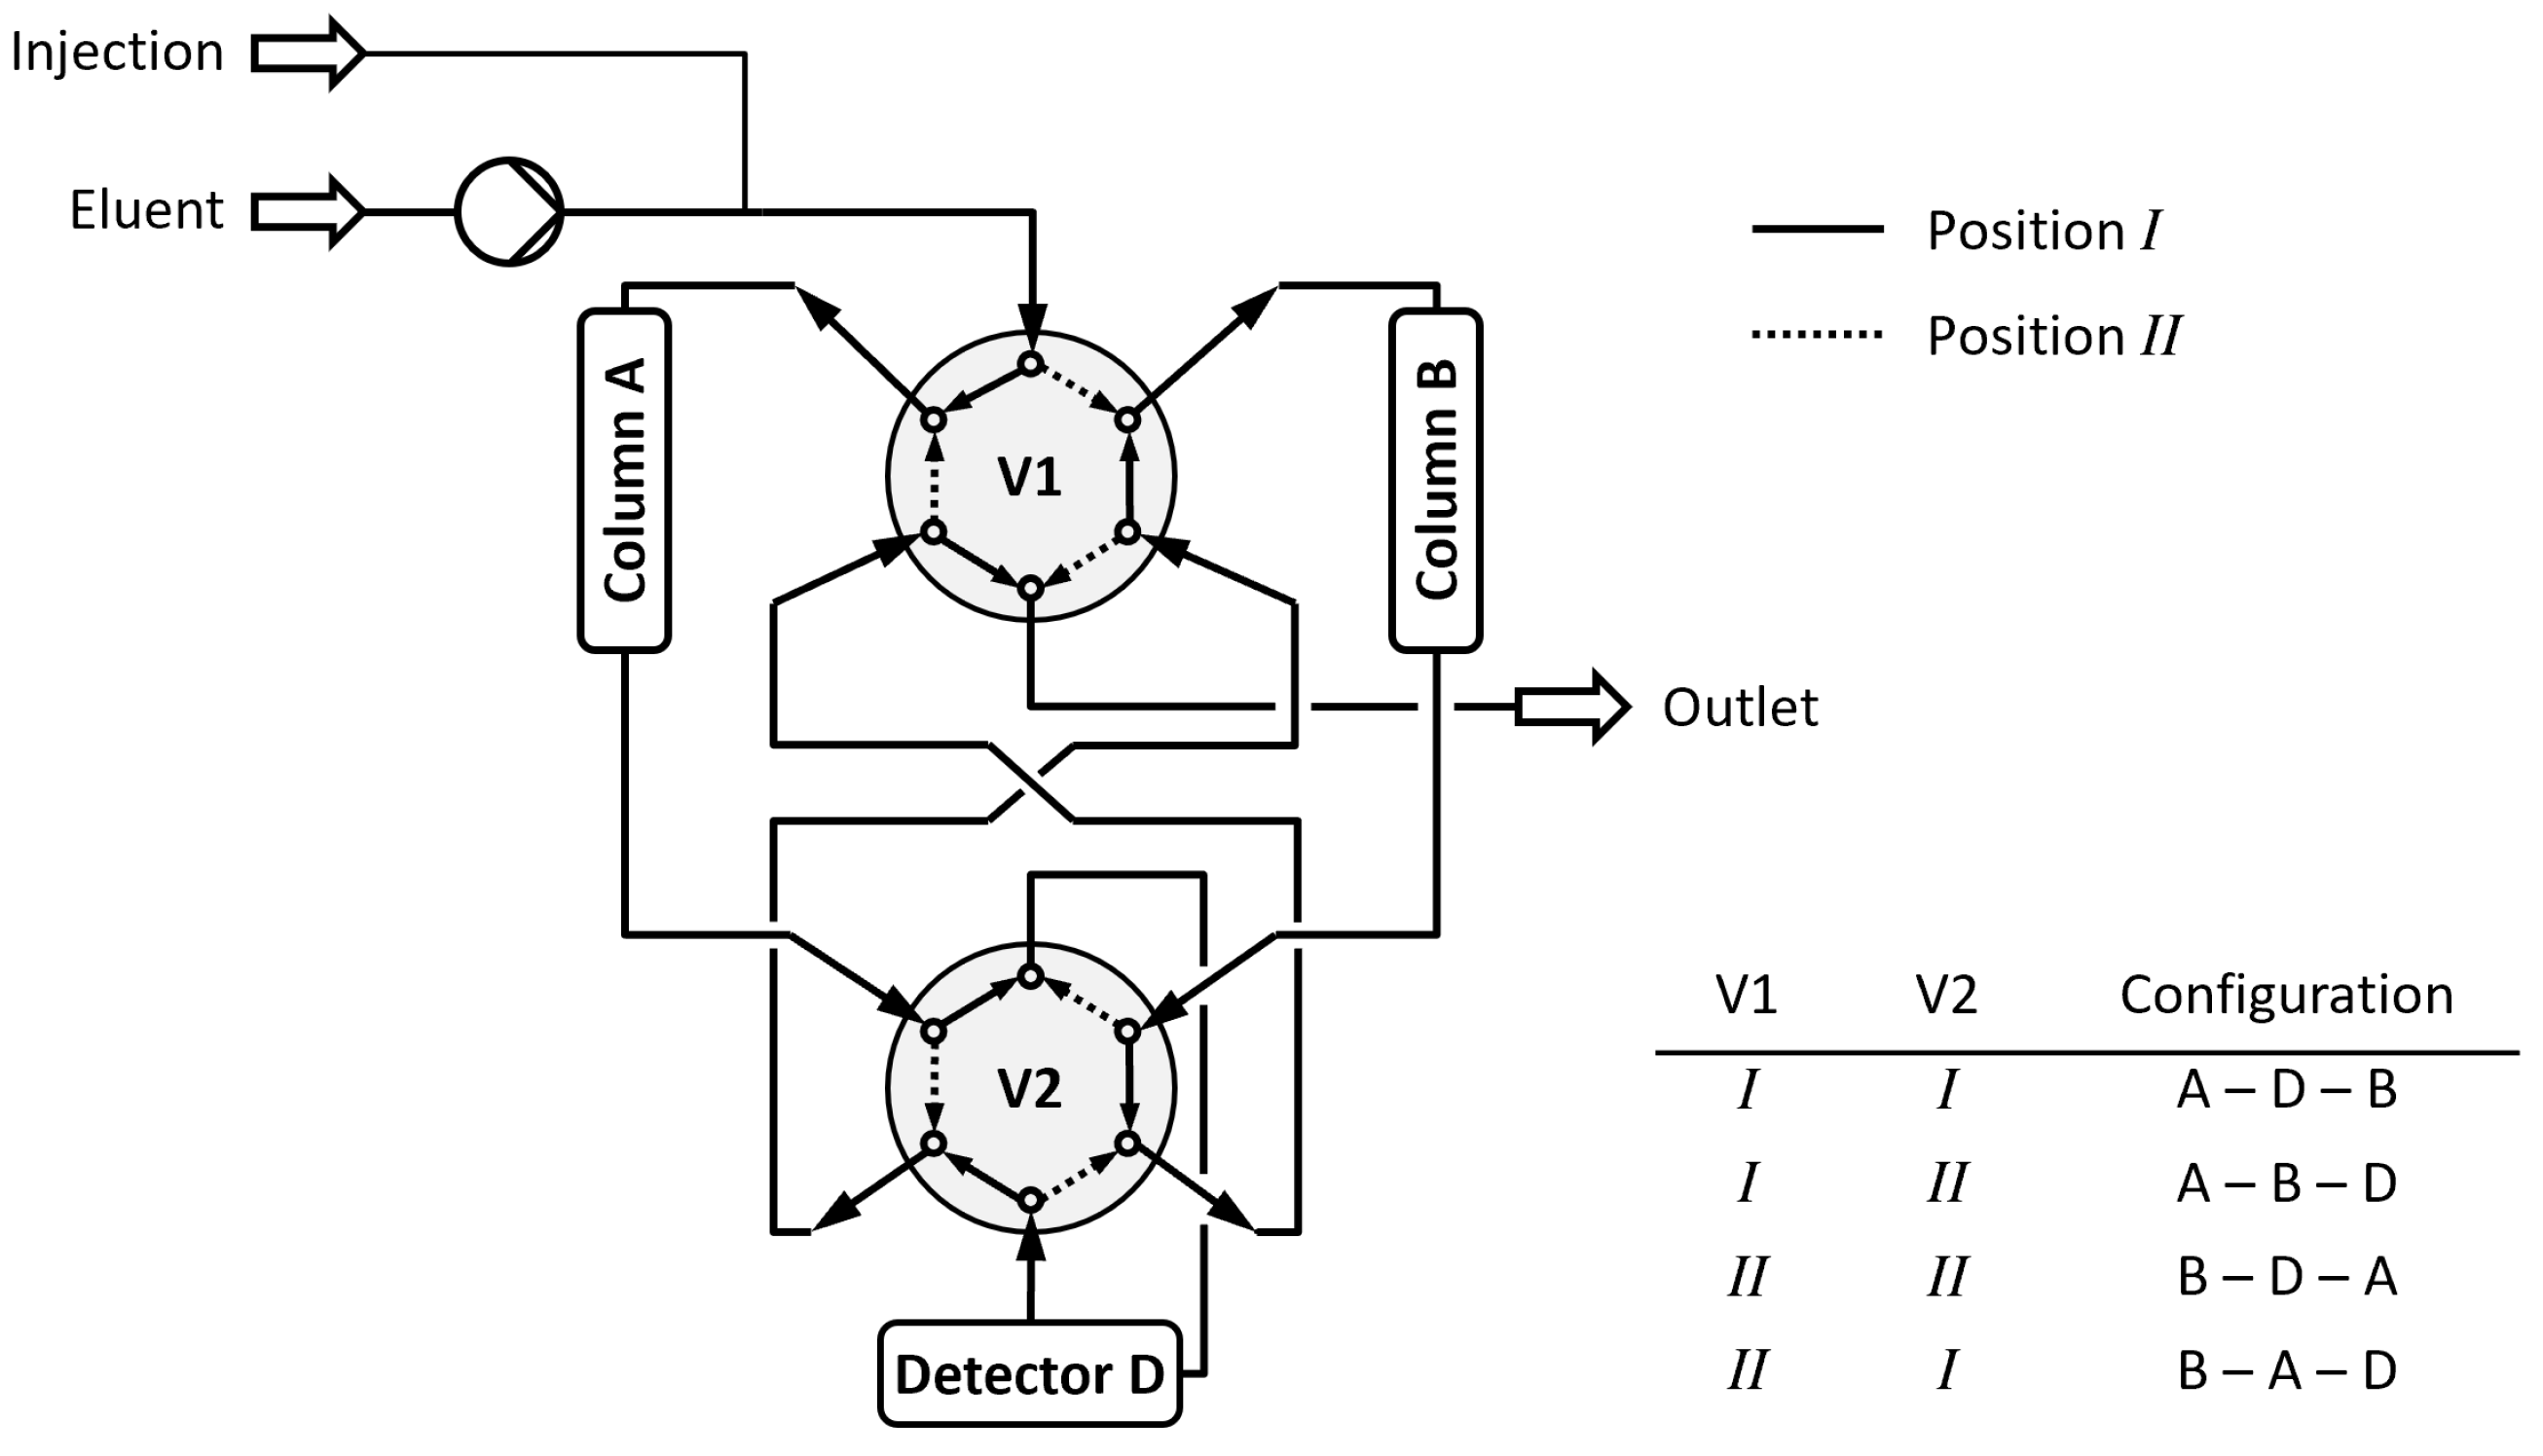
Figure 2 illustrates the course of the concentration profiles in an AP process that isolates a target compound (c) from a mixture with five components (a–e). At the start, the column order is A–B, and the injection is applied to A. The outlet profile of A (Figure 2, top row) after the first cycle is only partially resolved. In the second cycle, column B (second row) delivers a somewhat improved resolution. During the first two cycles, significant proportions of the early and late eluting components (gray peaks) already leave the system through the outlet (bottom row).
In consecutive cycles, the resolution enhances further, and increasing amounts of now also close-eluting impurities are removed. In the final cycle, the component c leaves column A in essentially pure form. Note that the third row of Figure 2 shows the elution profiles as they would pass a detector permanently located between the columns. This corresponds to switching only between the configurations A–D–B and B–D–A in Figure 1, and this is the procedure applied experimentally in Section 4.
When inspecting Figure 2, one notices that, while the resolution increases with every cycle, the peak broadening and dilution also increase. This is expected and has to be considered in the design. For a large number of cycles, the width of the target peak will eventually exceed the cycle duration. Then, its trailing and/or leading parts will leave the process through the outlet, thus, causing a decrease in yield or requiring additional measures.
The main task in designing an AP process is to find appropriate switching times or durations for the individual cycles. This is straightforward for scenarios as in Figure 2, where a specific target component should be isolated from its neighboring peaks. Two design tasks have to be met here. The first is to keep a desired portion of the chromatogram that elutes at a specific time within the ‘elution window’ of each cycle. This is clearly achieved when choosing the duration of all cycles as .
In most cases, will be the retention time of the target peak; for the example in Figure 2, this is component c (marked in red). The second task is to decide about the relative position of the recycled portion in the elution windows. Usually, a centered position will be desired. In such cases, the end of the first cycle must be delayed by a time difference equal to half of the cycle duration. In summary, for the switching times, (i denotes the cycle number) holds
where is the total number of cycles. The last cycle, , is typically chosen longer to achieve complete elution. With the mentioned conditions for recycling and centering on a target peak, and , one obtains from Equations (1a) and (1b) all switching times simply as
4. Results
4.1. Chromatographic Separation Problem
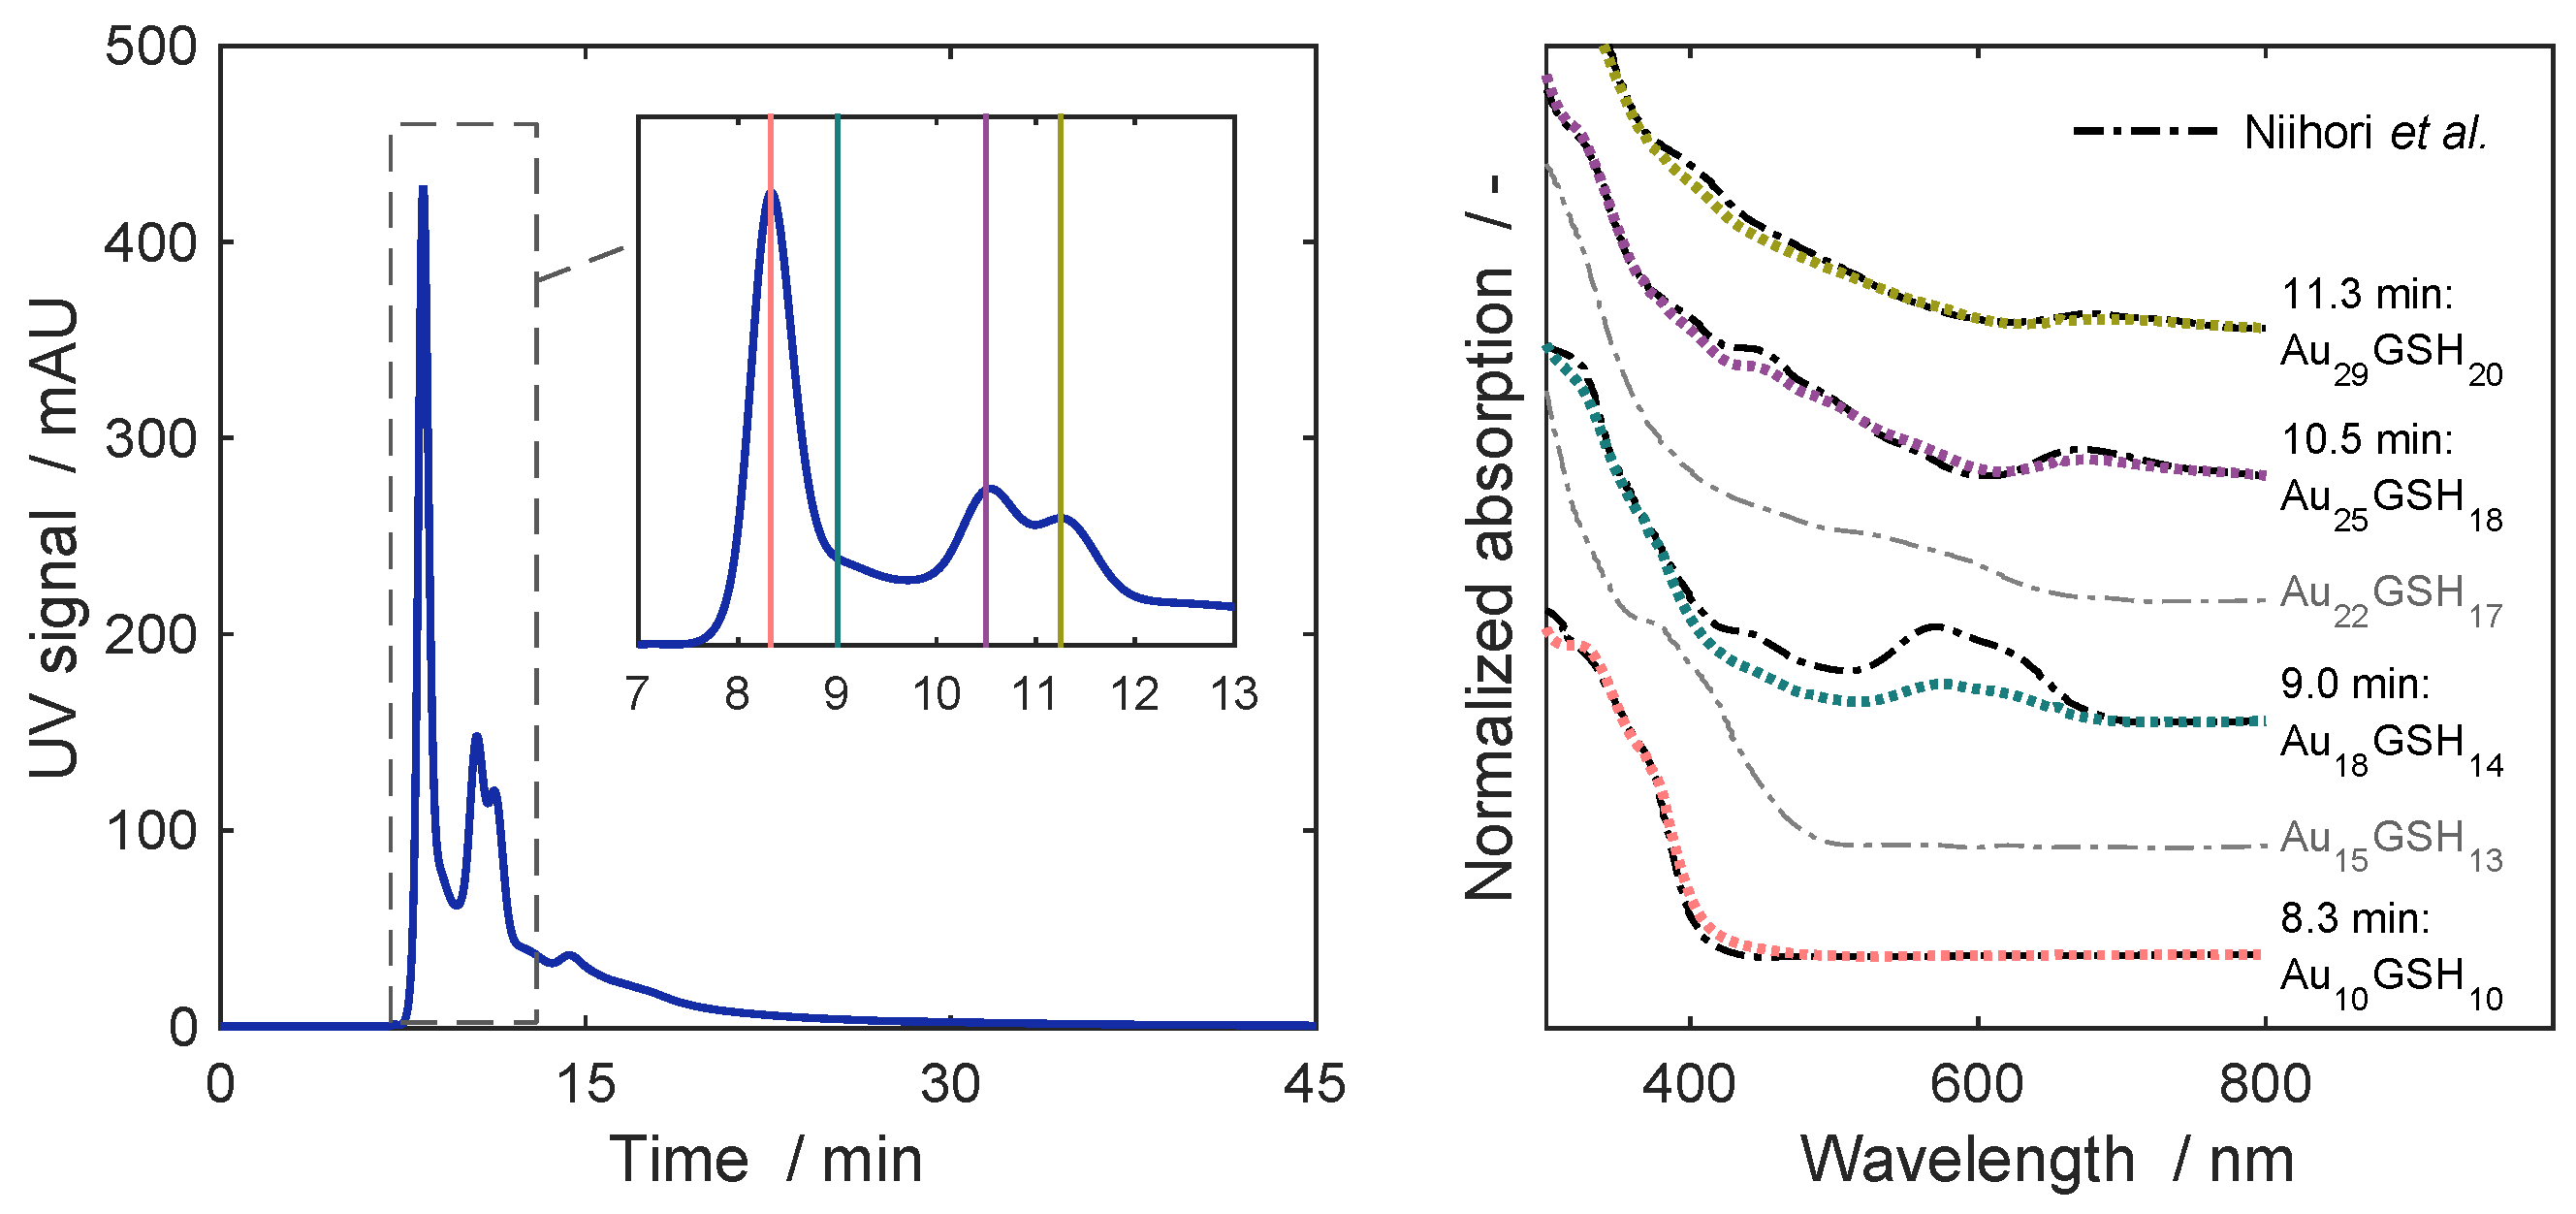
As an example, Figure 3 (left) shows the isocratic separation of a synthesized sample at conditions typical also for the later alternate pumping experiments. The earlier peaks correspond to discrete gold nanoclusters (AuNCs) of different sizes (see below), while the unresolved large peak after about 14 min contains strongly retained synthesis impurities, including various larger clusters. The latter peak shows a strong tailing such that the baseline is reached only after about 25 min, which indicates the presence of some strongly retained impurities. The mixture potentially contains small amounts of even stronger retained components, which may be responsible for the small retention time drifts observed in repetitive injections. Reproducibility was improved greatly after including the washing/equilibration step described in Section 2.3.
As demonstrated in [18,19,20], chromatographic peaks of individual AuNCs can be identified unambiguously based on their distinct UV-VIS spectra. Even in the case of the incompletely separated chromatogram in Figure 3 (left), we can identify four different clusters. We denote the individual species by AuGSH, where x indicates the number of gold atoms of a cluster, and y is the number of attached glutathione (GSH) ligands. The comparison of the measured spectra to those reported by Niihori et al. [18] in Figure 3 (right) reveals that the spectra at the four marked times closely correspond to (ordered by their elution times) AuGSH, AuGSH, AuGSH and AuGSH.
In addition, experiments with shallow gradients as in [20] (an example is given in Figure S1 in the Supporting Information, SI), as well as some of our AP experiments, reveal that the first peak also contains a small amount of AuGSH. A corresponding example along with the identification of all the mentioned cluster sizes is given in Figure S2 in the SI. Furthermore, electrospray ionization–mass spectrometry (ESI/MS) of cluster samples synthesized under the same conditions confirmed the presence of the mentioned clusters and, additionally, trace amounts of AuGSH and AuGSH, which cannot be resolved chromatographically [19,20]. In the following, we denote the individual peaks only by the number of Au atoms of their main component (e.g., ‘Au’ denotes the corresponding peak, even if it contains small amounts of other species).
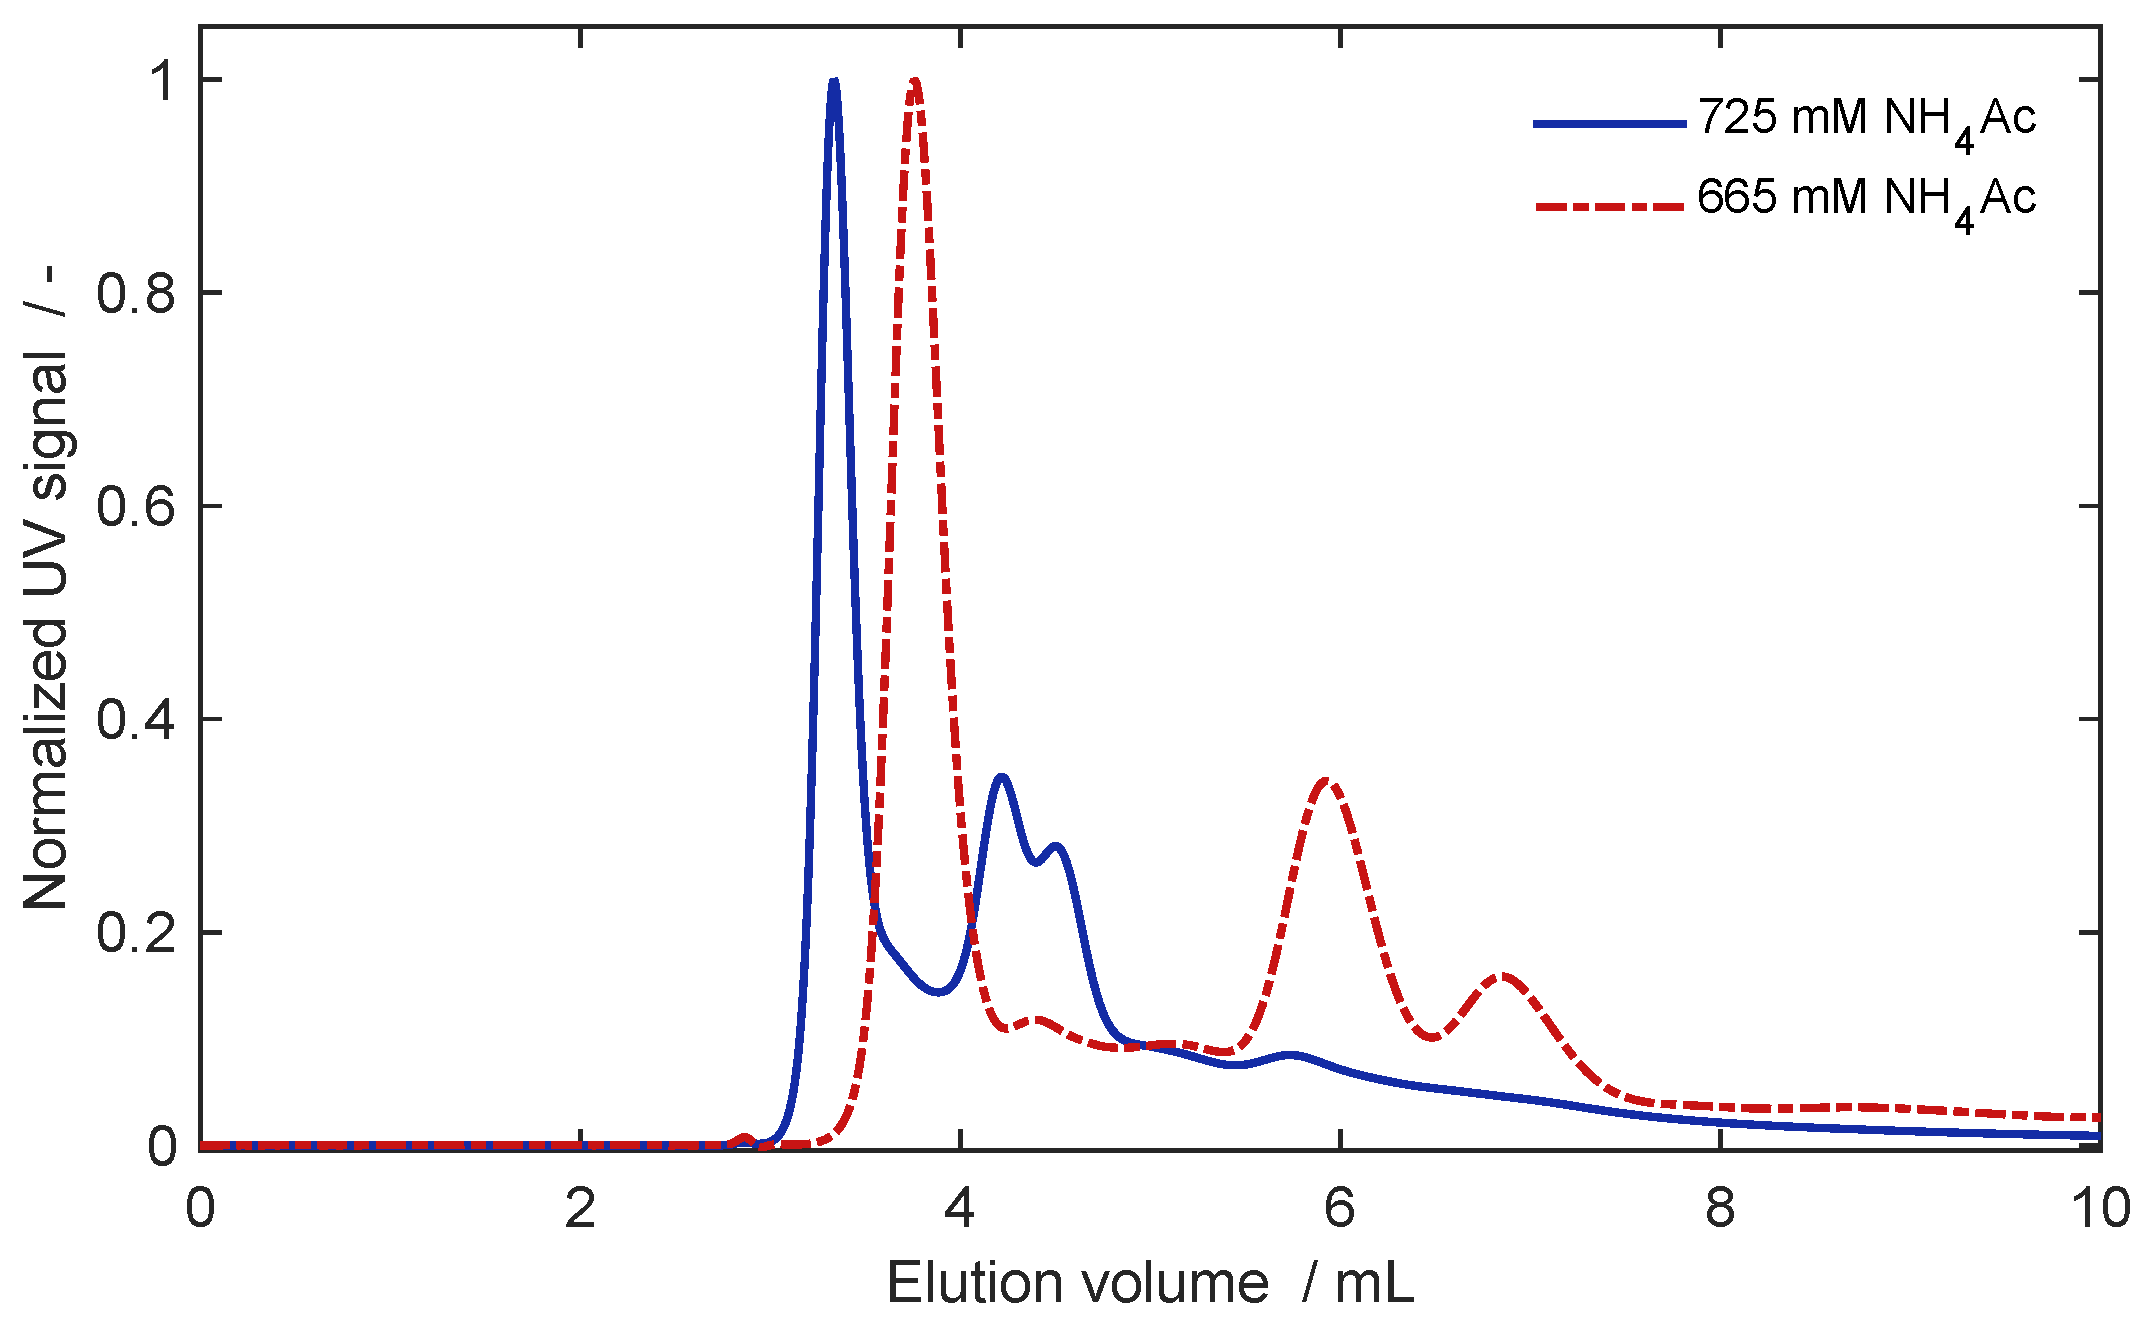
The above results indicate that the elution behavior is strongly affected or fully controlled by the ion exchange mechanism, since the elution order is along the number of charged GSH ligands. Consequently, resolution under iscratic conditions can be enhanced by lowering the salt concentration. An example is given in Figure 4. It can be seen that lowering the salt concentration from 725 mM, as used in Figure 3 (left) to 665 mM, allows for a better resolution. Separation is enhanced in particular among the smaller clusters and between those and the larger clusters.
For example, the separation factor, (the calculation is explained in the next section) between Au and Au increases by 35% (from 1.7 to 2.6) by decreasing the NHAc level to 665 mM. In contrast, despite their stronger retention, the separation between Au and Au is improved by only 9% ( increases from 1.14 to 1.29). Further improvement of the separation is possible with shallow salt gradients; an example is given in Figure S1 in the SI. For a detailed study of the role of salt concentration and gradient development, we refer to [20].
4.2. Separation by Alternate Pumping
The scope of this work is to demonstrate the applicability and potential of alternate pumping for resolving challenging separation problems that occur when synthesizing nanoparticulate materials. Therefore, rather than aiming at optimizing separation conditions for conventional isocratic or gradient chromatography, we intentionally chose conditions that led to only partial separations as in Figure 3 (left). The shown chromatogram is typical for this type of application and serves as a reference example. It reveals that isolating one or more specific clusters from a synthesis solution requires accomplishing two separation tasks simultaneously. The first is to resolve closely eluting components, while the second is the removal of early and late eluting impurities that are present in the complete elution profile.
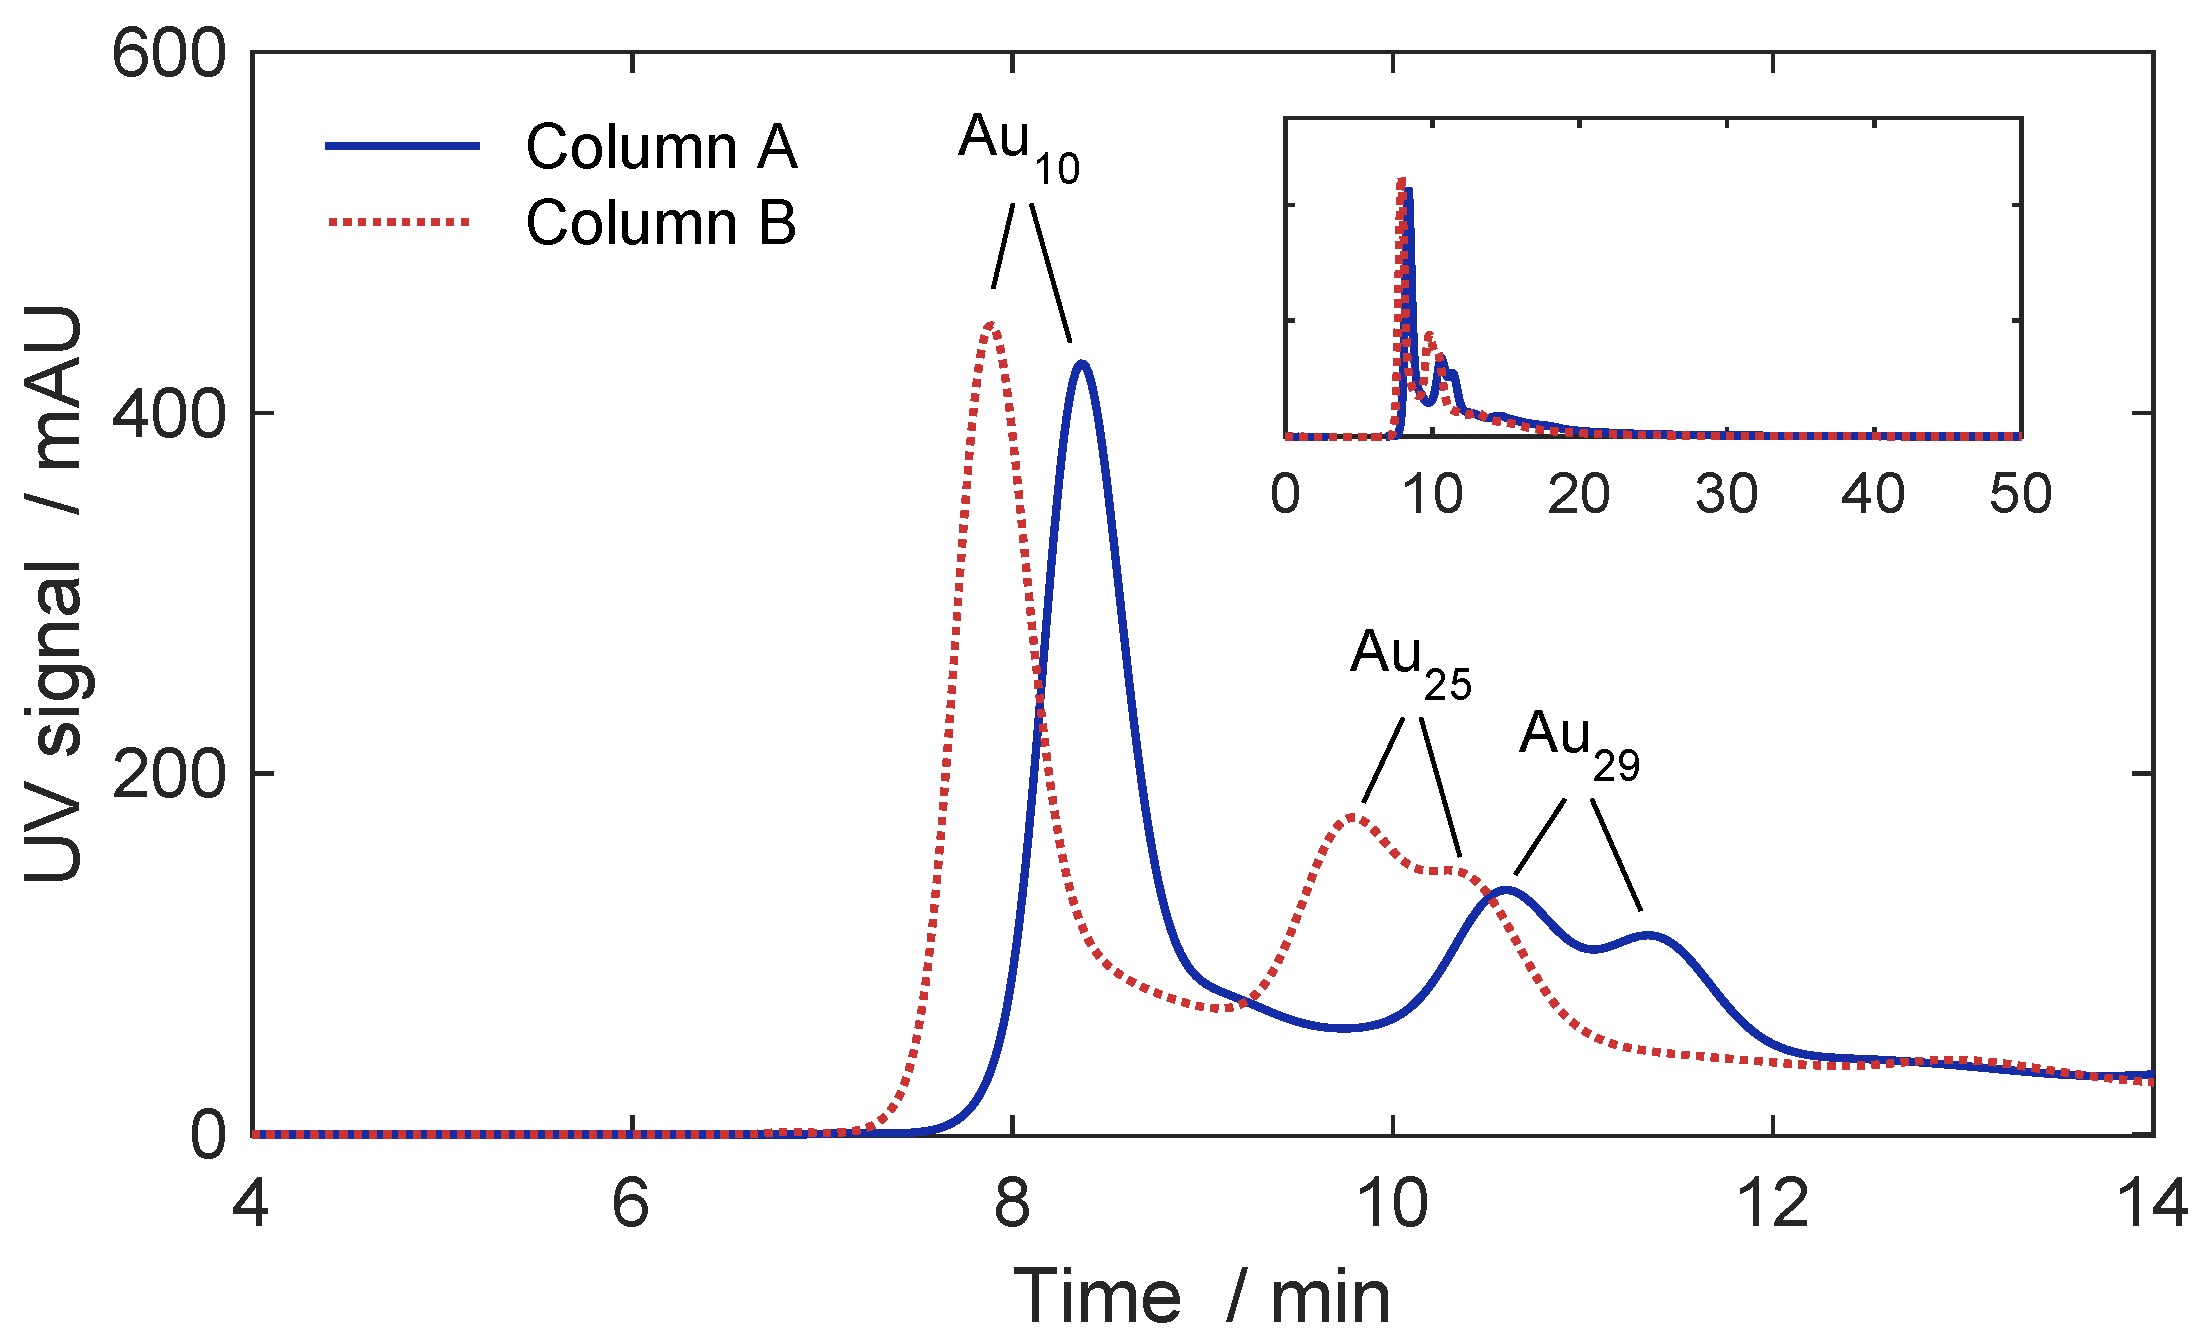
In a first step, the elution behavior of the two columns (A, B) is compared in Figure 5 under the same conditions as in Figure 3. Inspection of Figure 5 reveals that the elution order is identical and that the resolution is similar for both columns. However, the retention times for column B are significantly lower. This may be due to the different lab histories of the columns or due to batch-to-batch differences in their manufacturing. A clearer picture is obtained on the basis of thermodynamic parameters. From the void times of the columns, , as taken from the injection peak distortions and after subtracting the system’s void time, we find the total porosities for column A and B as 0.5 and 0.48, respectively.
This difference is too small to explain the observed discrepancies. Table 1 compares the capacity factors, , for the three significant peaks of Au, Au and Au in Figure 5, calculated from their retention times as . Based on this, the capacities of column B are between 6% and 10% lower than for column A. However, the separation factors between two consecutive peaks i and j also given in Table 1, differ by less than 3%. This similarity simplifies the coupling of these different columns in AP experiments.
4.2.1. Isolation of Two Larger Clusters
As a first example, we apply alternate pumping to isolate the two largest identifiable clusters, Au and Au, together from the rest of the mixture. This corresponds to purifying and further resolving the double peaks visible in Figure 5 at around 11 min (column A) and 10 min (column B).
Since the differences of the retention times between the two columns are too large to be ignored, designing suitable switching times requires adapting the procedure in Section 3. The simplest way would be to use an average value of the retention times for in Equation (2), i.e., . While, in many cases, this will be sufficient, it will cause a certain ‘swing’ of the positions of target peaks from cycle to cycle.
This may lead to a loss of product, particularly if the retention times differ strongly and many cycles are performed. Such a situation can be circumvented by using different values for in each cycle. Specifically, after the first cycle, one simply alternates the cycle duration in odd and even cycles between and .
When adopting this strategy for the isolation of the two species Au and Au, the cycle durations should correspond to the mean retention times of both peaks (or, alternatively, to the elution time of the valley between the two peaks) determined for each of the two columns separately, i.e., and . From Table 1, these mean times are found as min and min. In the first cycle, injection is performed onto column A. Thus, according to Equation (2), the switching after cycle 1 is at min. In cycle 2, the target species migrate through column B. Thus, min. In cycle 3, min and so forth.
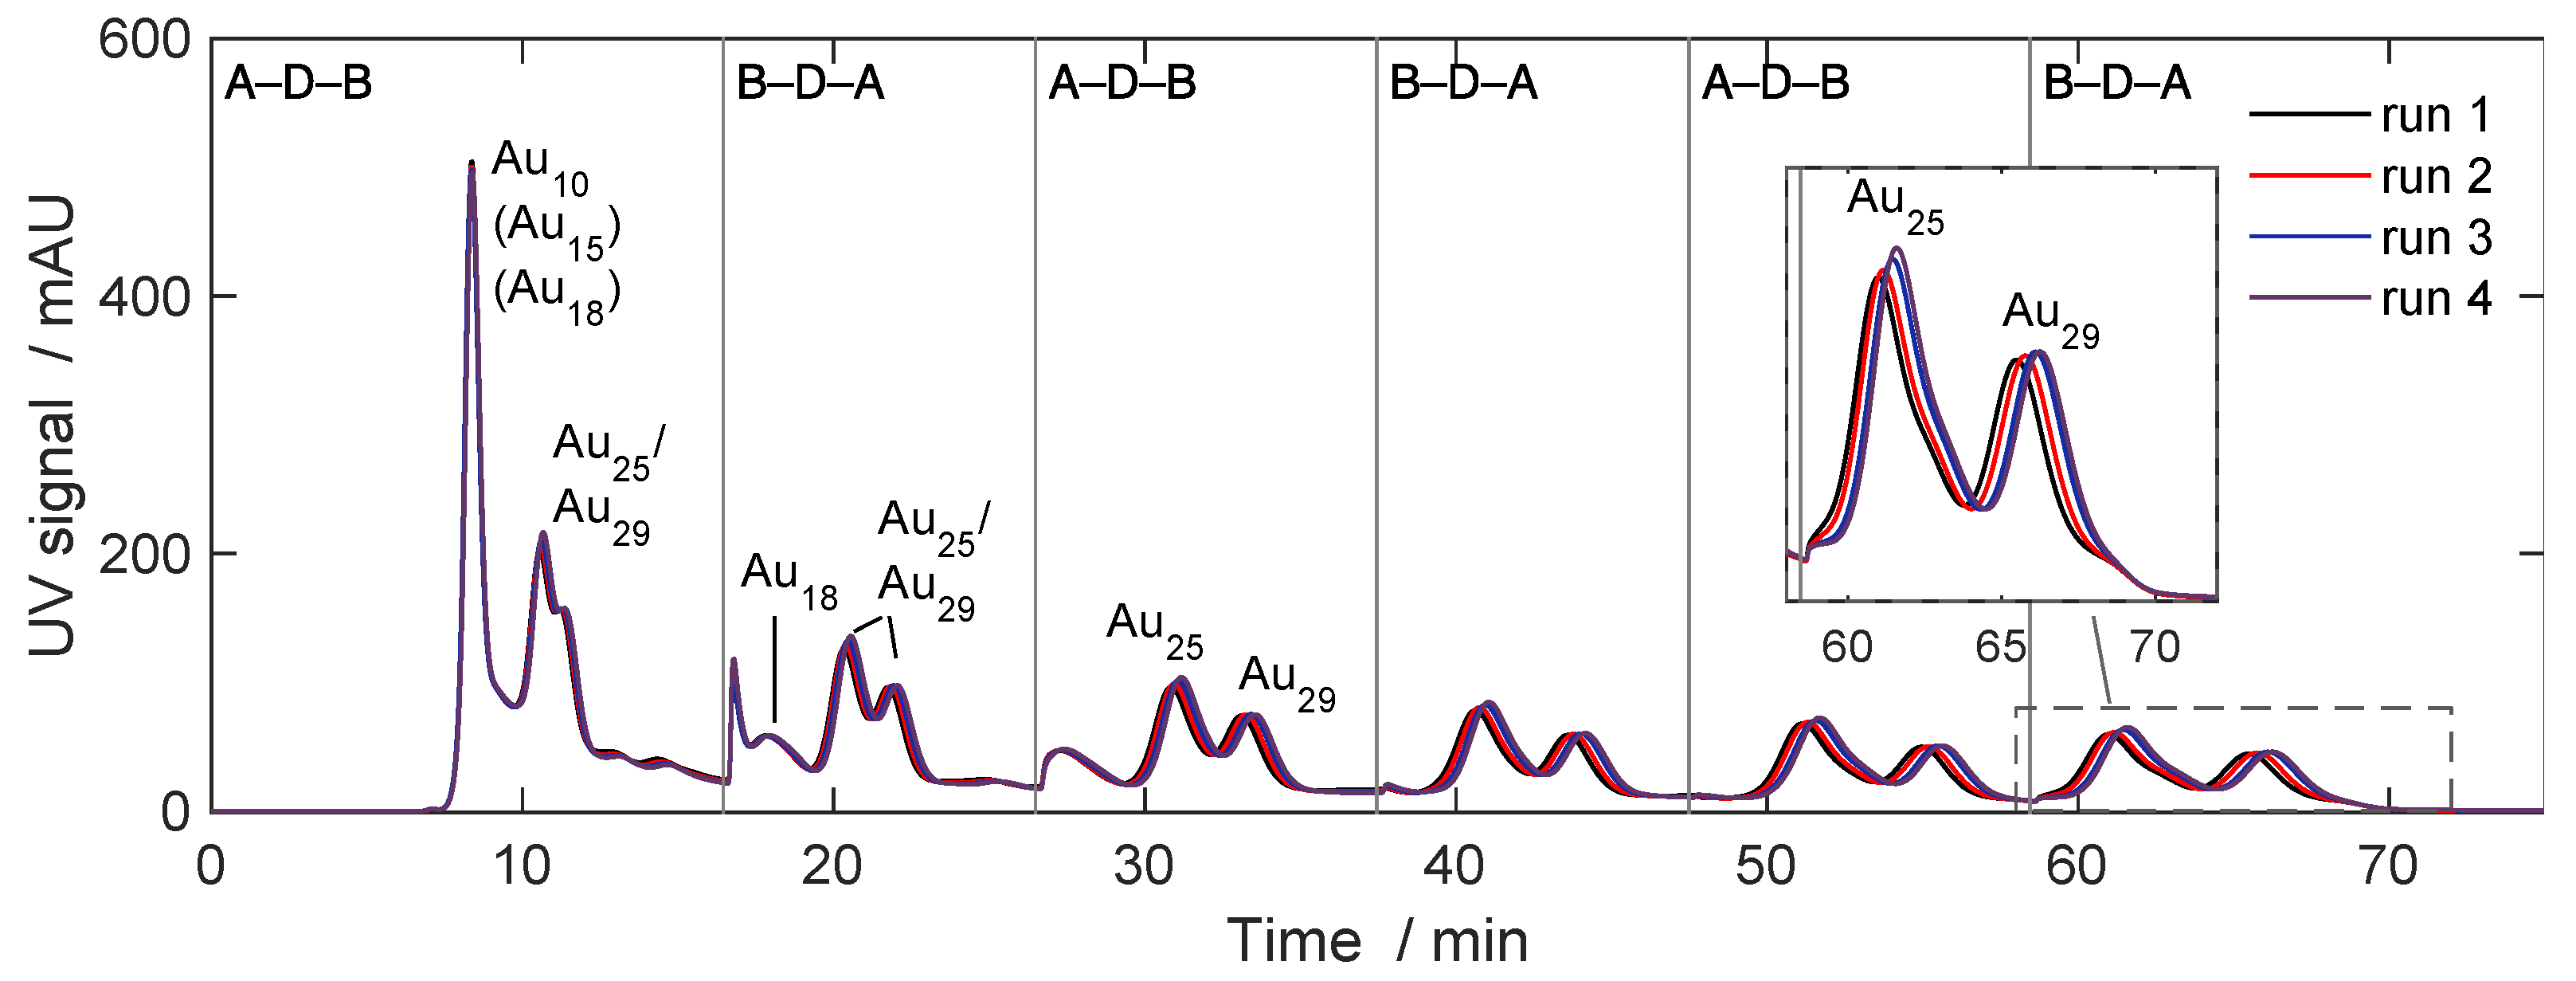
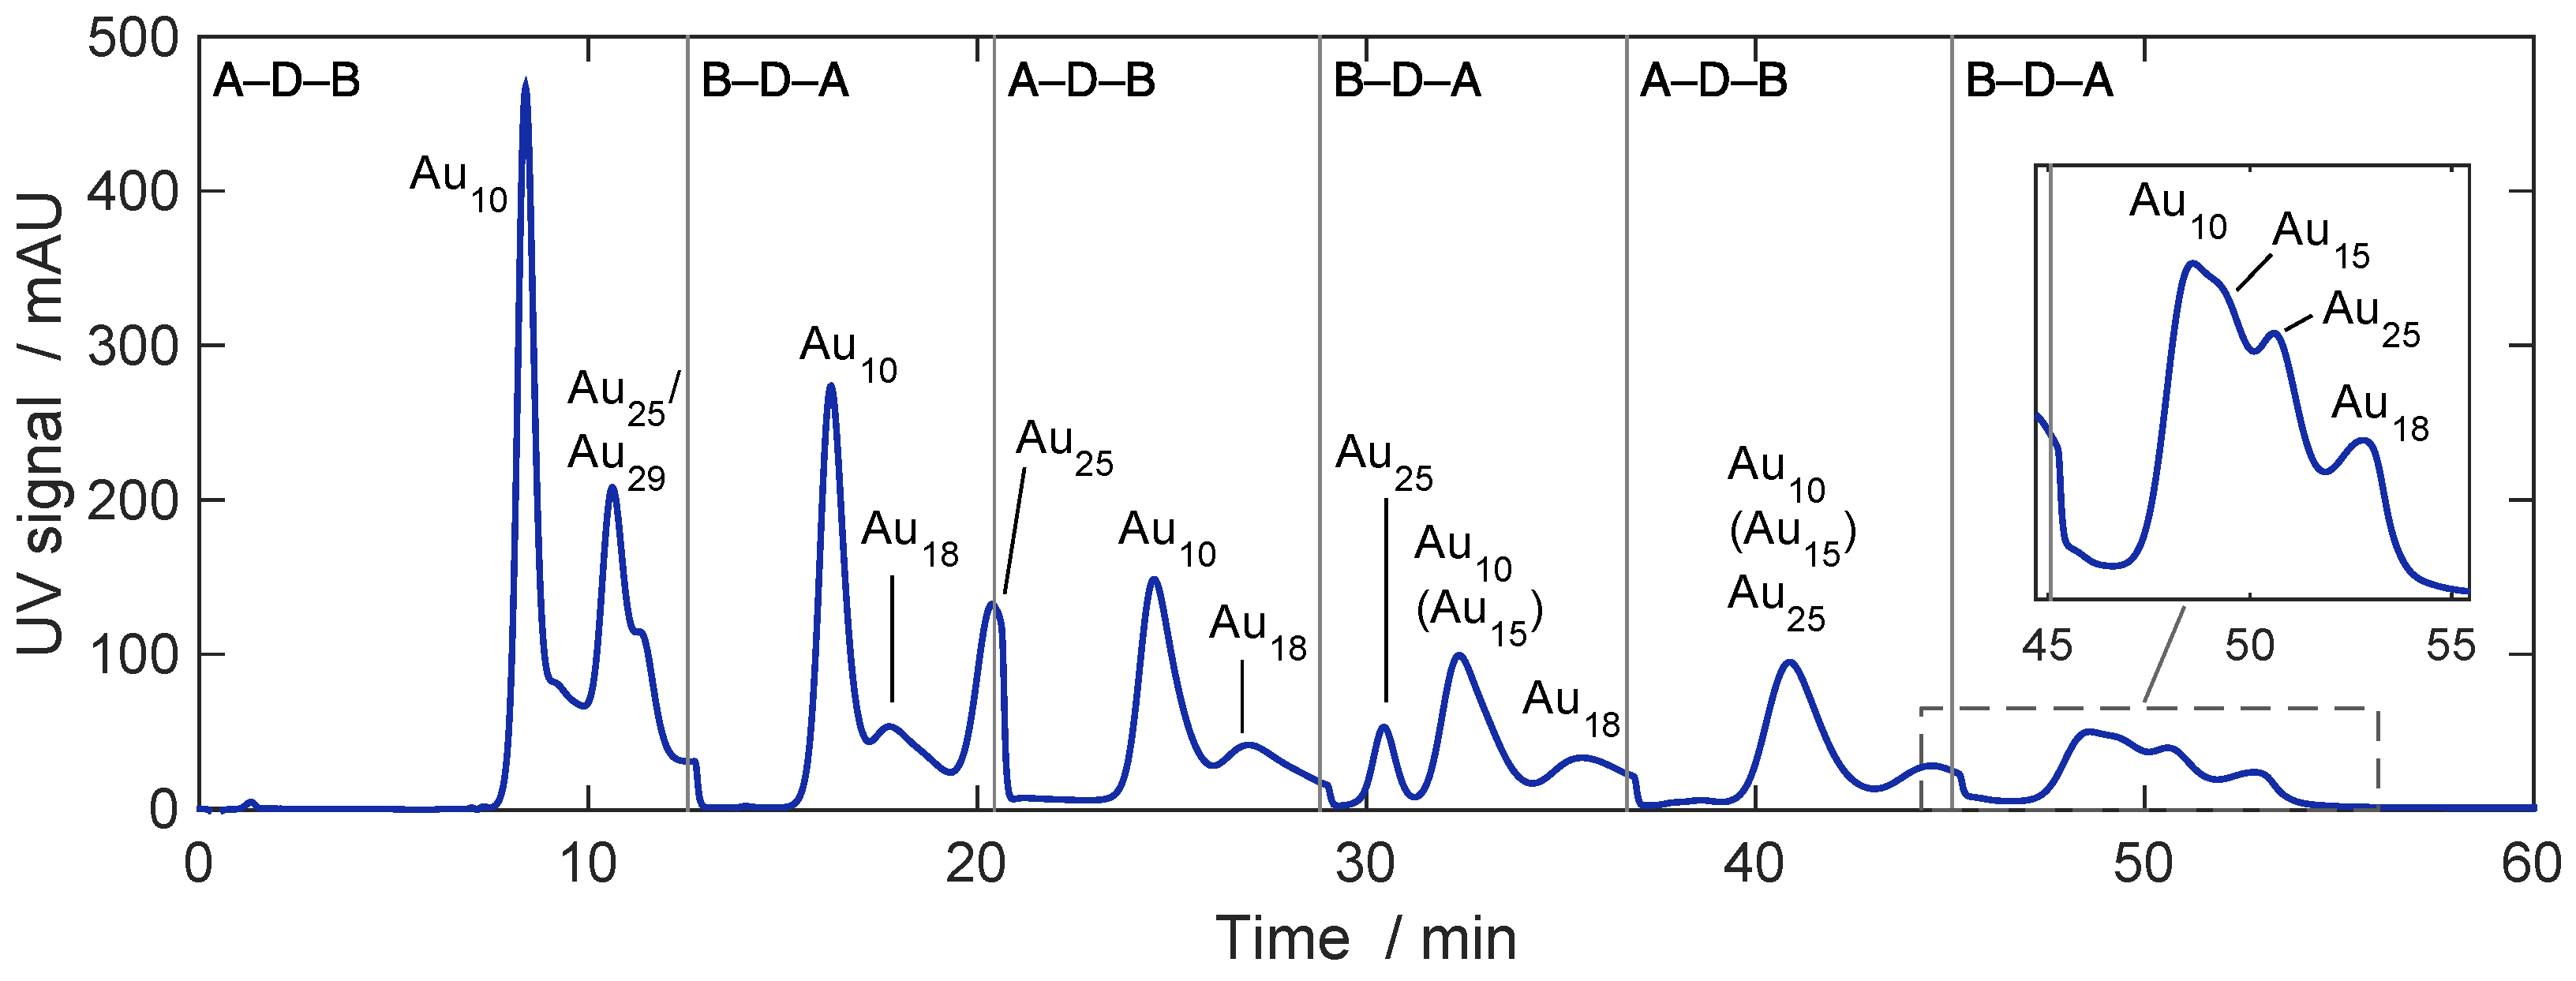
Figure 6 shows the results of corresponding AP runs with six cycles. As in all our experiments, switching of the two valves was performed such that the process configuration altered between A–D–B and B–D–A only (cf. Figure 1). That is, the UV-VIS detector always monitors the outlet of the relevant column (analogous to the third row of Figure 2). It can be seen in Figure 6 that the two target peaks of Au and Au elute—as desired—in the center of all elution windows. The unwanted Au is completely removed after the first two cycles.
In subsequent steps, the distance between the target peaks and remaining earlier impurities increases progressively, and by cycle 4, the latter are essentially removed. In parallel, during each cycle, the resolution between Au and Au increases. Although this was not the main goal of the experiment, in the last cycle, they are almost fully separated. Considering the selectivity, , between Au and Au is about 1.1 only (see Table 1), this indicates the efficiciency of AP. Note that, in the last cycle, the baseline also drops to zero, which shows that all later eluting impurities are removed.
Some further observations from Figure 6 deserve mentioning. In cycles 2 and 3, one notices a small temporary peak of Au (and presumably of Au), which was not resolved in the first cycle. This also underlines the significant separation power of AP. Further, the inset of Figure 6 reveals a slight shoulder at the Au peak, whose origin could not be clarified from the spectra. The shoulder gradually evolved during the previous cycles, which indicates that it may be a component chemically similar to Au.
The reproducibility of the four consecutive experiments shown in Figure 6 is considered good, in particular when considering that these are recycle experiments with long run times. Nonetheless, one observes a slight drift of the Au and Au peaks. Since the column was regenerated between all runs and the areas of these peaks are increasing slightly, we attribute this to a marginal shift in the relative composition of the sample. Additional experiments indicated that this may occur within the first few hours for freshly prepared samples as used here, potentially due to slow redispersion kinetics of the larger clusters. The effect is, however, very small.
Finally, with increasing number of cycles, the band broadening of the target peaks in Figure 6 increases, and their height decreases. While this is to be expected, it limits the achievable separation. Determining the column efficiency over several cycles by the half-height methods gives a number of theoretical stages of approximately 1.100 per column for the target peaks. This is not very high for analytical columns; however, it should be noted that these numbers include the repetitive extra-column dispersion in the valves, tubes and the detector. Higher efficiencies are certainly possible for the given system by, for example, optimizing the salt concentration, pH, temperature and particle size of the stationary phase and by minimizing the system dispersion.
4.2.2. Isolation of a Single Cluster
Below, we consider the typical design goal of isolating a single species out of the mixture. For this, we aim at isolating Au, which corresponds to the first peak in the chromatograms in Figure 5.
The design is performed analogously to the previous example, with the difference that the cycle durations and switching times are now determined from the retention times of Au on the two columns, and (for values, see Table 1). Accordingly, we set min, min, min, etc.
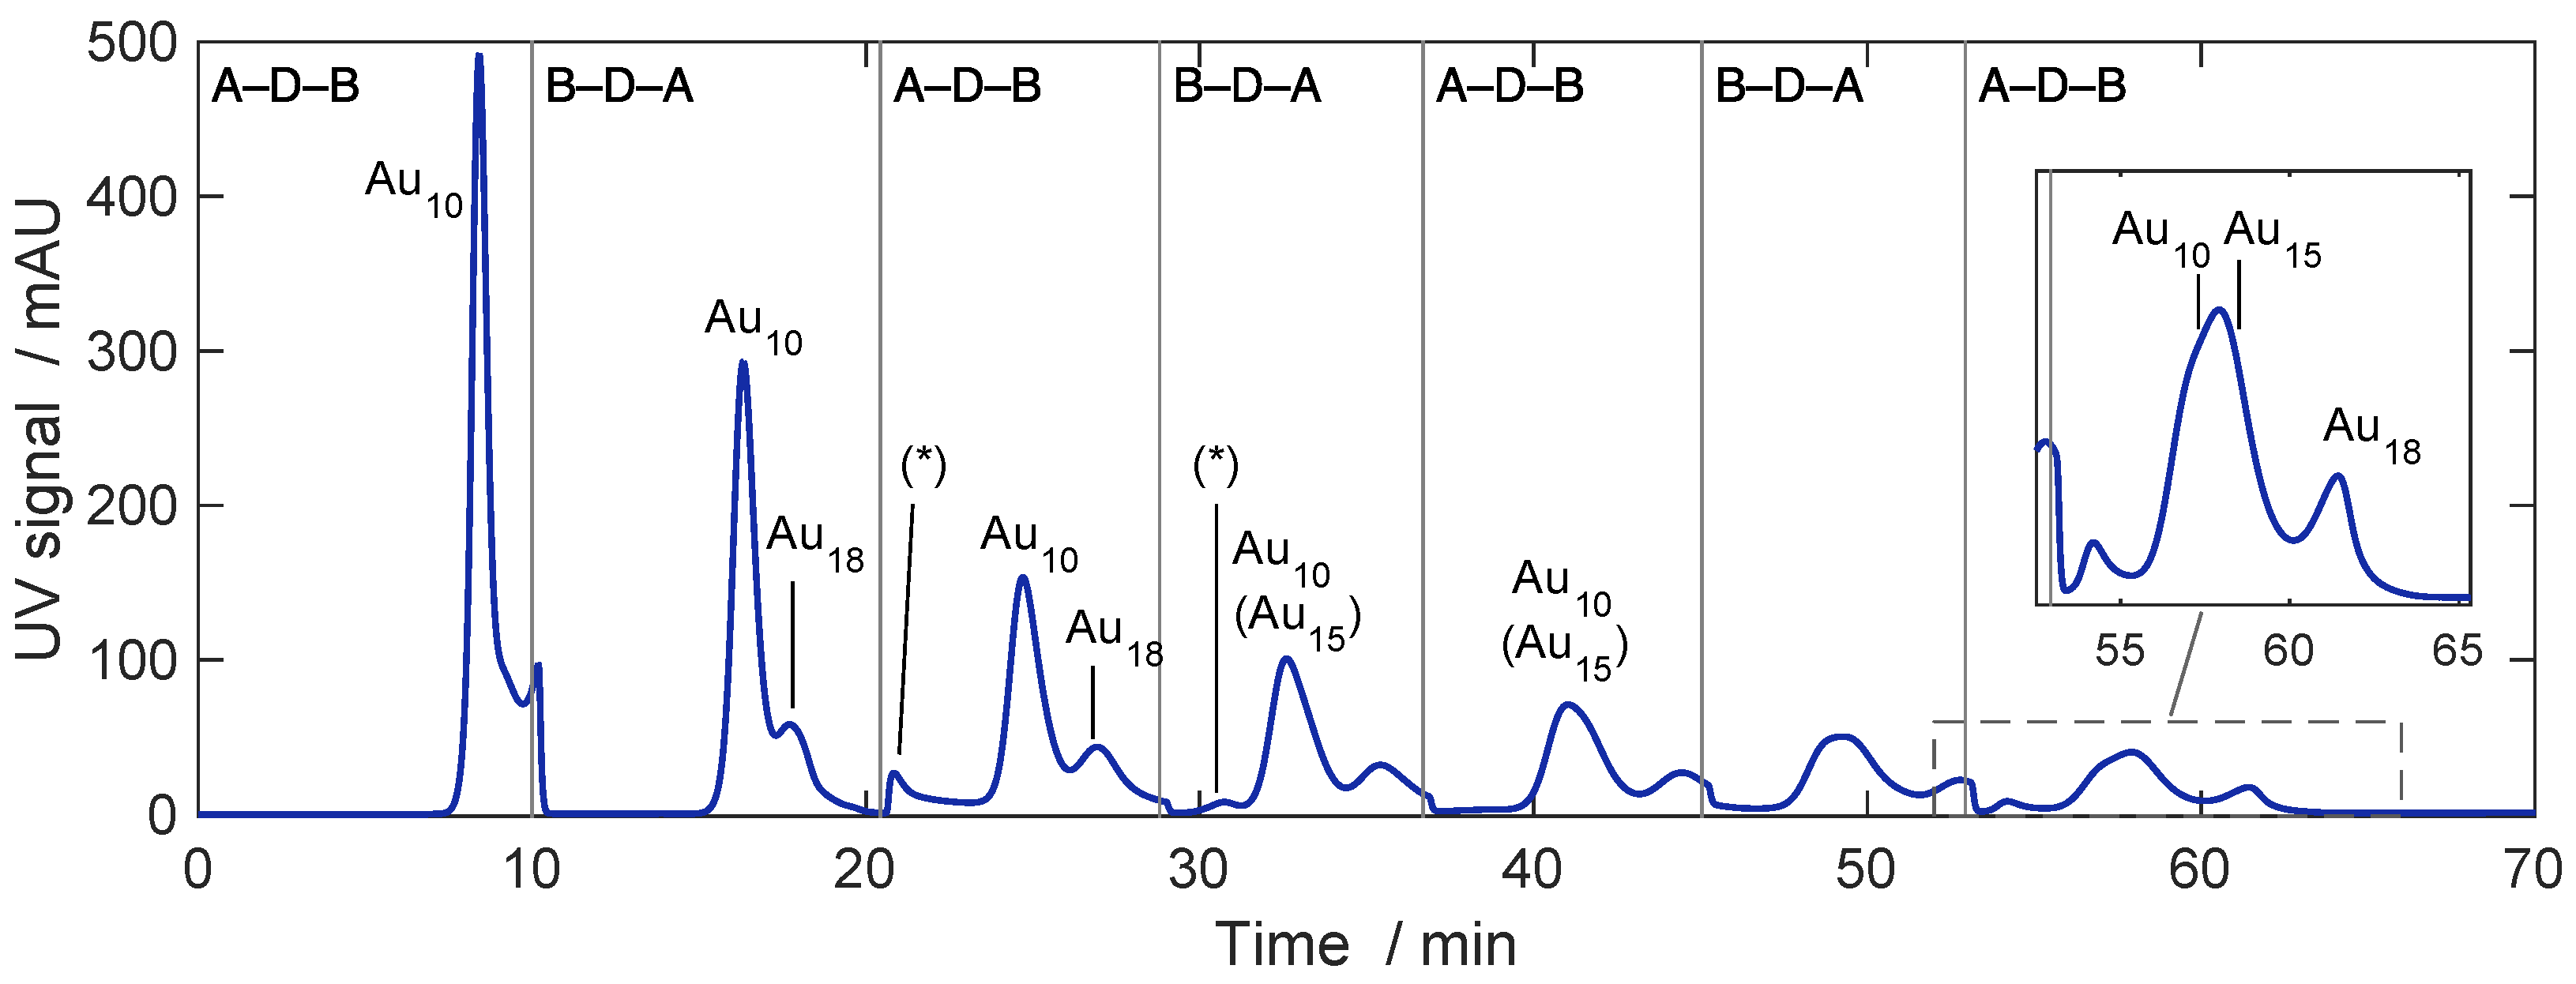
Figure 7 shows a corresponding AP experiment with six cycles. As desired, the target peak of Au is maintained as centered in all cycles. The late eluting impurities and Au are removed. Au, which elutes very close to Au, is removed only partially; however, the two are resolved well. However, the main peak in the last cycle shows two peak shoulders. According to the spectra measured, these belong to Au and Au (see Figure S2I in Supplementary Materials). Au is present in trace amounts and elutes too close to Au to allow for separation. In contrast, the shoulder formed by Au appears contradictory, since this is retained strongly enough to be separated from Au already in the first cycle.
Gritti [40] mentions that peaks of strongly retained species can appear in late cycles of AP. He termed this appositely as ‘peak echo’. This can occur if strongly retained species elute only after several cycles. It is, however, not the reason for the peaks of Au observed here in cycles 2, 4, 5 and 6. As seen in Figure 7, Au enters into column B during cycle 1 and starts eluting from that column at 20 min., before the end of cycle 2. A proportion of Au is thereby sent to column A. Considering the retention time of Au (see Table 1), this part will elute from column A at about (20 + 10.6 = 30.6) min, which is during the next cycle (cycle 4; configuration B–D–A).
Thus, it leaves the process unnoticed. The Au peak after column B in cycle 4 (at 31 min) has a different origin. Cycle 3 starts while Au is being transferred from column B to column A. The switching in this particular moment relocates most of the system’s peripheral volume (the detector and some tubing) from the outlet of column B to its inlet. Thereby, the contained Au is recycled into the same column. The positions of the Au peak in the later cycles 4 through 6 are then consistent with the retention times of this carry-over of Au. While in cycle 5, Au is hidden under the peak of Au, and it elutes late enough in the last cycle to form the observed shoulder.
Problems with strongly retained components can be resolved, for example, by integrating gradient-based cycles into the process to shave off early and late impurities [40,48]. However, in our case, a simple adjustment of the switching strategy is sufficient to resolve the observed problem. For this, the first cycle is shortened such that it ends right after the transfer of the target peak onto the next column. By this, the stronger retained species, including Au, are kept in column A, from where they leave the process in cycle 2.
Figure 8 shows a corresponding experiment. In comparison to Figure 7, the first cycle was shortened to 10.0 min, while the other switching times were kept identical. As can be seen in Figure 8, this prevents the transfer of Au. The resulting longer cycle 2 leads to re-centering the target peak of Au; simultaneously, it provides more time for eluting the strongly retained impurities from column A. Overall, a better purification of Au is achieved, and Au is eliminated from the target peak.
Separation between Au and Au is, as expected, not achieved. The two small peaks marked by the asterisk (*) are assumed to have their origin in the switching of dead volumes during the transfer of impurities. This is similar to the previous example; however, the two peaks originate here from the switch after the first cycle. The difference of their positions in cycles 3 and 4 fits the retention time of Au. However, concentrations are too low to attribute them to any component. In fact, only in the first cycle, could Au be identified based on its spectrum, underlining a successful purification.
The examples above demonstrate that single Au nanoclusters can be obtained by alternate pumping from complex matrices. This is somewhat easier for the larger clusters Au and Au than for Au, where the achievable purity is limited due to trace amounts of the closely eluting Au. From a practical perspective, care must be taken in the experimental design, since, during switching, certain amounts of undesired components may be recycled present in the system’s peripherial volume. Such detrimental effects can be limited by adapting the switching strategy.
4.2.3. Isolation of Trace Compounds
A relevant application of alternate pumping is to isolate trace components from mixtures. As an example, we aimed here at isolating Au, which is present in the mixture in a small amount only.
Since Au is not resolved as an identifiable peak in conventional isocratic runs (see Figure 3), the process was designed such that two consecutive AP experiments were performed. For a first run, the retention time was approximated from the position in Figure 3 where the spectrum was allocated to Au. Although this did not lead to sufficient centering of the Au peak, the resolution was sufficient over several cycles (similar as in Figure 7 and Figure 8) to deduce its retention times on the individual columns, thereby, allowing us to adjust the switching times.
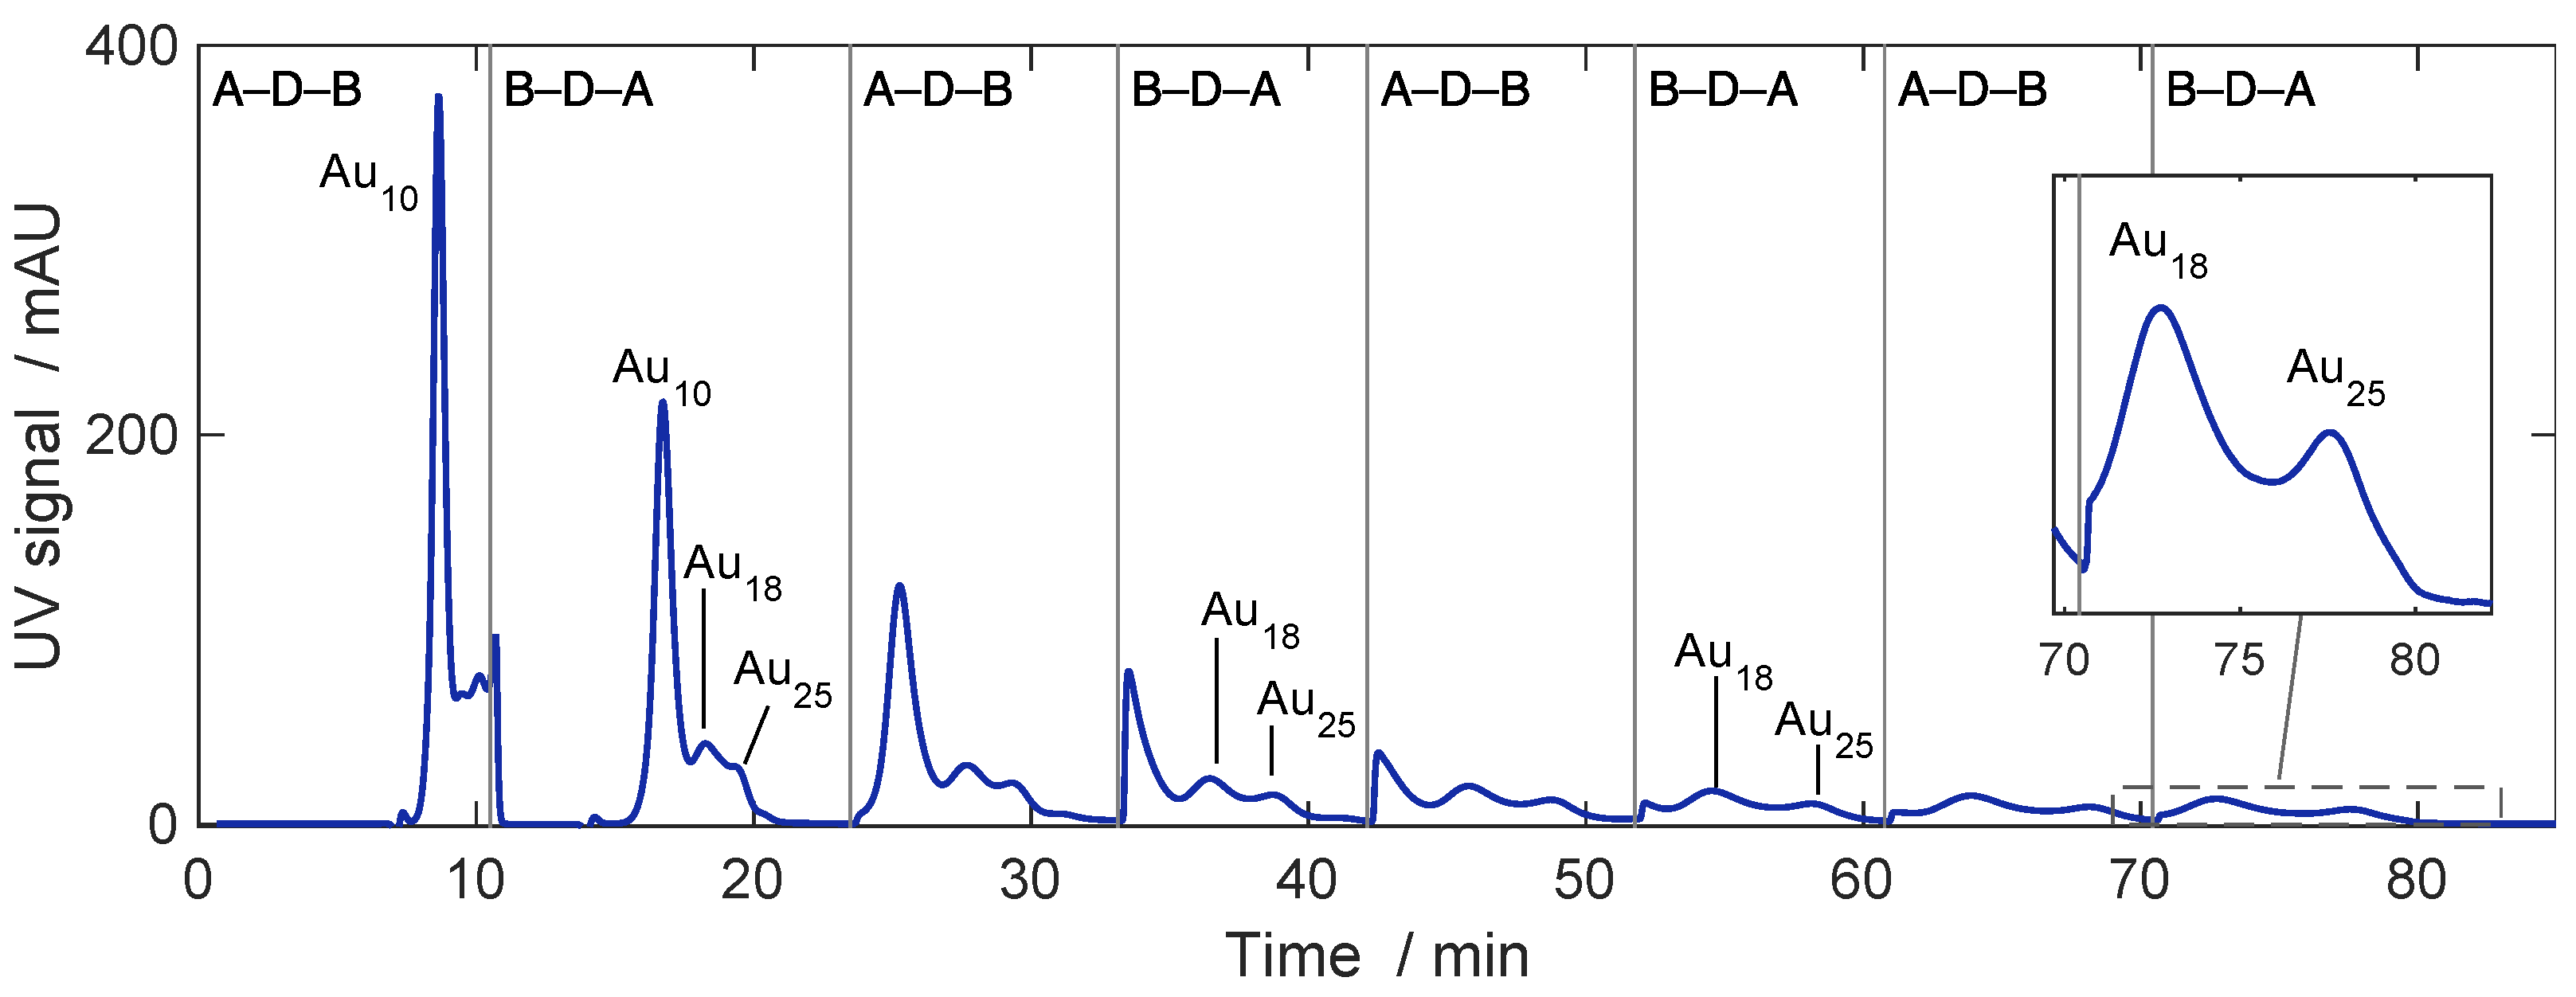
The result is shown in Figure 9. As in the previous example, a short first cycle followed by a longer second one were applied, by which the late eluting impurities, including Au and Au, were mostly already cleaved off in the first cycle. However, a small amount of Au remained in the system as the only detectable impurity. No complete separation between Au and Au was achieved in the last cycle, despite that the separation factor between the two is, with , not particularly low.
The challenge in this case is clearly that Au is present in much larger amounts than Au. Furthermore, in the last cycles, the band of Au hits the boundaries of the elution windows leading to a loss of this compound that further decreases its peak height. From this, it becomes clear that performing a large number of cycles requires choosing switching times extremely accurately. When considering typical experimental inaccuracies, column ageing, etc., at some point, this could be realized only using an online controller.
Given the difficulty of the problem, the separation achieved in Figure 9 is still impressive. However, it is clear that, under the given conditions, the feasibility limit is more or less reached. A better resolution will require higher column efficiency in terms of stage numbers and/or higher separation factors. This may be achieved by, for example, changing the operating conditions or improved process concepts—for example, a pre-fractionation by gradient chromatography as proposed in [40].
4.2.4. Separation of Larger Amounts
A particularly attractive application of alternate pumping would be to quantitatively isolate the AuNCs. To investigate the applicability of the process under preparative conditions, we performed AP experiments for significantly larger injection concentrations.
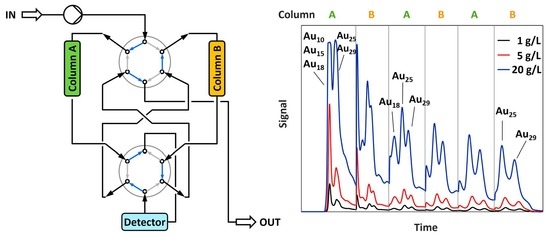
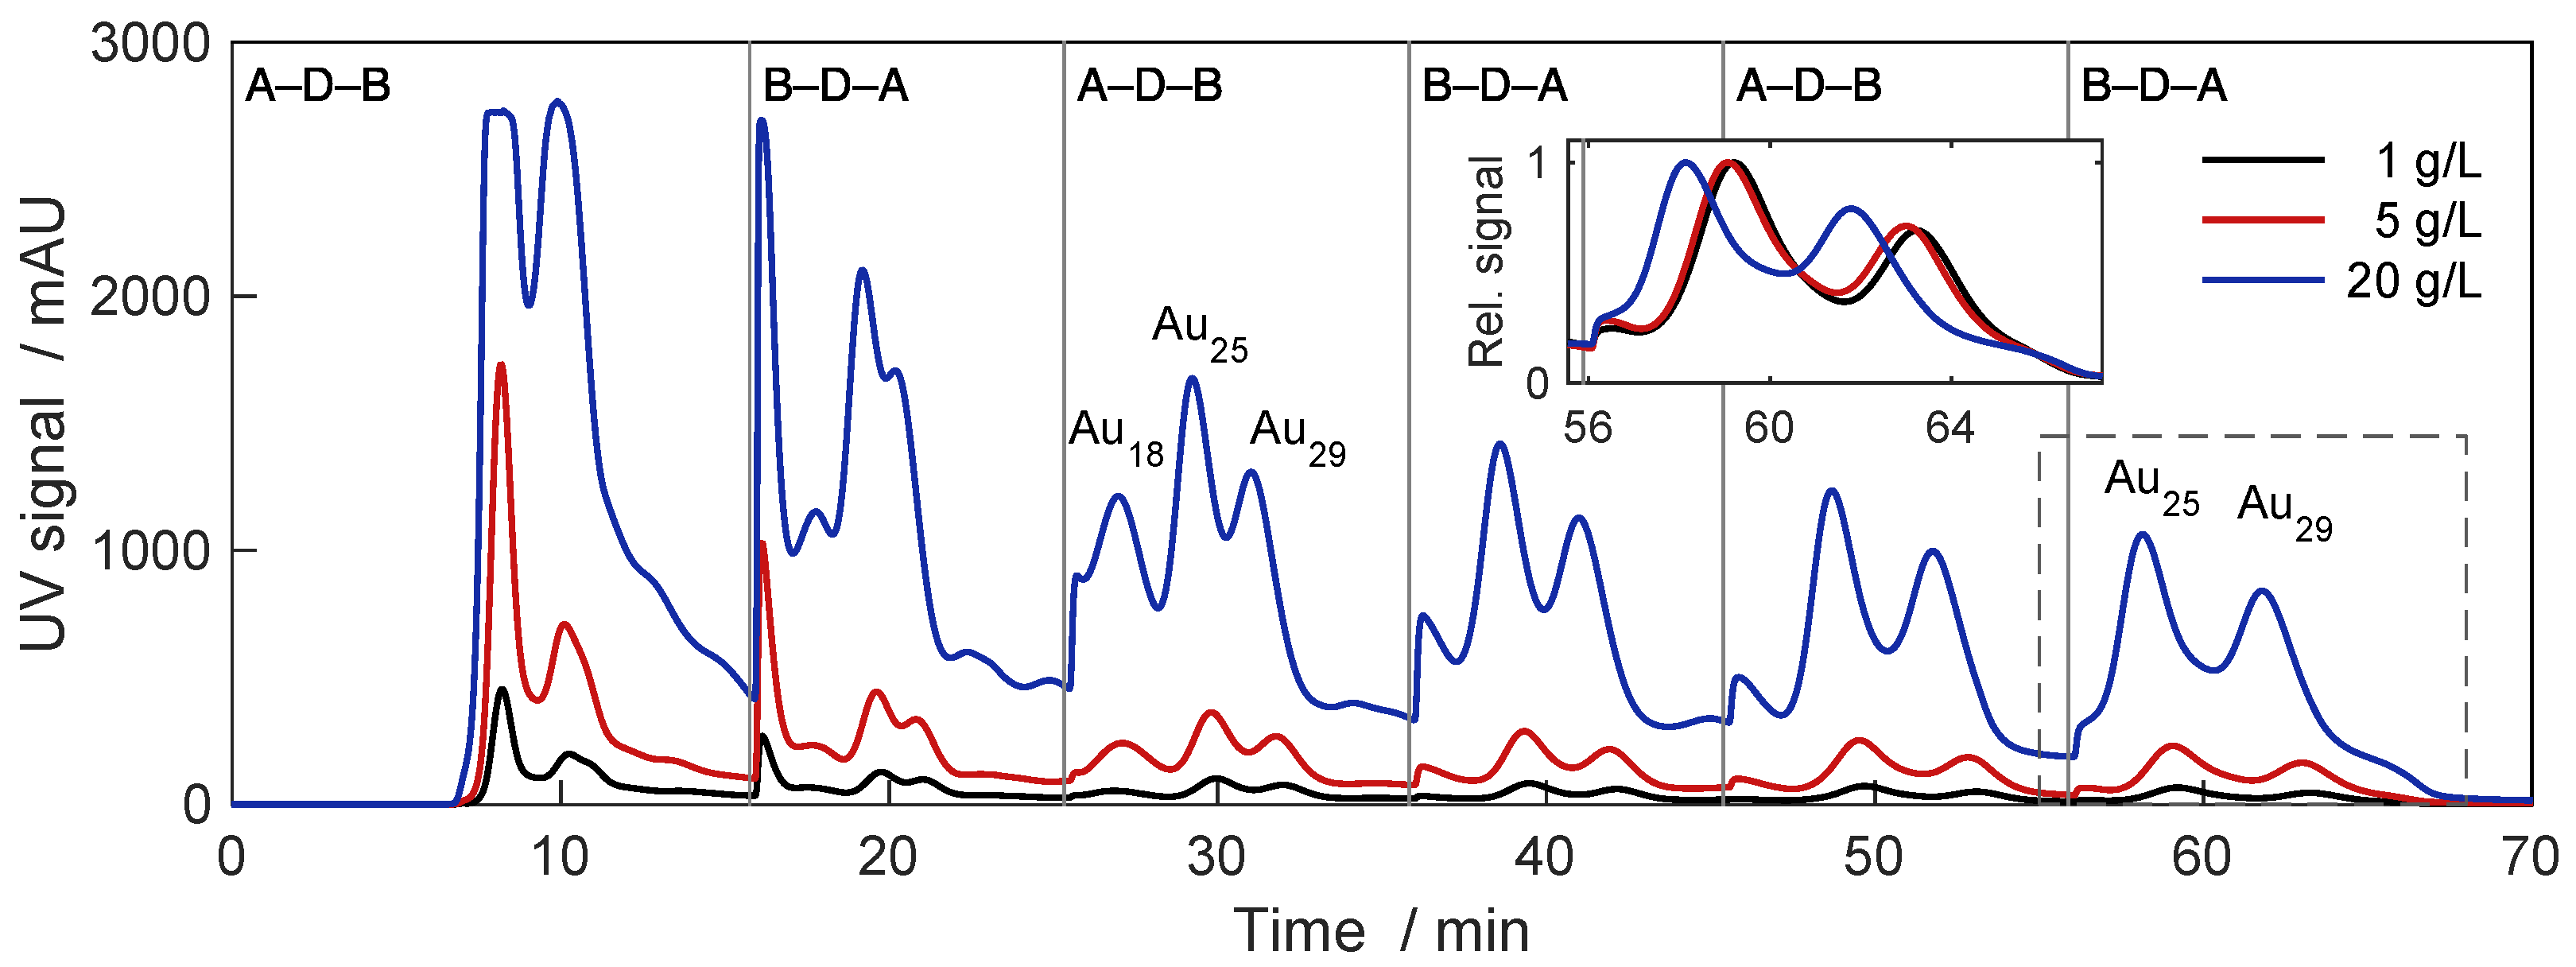
In a first step, we repeated the experiments for the simultaneous separation of Au and Au in Figure 6 using injection concentrations of 1, 5 and 20 g/L. The use of freshly prepared solvent caused slightly reduced retention times; in comparison to the data in Section 4.2.1, min and min instead of 10.97 and 10.03 min, respectively. The switching times were adjusted accordingly. The results in Figure 10 show the expected scaling of the signals (note that, for the highest injection concentration, the detector reaches its maximum value in the first cycles). The figure reveals that, for all injected concentrations, the achieved separation is very good.
Moreover, the normalized signals for the last cycle (see inset) show that, even for the highest injection concentration, the peak symmetry and extent of separation are affected only slightly. However, the retention times are shifted to lower values with increasing concentrations, indicating slightly nonlinear, ‘favorable’ sorption equilibria. In the last cycle of the experiment with 20 g/L, the peak of Au touches the left boundary of the elution window. Thus, if larger amounts should be separated, preventing the loss of product will require a corresponding design method accounting for nonlinear conditions. Finally, fractions were taken around the two peak maxima of the last cycle and analyzed by gradient runs.
The signals were too low for the quantitative evaluation or identification of spectra. However, the results indicate that the peak of Au was essentially free of Au but contained trace amounts of two species assumed to be Au and Au. The peak of Au contained trace amounts of the same species but also a remainder of Au. Thus, while the separation is considered very good, complete separation of all clusters cannot be claimed.
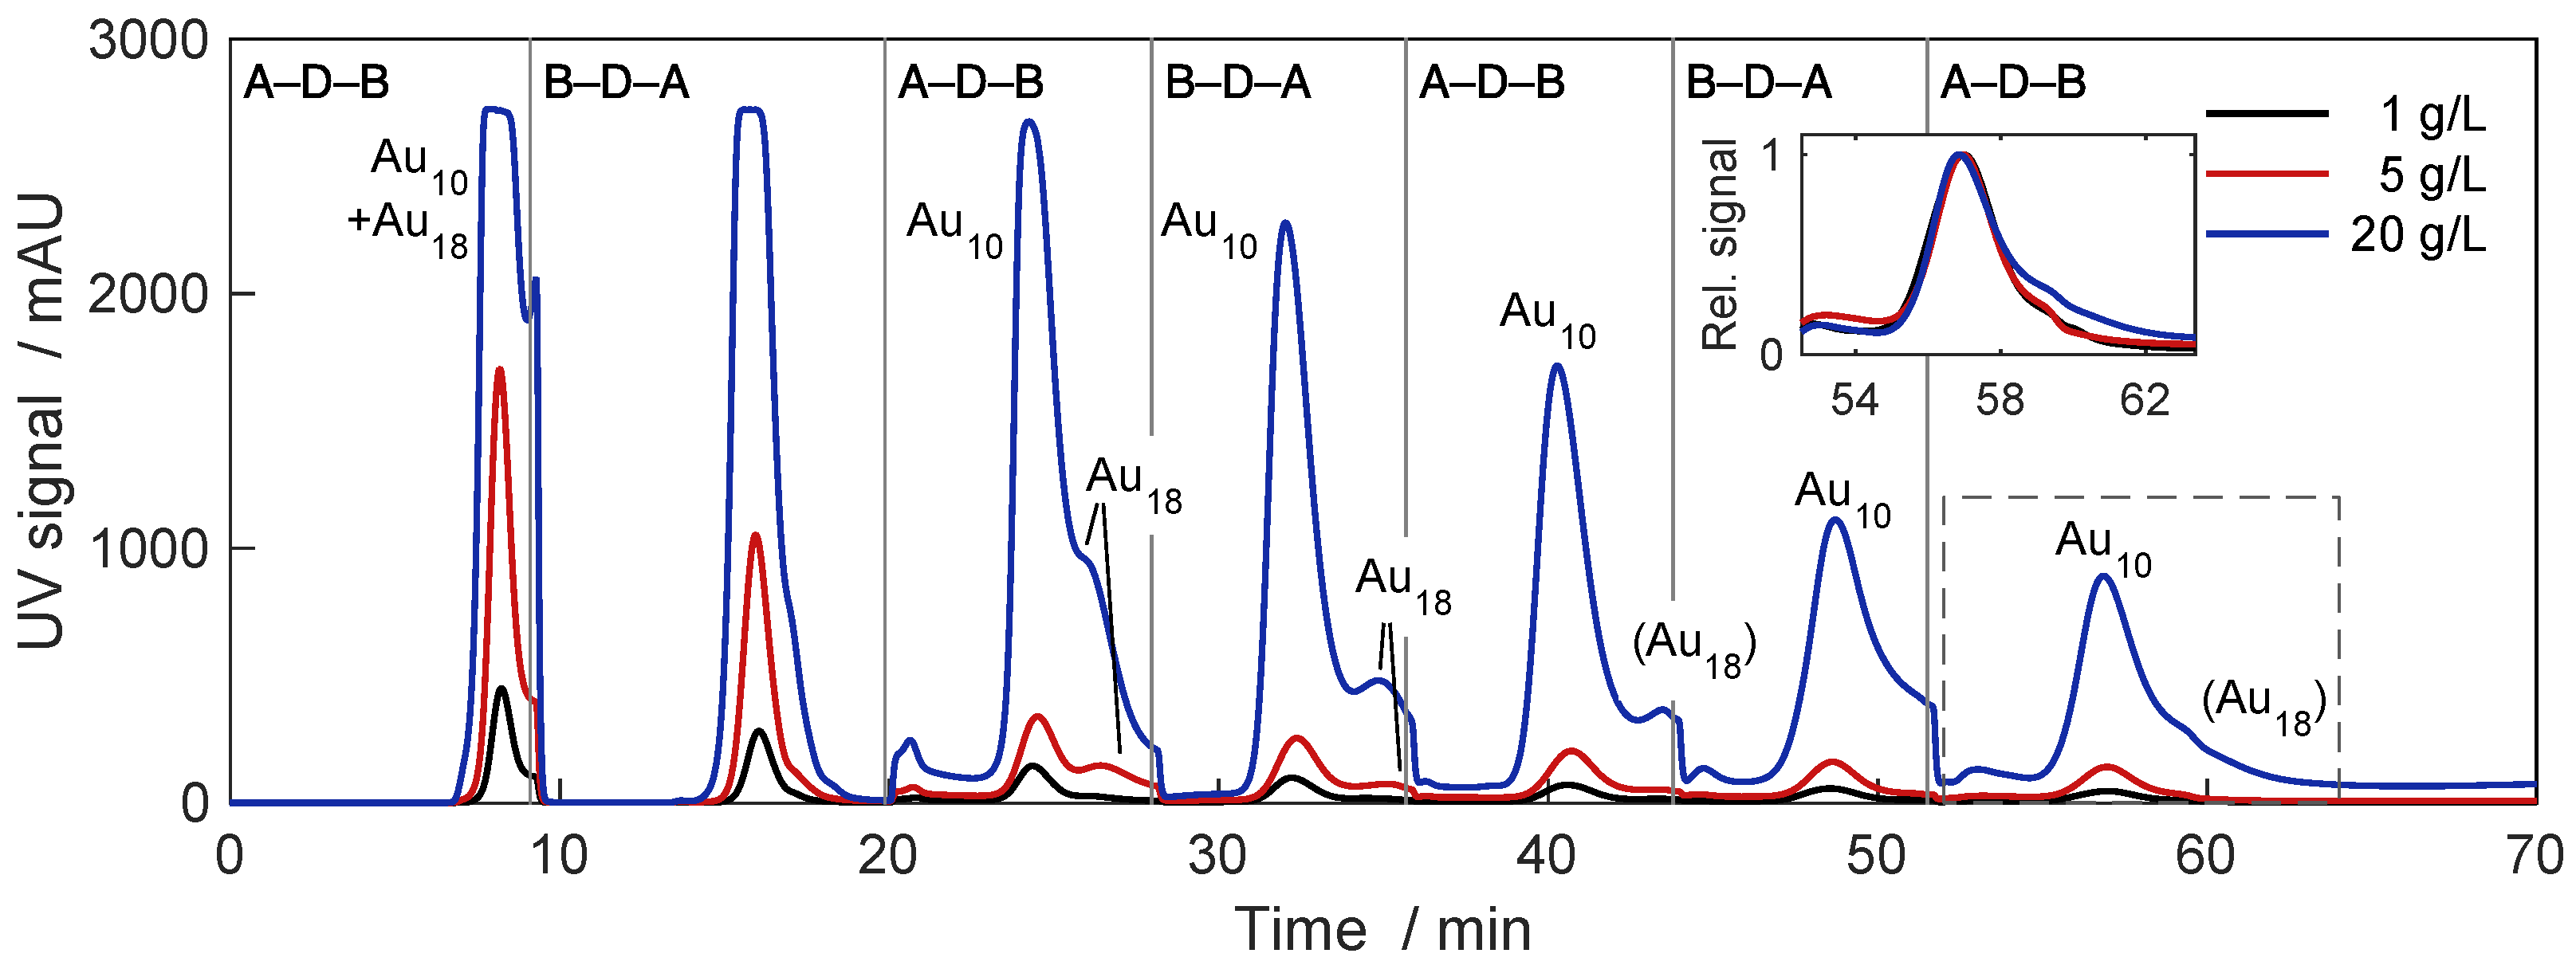
Figure 11 shows a corresponding study for the isolation of the single cluster of Au. Except for the higher injection concentrations, the conditions were analogous to those in Figure 8. Again, the switching times were adjusted to consider the shifted retention times. While, in the previous example, slight differences of peak shapes and retention times were observed, they are here almost unaffected (see inset). Only the tail of the peak for 20 g/L indicates the presence of a larger amount of impurities.
The constant retention time of Au indicates that the sorption is still in the linear range and that the separation of even larger amounts should be possible at these conditions. Finally, it should be noted that the adapted design method used in Section 4.2.2 (see Figure 8) also provided here a complete removal of Au. This was confirmed also by gradient analysis of a fraction of the last peak, which indicated the presence of small amounts of presumably Au and Au only.
The above results underline that alternate pumping is an attractive technology for producing nanoparticulate materials in unprecedented purity even from complex synthesis mixtures. The high resolution efficiency, in particular in conjunction with the high capacity of ion exchange columns and the use of water as a green solvent, make this a very promising approach with respect to future scale-up and industrial productions of nanoparticles with high quality.
5. Summary and Conclusions
For the first time, alternate pumping was applied successfully for the simultaneous isolation and purification of nanoparticulate materials from synthesized mixtures using interaction-based chromatography. As an example problem, atomically precise glutathione-stabilized Au nanoclusters were separated by anion exchange chromatography. A simple design procedure suggested that is also applicable when using columns with different retention behaviors.
The feasibility of the approach was demonstrated in several experimental studies. In the first step, two nanoclusters of different sizes, namely Au and Au, were isolated simultaneously from the mixture with good reproducibility. The purification of the investigated single Au cluster was found to be more difficult. Separation from the closely eluting Au was not possible under the chosen conditions. The occurrence of the more strongly retained cluster Au in the product peak could be eliminated by a modified design procedure. In a third example, Au, a trace compound in the mixture, was purified successfully. Complete separation from Au was, however, not achieved. Under the chosen conditions, band broadening in particular limits the process performance.
Finally, the applicability for preparative separations was evaluated by performing alternate pumping experiments with injection concentrations up to 20 g/L. Again, the simultaneous isolation of Au and Au and the purification of Au were considered. Even for the highest injection amounts, remarkable separation was achieved. The retention behavior remained largely linear in the whole range of conditions, allowing not only for simple design but also indicating that larger amounts may be separated. The development of corresponding preparative-scale applications would benefit from design methods that account for nonlinear sorption equilibria as well as from suitable process analytical techniques based on, for example, on-line mass spectrometry.
The obtained results underline that alternate pumping chromatography, specifically on the basis of interaction-based chromatography, has great potential for achieving highly precise separations of nanoparticulate products at a preparative scale.
Supplementary Materials
The following supporting information can be downloaded at: https://www.mdpi.com/article/10.3390/separations10030214/s1.
Author Contributions
Conceptualization, W.P. and M.K.; Data curation, M.S., V.B., L.G. and M.K.; Formal analysis, M.S. and M.K.; Investigation, M.S., V.B. and L.G.; Methodology, M.S., V.B., L.G., W.P. and M.K.; Resources, W.P. and M.K.; Validation, M.S.; Writing—original draft, M.S., L.G. and M.K.; Writing—review and editing, M.S., V.B., L.G., W.P. and M.K. All authors have read and agreed to the published version of the manuscript.
Funding
This work was funded by the Deutsche Forschungsgemeinschaft (DFG, German Research Foundation)—Project-ID 416229255—SFB 1411.
Data Availability Statement
Not applicable.
Acknowledgments
The authors are grateful to Christian Lübbert for the support regarding ESI/MS analysis.
Conflicts of Interest
The authors declare no conflict of interest.
References
- Guiochon, G.; Shirazi, D.G.; Felinger, A.; Katti, A.M. Fundamentals of Preparative and Nonlinear Chromatography, 2nd ed.; Academic Press: Boston, MA, USA, 2006. [Google Scholar]
- Fischer, C.H.; Giersig, M.; Siebrands, T. Analysis of colloidal particles V. Size-exclusion chromatography of colloidal semiconductor particles. J. Chromatogr. A 1994, 670, 89–97. [Google Scholar] [CrossRef]
- Wei, G.T.; Liu, F.K. Separation of nanometer gold particles by size exclusion chromatography. J. Chromatogr. A 1999, 836, 253–260. [Google Scholar] [CrossRef]
- Wei, G.T.; Liu, F.K.; Wang, C.R.C. Shape Separation of Nanometer Gold Particles by Size-Exclusion Chromatography. Anal. Chem. 1999, 71, 2085–2091. [Google Scholar] [CrossRef]
- Süß, S.; Metzger, C.; Damm, C.; Segets, D.; Peukert, W. Quantitative evaluation of nanoparticle classification by size-exclusion chromatography. Powder Technol. 2018, 339, 264–272. [Google Scholar] [CrossRef]
- Gromotka, L.; Uttinger, M.J.; Schlumberger, C.; Thommes, M.; Peukert, W. Classification and characterization of multimodal nanoparticle size distributions by size-exclusion chromatography. Nanoscale 2022, 14, 17354–17364. [Google Scholar] [CrossRef]
- Süß, S.; Bartsch, K.; Wasmus, C.; Damm, C.; Segets, D.; Peukert, W. Chromatographic property classification of narrowly distributed ZnS quantum dots. Nanoscale 2020, 12, 12114–12125. [Google Scholar] [CrossRef]
- Fischer, C.H. Analysis of Colloids. VI. Semiconductor Colloids of High Monodispersity by Preparative Size Exclusion Chromatography. J. Liq. Chromatogr. 1994, 17, 3593–3611. [Google Scholar] [CrossRef]
- Pitkänen, L.; Striegel, A.M. Size-exclusion chromatography of metal nanoparticles and quantum dots. Trends Anal. Chem. 2016, 80, 311–320. [Google Scholar] [CrossRef] [Green Version]
- Peukert, W.; Kaspereit, M.; Hofe, T.; Gromotka, L. Size exclusion chromatography (SEC). In Particle Separation Techniques; Handbooks in Separation Science; Contado, C., Ed.; Elsevier: Amsterdam, The Netherlands, 2022; pp. 409–447. [Google Scholar] [CrossRef]
- Bos, W.; Steggerda, J.J.; Yan, S.; Casalnuovo, J.A.; Mueting, A.M.; Pignolet, L.H. Separation of cationic metal cluster compounds by reversed phase HPLC. Inorg. Chem. 1988, 27, 948–951. [Google Scholar] [CrossRef]
- Liu, F.K.; Chang, Y.C. Using reversed-phase liquid chromatography to monitor the sizes of Au/Pt core/shell nanoparticles. J. Chromatogr. A 2010, 1217, 1647–1653. [Google Scholar] [CrossRef]
- Yang, Y.; Luo, L.; Li, H.P.; Wang, Q.; Yang, Z.G.; Qu, Z.P.; Ding, R. Analysis of metallic nanoparticles and their ionic counterparts in complex matrix by reversed-phase liquid chromatography coupled to ICP-MS. Talanta 2018, 182, 156–163. [Google Scholar] [CrossRef]
- Niihori, Y.; Uchida, C.; Kurashige, W.; Negishi, Y. High-resolution separation of thiolate-protected gold clusters by reversed-phase high-performance liquid chromatography. Phys. Chem. Chem. Phys. 2016, 18, 4251–4265. [Google Scholar] [CrossRef]
- Black, D.M.; Bhattarai, N.; Bach, S.B.H.; Whetten, R.L. Selection and Identification of Molecular Gold Clusters at the Nano(gram) Scale: Reversed Phase HPLC–ESI–MS of a Mixture of Au-Peth MPCs. J. Phys. Chem. Lett. 2016, 7, 3199–3205. [Google Scholar] [CrossRef] [PubMed]
- Choi, M.M.F.; Douglas, A.D.; Murray, R.W. Ion-Pair Chromatographic Separation of Water-Soluble Gold Monolayer-Protected Clusters. Anal. Chem. 2006, 78, 2779–2785. [Google Scholar] [CrossRef] [PubMed]
- Black, D.M.; Alvarez, M.M.; Yan, F.; Griffith, W.P.; Plascencia-Villa, G.; Bach, S.B.H.; Whetten, R.L. Triethylamine Solution for the Intractability of Aqueous Gold–Thiolate Cluster Anions: How Ion Pairing Enhances ESI-MS and HPLC of aq-Aun(pMBA)p. J. Phys. Chem. C 2017, 121, 10851–10857. [Google Scholar] [CrossRef]
- Niihori, Y.; Kikuchi, Y.; Shima, D.; Uchida, C.; Sharma, S.; Hossain, S.; Kurashige, W.; Negishi, Y. Separation of Glutathionate-Protected Gold Clusters by Reversed-Phase Ion-Pair High-Performance Liquid Chromatography. Ind. Eng. Chem. Res. 2017, 56, 1029–1035. [Google Scholar] [CrossRef]
- Niihori, Y.; Shima, D.; Yoshida, K.; Hamada, K.; Nair, L.V.; Hossain, S.; Kurashige, W.; Negishi, Y. High-performance liquid chromatography mass spectrometry of gold and alloy clusters protected by hydrophilic thiolates. Nanoscale 2018, 10, 1641–1649. [Google Scholar] [CrossRef]
- Gromotka, L.; Lübbert, C.; Traoré, N.; Peukert, W. Green and scalable fractionation of gold nanoclusters by anion exchange chromatography. ACS Appl. Nano Mater. 2023. Submitted. [Google Scholar]
- Nicoud, R.M. Chromatographic Processes: Modeling, Simulation, and Design; Cambridge Series in Chemical Engineering; Cambridge University Press: Cambridge, UK, 2015. [Google Scholar] [CrossRef] [Green Version]
- Schmidt-Traub, H.; Schulte, M.; Seidel-Morgenstern, A. (Eds.) Preparative Chromatography, 3rd ed.; Wiley: Hoboken, NJ, USA, 2020. [Google Scholar] [CrossRef]
- Kaspereit, M. Chapter—Advanced operating concepts for Simulated Moving Bed Processes. In Advances in Chromatography; CRC Press/Taylor & Francis: Boca Raton, FL, USA, 2009; pp. 165–192. [Google Scholar]
- Satzer, P.; Wellhoefer, M.; Jungbauer, A. Continuous separation of protein loaded nanoparticles by simulated moving bed chromatography. J. Chromatogr. A 2014, 1349, 44–49. [Google Scholar] [CrossRef] [Green Version]
- Arlt, C.R.; Brekel, D.; Neumann, S.; Rafaja, D.; Franzreb, M. Continuous size fractionation of magnetic nanoparticles by using simulated moving bed chromatography. Front. Chem. Sci. Eng. 2021, 15, 1346–1355. [Google Scholar] [CrossRef]
- Porter, R.S.; Johnson, J.F. Circular Gas Chromatograph. Nature 1959, 183, 391–392. [Google Scholar] [CrossRef]
- Bombaugh, K.J.; Levangie, R.F. High Resolution Gel Permeation Chromatography-Using Recycle. Sep. Sci. 1970, 5, 751–763. [Google Scholar] [CrossRef]
- Dingenen, J.; Kinkel, J. Preparative chromatographic resolution of racemates on chiral stationary phases on laboratory and production scales by closed-loop recycling chromatography. J. Chromatogr. A 1994, 666, 627–650. [Google Scholar] [CrossRef]
- Heuer, C.; Seidel-Morgenstern, A.; Hugo, P. Experimental investigation and modelling of closed-loop recycling in preparative chromatography. Chem. Eng. Sci. 1995, 50, 1115–1127. [Google Scholar] [CrossRef]
- Seidel-Morgenstern, A.; Guiochon, G. Theoretical Study of Recycling in Preparative Chromatography. AIChE J. 1993, 39, 809–819. [Google Scholar] [CrossRef]
- Porath, J.O.; Bennich, H. Recycling chromatography. Arch. Biochem. Biophys. 1962, 1, 152–156. [Google Scholar]
- Duvdevani, I.; Biesenberger, J.A.; Tan, M. Recycle gel permeation chromatography. III. Design modifications and some results with polycarbonate. J. Polym. Sci. Part B Polym. Lett. 1971, 9, 429–434. [Google Scholar] [CrossRef]
- Henry, R.A.; Byrne, S.H.; Hudson, D.R. High Speed Recycle Chromatography Using an Alternate Pumping Principle. J. Chromatogr. Sci. 1974, 12, 197–199. [Google Scholar] [CrossRef]
- Liu, Q.; Xiao, J.; Yu, J.; Xie, Y.; Chen, X.; Yang, H. Improved enantioseparation via the twin-column based recycling high performance liquid chromatography. J. Chromatogr. A 2014, 1363, 236–241. [Google Scholar] [CrossRef]
- Gritti, F.; Cormier, S.; Morris, R.; Riley, F.; Yan, Q. Ultrahigh Resolution Semipreparative Liquid Chromatography: Application to Structure Elucidation of Drug Impurities; LC-GC Europe: Chester, UK, 2019; pp. 62–70. [Google Scholar]
- Chen, Y.; Wang, Z.; Zhang, H.; Liu, Y.; Zhang, S.; Meng, Q.; Liu, W. Isolation of High Purity Anthocyanin Monomers from Red Cabbage with Recycling Preparative Liquid Chromatography and Their Photostability. Molecules 2018, 23, 991. [Google Scholar] [CrossRef] [Green Version]
- Gritti, F.; Cormier, S. Performance optimization of ultra high-resolution recycling liquid chromatography. J. Chromatogr. A 2018, 1532, 74–88. [Google Scholar] [CrossRef]
- Wei, F.; Yang, Z.; Zhao, Y.; Wang, Q. A twin-column recycling chromatography with solvent gradient for reinforcing the isolation of minor impurities. AIChE J. 2019, 65, 702–711. [Google Scholar] [CrossRef]
- Wei, F.; Sang, J.; Zhao, Y. Theoretical study of twin-column recycling chromatography with a solvent-gradient for preparative binary separations. J. Chromatogr. A 2021, 1651, 462306. [Google Scholar] [CrossRef]
- Gritti, F. Rebirth of recycling liquid chromatography with modern chromatographic columns: Extension to gradient elution. J. Chromatogr. A 2021, 1653, 462424. [Google Scholar] [CrossRef]
- Al-Somali, A.M.; Krueger, K.M.; Falkner, J.C.; Colvin, V.L. Recycling Size Exclusion Chromatography for the Analysis and Separation of Nanocrystalline Gold. Anal. Chem. 2004, 76, 5903–5910. [Google Scholar] [CrossRef]
- Qian, H.; Zhu, M.; Wu, Z.; Jin, R. Quantum Sized Gold Nanoclusters with Atomic Precision. Acc. Chem. Res. 2012, 45, 1470–1479. [Google Scholar] [CrossRef]
- Zheng, J.; Zhang, J.; Lu, F.; Du, Y.; Cao, D.; Hu, S.; Yang, Y.; Yuan, Z. Visualization of Polymer–Surfactant Interaction by Dual-Emissive Gold Nanocluster Labeling. Biosensors 2022, 12, 686. [Google Scholar] [CrossRef] [PubMed]
- Zhang, J.; Liu, Y.; Liu, Y.; Liu, W.; Lu, F.; Yuan, Z.; Lu, C. Gold Nanocluster-Encapsulated Hyperbranched Polyethyleneimine for Selective and Ratiometric Dopamine Analyses by Enhanced Self-Polymerization. Front. Chem. 2022, 10, 928607. [Google Scholar] [CrossRef]
- Seong, H.; Efremov, V.; Park, G.; Kim, H.; Yoo, J.S.; Lee, D. Atomically Precise Gold Nanoclusters as Model Catalysts for Identifying Active Sites for Electroreduction of CO2. Angew. Chem. Int. Ed. 2021, 60, 14563–14570. [Google Scholar] [CrossRef] [PubMed]
- Sonia, K.; Kukreti, S.; Kaushik, M. Gold nanoclusters: An ultrasmall platform for multifaceted applications. Talanta 2021, 234, 122623. [Google Scholar] [CrossRef]
- Kucera, P.; Manius, G. Recycling liquid chromatography using microbore columns. J. Chromatogr. A 1981, 219, 1–12. [Google Scholar] [CrossRef]
- Gritti, F. Automated High-Resolution Semi-Preparative Gradient Recycling Liquid Chromatography: Principles, Design, and Applications; LC-GC Europe: Chester, UK, 2021; pp. 455–461. [Google Scholar] [CrossRef]
Figure 1.
Schematic setup for alternate pumping chromatography as used in this work. Two switching valves (V1 and V2) are used to adjust the desired order of the columns (A and B) and the detector (D). The table lists the configurations that result from the different valve positions (indicated as “I” and “II” and by solid and dashed lines, respectively).

Figure 2.
Illustration of the isolation of a target compound (c) from a mixture with five components (a–e) within six AP cycles. Top row—outlet of column A, second row—outlet of column B, third row—profiles between both columns, and bottom—process outlet. Vertical lines mark the end of each cycle.
Figure 2.
Illustration of the isolation of a target compound (c) from a mixture with five components (a–e) within six AP cycles. Top row—outlet of column A, second row—outlet of column B, third row—profiles between both columns, and bottom—process outlet. Vertical lines mark the end of each cycle.

Figure 3.
Example chromatogram and identification of selected AuNCs. (left) Chromatogram for the injection of 80 L sample with 1 g/L, eluent with 725 mM NHAc and 20 mM BisTris, flow rate 0.4 mL/min, and 25 °C—column A. (right) Comparison of normalized UV-VIS spectra from [18] to spectra measured at the four different times marked in the inset on the left.

Figure 4.
Separation of the AuNCs at two different conditions. For better comparison, the UV signals were normalized to their maxima and, since different flow rates were used and plotted against the elution volume. Blue, solid line—725 mM NHAc and flow rate 0.4 mL/min (same chromatogram as in Figure 3 (left). Red, dash-dotted line—665 mM NHAc and flow rate 0.7 mL/min. All other conditions were as in Figure 3.

Figure 5.
Comparison of chromatograms for the two columns A and B under the same conditions as in Figure 3 (left).
Figure 5.
Comparison of chromatograms for the two columns A and B under the same conditions as in Figure 3 (left).

Figure 6.
Alternate pumping experiments for the simultaneous isolation and purification of the two clusters Au/Au. Injection of 80 L sample at 1 g/L. Four consecutive runs with six cycles each were performed at identical conditions. Each experiment was preceded by a regeneration step. For further experimental conditions, see Figure 3.

Figure 7.
Alternate pumping experiment with six cycles for the isolation of Au. The main peak in the final cycle contains not only the very closely eluting Au but also the stronger retained Au. The appearance of Au there as well as at 31 and 42 min is an ‘echo’ of its carry-over during the switch from cycle 2 to cycle 3 (see text). For chromatographic conditions, see Figure 3. For the identification of individual clusters, see Figure S2 in the SI.

Figure 8.
Alternate pumping experiment with seven cycles for the isolation of Au. In comparison to Figure 7, the design was adjusted by a shorter first cycle, which facilitated an essentially complete removal of Au. All other switching times were identical to those in Figure 7. The peak marked by (*) may represent a trace amount of Au but could not be identified due to its low concentration. For chromatographic conditions, see Figure 3.

Figure 9.
Alternate pumping experiment with eight cycles for the isolation of the trace component Au. As for the example in Figure 8, the switching strategy was adapted to remove late eluting impurities by a short first cycle followed by a longer second cycle. The cycle durations were 10.5, 12.975, 9.65, 9.0, 9.65, 9.0 and 9.65 min. For chromatographic conditions, see Figure 3.

Figure 10.
Alternate pumping experiments for the simultaneous isolation of Au and Au for increasing injection concentrations of 1, 5 and 20 g/L. The inset shows the normalized signals for the last cycle. Cycle durations: 15.75 min for the first cycle, followed by 9.57 min for configuration B–D–A and 10.5 min for configuration A–D–B. Other conditions analogous to Figure 6.

Figure 11.
Alternate pumping experiments for the isolation of Au for injection concentrations of 1, 5 and 20 g/L. The inset shows the normalized signals for the last cycle. Cycle durations: 9.1 min for cycle 1, 10.77 min for cycle 2, followed by 8.1 min for configuration A–D–B and 7.72 min for configuration B–D–A. Other conditions analogous to Figure 8.


Table 1.
Retention characteristics of the two columns for the chromatograms in Figure 5.
Table 1.
Retention characteristics of the two columns for the chromatograms in Figure 5.
| Peak | Column A | Column B | Difference/% | |||||
|---|---|---|---|---|---|---|---|---|
| Au | 8.37 | 0.613 | 1.701 1.135 | 7.88 | 0.579 | 1.657 1.104 | 5.5 | 2.6 |
| Au | 10.60 | 1.042 | 9.78 | 0.960 | 7.9 | 2.7 | ||
| Au | 11.33 | 1.183 | 10.28 | 0.1060 | 10.4 | |||
Disclaimer/Publisher’s Note: The statements, opinions and data contained in all publications are solely those of the individual author(s) and contributor(s) and not of MDPI and/or the editor(s). MDPI and/or the editor(s) disclaim responsibility for any injury to people or property resulting from any ideas, methods, instructions or products referred to in the content. |
© 2023 by the authors. Licensee MDPI, Basel, Switzerland. This article is an open access article distributed under the terms and conditions of the Creative Commons Attribution (CC BY) license (https://creativecommons.org/licenses/by/4.0/).
Share and Cite
MDPI and ACS Style
Supper, M.; Birner, V.; Gromotka, L.; Peukert, W.; Kaspereit, M. Isolation and Purification of Single Gold Nanoclusters by Alternate Pumping Chromatography. Separations 2023, 10, 214. https://doi.org/10.3390/separations10030214
AMA Style
Supper M, Birner V, Gromotka L, Peukert W, Kaspereit M. Isolation and Purification of Single Gold Nanoclusters by Alternate Pumping Chromatography. Separations. 2023; 10(3):214. https://doi.org/10.3390/separations10030214
Chicago/Turabian StyleSupper, Malvina, Virginia Birner, Lukas Gromotka, Wolfgang Peukert, and Malte Kaspereit. 2023. "Isolation and Purification of Single Gold Nanoclusters by Alternate Pumping Chromatography" Separations 10, no. 3: 214. https://doi.org/10.3390/separations10030214
Note that from the first issue of 2016, this journal uses article numbers instead of page numbers. See further details here.