
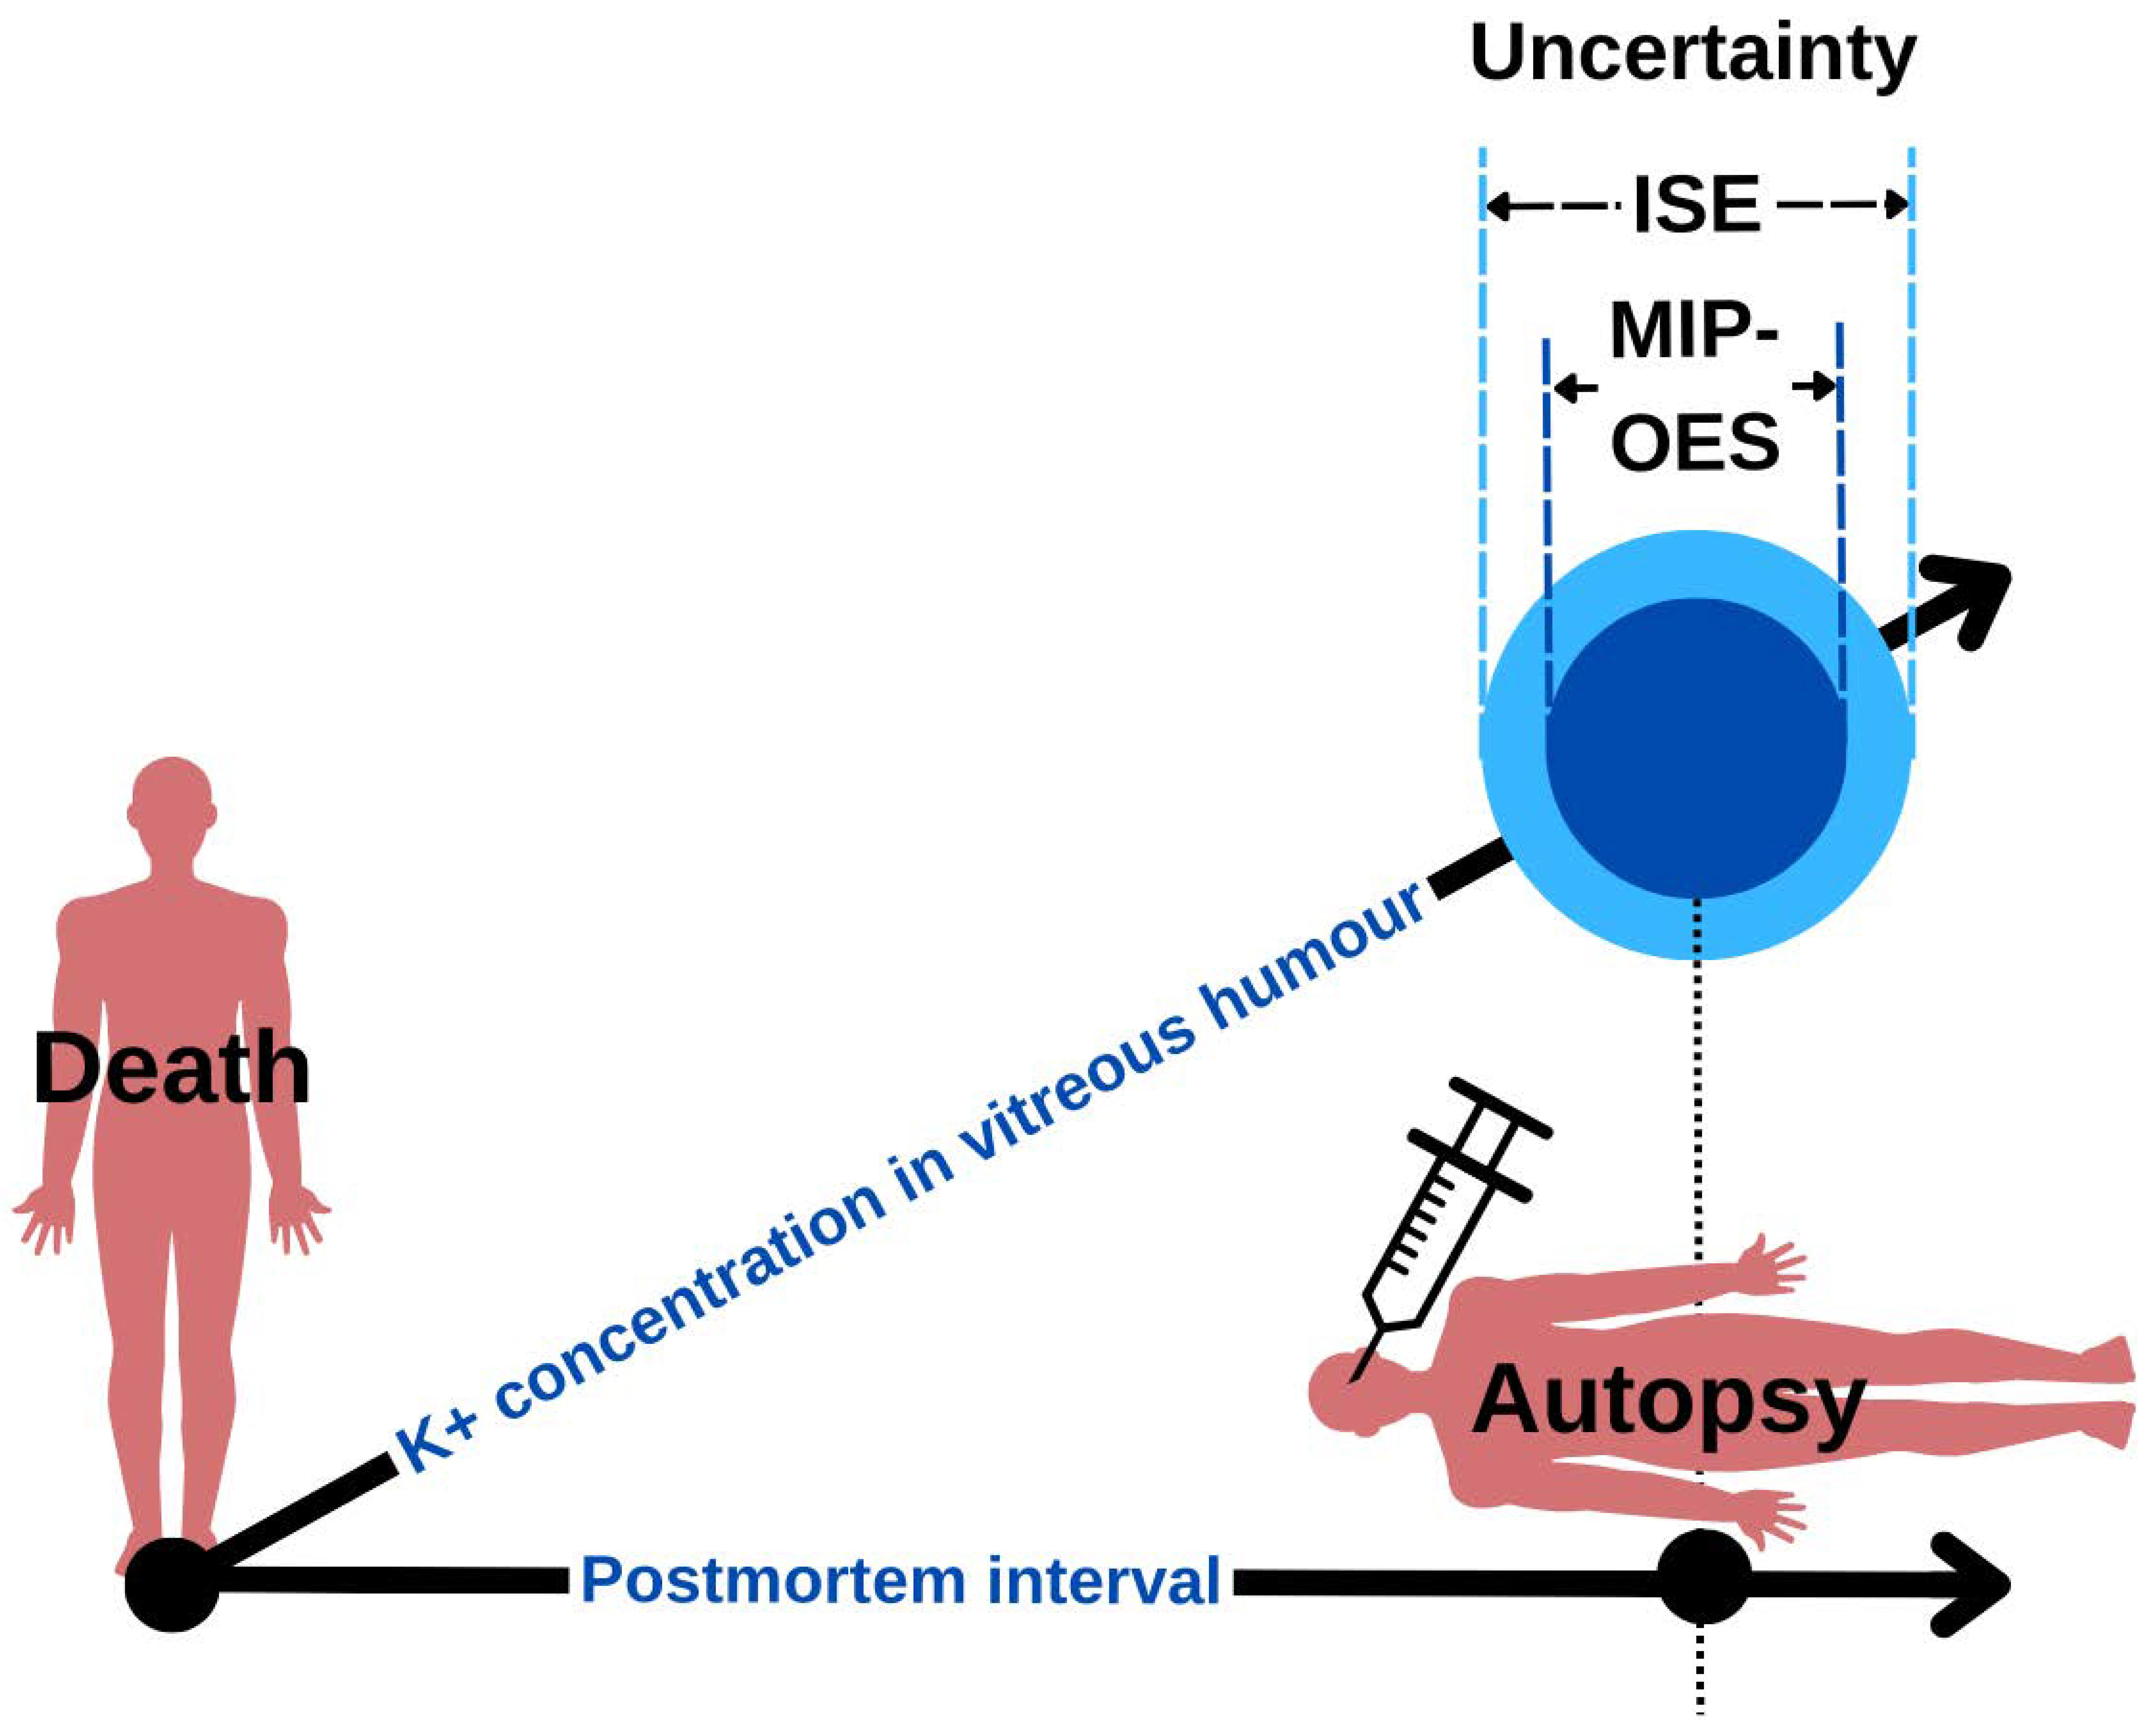
Uncertainty of Postmortem Time Estimation Based on Potassium Ion Determination in Vitreous Humor Using Potentiometric Ion-Selective Electrode and Microwave-Induced Plasma with Optical Emission Spectrometry Methods

 , , and
Abstract
:
1. Introduction
2. Materials and Methods
2.1. Sample Collection
2.2. VH Preparation
2.3. Instrumentation
3. Results
4. Discussion
4.1. Properties of Biological Material
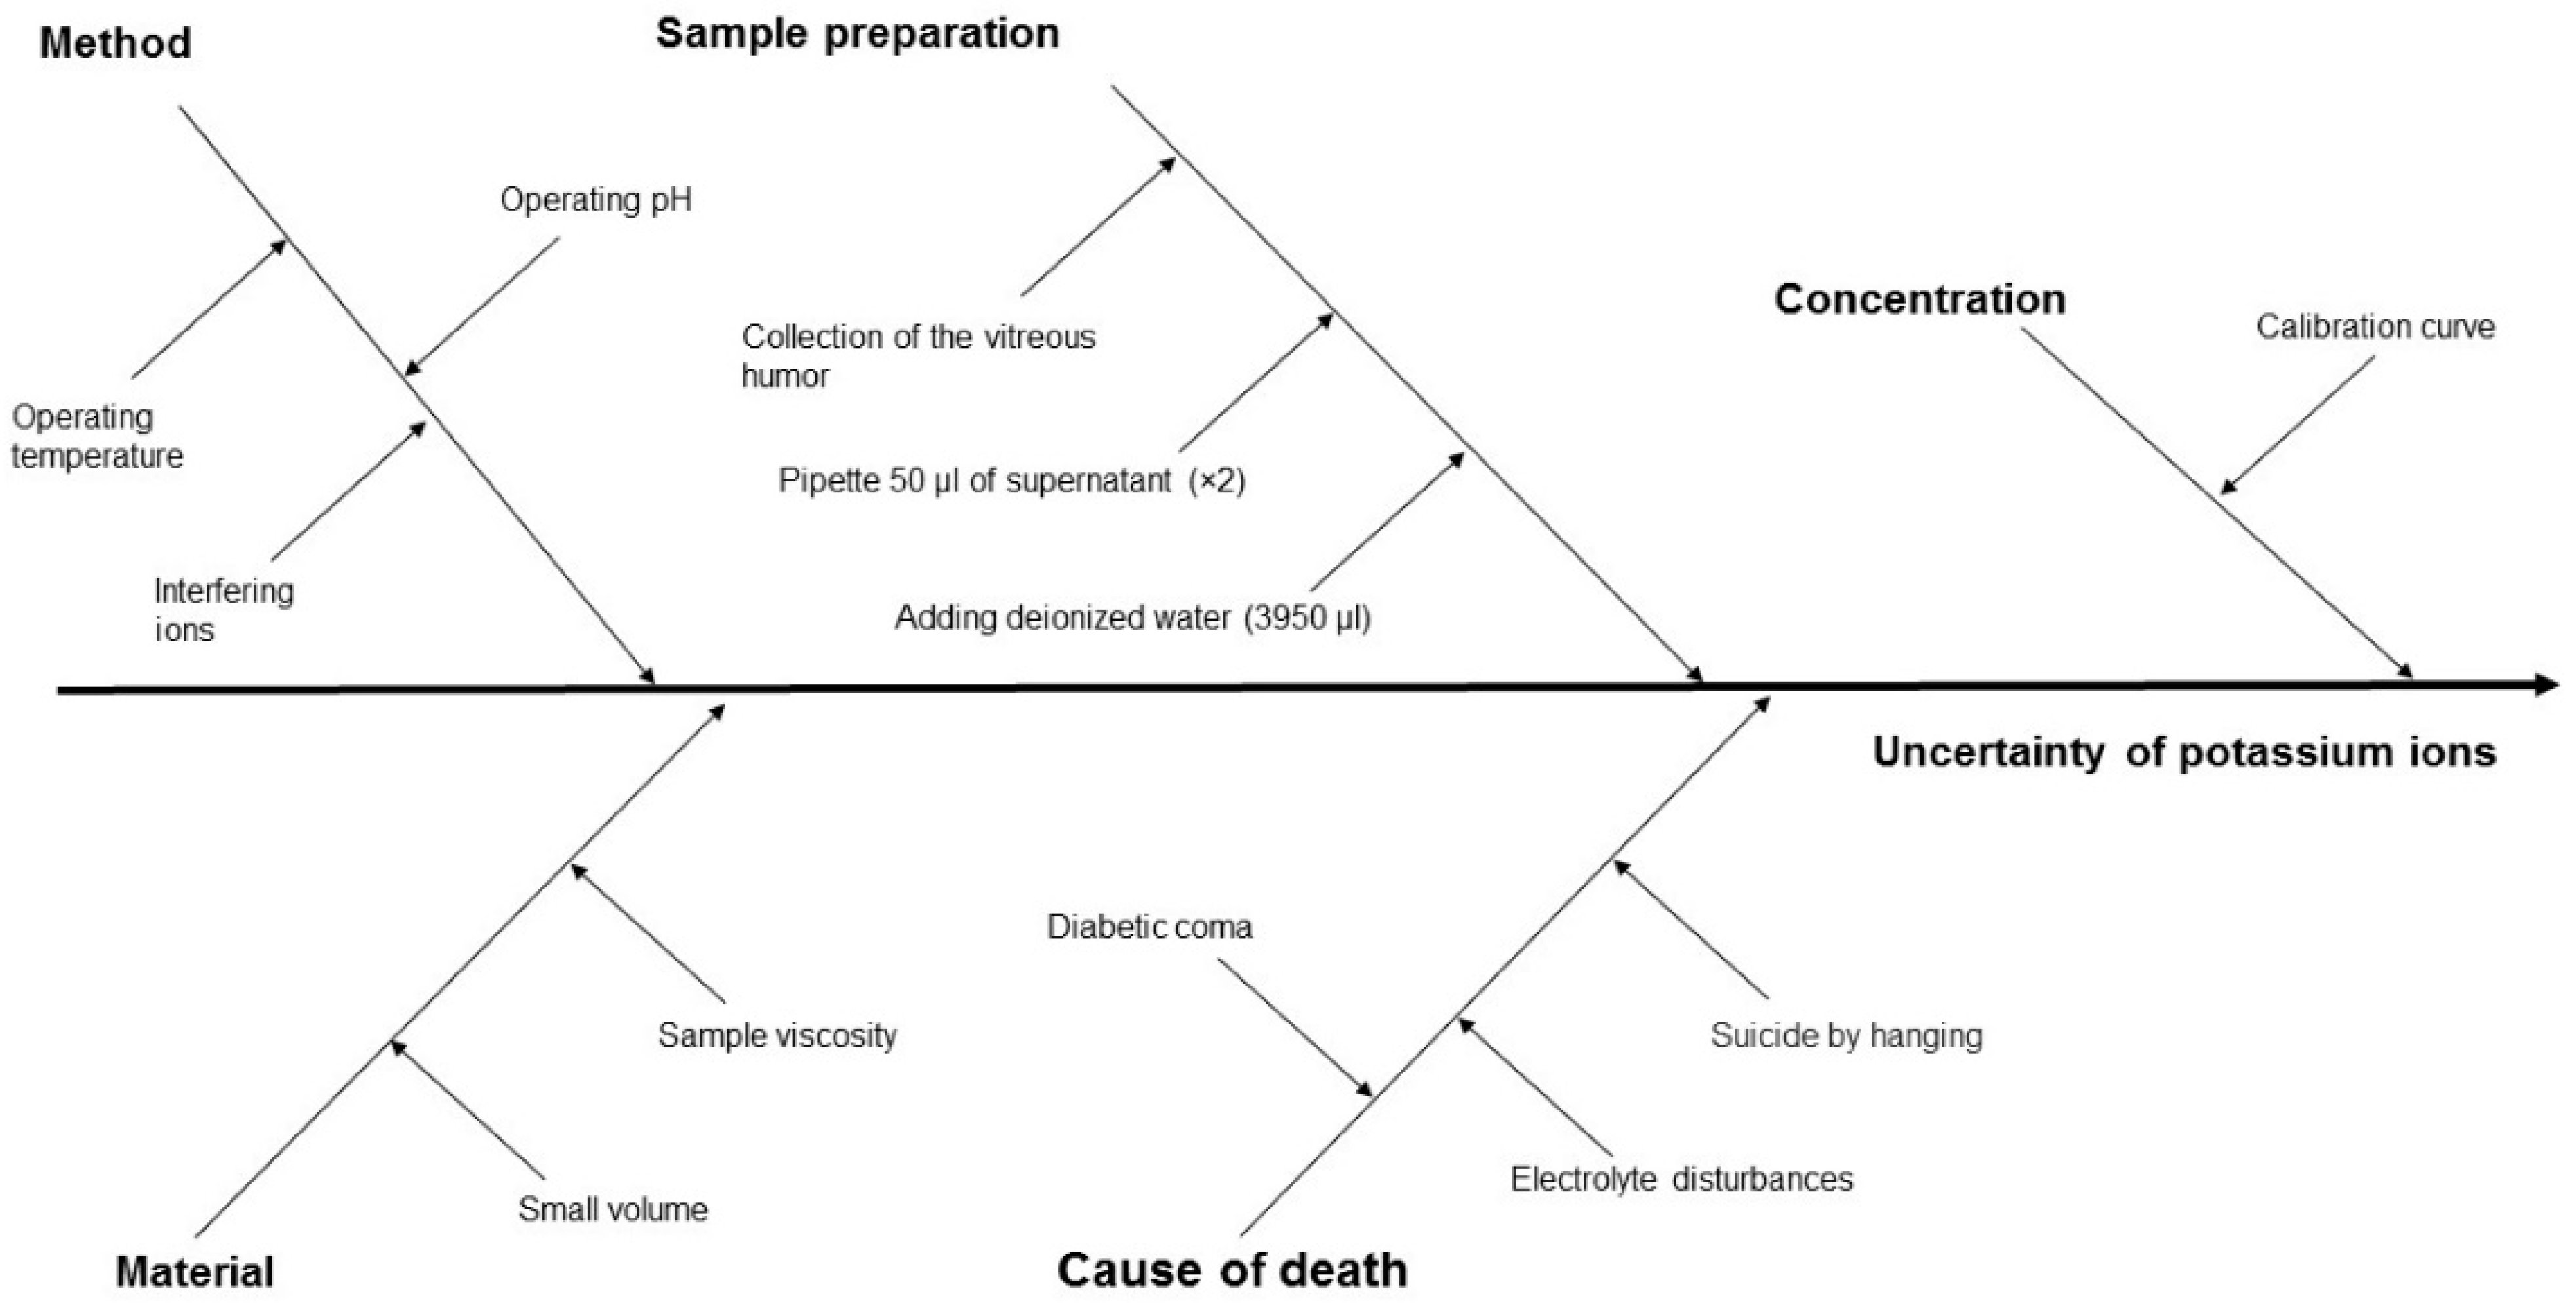
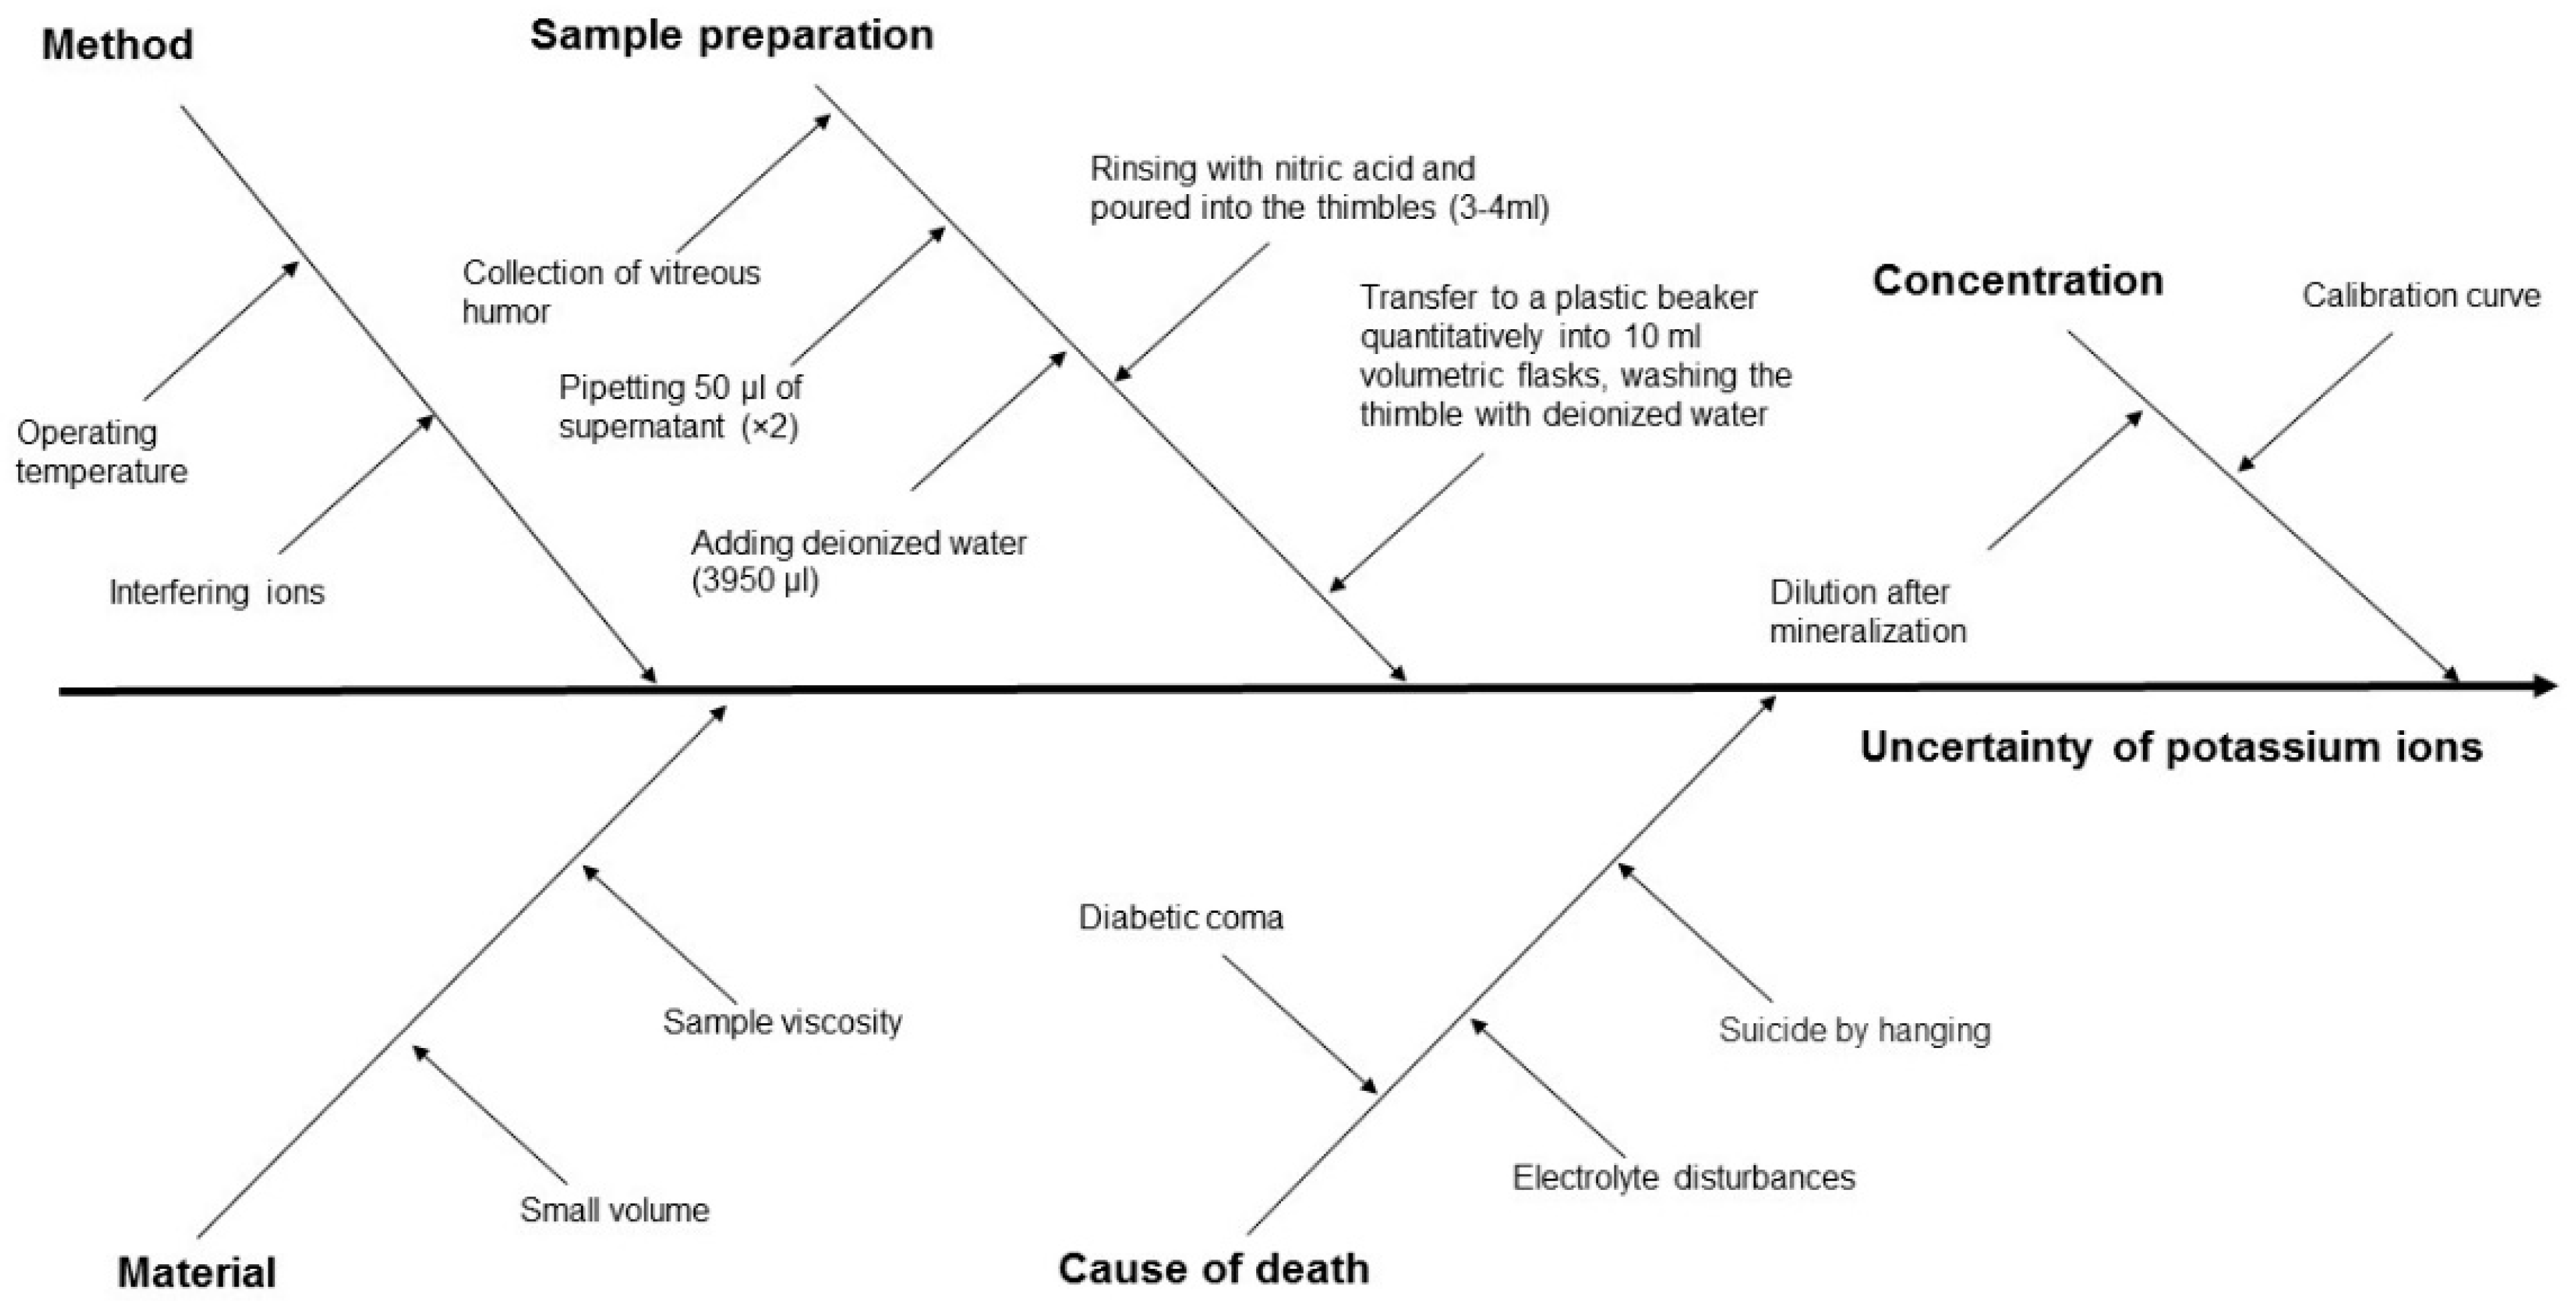
4.2. Measurement Uncertainty by ISE and MIP-OES
4.3. Causes of Death
5. Conclusions
Author Contributions
Funding
Informed Consent Statement
Data Availability Statement
Conflicts of Interest
References
- Henßge, C.; Madea, B. Estimation of the time since death in the early post-mortem period. Forensic Sci. Int. 2004, 144, 167–175. [Google Scholar] [CrossRef]
- Mathur, A.; Agrawal, Y.K. An overview of methods used for estimation of time since death. Aust. J. Forensic Sci. 2011, 43, 275–285. [Google Scholar] [CrossRef]
- Maiese, A.; Scatena, A.; Costantino, A.; Di Paolo, M.; La Russa, R.; Turillazzi, E.; Frati, P.; Fineschi, V. MicroRNAs as useful tools to estimate time since death. A systematic review of current literature. Diagnostics 2021, 11, 64. [Google Scholar] [CrossRef] [PubMed]
- Madea, B. Methods for determining time of death. Forensic Sci. Med. Pathol. 2016, 12, 451–485. [Google Scholar] [CrossRef] [PubMed]
- Markowska, J.; Szopa, M.; Zawadzki, M.; Piekoszewski, W. Ciało szkliste oka—Rutynowy czy alternatywny materiał do badań w medycynie sądowej. Arch. Med. Sadowej Kryminol. 2017, 67, 201–213. [Google Scholar] [CrossRef] [PubMed]
- Madea, B. Is there recent progress in the estimation of the postmortem interval by means of thanatochemistry? Forensic Sci. Int. 2005, 151, 139–149. [Google Scholar] [CrossRef]
- McCleskey, B.C.; Dye, D.W.; Davis, G.G. Review of postmortem interval estimation using vitreous humor: Past, present, and future. Acad. Forensic Pathol. 2016, 6, 12–18. [Google Scholar] [CrossRef]
- Adelson, L.; Sunshine, I.; Rushforth, N.B.; Mankoff, M. Vitreous potassium concentration as an indicator of the postmortem interval. J. Forensic Sci. 1963, 8, 503–514. [Google Scholar]
- Coe, J.I. Vitreous potassium as a measure of the postmortem interval: An historical review and critical evaluation. Forensic Sci. Int. 1989, 42, 201–213. [Google Scholar] [CrossRef]
- Ross, J.; Hoadley, P.; Sampson, B. Determination of postmortem interval by sampling vitreous humour. Am. J. Forensic Med. Pathol. 1997, 18, 158–162. [Google Scholar]
- Barús, J.I.M.; Suárez-Peñaranda, J.M.; Otero, X.L.; Rodríguez-Calvo, M.S.; Costas, E.; Miguéns, X.; Concheiro, L. Improved estimation of postmortem interval based on differential behaviour of vitreous potassium and hypoxantine in death by hanging. Forensic Sci. Int. 2002, 125, 67–74. [Google Scholar] [CrossRef] [PubMed]
- Zhou, B.; Zhang, L.; Zhang, G.; Zhang, X.; Jiang, X. The determination of potassium concentration in vitreous humor by low pressure ion chromatography and its application in the estimation of postmortem interval. J. Chromatogr. B Anal. Technol. Biomed. Life Sci. 2007, 852, 278–281. [Google Scholar] [CrossRef] [PubMed]
- Jashnani, K.D.; Kale, S.A.; Rupani, A.B. Vitreous humor: Biochemical constituents in estimation of postmortem interval. J. Forensic Sci. 2010, 55, 1523–1527. [Google Scholar] [CrossRef] [PubMed]
- Bortolotti, F.; Pascali, J.P.; Davis, G.G.; Smith, F.P.; Brissie, R.M.; Tagliaro, F. Study of vitreous potassium correlation with time since death in the postmortem range from 2 to 110 hours using capillary ion analysis. Med. Sci. Law 2011, 51 (Suppl. S1), 20–23. [Google Scholar] [CrossRef] [PubMed]
- Mihailovic, Z.; Atanasijevic, T.; Popovic, V.; Milosevic, M.B.; Sperhake, J.P. Estimation of the postmortem interval by analyzing potassium in the vitreous humor: Could repetitive sampling enhance accuracy? Am. J. Forensic Med. Pathol. 2012, 33, 400–403. [Google Scholar] [CrossRef]
- Siddhamsetty, A.K.; Verma, S.K.; Kohli, A.; Verma, A.; Puri, D.; Singh, A. Exploring time of death from potassium, sodium, chloride, glucose & calcium analysis of postmortem synovial fluid in semi arid climate. J. Forensic Leg. Med. 2014, 28, 11–14. [Google Scholar] [CrossRef] [PubMed]
- Bohra, B.; Verma, R.; Mathur, I.B.; Sharma, Y.; Khangwal, V.P. Estimation of postmortem interval by measuring potassium level in vitreous humor. J. Indian Acad. Forensic Med. 2014, 36, 374–378. [Google Scholar]
- Foster, S.N.; Smith, P.R.; Biggs, M.; Rutty, G.N.; Hollingbury, F.E.; Morley, S.R. Estimation of postmortem interval using vitreous potassium levels in cases of fatal road traffic collision. Arch. Med. Sadowej Kryminol. 2016, 66, 71–82. [Google Scholar] [CrossRef]
- Murthy, A.S.; Das, S.; Thazhath, H.K.; Chaudhari, V.A.; Adole, P.S. The effect of cold chamber temperature on the cadaver’s electrolyte changes in vitreous humor and plasma. J. Forensic Leg. Med. 2019, 62, 87–91. [Google Scholar] [CrossRef]
- Focardi, M.; Lanzilao, L.; Bonari, A.; Lazzeretti, M.; Lorubbio, M.; Ognibene, A.; Gualco, B.; Fanelli, A.; Pinchi, V. Improvement in estimation of time since death by albumin and potassium concentrations in vitreous humor. Forensic Sci. Int. 2020, 314, 110393. [Google Scholar] [CrossRef] [PubMed]
- Zilg, B.; Bernard, S.; Alkass, K.; Berg, S.; Druid, H. A new model for the estimation of time of death from vitreous potassium levels corrected for age and temperature. Forensic Sci. Int. 2015, 254, 158–166. [Google Scholar] [CrossRef] [Green Version]
- Rognum, T.O.; Hauge, S.; Øyasaeter, S.; Saugstad, O.D. A new biochemical method for estimation of postmortem time. Forensic Sci. Int. 1991, 51, 139–146. [Google Scholar] [CrossRef] [PubMed]
- Chandrakanth, H.V.; Kanchan, T.; Balaraj, B.M.; Virupaksha, H.S.; Chandrashekar, T.N. Postmortem vitreous chemistry—An evaluation of sodium, potassium and chloride levels in estimation of time since death (during the first 36 h after death). J. Forensic Leg. Med. 2013, 20, 211–216. [Google Scholar] [CrossRef]
- Cordeiro, C.; Ordóñez-Mayán, L.; Lendoiro, E.; Febrero-Bande, M.; Vieira, D.N.; Muñoz-Barús, J.I. A reliable method for estimating the postmortem interval from the biochemistry of the vitreous humor, temperature and body weight. Forensic Sci. Int. 2019, 295, 157–168. [Google Scholar] [CrossRef] [PubMed]
- Hansson, L.; Uotila, U.; Lindfors, R. Potassium content of the vitreous body as an aid in determining the time of death. J. Forensic Sci. 1966, 11, 390–394. [Google Scholar]
- Moriya, F.; Hashimoto, Y. Endogenous γ-hydroxybutyric acid levels in postmortem blood. Leg. Med. 2004, 6, 47–51. [Google Scholar] [CrossRef] [PubMed]
- Yang, M.; Li, H.; Yang, T.; Ding, Z.; Wu, S.; Qiu, X.; Liu, Q. A study on the estimation of postmortem interval based on environmental temperature and concentrations of substance in vitreous humor. J. Forensic Sci. 2018, 63, 745–751. [Google Scholar] [CrossRef]
- Stephen, R.J. Vitreous humor chemistry. The use of potassium concentration for the prediction of postmortem interval. J. Forensic Sci. 1987, 32, 503–509. [Google Scholar] [CrossRef]
- Eppendorf.com. Eppendorf Research Instruction Manual. 2016. Available online: http://www.sun-way.com.tw/Files/DownloadFile/Researchplus.pdf (accessed on 28 February 2016).
- Hanna Instruments. Instruction Manual Potassium Ion Selective Electrode HI 4114, MAN4114 07/06 REV3. 2007. Available online: https://www.hannainst.com/hi4114-potassium-combination-ion-selective-electrode.html (accessed on 23 November 2022).
- Kitabchi, A.E. Hyperglycemic crises in diabetes. Diabetes Care 2004, 27 (Suppl. S1), s94–s102. [Google Scholar] [CrossRef] [Green Version]


| No. | Author(s) and Year | Formula Proposed |
|---|---|---|
| 1 | Adelson et al. (1963) [8] | PMI = 5.88 [K+] − 31.53 |
| 2 | Coe (1969) [9] | PMI = 6.15 [K+] − 38.10 |
| 3 | Henßge and Madea (1989) [1] | PMI = 5.26 [K+] − 30.90 |
| 4 | Ross et al. (1997) [10] | PMI = 4.32 [K+] − 18.35 |
| 5 | Muñoz Barús et al. (2002) [11] | PMI = 3.63 [K+] − 17.33 |
| 6 | Zhou et al. (2007) [12] | PMI = 5.88 [K+] − 32.71 |
| 7 | Jashnani et al. (2010) [13] | PMI = 1.08 [K+] − 2.82 |
| 8 | Bortolotti et al. (2011) [14] | PMI = 5.77 [K+] − 13.28 |
| 9 | Mihailovic et al. (2012) [15] | PMI = 2.75 [K+] − 11.98 |
| 10 | Siddhamsetty et al. (2014) [16] | PMI = 4.75 [K+] − 27.9 |
| 11 | Bohra et al. (2014) [17] | PMI = 3.75 [K+] − 16.22 |
| 12 | Foster et al. (2016) [18] | PMI = 6.42 [K+] − 40.94 |
| 13 | Murthy et al. (2019) [19] | PMI = 5.26 [K+] − 30.9 |
| 14 | Focardi et al. (2020) [20] | PMI = 6.16 [K+] − 32.49 |
| No. | Volume [mL] | Sample Preparation | Instrumental Analysis (Commercial Name of Instrument) | Ref. |
|---|---|---|---|---|
| 1 | 0.10 | Samples were stored at −20 °C and centrifuged at 16,000 rpm for 10 min; only the supernatant was decanted | Photometric, potentiometric, turbidimetric (ARCHITECT 8000) | [7] |
| 2 | 0.10 | Samples were stored at −20 °C and diluted at 1:20 with a 40-mg/mL aqueous solution of barium chloride (internal standard) | Capillary electropherogram with a UV absorbance detector (A PACE MDQ; capillary column: 75 mm ID × 50 cm, 60 cm) | [17] |
| 3 | n/a | Samples were centrifuged | Ion-selective electrode (ADVIA 2400 Chemistry System) | [9] |
| 4 | 0.20 | Samples were not pre-treated (without dilution, centrifugation, or sonication) | Ion-selective electrode (ABL 625 radiometer with UniCel DxC 800) | [21] |
| 5 | 1.50–2.00 | Blood was collected in test tubes with EDTA, the VH was placed in sterile plain vials, and samples were centrifuged at 3500 rpm for 10 min | Ion-selective electrode (Analyser AU680) | [11] |
| 6 | 0.10 | Samples were stored at −70 °C | Turbidimetric (Humalyzer Junior) | [22] |
| 7 | 2.00 | Samples were centrifuged at 4500 rpm and the supernatant was transferred to another container | Ion-selective electrode, flow-through, liquid membrane electrode (Roche 9180 Electrolyte Analyzer) | [23] |
| 8 | 0.15 | n/a | Indirect potentiometry (Advia 2400). | [24] |
| 9 | 3.00–4.00 | Samples were stored at 4 °C and centrifuged at 2000 rpm for 5 min | Flame photometry (FLM3, Biolyte 2000) | [25] |
| 10 | 1.50–2.00 | Samples were centrifuged at 3500 rpm for 10 min | Ion-selective electrode (indirect potentiometry method) | [26] |
| 11 | n/a | Samples were stored at 4 °C and centrifuged at 3000 rpm for 10 min | Indirect potentiometry (BM/747) | [27] |
| 12 | n/a | Samples were centrifuged at 13,000× g for 10 min, supernatant solutions were stored at −80 °C and vortexed for 10 s, and viscous VH samples were diluted with deionized water | Photometric, potentiometric, turbidimetric (ARCHITECT c16000) | [15] |
| 13 | 2.00 | Samples were stored at −18 °C and −70 °C and centrifuged at 3000 rpm for 10 min | Ion-selective electrode (Beckman auto-analyzer) | [28] |
| 14 | 2.00 | Samples were stored at −80 °C, vortexed for 30 s using the highest level, and centrifuged at 1650× g for 8 min; the supernatant was divided into four aliquots | Potentiometric method (VLYTE1 Integrated Multisensor K800A) | [20] |
| No | Sex 1 | Age (y) | Circumstances, Mode, and Possible Cause of Death | Concentration of Ethanol (‰) | Estimated Time of Death | Time of Autopsy | PMI (h) |
|---|---|---|---|---|---|---|---|
| 1 | M | 40 | Acute circulatory and respiratory failure, cirrhosis, ethanol poisoning | 0.92 (blood), 1.13 (VH) | 6 June 2020 19:47 | 8 June 2020 12:00 | 40 |
| 2 | M | 39 | Acute circulatory and respiratory failure, asphyxiation (by hanging), ethanol poisoning | 3.18 (blood), 3.77 (urine) | 19 July 2020 21:20 | 21 July 2020 09:00 | 36 |
| 3 | M | 50 | Acute cardiorespiratory failure, urosepsis, acute bacterial interstitial nephritis | Negative 2 | 26 July 2020 05:35 | 30 July 2020 08:00 | 98 |
| 4 | M | 32 | Acute circulatory and respiratory failure, asphyxiation (by hanging), ethanol poisoning | 0.69 (blood) 0.22 (urine) | 26 July 2020 22:30 | 28 July 2020 09:30 | 35 |
| 5 | F | 58 | Acute circulatory and respiratory failure, acid–base disorders, ethanol addiction, cachexia | Negative | 3 August 2020 13:59 | 7 August 2020 12:00 | 94 |
| 6 | M | 63 | Acute circulatory and respiratory failure, asphyxiation (blood aspiration), oral cancer | Negative | 6 August 2020 18:45 | 10 August 2020 10:30 | 88 |
| 7 | M | 57 | Acute circulatory and respiratory failure, bleeding from esophageal varices, cirrhosis, ethanol addiction, ethanol poisoning | 1.01 (blood) | 24 August 2020 11:00 | 27 August 2020 10:00 | 71 |
| 8 | M | 41 | Acute circulatory and respiratory failure, alcohol-induced liver damage, hygiene negligence | Negative | 6 September 2020 14:50 | 10 September 2020 09:45 | 91 |
| 9 | M | 54 | Acute circulatory failure, hypertrophic and dilated cardiomyopathy, condition after aortic valve implantation, obesity | Negative | 14 September 2020 14:20 | 16 September 2020 10:30 | 44 |
| 10 | M | 42 | Acute heart failure, hypertrophic cardiomyopathy, arrhythmia | Negative | 14 September 2020 11:00 | 16 September 2020 09:15 | 46 |
| 11 | M | 55 | Acute circulatory and respiratory failure, disturbances in acid–base and water–electrolyte balance, suspected alcohol ketoacidosis, ethanol addiction | Negative | 15 September 2020 01:10 | 17 September 2020 09:00 | 56 |
| 12 | M | 37 | Acute circulatory and respiratory failure, bleeding from the duodenum ulcer, alcohol-induced liver damage | Negative | 16 September 2020 22:20 | 21 September 2020 09:00 | 107 |
| 13 | M | 46 | Acute circulatory and respiratory failure, myocardial infarction, pulmonary edema, chronic coronary artery disease, ethanol poisoning | 2.82 (blood) 4.15 (urine) | 20 September 2020 05:50 | 24 September 2020 08:30 | 99 |
| 14 | M | 56 | Acute circulatory and respiratory failure, asphyxiation (by hanging) | Negative | 19 September 2020 20:40 | 23 September 20 08:30 | 84 |
| 15 | M | 63 | Acute circulatory failure, hypertrophic and dilated cardiomyopathy, generalized atherosclerosis | Negative | 4 October 2020 12:10 | 7 October 2020 09:30 | 69 |
| 16 | M | 49 | Acute circulatory failure, chronic coronary artery disease, arrhythmia | Negative | 5 October 2020 15:00 | 8 October 2020 10:30 | 68 |
| 17 | M | 33 | Acute circulatory and respiratory failure, asphyxiation (by hanging), ethanol poisoning | 1.73 (blood), 2.85 (urine) | 17 October 2020 14:40 | 20 October 2020 10:30 | 68 |
| 18 | M | 57 | Acute circulatory and respiratory failure, cirrhosis, ascites, chronic pancreatitis, COPD (chronic obstructive pulmonary disease), ethanol addiction | Negative | 25 October 2020 18:00 | 27 October 2020 10:00 | 40 |
| 19 | F | 61 | Acute circulatory and respiratory failure, myocardial infarction | Negative | 13 December 2020 00:00 | 17 December 2020 08:30 | 104 |
| 20 | M | 59 | Acute circulatory and respiratory failure, ethanol poisoning | 4.18 (blood), 3.96 (urine) | 11 April 2021 14:30 | 14 April 2021 09:00 | 67 |
| 21 | F | 50 | Acute circulatory and respiratory failure, venous hemorrhage, ethanol poisoning | 2.62 (blood), 2.57 (urine) | 21 April 2021 15:05 | 23 April 2021 09:00 | 42 |
| 22 | F | 99 | Acute circulatory and respiratory failure, death from natural causes | Negative | 10 October 2021 11:55 | 14 October 2021 08:15 | 92 |
| 23 | M | 67 | Acute circulatory and respiratory failure, arrhythmia, vascular cardiomyopathy | Negative | 31 October 2021 14:15 | 3 November 2021 11:00 | 69 |
| 24 | M | 34 | Acute circulatory and respiratory failure | Negative | 1 November 2021 12:20 | 4 November 2021 10:00 | 70 |
| 25 | M | 42 | Acute cardiorespiratory failure, ethanol poisoning, liver damage, pancreatic damage, ethanol addiction | 3.55 (blood) 3.48 (urine) | 4 November 2021 11:30 | 9 November 2021 08:15 | 117 |
| 26 | M | 45 | Acute circulatory and respiratory failure, asphyxiation (by hanging), ethanol poisoning | 0.33 (blood) 0.56 (urine) | 7 November 2021 12:30 | 10 November 2021 08:15 | 68 |
| Step | ISE | MIP-OES |
|---|---|---|
| 1 | Take a sample of VH during medicolegal autopsy (1–2 mL) using a metal, pointed (35 × 2 mm) injection needle. | |
| 2 | Centrifuge VH at 3500 rpm for 10 min. | |
| 3 | Pipette 50 μL of the supernatant twice in two 5 mL Eppendorf tubes. | |
| 4 | Fill Eppendorf tubes to 4 mL (i.e., 3950 µL) with deionized water. | |
| 5 | Mix on a vortex shaker for 15 s. | |
| 6 | Pour the contents into an intermediate vial (5 mL). | |
| 7 | Add 80 µL of ionic strength adjuster (ISA) solution (NaCl solution) and mix. | Quantitatively pour the entire beaker into the mineralizer tube. |
| 8 | Rinse the ion-selective electrode membrane with deionized water and dry it. | Rinse the test tube with nitric acid (3–4 mL) and pour it into the mineralizer. |
| 9 | Place the electrode in the beaker and wait for the measurement to stabilize for 1 min. | Perform microwave-assisted mineralization for 40 min at 180 °C. |
| 10 | Write down and save the result. | After mineralization and reaching the room temperature of the solution, pour the mineralization tube contents quantitatively into 10 mL measuring flasks and then wash the tube with deionized water. |
| 11 | After the measurements, place the ISE in a solution with a concentration of 100 mg/L of K+. | Pour the contents of the beaker into a 15 mL plastic test tube and provide MIP-OES measurements. |
| 12 | After analysis, store VH samples at −20 °C. | After analysis, store VH samples at −20 °C. |
| Concentration of K+ | Standard Deviation (SD) of ISE (mg/L) | Standard Deviation (SD) of MIP-OES (mg/L) | Expanded Uncertainty (UA) 1 by ISE (%) | Expanded Uncertainty (UA) by MIP-OES (%) |
|---|---|---|---|---|
| Low (2 mg/L) | ±0.12 | ±0.012 | ±12.2 | ±1.2 |
| Medium (10 mg/L) | ±0.30 | ±0.111 | ±6.1 | ±2.2 |
| High (25 mg/L) | ±0.39 | ±0.308 | ±3.1 | ±2.5 |
| Procedure Stage and Comments | Volume (V) | Precision (P) | Accuracy (A) |
|---|---|---|---|
| Pipette 50 µL twice into Eppendorf tubes; variable-capacity pipette 10–100 µL, precision and accuracy for 50 µL | 0.05 mL | ±0.7% | <0.3% |
| Fill an Eppendorf tube to 4 mL (i.e., 3950 µL) with deionized water; variable-capacity pipette 500–5000 µL, precision and accuracy for 2500 µL | 3.95 mL | ±0.6% | <0.15% |
| Add 80 µL of ISA solution (NaCl solution) and mix; variable-capacity pipette 10–100 µL, precision and accuracy for 50 µL | 0.08 mL | ±0.8% | <0.2% |
| Influence of temperature fluctuations on ISE measurement | n/a | n/a | <2% |
| Procedure Stage and Comments | Volume (V) | Precision (P) | Accuracy (A) |
|---|---|---|---|
| Pipette 50 µL twice into Eppendorf tubes; variable-capacity pipette 10–100 µL, precision and accuracy for 50 µL | 0.05 mL | ±0.7% | <0.3% |
| Fill an Eppendorf tube to 4 mL (i.e., 3950 µL) with deionized water; variable-capacity pipette 500–5000 µL, precision and accuracy for 2500 µL | 3.95 mL | ±0.6% | <0.15% |
| After mineralization and reaching the room temperature of the solution, pour the thimble contents quantitatively into 10 mL volumetric flasks and then wash the thimble with deionized water. | 10 mL | ±0.08 mL | n/a |
| Concentration of K+ | UB for ISE (mg/L) | UB for MIP-OES (mg/L) | Expanded Uncertainty (UB) 1 by ISE (%) | Expanded Uncertainty (UB) by MIP-OES (%) |
|---|---|---|---|---|
| Low (2 mg/L) | ±0.24 | ±0.051 | ±4.75 | ±2.53 |
| Medium (10 mg/L) | ±0.48 | ±0.253 | ±4.75 | ±2.53 |
| High (25 mg/L) | ±1.19 | ±0.633 | ±4.75 | ±2.53 |
| No. | Concentration of K+ by ISE (mmol/L) | Concentration of K+ by MIP-OES (mmol/L) | PMI (h) |
|---|---|---|---|
| 1 | 17.0 | 15.1 | 40 |
| 2 | 22.4 | 44.2 | 36 |
| 3 | 19.2 | 31.4 | 98 |
| 4 | 19.9 | 19.7 | 23 |
| 5 | 18.6 | 21.9 | 82 |
| 6 | 18.7 | 24.4 | 88 |
| 7 | 10.5 | 16.9 | 71 |
| 8 | 30.8 | 27.7 | 91 |
| 9 | 21.3 | 35.6 | 44 |
| 10 | 7.59 | 27.0 | 46 |
| 11 | 10.4 | 16.8 | 72 |
| 12 | 24.2 | 21.0 | 107 |
| 13 | 23.8 | 22.0 | 99 |
| 14 | 16.6 | 23.0 | 84 |
| 15 | 23.5 | 29.4 | 70 |
| 16 | 12.2 | 12.7 | 57 |
| 17 | 11.0 | 21.9 | 68 |
| 18 | 7.91 | 7.42 | 40 |
| 19 | 37.1 | 39.0 | 104 |
| 20 | 15.8 | 23.3 | 67 |
| 21 | 16.6 | 25.5 | 42 |
| 22 | 16.0 | 24.8 | 93 |
| 23 | 23.3 | 21.7 | 69 |
| 24 | 28.2 | 25.7 | 70 |
| 25 | 18.7 | 18.3 | 117 |
| 26 | 25.6 | 29.4 | 81 |
| Concentration of K+ | Expanded Uncertainty (%) | |||
|---|---|---|---|---|
| ISE | MIP-OES | |||
| UA | UB | UA | UB | |
| Low (2 mg/L) | ±12.2 | ±4.75 | ±1.2 | ±2.53 |
| Medium (10 mg/L) | ±6.1 | ±4.75 | ±2.2 | ±2.53 |
| High (25 mg/L) | ±3.1 | ±4.75 | ±2.5 | ±2.53 |
| Method | Advantages | Disadvantages |
|---|---|---|
| ISE |
|
|
| MIP-OES |
|
|
Disclaimer/Publisher’s Note: The statements, opinions and data contained in all publications are solely those of the individual author(s) and contributor(s) and not of MDPI and/or the editor(s). MDPI and/or the editor(s) disclaim responsibility for any injury to people or property resulting from any ideas, methods, instructions or products referred to in the content. |
© 2023 by the authors. Licensee MDPI, Basel, Switzerland. This article is an open access article distributed under the terms and conditions of the Creative Commons Attribution (CC BY) license (https://creativecommons.org/licenses/by/4.0/).
Share and Cite
Zięba, S.; Wiergowski, M.; Cieślik, B.M.; Anand, J.S.; Krzyżanowska, M. Uncertainty of Postmortem Time Estimation Based on Potassium Ion Determination in Vitreous Humor Using Potentiometric Ion-Selective Electrode and Microwave-Induced Plasma with Optical Emission Spectrometry Methods. Separations 2023, 10, 201. https://doi.org/10.3390/separations10030201
Zięba S, Wiergowski M, Cieślik BM, Anand JS, Krzyżanowska M. Uncertainty of Postmortem Time Estimation Based on Potassium Ion Determination in Vitreous Humor Using Potentiometric Ion-Selective Electrode and Microwave-Induced Plasma with Optical Emission Spectrometry Methods. Separations. 2023; 10(3):201. https://doi.org/10.3390/separations10030201
Chicago/Turabian StyleZięba, Sonia, Marek Wiergowski, Bartłomiej Michał Cieślik, Jacek Sein Anand, and Marta Krzyżanowska. 2023. "Uncertainty of Postmortem Time Estimation Based on Potassium Ion Determination in Vitreous Humor Using Potentiometric Ion-Selective Electrode and Microwave-Induced Plasma with Optical Emission Spectrometry Methods" Separations 10, no. 3: 201. https://doi.org/10.3390/separations10030201